Article

X-ray Tomography Characterisation of Lattice Structures Processed by Selective Electron Beam Melting

1
Department of Material Science & Engineering, The University of Sheffield, Sir Robert Hadfield Building, Mappin St, S13 JD Sheffield, UK
2
Bundesanstalt für Material Forschung und Eprüfung (BAM), Unter den Eichen 87, 12205 Berlin, Germany
3
Henry Moseley X-ray Imaging Facility, School of Materials, The University of Manchester, M13 9PL Manchester, UK
*
Author to whom correspondence should be addressed.
Metals 2017, 7(8), 300; https://doi.org/10.3390/met7080300
Submission received: 13 June 2017 / Revised: 25 July 2017 / Accepted: 28 July 2017 / Published: 5 August 2017

Abstract

:
Metallic lattice structures intentionally contain open porosity; however, they can also contain unwanted closed porosity within the structural members. The entrained porosity and defects within three different geometries of Ti-6Al-4V lattices, fabricated by Selective Electron Beam Melting (SEBM), is assessed from X-ray computed tomography (CT) scans. The results suggest that horizontal struts that are built upon loose powder show particularly high (~20 × 10−3 vol %) levels of pores, as do nodes at which many (in our case 24) struts meet. On the other hand, for struts more closely aligned (0° to 54°) to the build direction, the fraction of porosity appears to be much lower (~0.17 × 10⁻³%) arising mainly from pores contained within the original atomised powder particles.

1. Introduction

Additive manufacturing (AM), which proceeds by sequential micro-additions of material following a computer aided design (CAD), allows the fabrication of complex geometries, such as intricate cellular solids, as previously reported [1]. Selective Electron Beam Melting (SEBM) is one AM route that is becoming increasingly popular. This method may be employed to process light-weight structures [2], bio-compatible materials [3] and heat transfer media [4], among other things. There are advantages to all of these applications from the production of porous lattices, and, as this additive process uses an electron beam capable of being deflected magnetically, (unlike other beams such as lasers, which are driven by mirrors) the manufacture of these structures can be carried out relatively quickly by SEBM. Additionally, the ability to defocus the electron beam allows preheat strategies that thermally homogenise the powder bed. This reduces the fraction of defects introduced by steep thermal gradients, which can, for example, generate residual stresses [5]. However, parts are far from being defect free, as internal porosity (i.e., unwanted porosity within the solid trusses of material) is present, among other defects. A significant fraction of these internal pores is considered to arise from gas entrapped in the atomised powder particle feedstock [6]. Such pores are mobile in the melt pool created when powders are molten, and are then re-arranged onto patterns in the resulting solid that appear to correlate to the beam path [7]. The retention of porosity allowing such formations is reportedly due to the liquid metal forces that restrict the escape of gas bubbles. This is not the only source of porosity however; for example, non-optimum beam energy densities can also generate defects due to lack of fusion [6]. Contrary to defects originating from trapped gas in the feedstock, these tend to be larger than the particle size and have an irregular shape, and traces of poor adhesion of new particles can sometimes be seen. Although this type of internal discontinuity can originate from several factors, all can be related to non-optimal melting heat or unfavourable thermal variations. Traditionally, the SEBM process involves preheating stages (termed preheat I and II), so that when the melting step takes place, the powder particles should display a gradual liquid-solid transformation so that they are easily incorporated into the solid body, minimising lack-of-fusion defects. In practice, however, this is not usually the case, as factors affecting the adhesion of particles may appear (for example wetting and oxidation effects [8]) resulting in the formation of pores and tunnels [9,10].
In complex structures such as lattices, it can be expected that local variations in thermal conditions may cause a significant fraction of defects, especially in thin sections, causing poor mechanical performance. Such intricate geometries challenge the AM process to deposit the material over previously deposited (vertical trusses) and unsupported areas (angled or horizontal trusses), often on multiple occasions within a few layers. With a fast heat source and areas with relatively low thermal mass, there is a high risk of generating defects during the AM process. Identification of areas containing entrained pores can be difficult. X-ray computed micro-tomography (CT) is one of the few techniques able to identify internal features within solid materials over a wide range of compositions. For AM, it has become an important 3D complement to 2D cross-sectional metallography in identifying pore volumes much lower than the particle feedstock [11].
With few AM studies reported in the literature and no reports of porosity entrained within lattice structures, this paper investigates the defects generated by the SEBM process for 3 lattice structures of different geometries. With a constant deposition strategy and a gas atomized raw powder material, the total porosity fraction from these combined inputs is reported. This is the first stage of understanding the processes responsible for pore formation, and further investigation on preheating strategies may be needed in order to eliminate them, or at least reduce their occurrence.

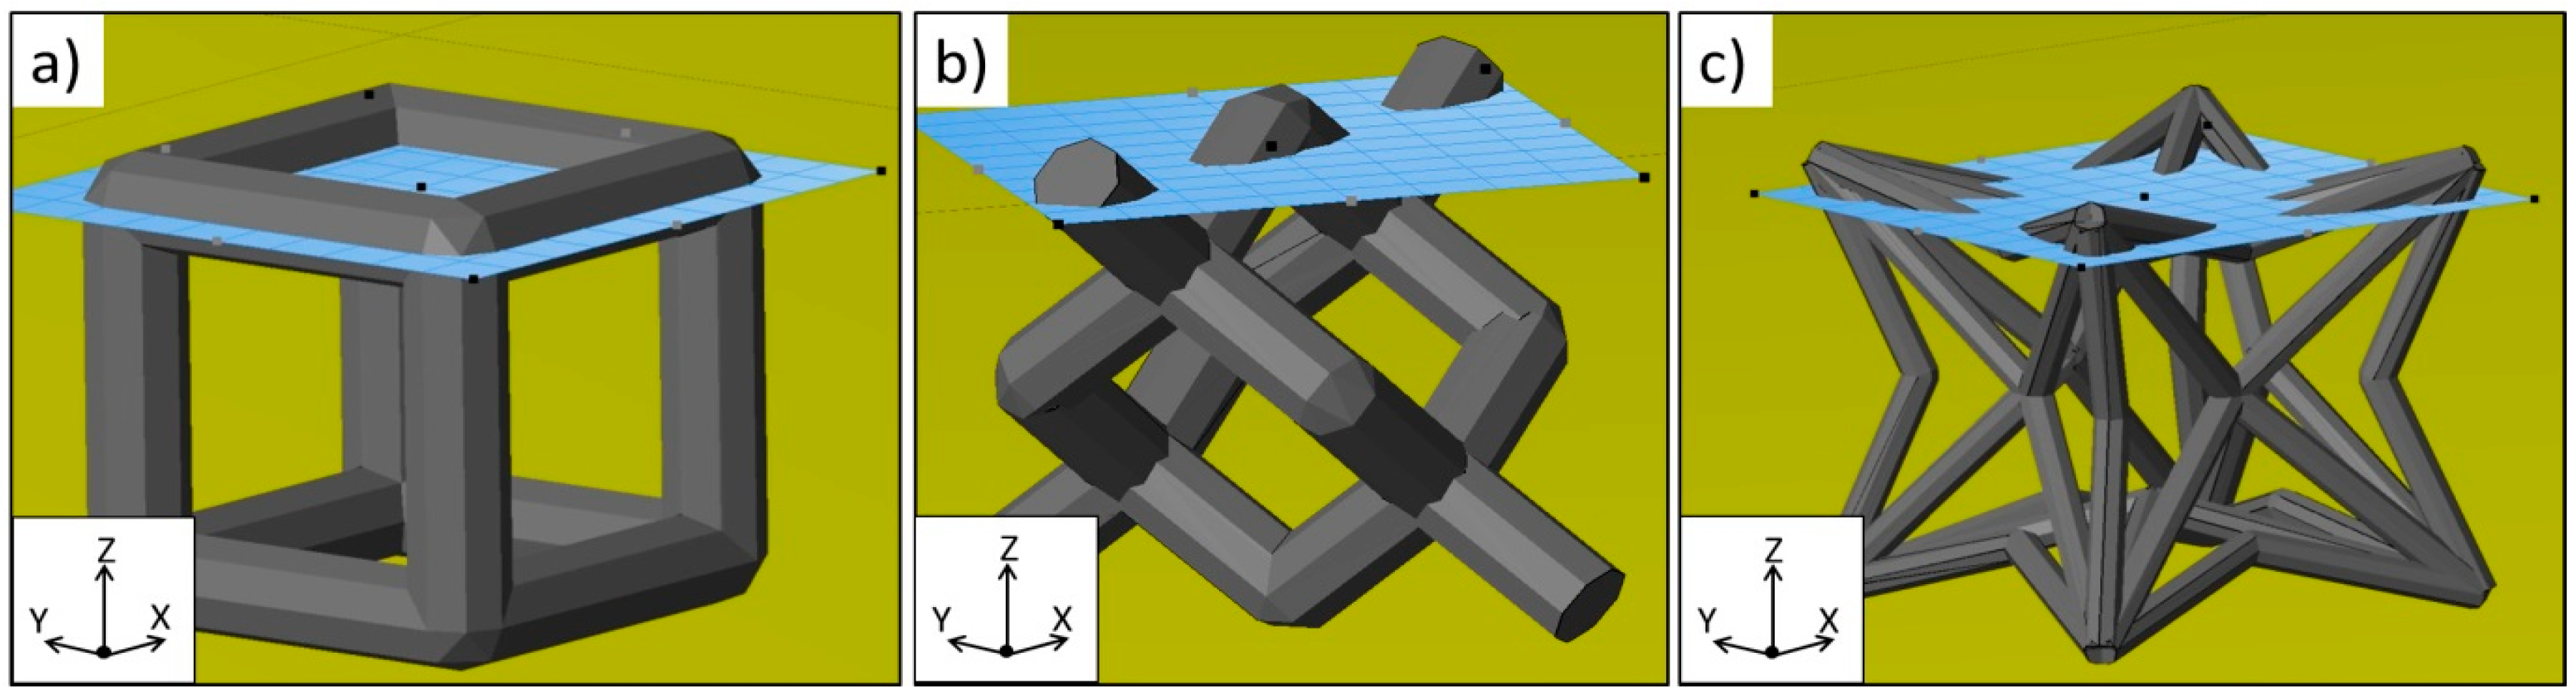
2. Materials and Methods
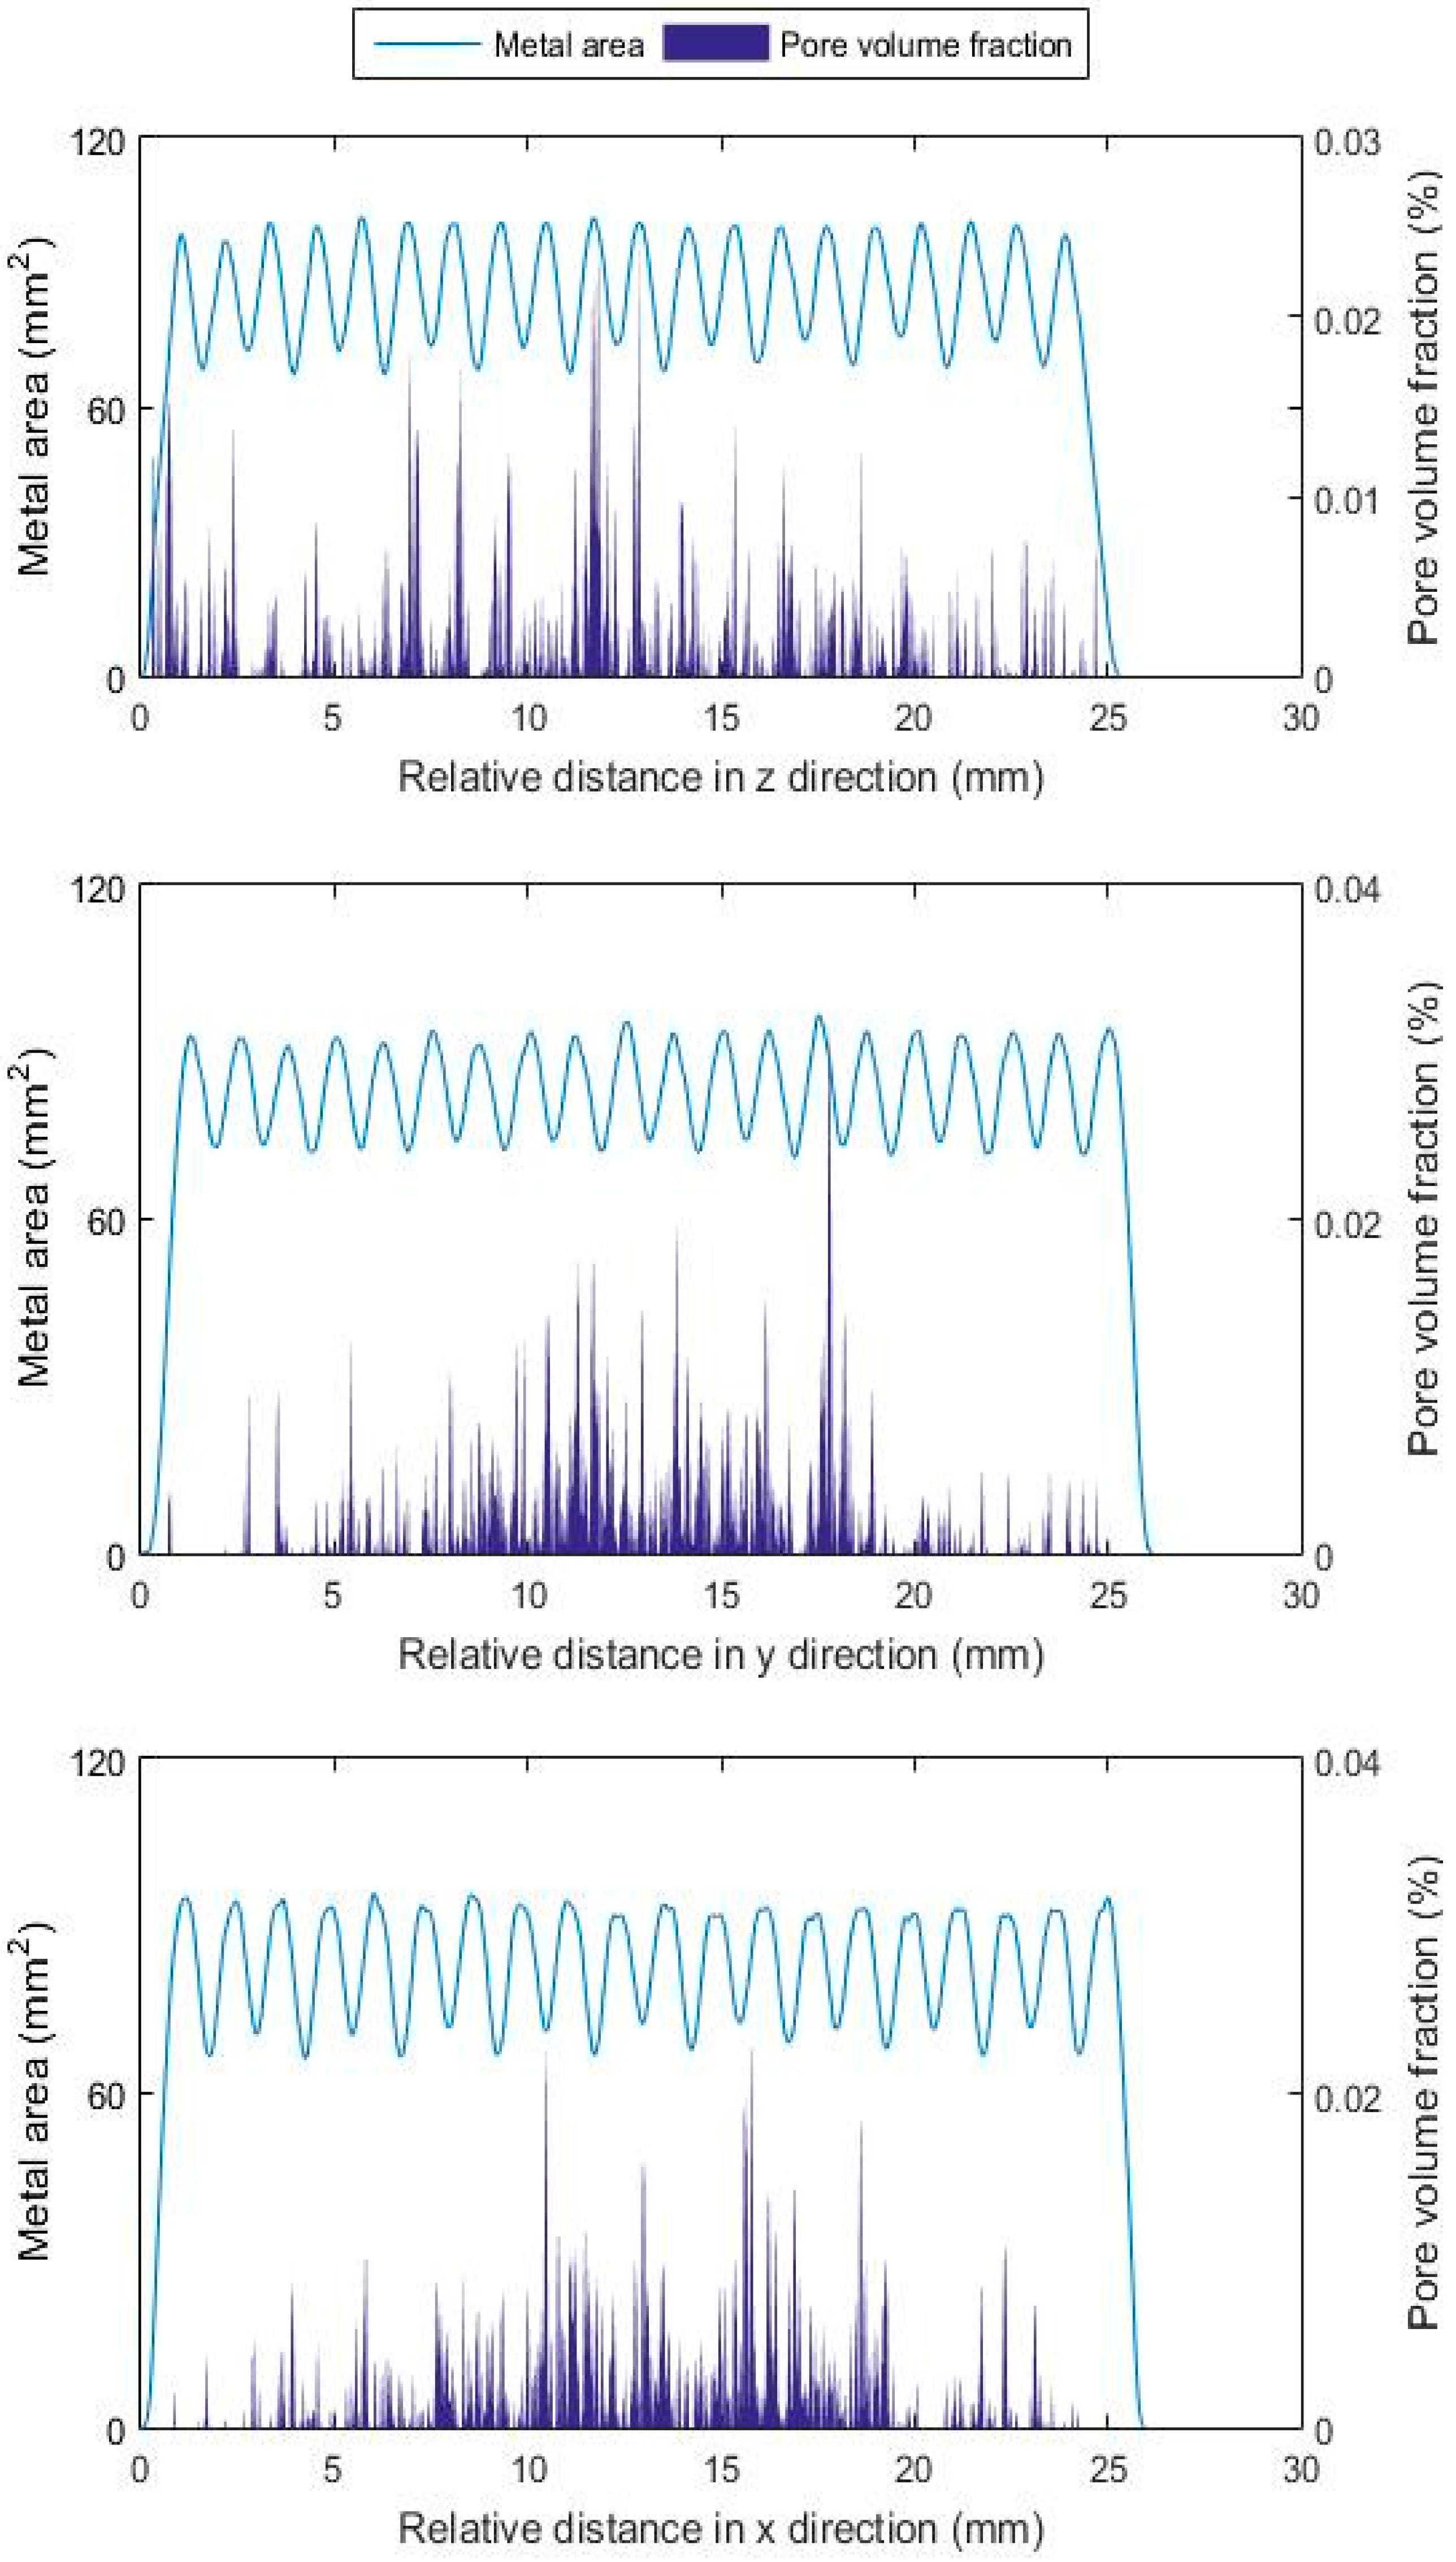
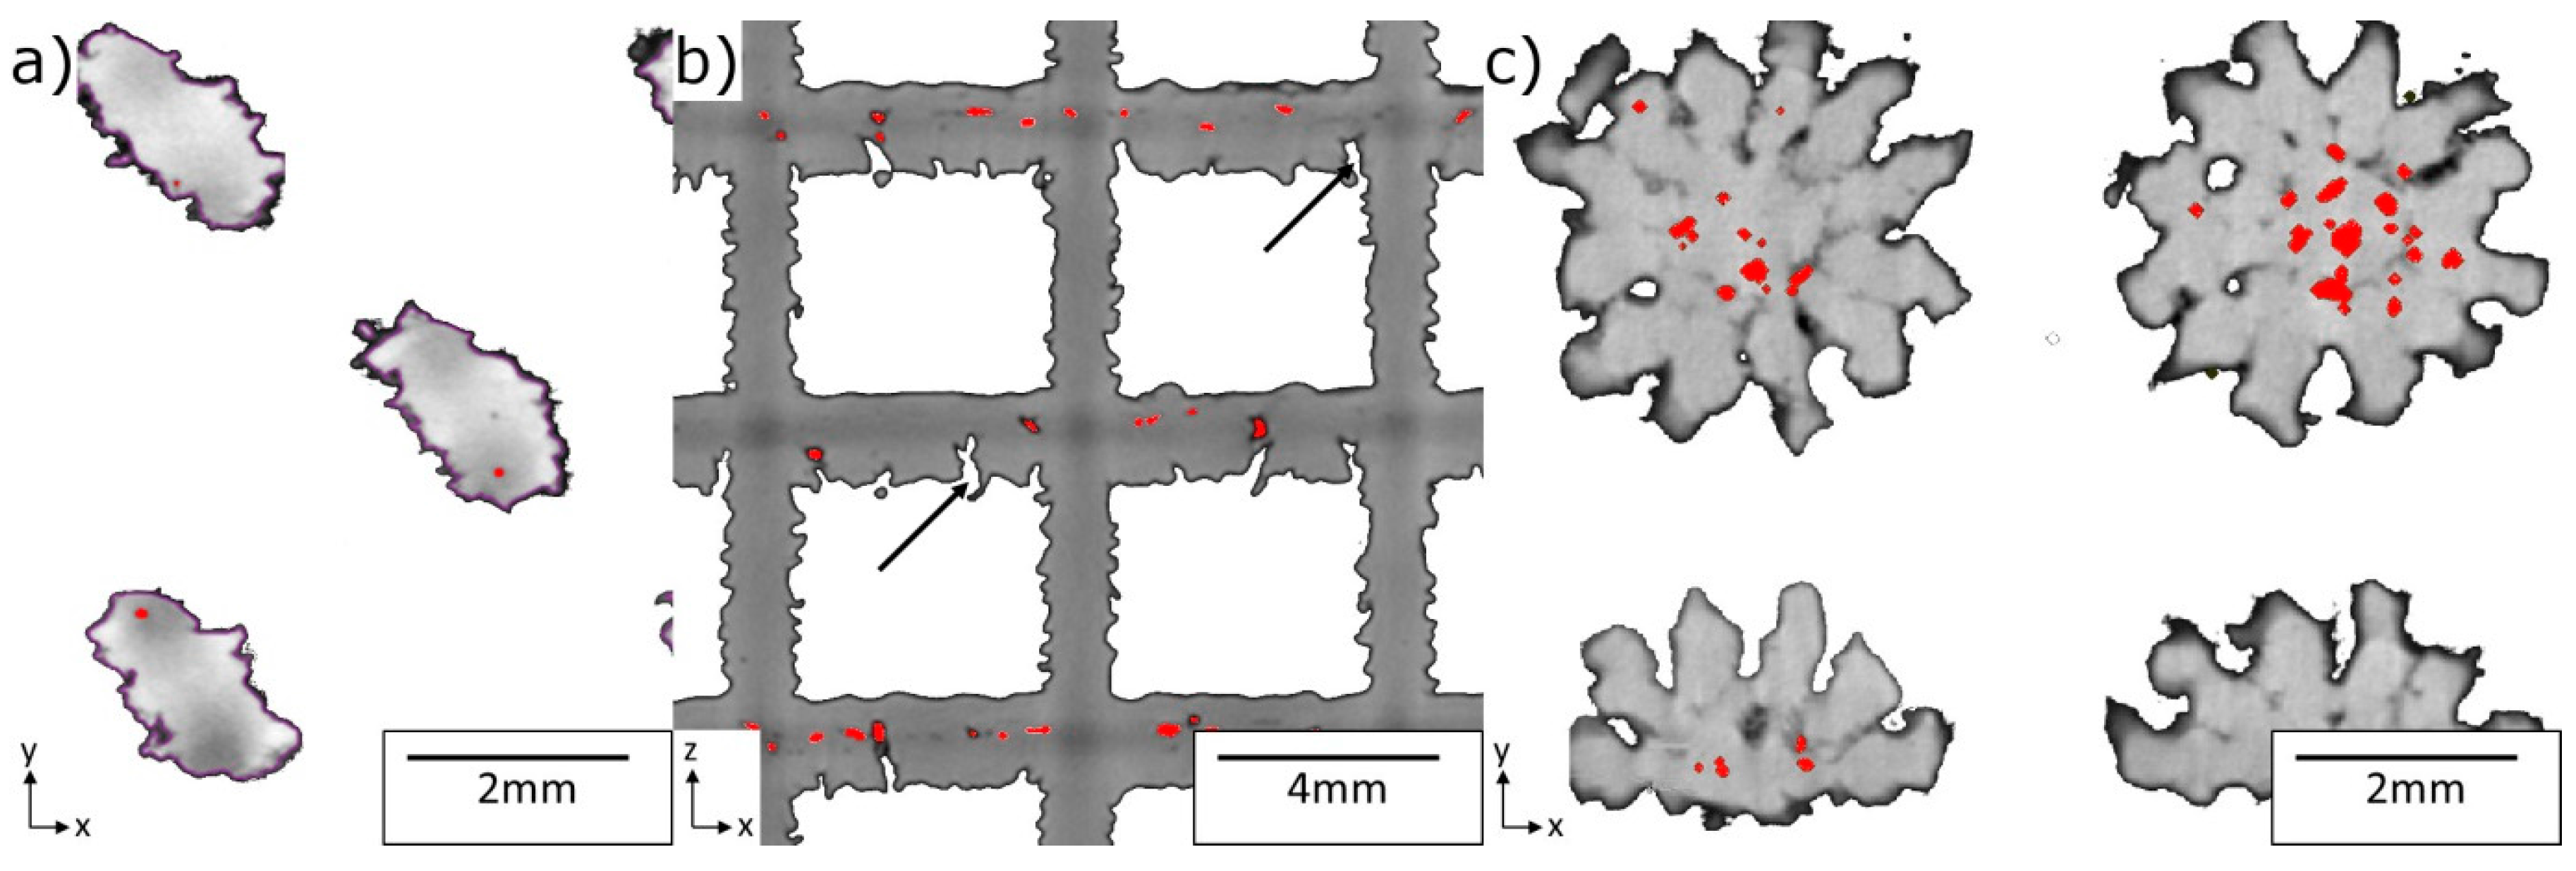
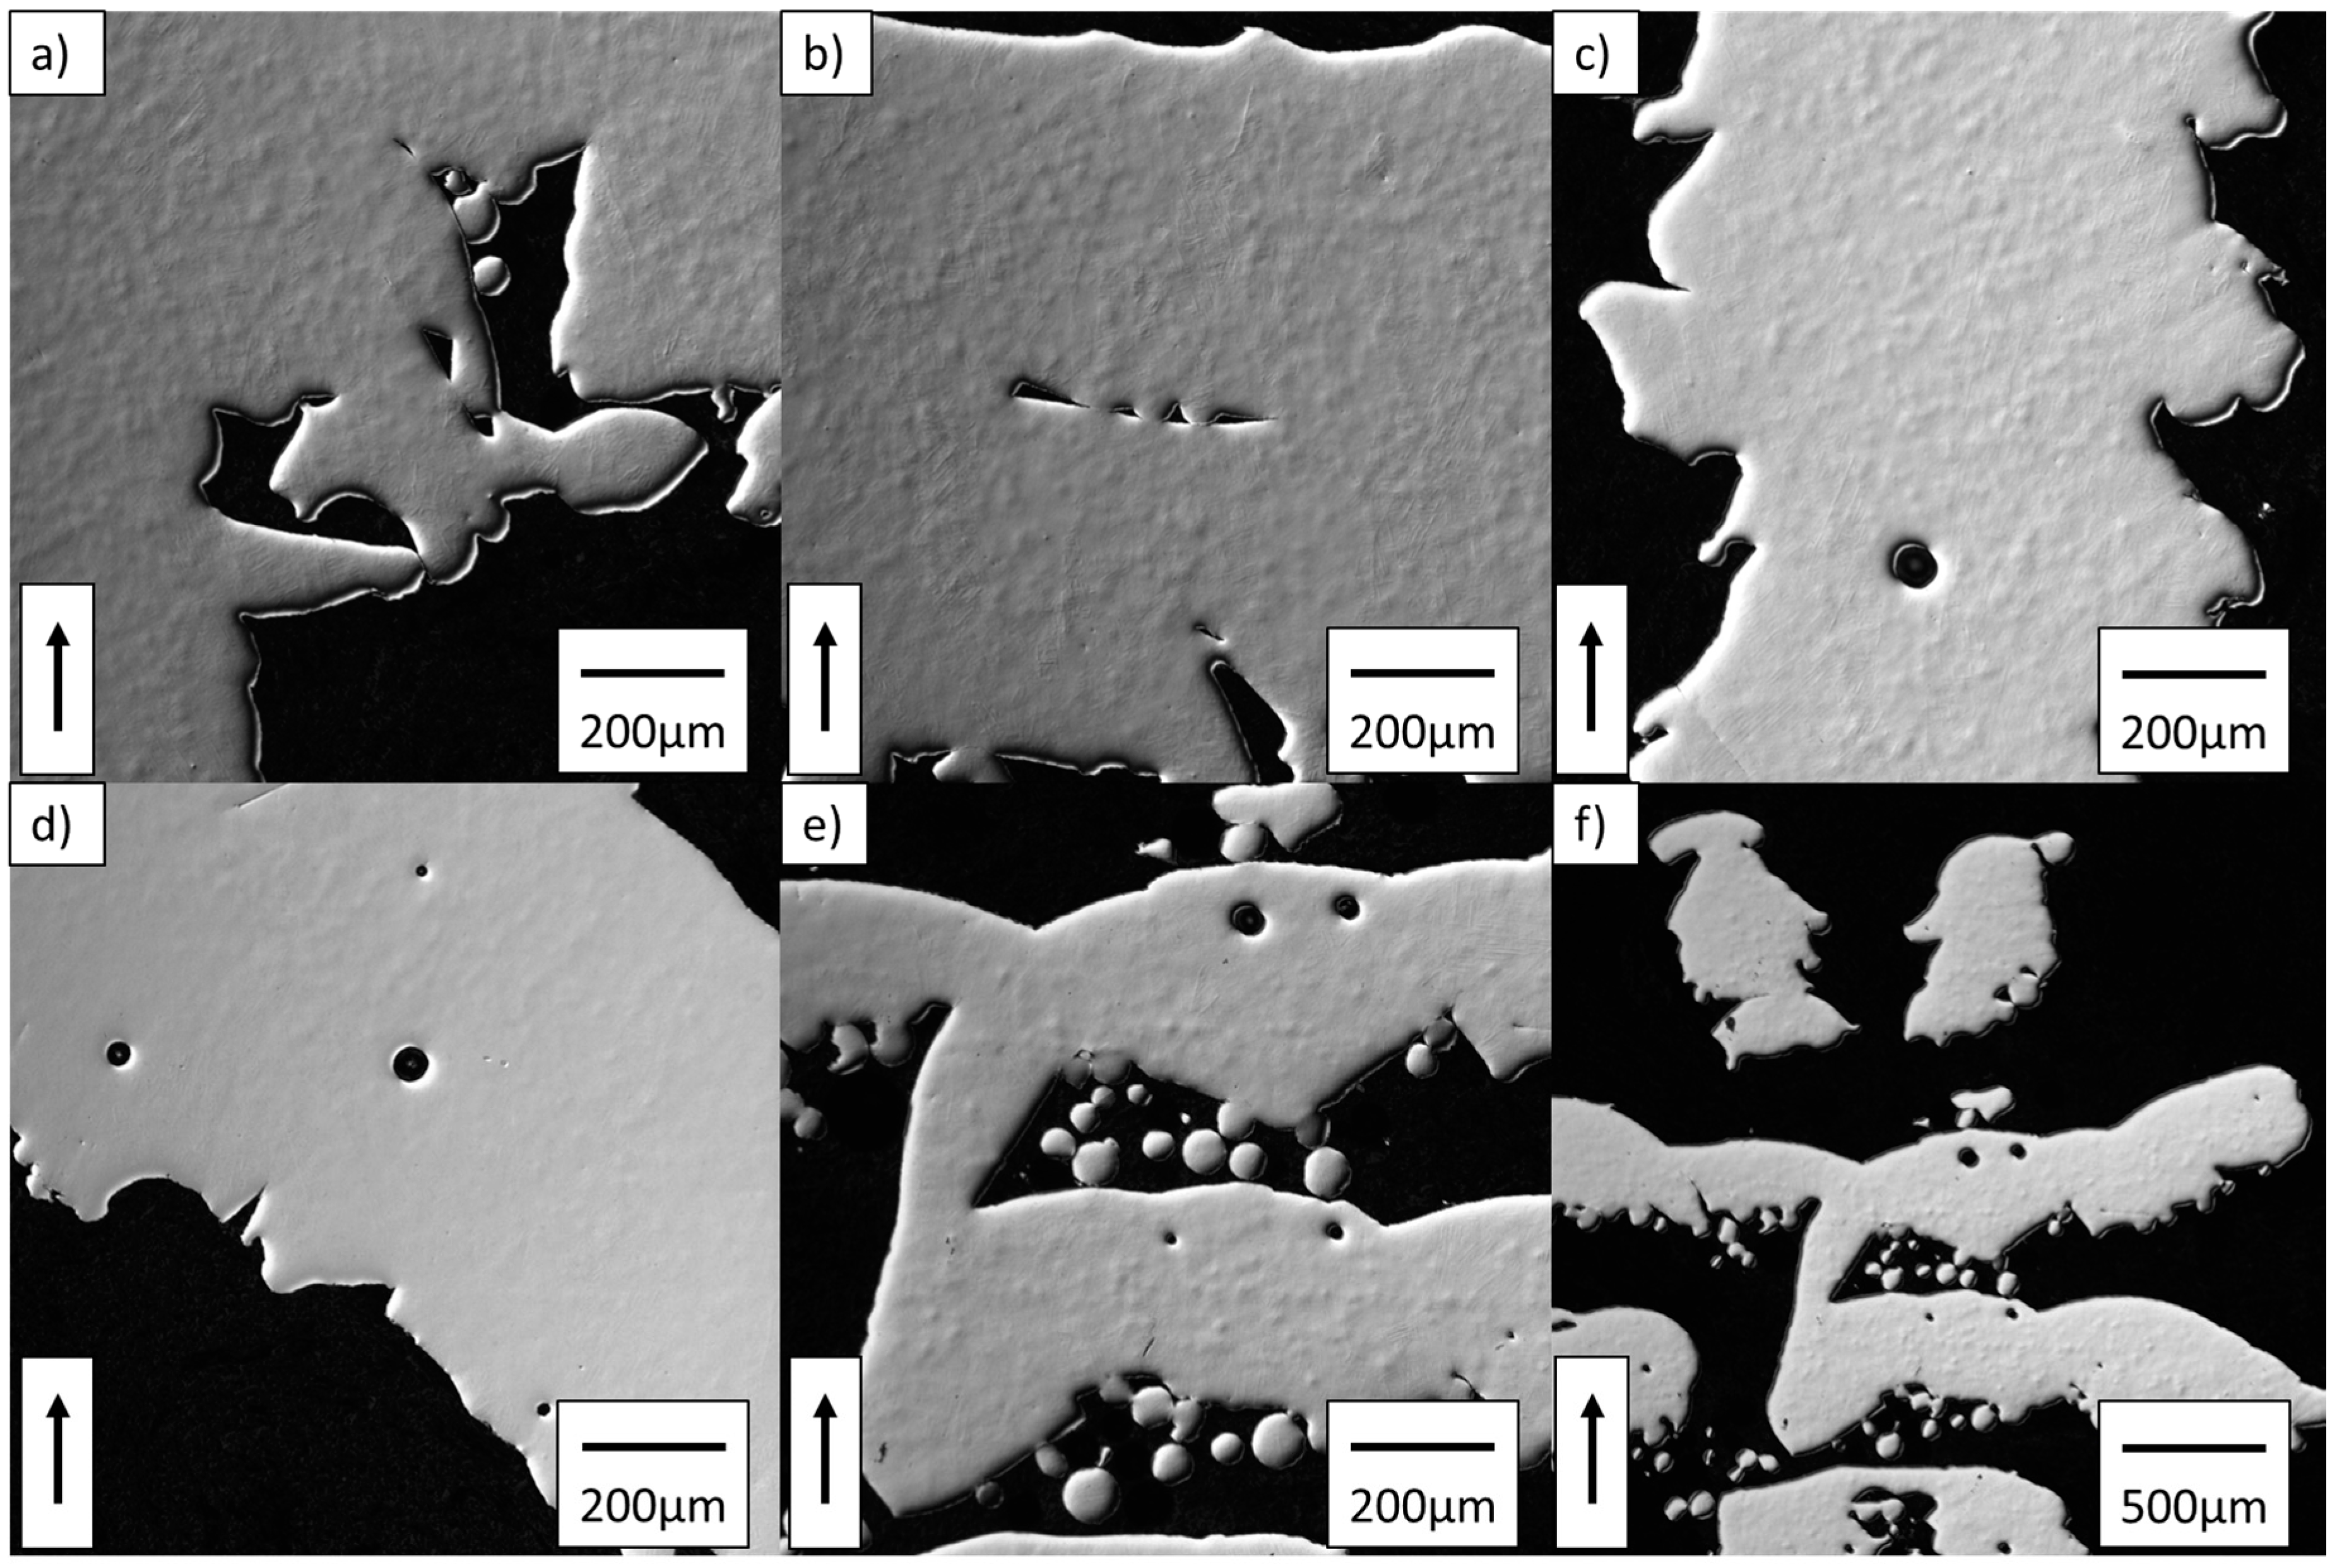
The lattice structures all comprise 5 × 5 × 5 unit cells of 25 mm side length in the x, y and z direction. Lattices having 3 types of unit cell were manufactured (cubic, diamond-like, and a re-entrant cube), the last one being a variant of the auxetic cube structure proposed by Lakes [12] with no lateral truss members (all are shown in Figure 1). Characteristics of truss diameter and angle as well as maximum number of members meeting at a node (i.e., connectivity) are summarised in Table 1. Atomised Ti-6Al-4V powder with a particle size range of 45–100 μm was introduced into an ARCAM S12 system (ARCAM AB, Mölndal, Sweden). The beam parameters comprised a voltage of 60 kV, focus offset of 0 mA and a beam current varying from 1.7 mA to 3 mA with an offset to CAD contour of 0.2 mm. The particle melting was undertaken in two stages; hatching and contouring applied sequentially, depositing layers of 70 μm height. While hatching is designed to melt continuously from left to right and top to bottom (a rastering pattern), contouring is carried out using concentric traces, following the periphery of each area to be melted. The combination of the two trajectories aims to achieve a fully melted area and a minimum surface roughness. Preheat stages were also applied; termed Preheat I and Preheat II, they were carried out before melting commenced on each layer. Their main beam parameters were a maximum beam current of 30 mA, a beam speed of 14,600 mm/s, and a focus offset of 48 mA. While Preheat I was applied to the entire powder bed, Preheat II was only applied to the area 5 mm around the CAD contours as part of the gradual preheat of the powder to be melted.
Once manufactured, one sample of each geometry plus a 5 g sample of the gas atomised powder used for production were scanned in a 225/320 kV Custom Bay CT system (Nikon Metrology, Tring, UK) using an accelerating voltage of 125 kV and a 120 mA current, the white beam of X-rays radiating from a spot of 5 μm from a silver target. The source sample-detector positions were such that 10× magnified images were collected on a Perkin Elmer (PerkinElmer Ltd., Beaconsfield, England) 2048 × 2048 pixel 16-bit amorphous silicon at panel detector having a pixel size of 200 μm, giving an effective pixel size of 20 μm. The sample was rotated through 360° and a total of 3142 radiographs taken for each scan using the Nikon-Metrology Inspect-X acquisition software (Version 2.0, Nikon Metrology, Tring, UK).
Once CT-scanned, metallographic samples were prepared in order to obtain optical micrographs of the pores. Lattice sections were cut in a Secotom-50 Struers system (Struers ApS, Ballerup, Denmark) using silicon-carbide cut-off wheel at 0.6 mm/min feed rate and 2000 rpm. Then, sections were hot mounted in bakelite to be further ground and polished in a Tegramin Struers system (Struers ApS, Ballerup, Denmark) using 600, 1200 SiC-paper grit. This was followed by polishing using a 9 μm diamond suspension, silco solution. Finally, optical microscopy was carried out in a Clemex Vision PE system (Clemex Technologies Inc., Longueuil, QC, Canada) using polarized light and differential interface contrast.

3. Results

3D volumes of lattice structures and powder feedstock were reconstructed from the CT data, see Figure 2 and Figure 3, respectively. Quantification of metal and pore volume fraction in the three orthogonal directions for lattices are reported in Figure 4, Figure 5 and Figure 6. The pore and metal fraction were quantified using Equation (1):
ϕ i = V i Σ j V j ,
where ϕi is the fraction of the ith constituent, Vi is the respective phase fraction and ΣjVj is the sum of all constituents of the mix, i.e., pore and metal volume. Additionally, the plotted metal area pertains to the voxel area per slice. In the notation used throughout this work, the build direction (normal to the plane of the layers) and the z direction (normal to plane xy) are parallel.

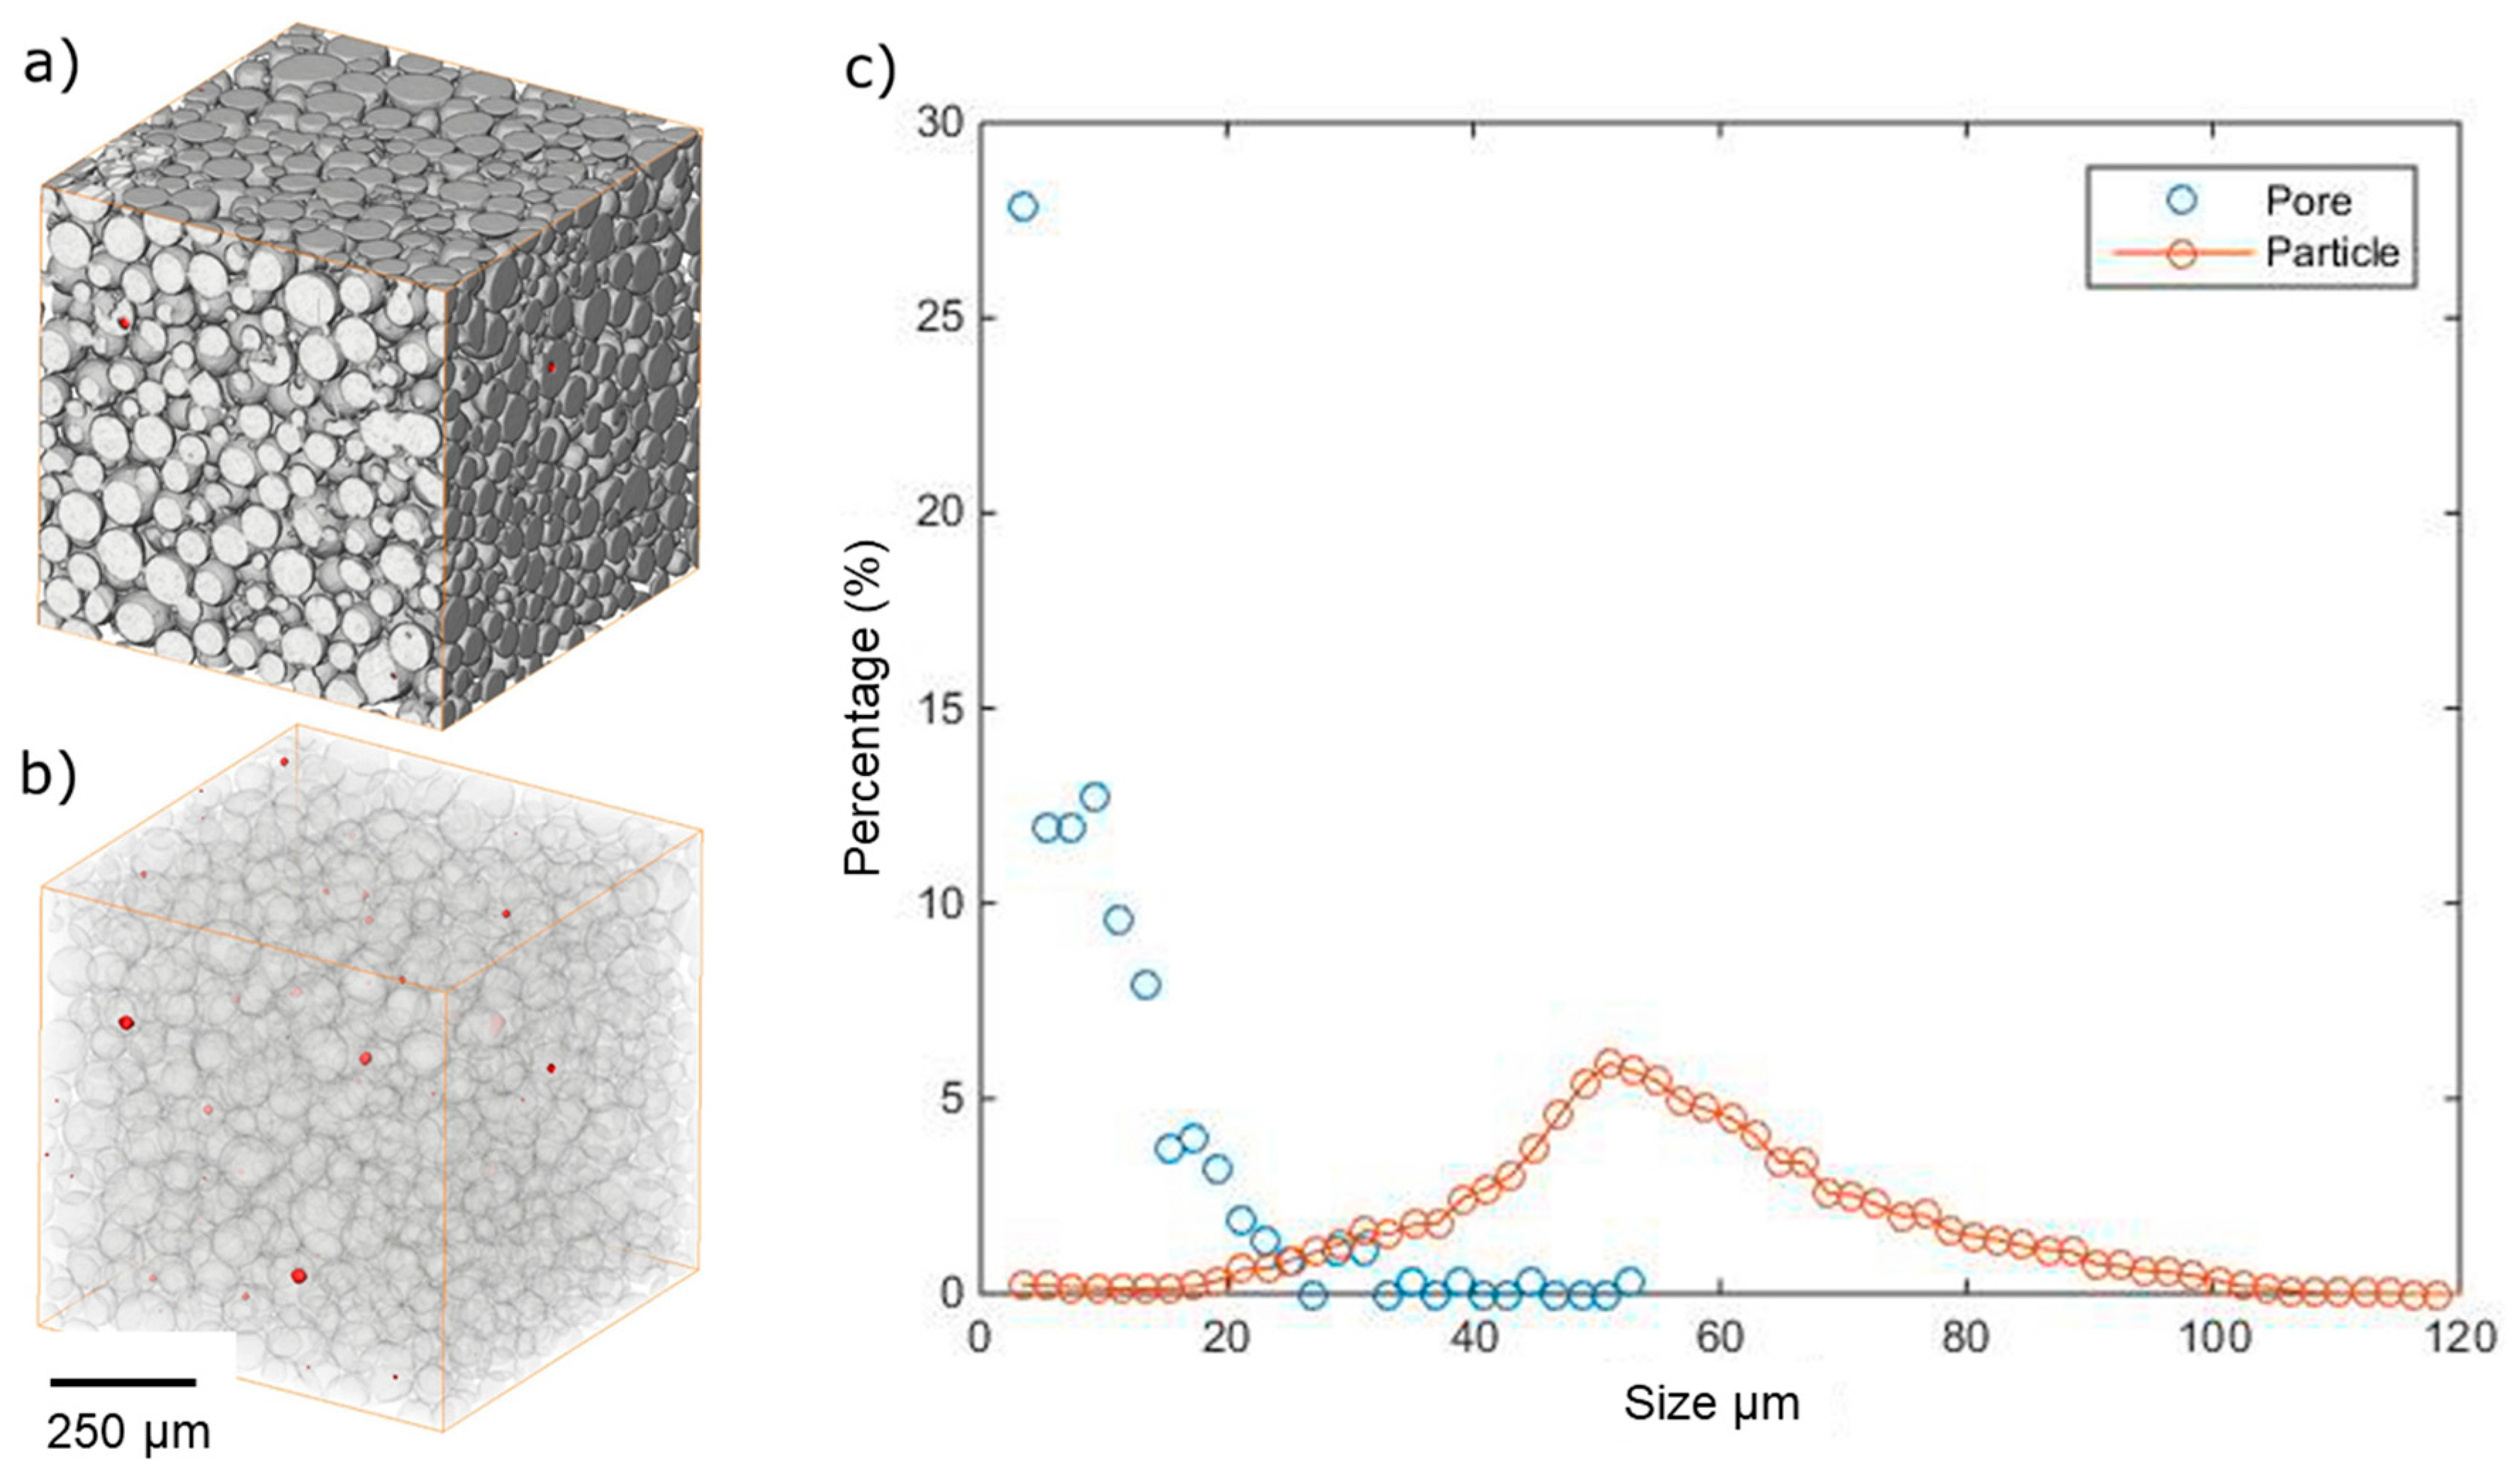
3.1. Porosity Found in Raw Powder Material

The results on the powder feedstock confirm a particle size in the range stated by the suppliers, with 15 vol % of sub-40 μm particles and 0.5 vol % being over 100 μm in diameter, Figure 3c. The internal porosity present, which must originate in the atomisation process, is also reported. The pores varied in size (reaching a maximum of 52 μm in diameter), and accounted for 3.0 vol % of the total porosity in the packed po wder as a whole. The probability of any particular particle having a pore however was found to be 0.018% (377 pores in a total of 20,078 scanned particles). Details of such porosity have been reported elsewhere [6], finding that it is delimited by the powder particles, as would be expected, and is close to spherical in shape. The findings here indicate the amount of porosity introduced into SEBM components by the raw materials.

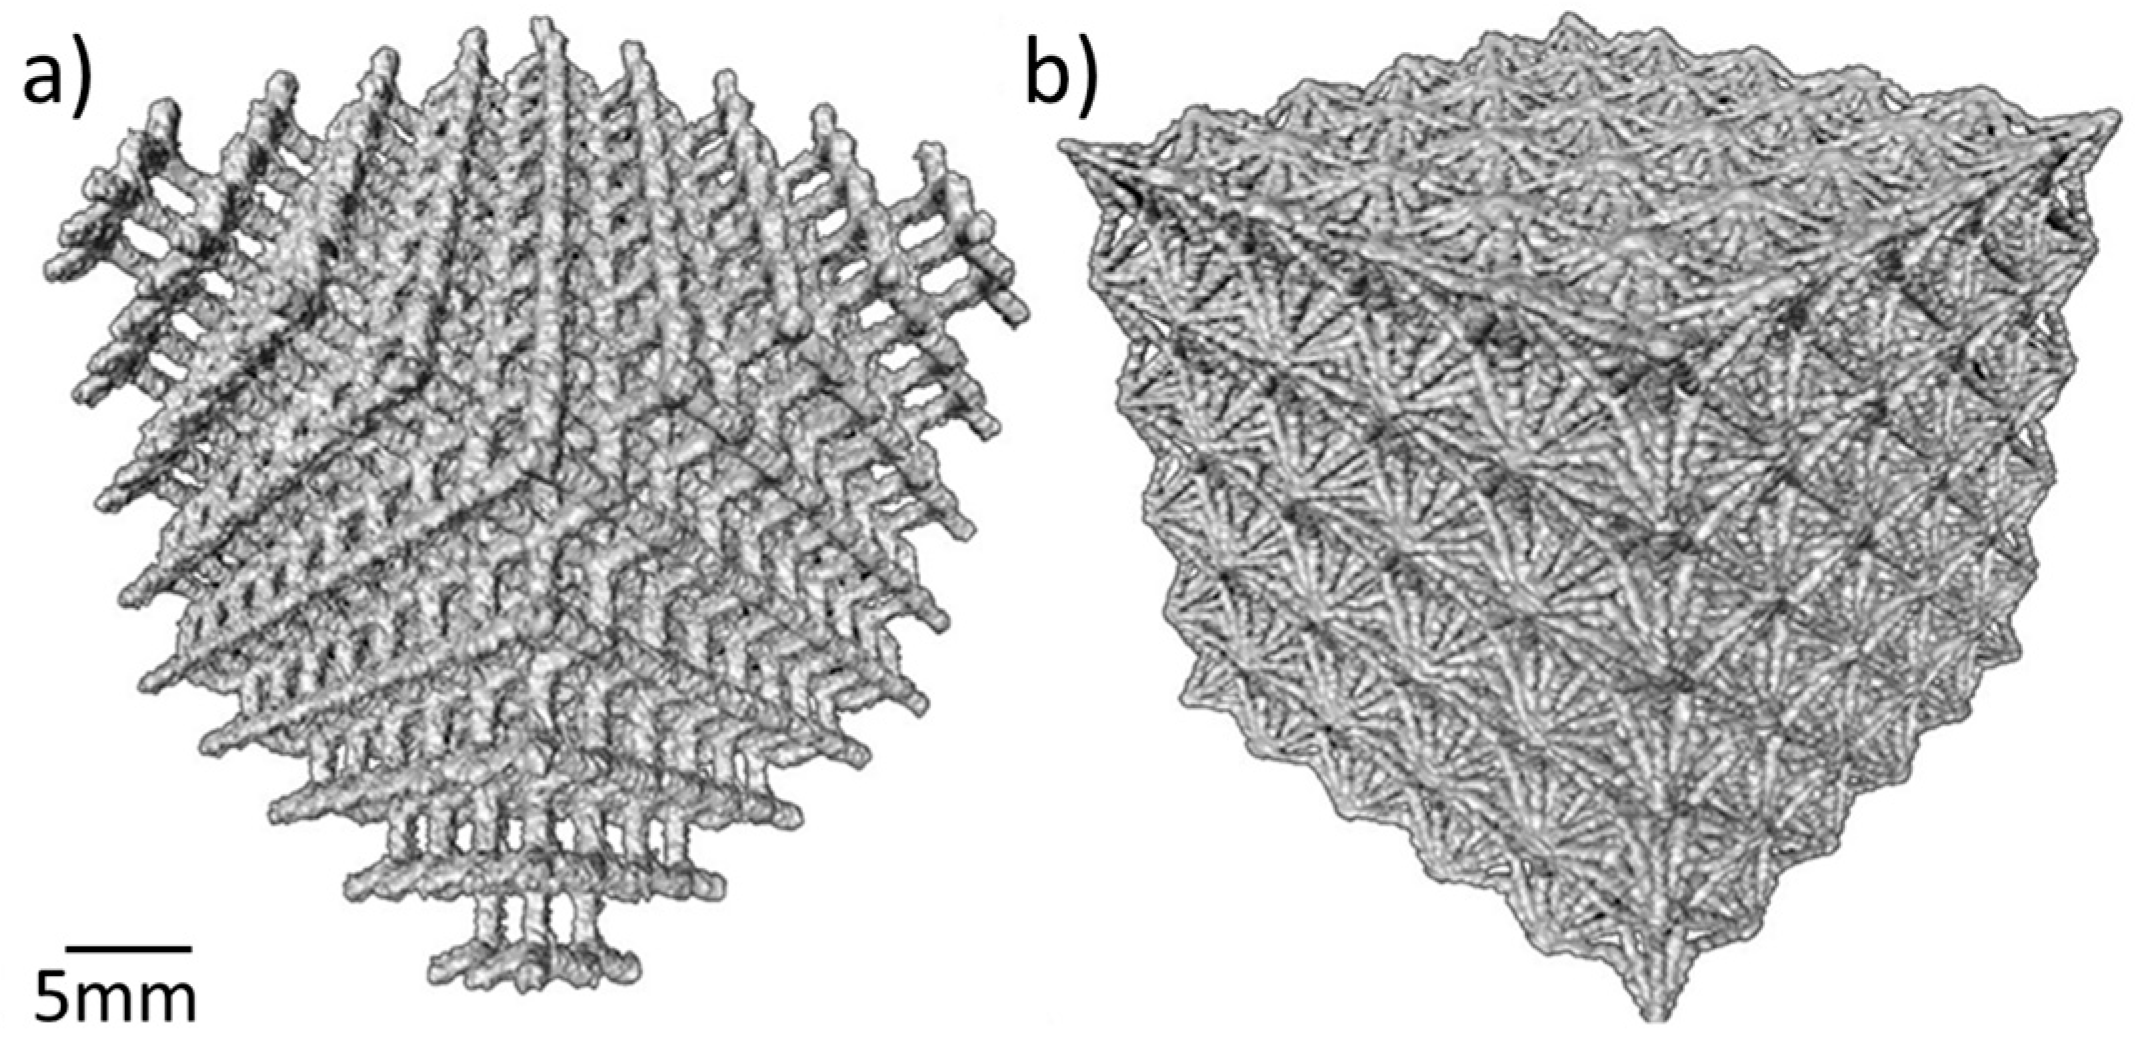
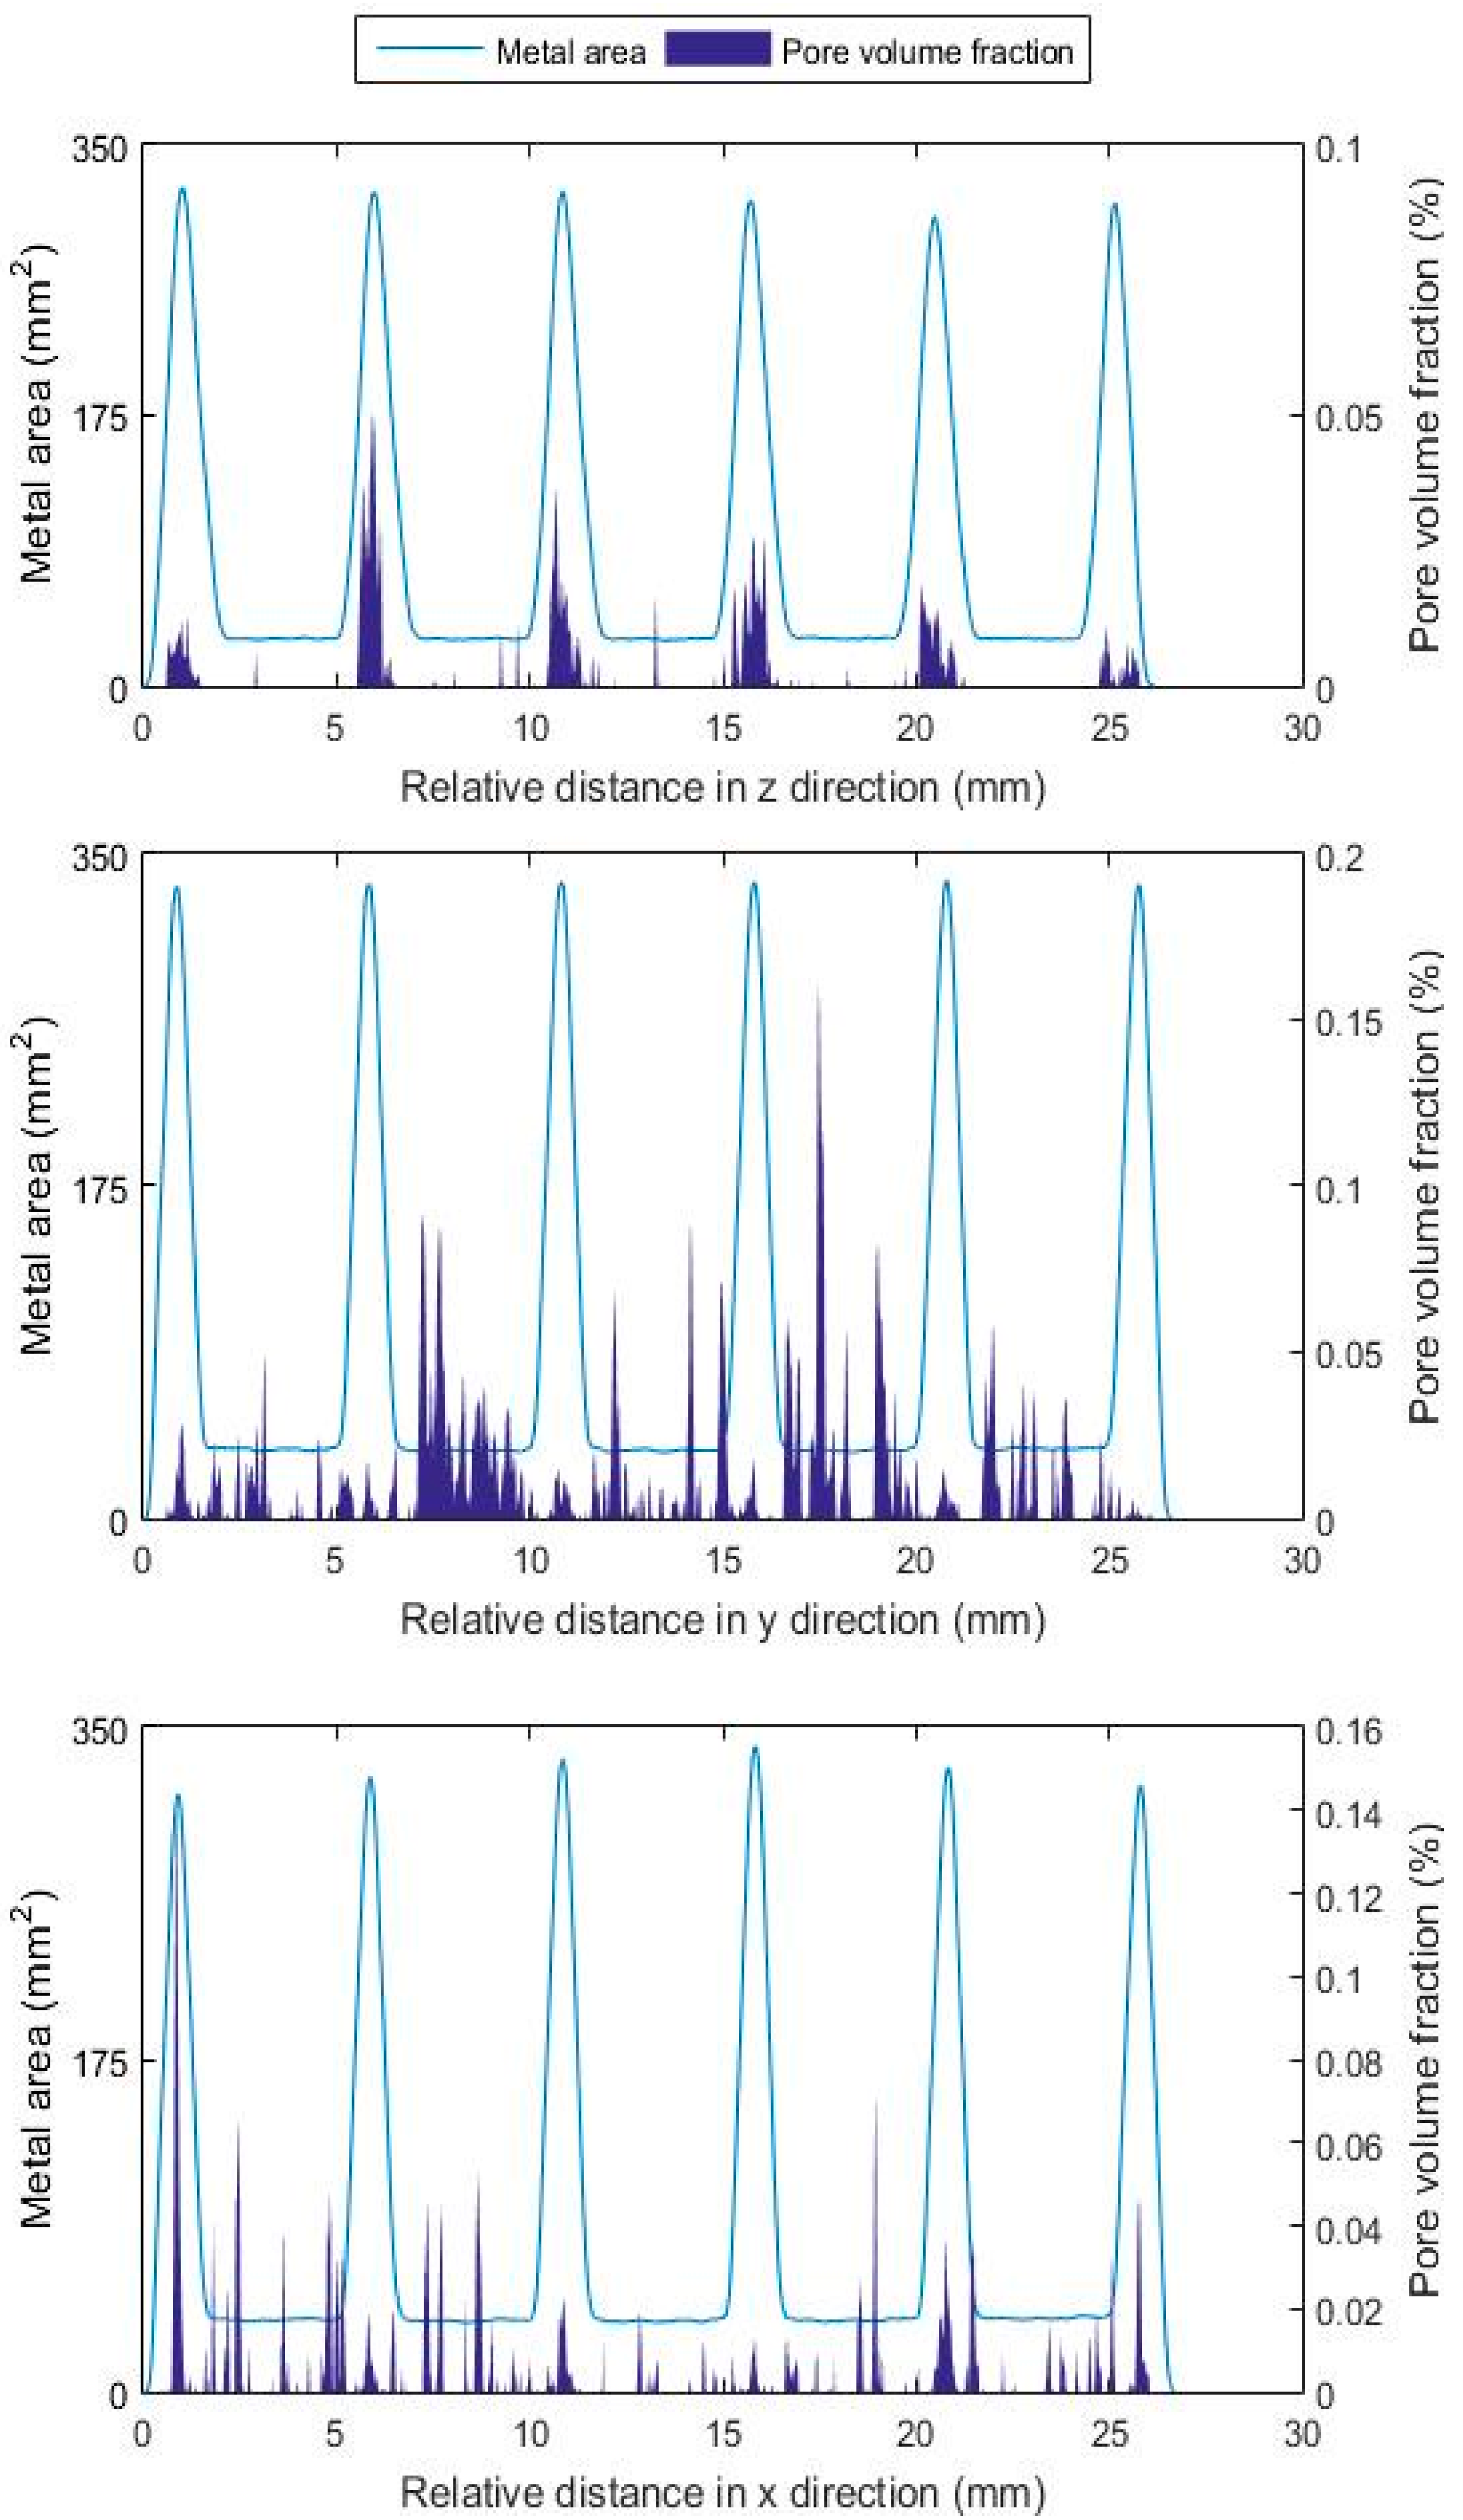
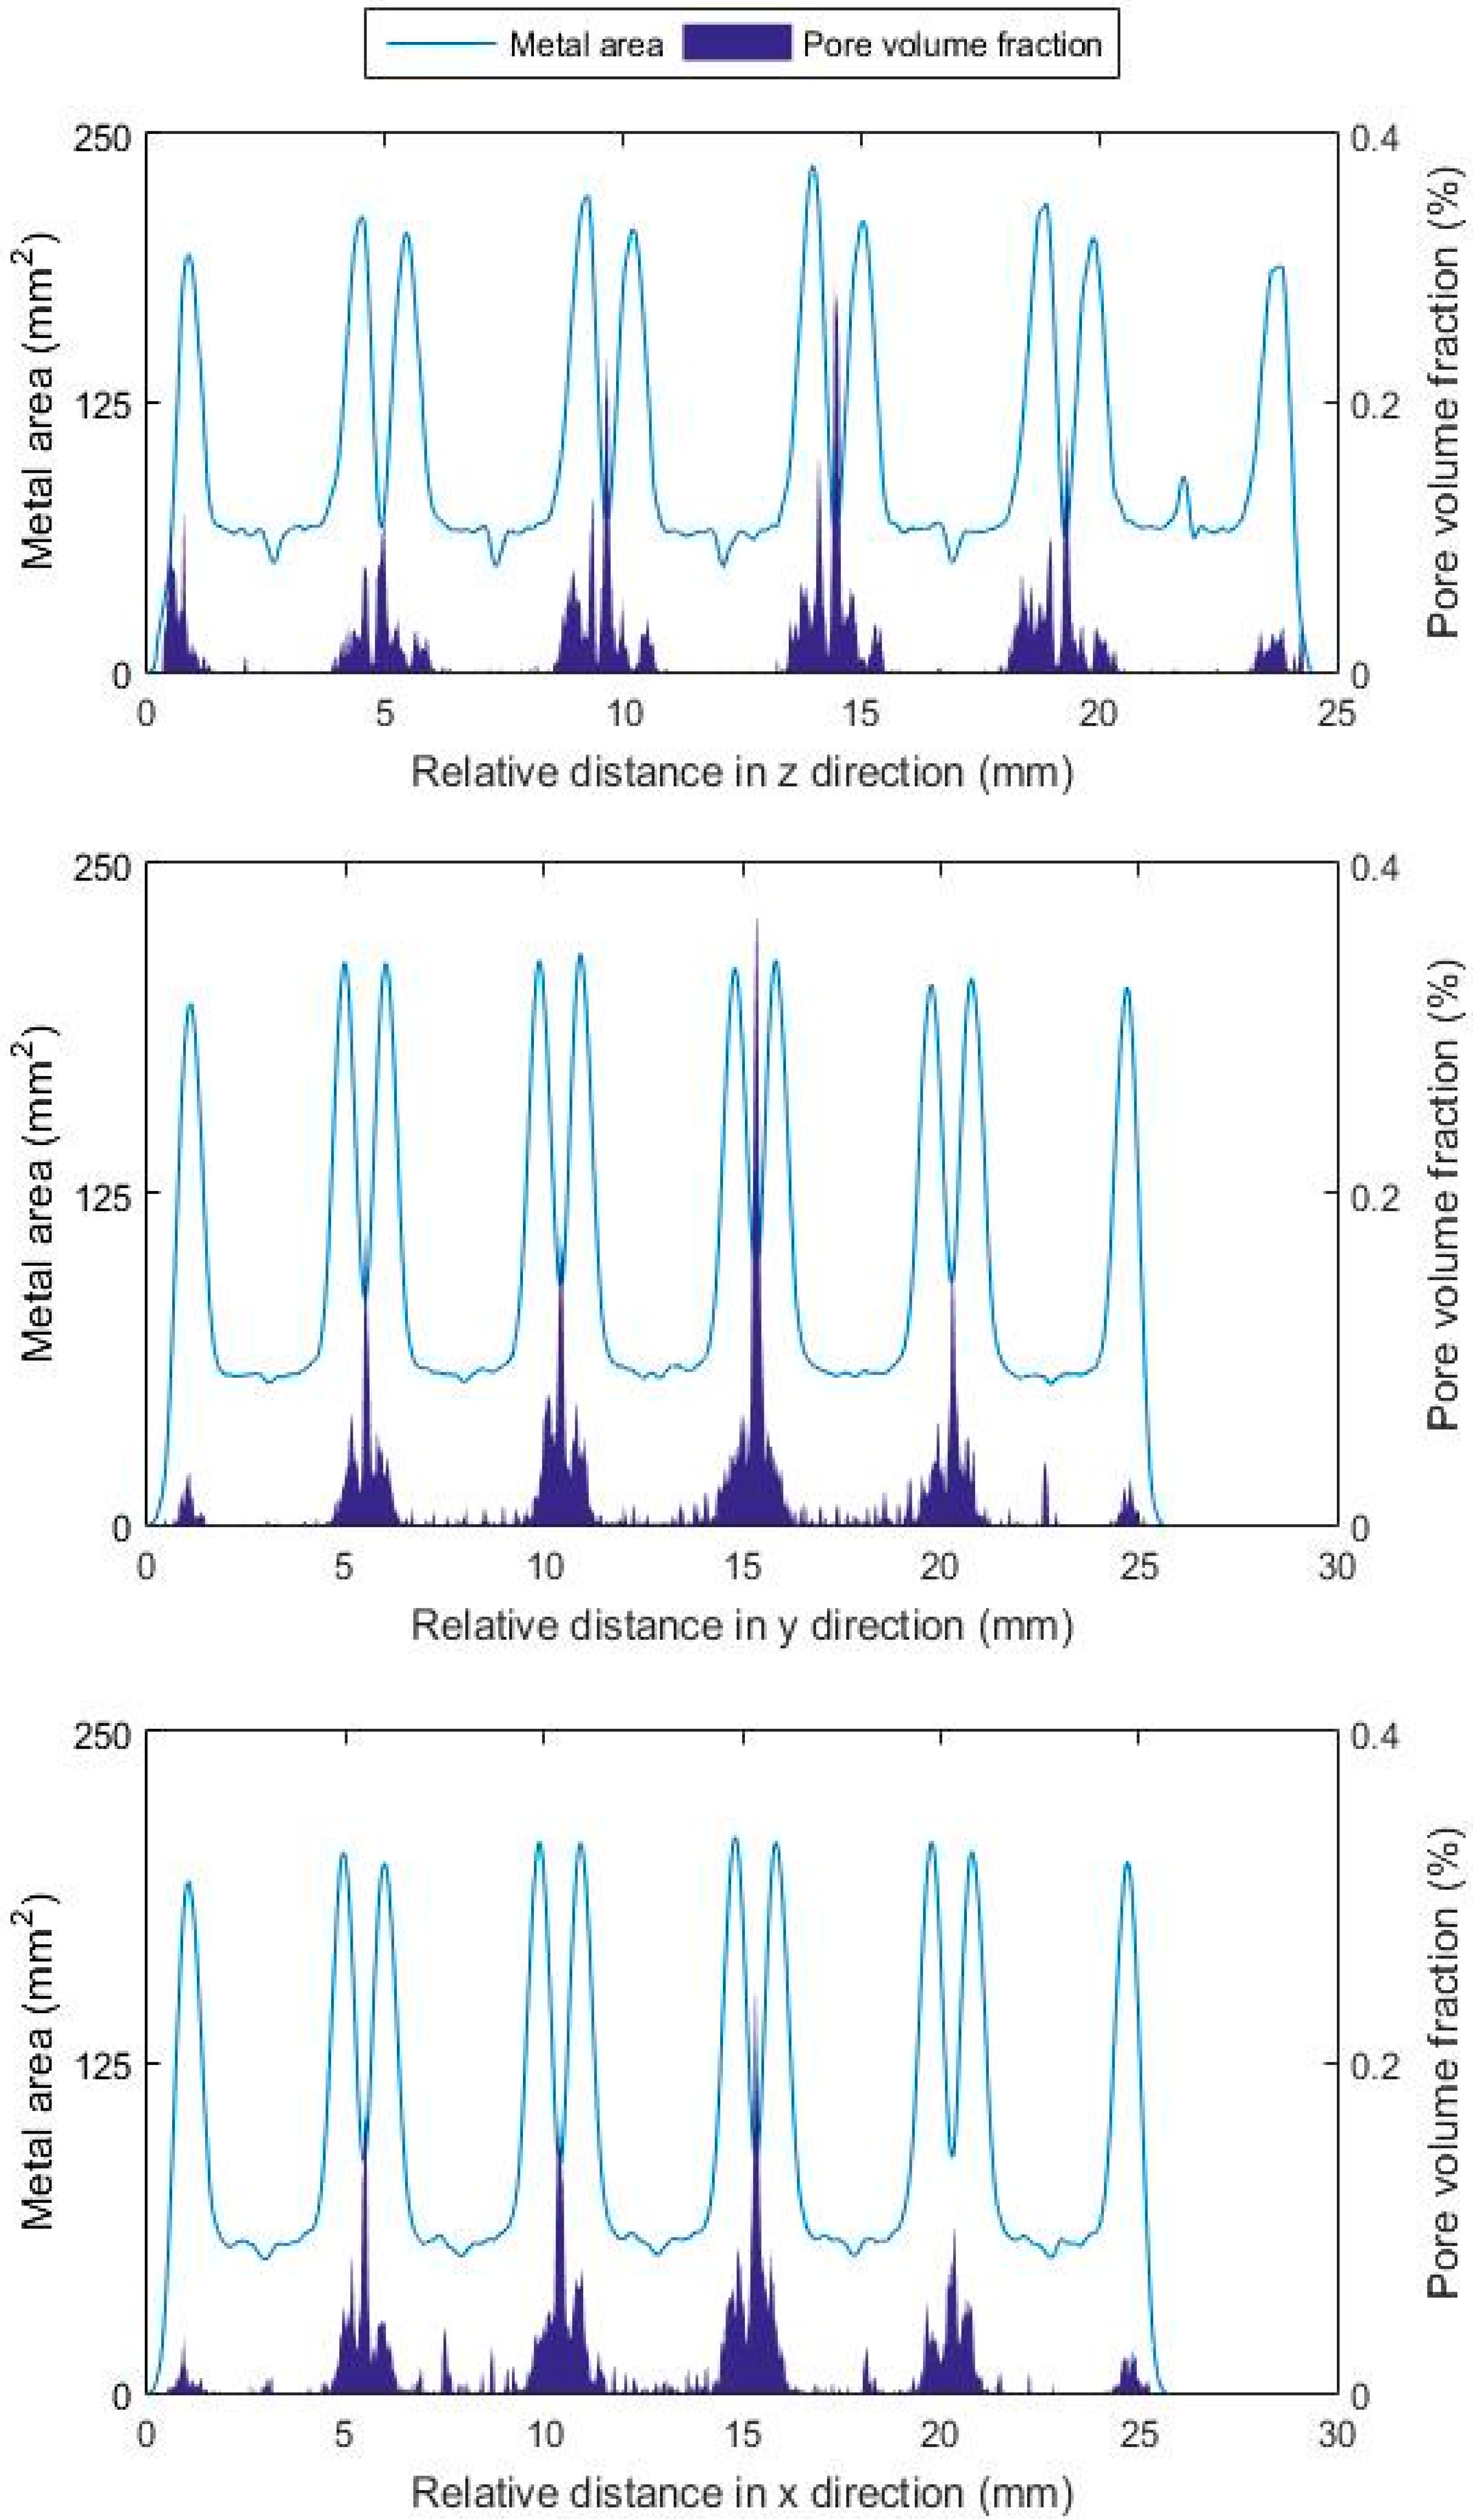
3.2. The Effect of Lattice Structure and Layer Deposition Orientation

The internal porosity (i.e., free volume surrounded by metal) in the lattice structures was analysed by X-ray CT. To observe how the porosity was arranged within the lattice, and whether it correlates with particular structural features the data is displayed in Figure 4, Figure 5 and Figure 6, taking virtual slices through the structure along each of the x, y and z directions. The fraction of closed pores (relative to the amount of metal) within the struts is assessed for each layer and plotted.
With regard to the porosity found in the different lattice structures, a significant difference is evident between the diamond-like and the cubic lattice structures, Figure 4 and Figure 5, respectively. While the individual pore volume distribution within the solid struts making up a diamond lattice appears to be fairly independent of location when scanning across each of the 3 spatial dimensions, the cubic lattice shows preferred pore locations. Figure 5 shows contrasting peaks of close to one orders of magnitude higher than in the diamond structure can be identified. As the cubic lattices were built so that their truss elements were either parallel or perpendicular to the build direction (unlike the diamond-like lattice, where all struts are at an angle of 54.7° to the build direction), this indicates that the material response to melting and solidification may not be the same when melting material on top of layers of loose particles as it is when laying down on previously melted material. Further analysis was carried out, quantifying the pore fraction in trusses only (i.e., excluding the nodes). This identified pores lying within horizontal and vertical trusses. The fractions obtained using Equation (1), were found to be 0.17 × 10⁻³% for pores in vertical struts and 15.4 × 10⁻³%, 3.9 × 10⁻³%, for the x and y directions, respectively, see Table 2. This explains the tendency for preferred pore locations observed above for the cubic lattice and discussed in Section 4.
For the re-entrant cubic lattice, Figure 6 shows the porosity to be periodically distributed, in a manner that coincides with the spacing of the nodes of high connectivity, regions of higher metal density. This suggests that these regions of dense truss population can represent difficult sections to melt, particularly for specimens of small dimensions. The total truss internal porosity for the diamond and the re-entrant cube lattice is reported to be 2.0% and 22.4 × 10⁻³%, respectively, as shown in Table 2.

4. Discussion

From the results obtained for all of the lattice structures, it can be seen that the build conditions for the diamond lattice are equally likely to result in pores being positioned at any point throughout the lattice, with no regions (on the macroscopic scale of the structure at least) where porosity is more likely to occur than others, see Figure 7a. This fraction appears to have its origin in pre-existing pores in the feedstock, which are found to be similar in size. On the other hand, results from the cubic lattice indicate that, in that case, significant differences in where pores are likely to be formed do exist. Indeed, high pore fractions are found to occur in planes where horizontal trusses appear, see Figure 7b. These are composed of material melted from loose particles of the powder bed.
Previous investigations [9] have discussed the mechanisms of formation of high aspect ratio defects propagating across several layers of added material in the form of “tunnel-like” pores. It was reported that coalescence of particles when heated by the beam takes place immediately, before they are fully melted. In a powder bed, such coalescence is less likely to happen when a layer is melted on top of another fully dense and defect-free layer, and so where pores occur they lead to increased probability of the formation of a pore in the same location in the next layer. This, of course, will only happen where the beam power, and hence heating, is insufficient to allow the liquid metal to overcome surface tension forces. It can therefore be suggested that a lower pore density fraction results for material orientations requiring a small overhang between each solid layer, such as the diamond lattice in contrast to the cubic lattice. On the other hand, when trusses are built without any pre-existing solid support, as in the case of the horizontal struts in the cubic lattice, the volumetric fraction of porosity increases significantly. In Figure 7b, such “tunnel-like” pores are highlighted. These are found to occur scattered along the horizontal strut in the vicinity of the node in some cases. As these pores are open to the strut surface, and therefore the outside environment, they were not identified as pores during the reconstruction process, and their volume is therefore not quantified. However, their presence alters the metal volume, giving different results from standard tessellation language file (STL) designs. In Table 2, such a difference is shown when comparing horizontal and vertical trusses. Previous investigations of lattice structures [7] have reported undersized struts when oriented parallel to the build direction; the results shown here show lower metal volume for trusses under similar conditions of manufacturing.
For populated areas with thin sections, it is not clear up to what point the orientation influences the fraction of porosity. Overlaid images of solid trusses and existing pores show irregular pore patterns in the form of “colonies" (see Figure 7c). However, it is noteworthy that the beam parameters for these structures included a beam offset to the contour of the CAD thickness, with the intention of reducing the area for melting down to a single beam pass in some end-truss areas. This suggests that pores within these lattice members are due to lack of fusion and not to pre-existing gas pores within the feedstock. Therefore, given the fact that porosity can never be completely excluded, a high fraction of pores (irregular in shape) is likely to appear in areas where the melting is compromised, i.e., at nodes of high connectivity and or trusses built perpendicularly to the build direction. On the other hand, if the member is built with an orientation close to the build direction, the porosity fraction appears to be diminished.
Optical micrographs (Figure 8) show examples of pores of each CT-scanned lattice. As discussed before, “tunnel-like” are characterized by being open from initial deposited layers, see Figure 8a. In this example, the pore is located at the beginning of trusses perpendicular to the build direction, i.e., cubic lattice trusses. Horizontal trusses, on the other hand, show irregular pores of elongated shape, see Figure 8b. As noted before [9], these appear to be due to poor adhesion when melting over loose particles, creating a balling effect and impeding the creation of homogeneous solid sections. Vertical trusses, as shown in Figure 8c, tend to have a better heat dissipation and better powder particle adhesion when melted, thus showing spherical pores only, which presumably originate from the atomization of powder feedstock. This is also true for diamond-like lattices, Figure 8d, with deposition angles (54.7°) seemingly giving rise only to spherical pores, rather than other lack of fusion defects. It is evident that the pore sizes shown in Figure 8 match those in Figure 7a, and reported within the higher peaks identified in Figure 4.
Finally, images from the re-entrant cube lattice, Figure 8e,f show an irregular nodal shape with satellite particles of what seems to be traces of non-fully melted material. As suggested before, these areas populated with multiple trusses seem to represent difficult areas to melt.

5. Conclusions

The qualitative and quantitative characterisation of porosity generated within the structural members of cellular solids (in the form of regular lattices) manufactured by SEBM have been reported. All three lattice structures fabricated here were found to contain a small (though potentially significant for some behaviours) fraction of defects, with the level influenced by their structure. While relatively high pore fractions are reported for cubic lattices, it was found that horizontal trusses are the most affected, showing a difference of two orders of magnitude in the largest pore fractions measured compared to vertical deposited trusses (i.e., 0.17 × 10⁻³% for vertical to 15.4 × 10⁻³% for horizontal). A smaller pore volume fraction (2 × 10⁻³%) was found in a diamond-like lattice. This is due to the fact that the structure acts in a self-supporting way when adding more material, and thus the propensity for defects is lowered. In addition to this, highly populated areas (a high number of lattice trusses meeting at a single point) also appear to give higher levels of porosity; in this study, a pore percentage of 22.4 × 10⁻³% was measured for such regions for the re-entrant cube. It also appears that a more gradual solid-liquid transformation of loose particles from the powder bed may lead to reduced porosity levels, reproducing the conditions of self-supportive structures (trusses of 54.7° to 90°); however, experimental confirmation of this is left for future investigation.

Acknowledgments

The authors acknowledge funding from the EPSRC Designing Alloys for Resource Efficiency (DARE) program (EP/L025213/1). In addition we gratefully acknowledge the EPSRC for funding the Henry Moseley X-ray Imaging Facility through grants (EP/F007906/1, EP/F001452/1 and EP/M010619/1). Philip J. Withers is supported by the European Research Council (ERC) (H2020-ERC-ADG project number 695638) CORREL-CT (Multiscale Correlative Research).

Author Contributions

Everth Hernandez-Nava is the primary author of the paper. Samuel Tammas-Williams and Fabien Leonard assisted in the X-ray tomography, Christopher Smith supported on the EBM manufacturing, Philip J. Withers, Iain Todd and Russell Goodall supervised the work and discussed the results with the other authors.

Conflicts of Interest

The authors declare no conflict of interest.

References

  1. Hernández-Nava, E.; Smith, C.J.; Derguti, F.; Tammas-Williams, S.; Léonard, F.; Withers, P.J.; Todd, I.; Goodall, R. The effect of density and feature size on mechanical properties of isostructural metallic foams produced by additive manufacturing. Acta Mater. 2015, 85, 387–395. [Google Scholar] [CrossRef]
  2. Amendola, A.; Hernández-Nava, E.; Goodall, R.; Todd, I.; Skelton, R.E.; Fraternali, F. On the additive manufacturing, post-tensioning and testing of bi-material tensegrity structures. Compos. Struct. 2015, 131, 66–71. [Google Scholar] [CrossRef]
  3. Stevenson, G.; Rehman, S.; Draper, E.; Hernández-Nava, E.; Hunt, J.; Haycock, J.W. Combining 3D human in vitro methods for a 3Rs evaluation of novel titanium surfaces in orthopaedic applications. Biotechnol. Bioeng. 2016, 113, 1586–1599. [Google Scholar] [CrossRef] [PubMed]
  4. Elizondo, E. Investigation of Porous Metals as Improved Efficiency Regenerators. Ph.D. Thesis, University of Sheffield, South Yorkshire, England, 3 October 2016. [Google Scholar]
  5. Al-Bermani, S.S.; Blackmore, M.L.; Zhang, W.; Todd, I. The origin of microstructural diversity, texture, and mechanical properties in electron beam melted Ti-6Al-4V. Metall. Mater. Trans. A 2010, 41, 3422–3434. [Google Scholar] [CrossRef]
  6. Tammas-Williams, S.; Zhao, H.; Léonard, F.; Derguti, F.; Todd, I.; Prangnell, P.B. XCT analysis of the influence of melt strategies of defect population in titanium components manufactured by selective electron beam melting. Mater. Charact. 2015, 102, 47–61. [Google Scholar] [CrossRef]
  7. Hernández-Nava, E.; Smith, C.J.; Derguti, F.; Tammas-Williams, S.; Léonard, F.; Withers, P.J.; Goodall, R. The effect of defects on the mechanical response of Ti-6Al-4V cubic lattice structures fabricated by electron beam melting. Acta Mater. 2016, 108, 279–292. [Google Scholar] [CrossRef]
  8. Das, S. Physical aspects of process control in selective laser sintering of metals. Adv. Eng. Mater. 2003, 5, 701–711. [Google Scholar] [CrossRef]
  9. Bauereiß, A.; Scharowsky, T.; Körner, C. Defect generation and propagation mechanism during additive manufacturing by selective beam melting. J. Mater. Process. Technol. 2014, 214, 2497–2504. [Google Scholar] [CrossRef]
  10. Léonard, F.; Tammas-Williams, S.; Prangnell, P.B.; Todd, I.; Withers, P.J. Assessment by X-ray CT of the Effects of Geometry and Build Direction on Defects in Titanium ALM Parts. In Proceedings of the Conference on Industrial Computed Tomography (ICT), Wels, Austria, 19–21 September 2012; pp. 85–93. [Google Scholar]
  11. Tammas-Williams, S.; Withers, P.J.; Todd, I.; Prangnell, P.B. The effectiveness of hot isostatic pressing for closing porosity in selective electron beam melting. Metall. Mater. Trans. A 2016, 47, 1939–1946. [Google Scholar] [CrossRef]
  12. Lakes, R. Foam structures with a negative poisson’s ratio. Science. 1987, 235, 1038–1040. [Google Scholar] [CrossRef] [PubMed]
Figure 1. Schematic view of the unit cells of the three lattices studied (as specified in the original CAD design used for manufacture): (a) Cubic; (b) diamond-like and (c) re-entrant cube. An intersecting plane (in the xy plane) is shown to highlight the changing angle of the trusses to the powder bed. (CAD: Computer aided design.)
Metals 07 00300 g001
Figure 2. Examples of reconstructed CT volumes of (a) diamond-like and (b) re-entrant cube lattice structures. (CT: X-ray computed tomography.)
Metals 07 00300 g002
Figure 3. CT-scan of a volume of gas atomised pre-alloyed powder: (a) Reconstructed volume showing the powder particles; (b) internal particle pores highlighted over the powder image; (c) particle and pore size distribution found in gas atomised particles.
Metals 07 00300 g003
Figure 4. Metal area and pore fraction per slice with distance from the edge of the diamond sample. Top image shows the z direction parallel to the build direction, middle and bottom images the other two orthogonal directions.
Metals 07 00300 g004
Figure 5. Metal area and pore fraction our slice with distance from the edge of the cubic sample. Top image shows the z direction parallel to the build direction, middle and bottom images the other two orthogonal directions.
Metals 07 00300 g005
Figure 6. Metal area and pore fraction per slice with distance from the edge of the re-entrant cube sample. Top image shows the z direction parallel to the build direction, middle and bottom images the other two orthogonal directions.
Metals 07 00300 g006
Figure 7. Sections of the reconstructed lattice volumes showing the metal and pore in red: (a) Diamond-like lattice in the z direction at 12.3 mm, see Figure 4; (b) nodes between horizontal and vertical trusses for the Cubic lattice in the xz plane showing tunnel-like pores highlighted by arrows in black and (c) nodes of the re-entrant lattice in z direction at 9.6 mm showing pore “colonies”.
Metals 07 00300 g007
Figure 8. Optical micrographs showing example pores as found in the three CT-scanned lattices. The build direction is indicated by the arrow. (ac) show defects in cubic lattices; at the beginning of the horizontal truss, elongated pores in horizontal trusses and round pores in vertical trusses, respectively; (d) shows round pores only in diamond-like lattices; (e) pores in trusses from trapped particles in the middle of the nodes of the re-entrant cube; (f) shows a zoom out on the same area.
Metals 07 00300 g008
Table 1. Beam element features of designed lattice structures.
Lattice SampleTruss
Diameter (mm)Angle (°)Connectivity
Cubic1.3906
Diamond154.754
Re-entrant0.2Various48
Table 2. Metal and pore volume in mm3 of all three lattices and per layer in the three orthogonal directions excluding nodes for the cubic lattice. The standard tessellation language file (STL) volume is added for comparison.
TotalsPer latticeAvg. Per Layer
Diamond-LikeCubicRe-EntrantCubicCubicCubic
<x><y><z>
STL vol. (mm3)194020931536.5115115115
Metal vol. (mm3)21102306247411612685
Pore vol. (mm3)0.0430.1680.5550.01790.00490.00014
Pore fraction 10-3 (%)2.07.222.415.43.90.17

