Article

First-Principles Investigation of Structural, Electronic and Elastic Properties of HfX (X = Os, Ir and Pt) Compounds

1
School of Materials Science and Engineering, Shanghai Jiao Tong University, Shanghai 200240, China
2
State Key Laboratory of Metal Matrix Composites, Shanghai Jiao Tong University, No. 800 Dongchuan Road, Shanghai 200240, China
*
Authors to whom correspondence should be addressed.
Metals 2017, 7(8), 317; https://doi.org/10.3390/met7080317
Submission received: 12 July 2017 / Revised: 9 August 2017 / Accepted: 10 August 2017 / Published: 18 August 2017
(This article belongs to the Special Issue First-Principles Approaches to Metals, Alloys, and Metallic Compounds)

Abstract

:
The structural, electronic and elastic properties of B2 structure Hafnium compounds were investigated by means of first-principles calculations based on the density functional theory within generalized gradient approximation (GGA) and local density approximation (LDA) methods. Both GGA and LDA methods can make acceptable optimized lattice parameters in comparison with experimental parameters. Therefore, both GGA and LDA methods are used to predict the electronic and elastic properties of B2 HfX (X = Os, Ir and Pt) compounds. Initially, the calculated formation enthalpies have confirmed the order of thermodynamic stability as HfPt > HfIr > HfOs. Secondly, the electronic structures are analyzed to explain the bonding characters and stabilities in these compounds. Furthermore, the calculated elastic properties and elastic anisotropic behaviors are ordered and analyzed in these compounds. The calculated bulk moduli are in the reduced order of HfOs > HfIr > HfPt, which has exhibited the linear relationship with electron densities. Finally, the anisotropy of acoustic velocities, Debye temperatures and thermal conductivities are obtained and discussed.

1. Introduction

Hafnium and Hafnium compounds can be used as the tools and parts in the nuclear power plants due to their high neutron cross sections [1], and medical implants and other medical industry applications owing to their excellent mechanical properties, high corrosive resistant ability and biocompatibility [2]. With the growing importance of Hafnium compounds, the studies on the theoretical and experimental aspects of these compounds have increased [3,4,5,6,7,8,9]. Levy et al. [3] performed a comprehensive study in the structural and thermodynamic properties of binary Hf compounds using ab initio calculations. Among them, the B2 structure is one of the most typical crystal structures for HfX compounds. For example, Novakovic et al. [4] studied the electronic structures, cohesive energies and formation enthalpies of B2 structure HfTM (TM = Co, Rh, Ru and Fe) compounds using ab initio full-potential linearized augmented plane waves calculations. Iyigör et al. [5] reported the structural, electronic, elastic and vibrational properties of HfX (X = Rh, Ru and Tc) using the plane-wave pseudopotential density functional theory via VASP codes. Xing et al. [6] investigated the structural phase stabilities of B2 phases and formation enthalpies of HfM (M = Ir, Os, Pd, Pt, Ru, Rh) using VASP codes. Wu et al. [7] studied the structural, elastic and electronic properties of HfRu compound theoretically. Although the structural features of B2 HfX (X = Os, Ir and Pt) compounds have been achieved discussed experimentally [10,11,12] and theoretically [6,13,14], the elastic and electronic properties of HfX (X = Os, Ir and Pt) compounds are rarely reported and assessed to our knowledge.
Therefore, this work has been organized as the following description. In Section 2, the computational methods of binary HfX (X = Os, Ir and Pt) compounds are presented. In Section 3, the results and discussions are exhibited and analyzed, including structural properties, electronic structures, elastic constants, elastic properties, elastic anisotropy, anisotropic sound velocities, Debye temperatures and thermal conductivities. In Section 4, the conclusions are made in detail.

2. Computational Information

The first-principles calculations based on the pseudopotential plane-wave within density functional theory (DFT) were performed using CASTEP (Cambridge Sequential Total Energy Package) codes [15,16]. The ultrasoft pseudopotential was adopted to simulate the ion-electron interaction [17]. Both generalized gradient approximation (GGA) with the Perdew-Burke-Ernzerhof (PBE) functional [18,19] and the local density approximation (LDA) functional with the form of Ceperley-Adler parameterized by Perdew and Zunger [20] were utilized to model the exchange-correlation. The basis sets have included atom states of Hf5d26s2, Os5s25p65d66s2, Ir5d76s2 and Pt5d96s1. With respect to cutoff energies and k-points, a series of convergence studies were performed. Afterwards, the cutoff energies were set at 400 eV. Besides, the special points sampling integration over the Brillouin zone was employed using Monkhorst-Pack method [21] with determined k-point separation of 0.02/Å in three lattice directions for each compound. Furthermore, the minimization scheme proposed by Brodyden-Fletcher-Goldfarb-Shanno (BFGS) was used during geometric optimization [22]. The tolerances of the geometrical optimization has to meet conditions, including the maximum ionic displacement ≤ 5.0 × 10⁻⁴ Å, maximum ionic force ≤ 0.01 eV/Å, maximum stress ≤ 0.02 GPa, and the difference of total energy ≤ 5.0 × 10⁻⁶ eV/atom. Followed by geometric optimization, the total energy and electronic structure were computed using self-consistent field tolerance of 5.0 × 10⁻⁷ eV/atom. Correspondingly, the lattice constants and atom coordinates were optimized via minimizing the total energy. At equilibrium structures, the corrected tetrahedron Blöchl method was utilized to derive the total energies [23].

3. Results and Discussion

3.1. Structural Properties

HfX (X = Os, Ir and Pt) compounds are in the (CsCl type) Pm3m space group, correspondingly. In an HfX unit cell, an Hf atom locates at 1a (0, 0, 0) and an X atom stays at 1b (0.5, 0.5, 0.5). In order to obtain structural properties of HfX compounds, the geometric optimizations are made firstly. The equilibrium lattice constants using both GGA and LDA methods are tabulated in Table 1, along with the available experimental [10,11,12] and theoretical [6,13,14] values for reference. Generally, the qualities for structural optimizations in HfX compounds using both GGA and LDA methods are comparable and acceptable. In detail, the optimized lattice constants for HfOs and HfIr are in good agreement with theoretical values [6,13,14], respectively. For HfOs and HfIr, the LDA computed values are more approaching to the experimental value. On the other aspect, the GGA method can give better optimized values than the LDA method in HfPt. Therefore, either method shows obvious superiority in the structural optimization of HfX compounds. Resultantly, both GGA and LDA methods are used in the following theoretical studies for HfX compounds.
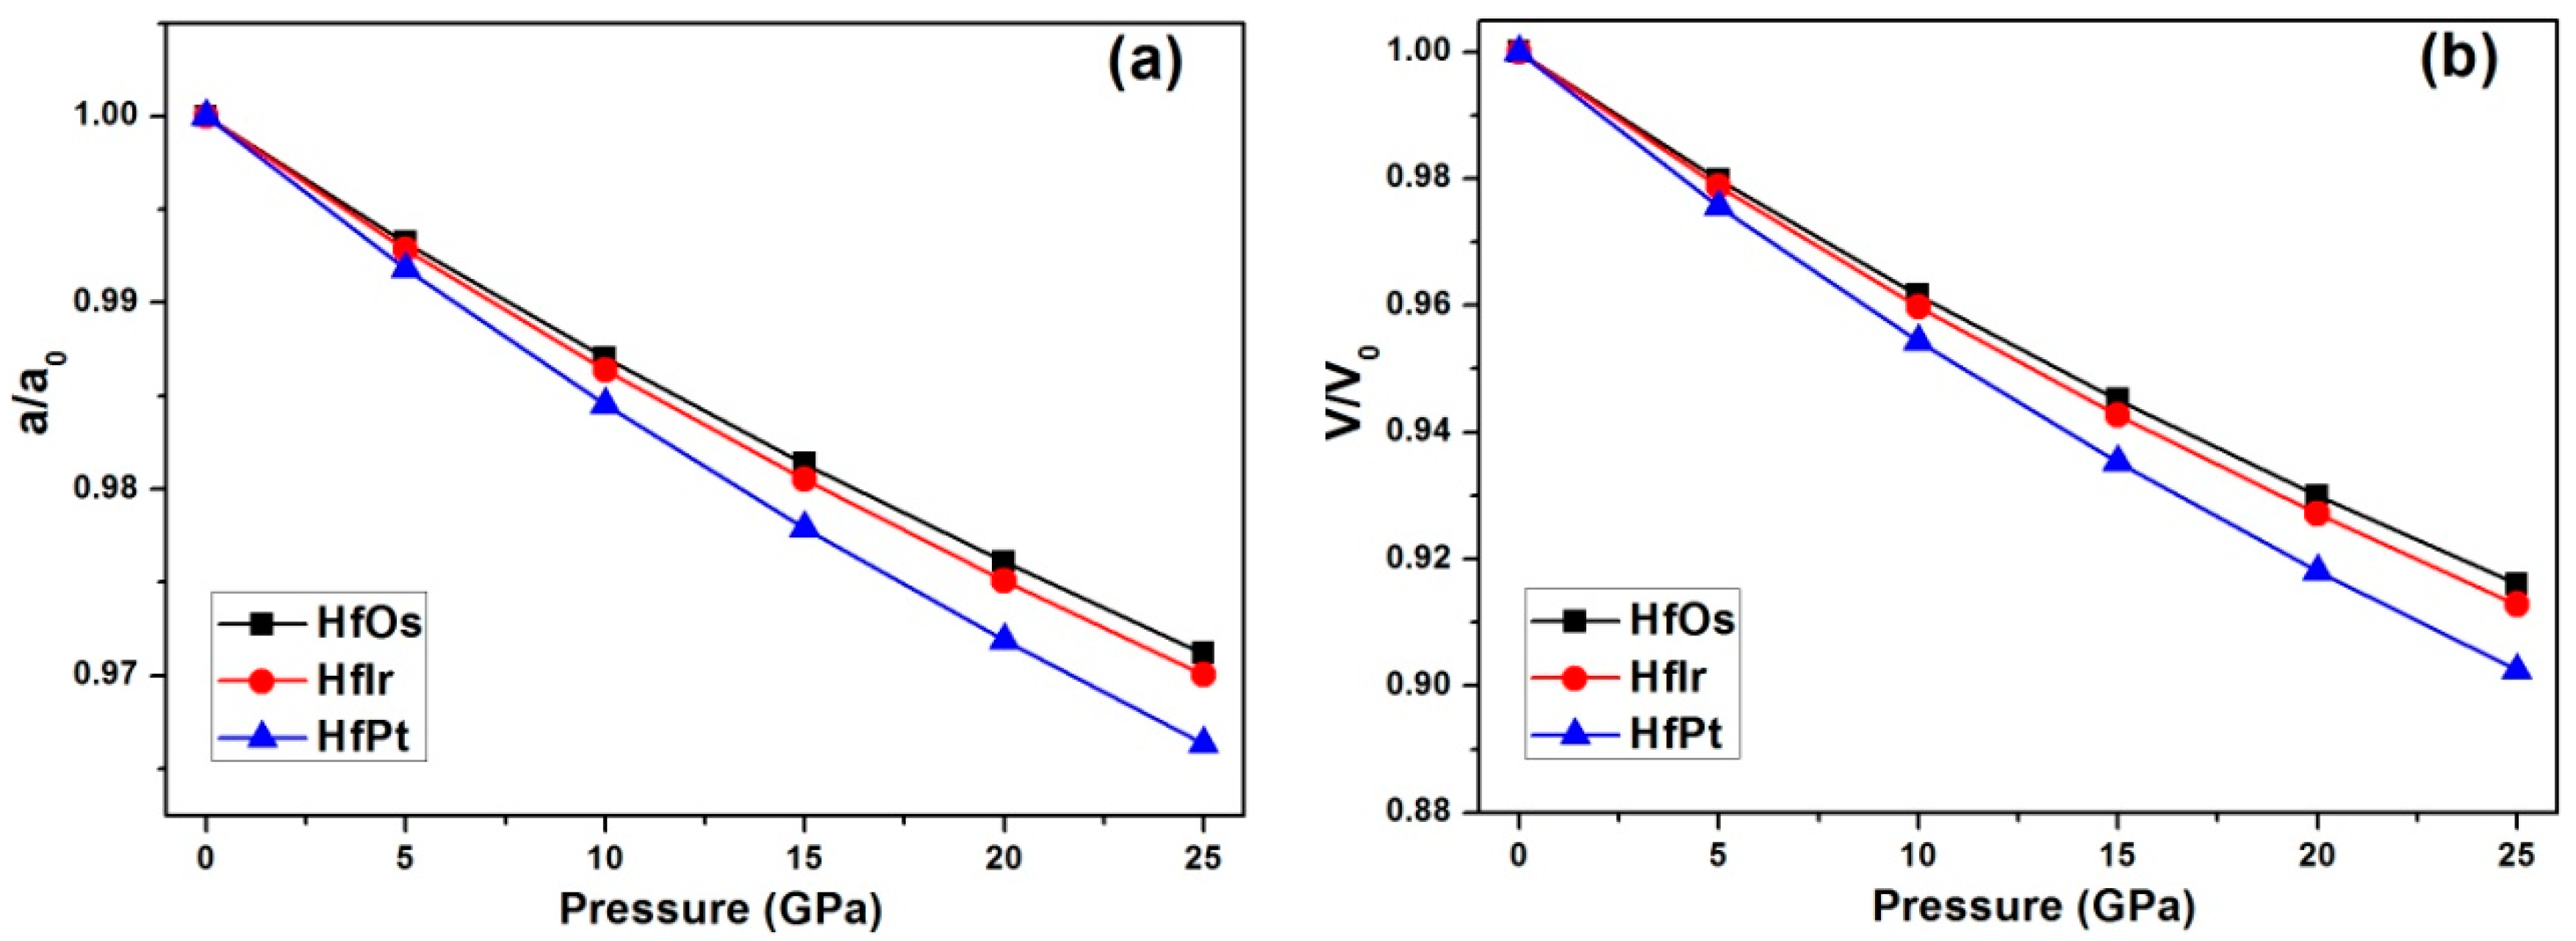
Under increasing pressures from 0 to 25 GPa with per step of 5 GPa, the relative changes of (a) lattice constant and (b) unit cell volume for HfX compounds using GGA method are exhibited in Figure 1. In Figure 1a, the relative change of lattice constant (a) for HfPt is alternated larger than HfIr and HfOs under growing pressures. Similarly, the unit cell volume (V) changes larger in HfPt than HfIr and HfOs under pressures (Figure 1b). Therefore, the obtained pressure volume curve for each compound is formulated to a third-order Birch-Murnaghan equation of state (EOS) [26]:
P = 3 2 B 0 [ ( V V 0 ) 7 3 ( V V 0 ) 5 3 ] { 1 + 3 4 ( B 0 4 ) [ ( V V 0 ) 2 3 1 ] } .
For HfOs, HfIr and HfPt, the fitted bulk moduli (B0) are 234.3 GPa, 220.9 GPa and 191.9 GPa, and their pressure derivatives (B0’) are 4.43, 4.66 and 4.64, accordingly. As a result, the bulk moduli are in the sequence of HfOs > HfIr > HfPt. Using LDA method, the bulk moduli are still in the order of HfOs > HfIr > HfPt, as exhibited in Table 1.
The thermodynamic stability is closely associated with formation enthalpy in binary compounds. To evaluate the thermodynamic stability of a compound, the formation enthalpy (Hf) is expressed by the following equation [27,28]:
H f HfX = E f HfX E Hf E X 2 ,
where E f HfX is the total energy of an HfX unit cell including an Hf atom and an X atom with equilibrium lattice parameters (X = Os, Ir and Pt); EHf and EX are the total energy per atom of pure element solids at their ground states. Hf and Os are HCP metals, and Ir and Pt are FCC metals at ground state.
The negative formation enthalpy has denoted that the chemical process is exothermic, indicating the stability of resulted compounds. Moreover, the larger negative formation enthalpy has signified better stability of a compound [29]. In Table 1, the formation enthalpies of HfX compounds are tabulated. Generally, HfX compounds should be stable owing to their negative formation enthalpies derived from GGA and LDA methods. Furthermore, their thermodynamic stabilities are both in the order of HfPt > HfIr > HfOs. This conclusion is the same with Xing’s work [6]. In detail, the Hf values calculated by GGA method are typically more negative than LDA method. For HfOs, the calculated Hf value by GGA method is in good consistency with experimental value [24] and theoretical value from Liu’s work [14], but smaller than Xing’s [6] and Levy’s [3] reports. For HfIr and HfPt, our calculated Hf values are both smaller than theoretical values from Xing’s work [6] and experimental values from Gachon’s report [25]. Nevertheless, the crystal structures for HfIr and HfPt are not mentioned in this experimental work [25], which has degraded the reference value of this experimental work.

3.2. Density of States

The analyses on the total and partial density of states (DOS) are performed to further study the bonding characteristics and underlying mechanism of the structural stability of HfX compounds. Therefore, the total DOS (TDOS) and partial DOS (PDOS) computed by GGA method are presented and discussed herein. In Figure 2a, the Fermi level (EF) is plotted at zero energy in all TDOS and PDOS spectra. Typically, there is not any energy gap identified near Fermi level for HfOs (Figure 2a), HfIr (Figure 2b) and HfPt (Figure 2c) in the TDOS, suggesting their essence of metallicity.
In the TDOS for HfOs (Figure 2a), the bonding interactions are dominated by the hybridization of Hfs and Oss states at −10 to −6 eV at the bonding states. Around the bonding states, the Osd states as the major role have intensively hybridized with the Hfd states as the minor role below the Fermi level. The two states have changed their roles in the hybridizations of above the Fermi level at the antibonding states. Around the Fermi level, a valley referring as a pseudogap, which is symbolized as the presence of covalent bonds [30,31], is considered to be the most observable feature in the TDOS. The pseudogaps have existed in the TDOS for HfOs (Figure 2a), HfIr (Figure 2b) and HfPt (Figure 2c), although their locations are different on energy scales. The pseudogap is located at the antibonding states for HfOs (Figure 2a), at the bonding states for HfIr (Figure 2b), and at the bonding states with the more negative energy states for HfPt (Figure 2c). Such differences should suggest HfOs has the least bonding stability.
For the sake of judging the structural stability of HfX compounds, the number of bonding electrons per atom is calculated based on the TDOS spectra. Since the charge interaction among bonding atoms is the critical factor to material’s stability, the compound possessing higher number of bonding electrons should be more structurally stable [32,33,34,35]. For HfOs, HfIr and HfPt phases, the number of bonding electrons per atom are 6.013, 6.493 and 6.995, accordingly. Conclusively, the HfX phases have the stability order of HfPt > HfIr > HfOs. This conclusion is in good accordance with the thermodynamic analysis shown in Table 1.

3.3. Elastic Properties

The elastic constants and elastic moduli are the critical information to study the mechanical properties of compounds. A full set of elastic constant for cubic crystal, including C11, C12 and C44, can be achieved using the stress-train method [36] (Table 2). Observably, the elastic constants obtained by LDA method are larger than GGA method in HfX compounds. In HfOs, the elastic constants derived from GGA method has agreed well with theoretical values from Arıkan’s [13] and Liu’s work [14]. Meanwhile, the elastic constants for pure Hf metal are calculated and presented with the published experimental values [37] for comparison, where the GGA computed elastic constants are in better agreement with experimental values [37].
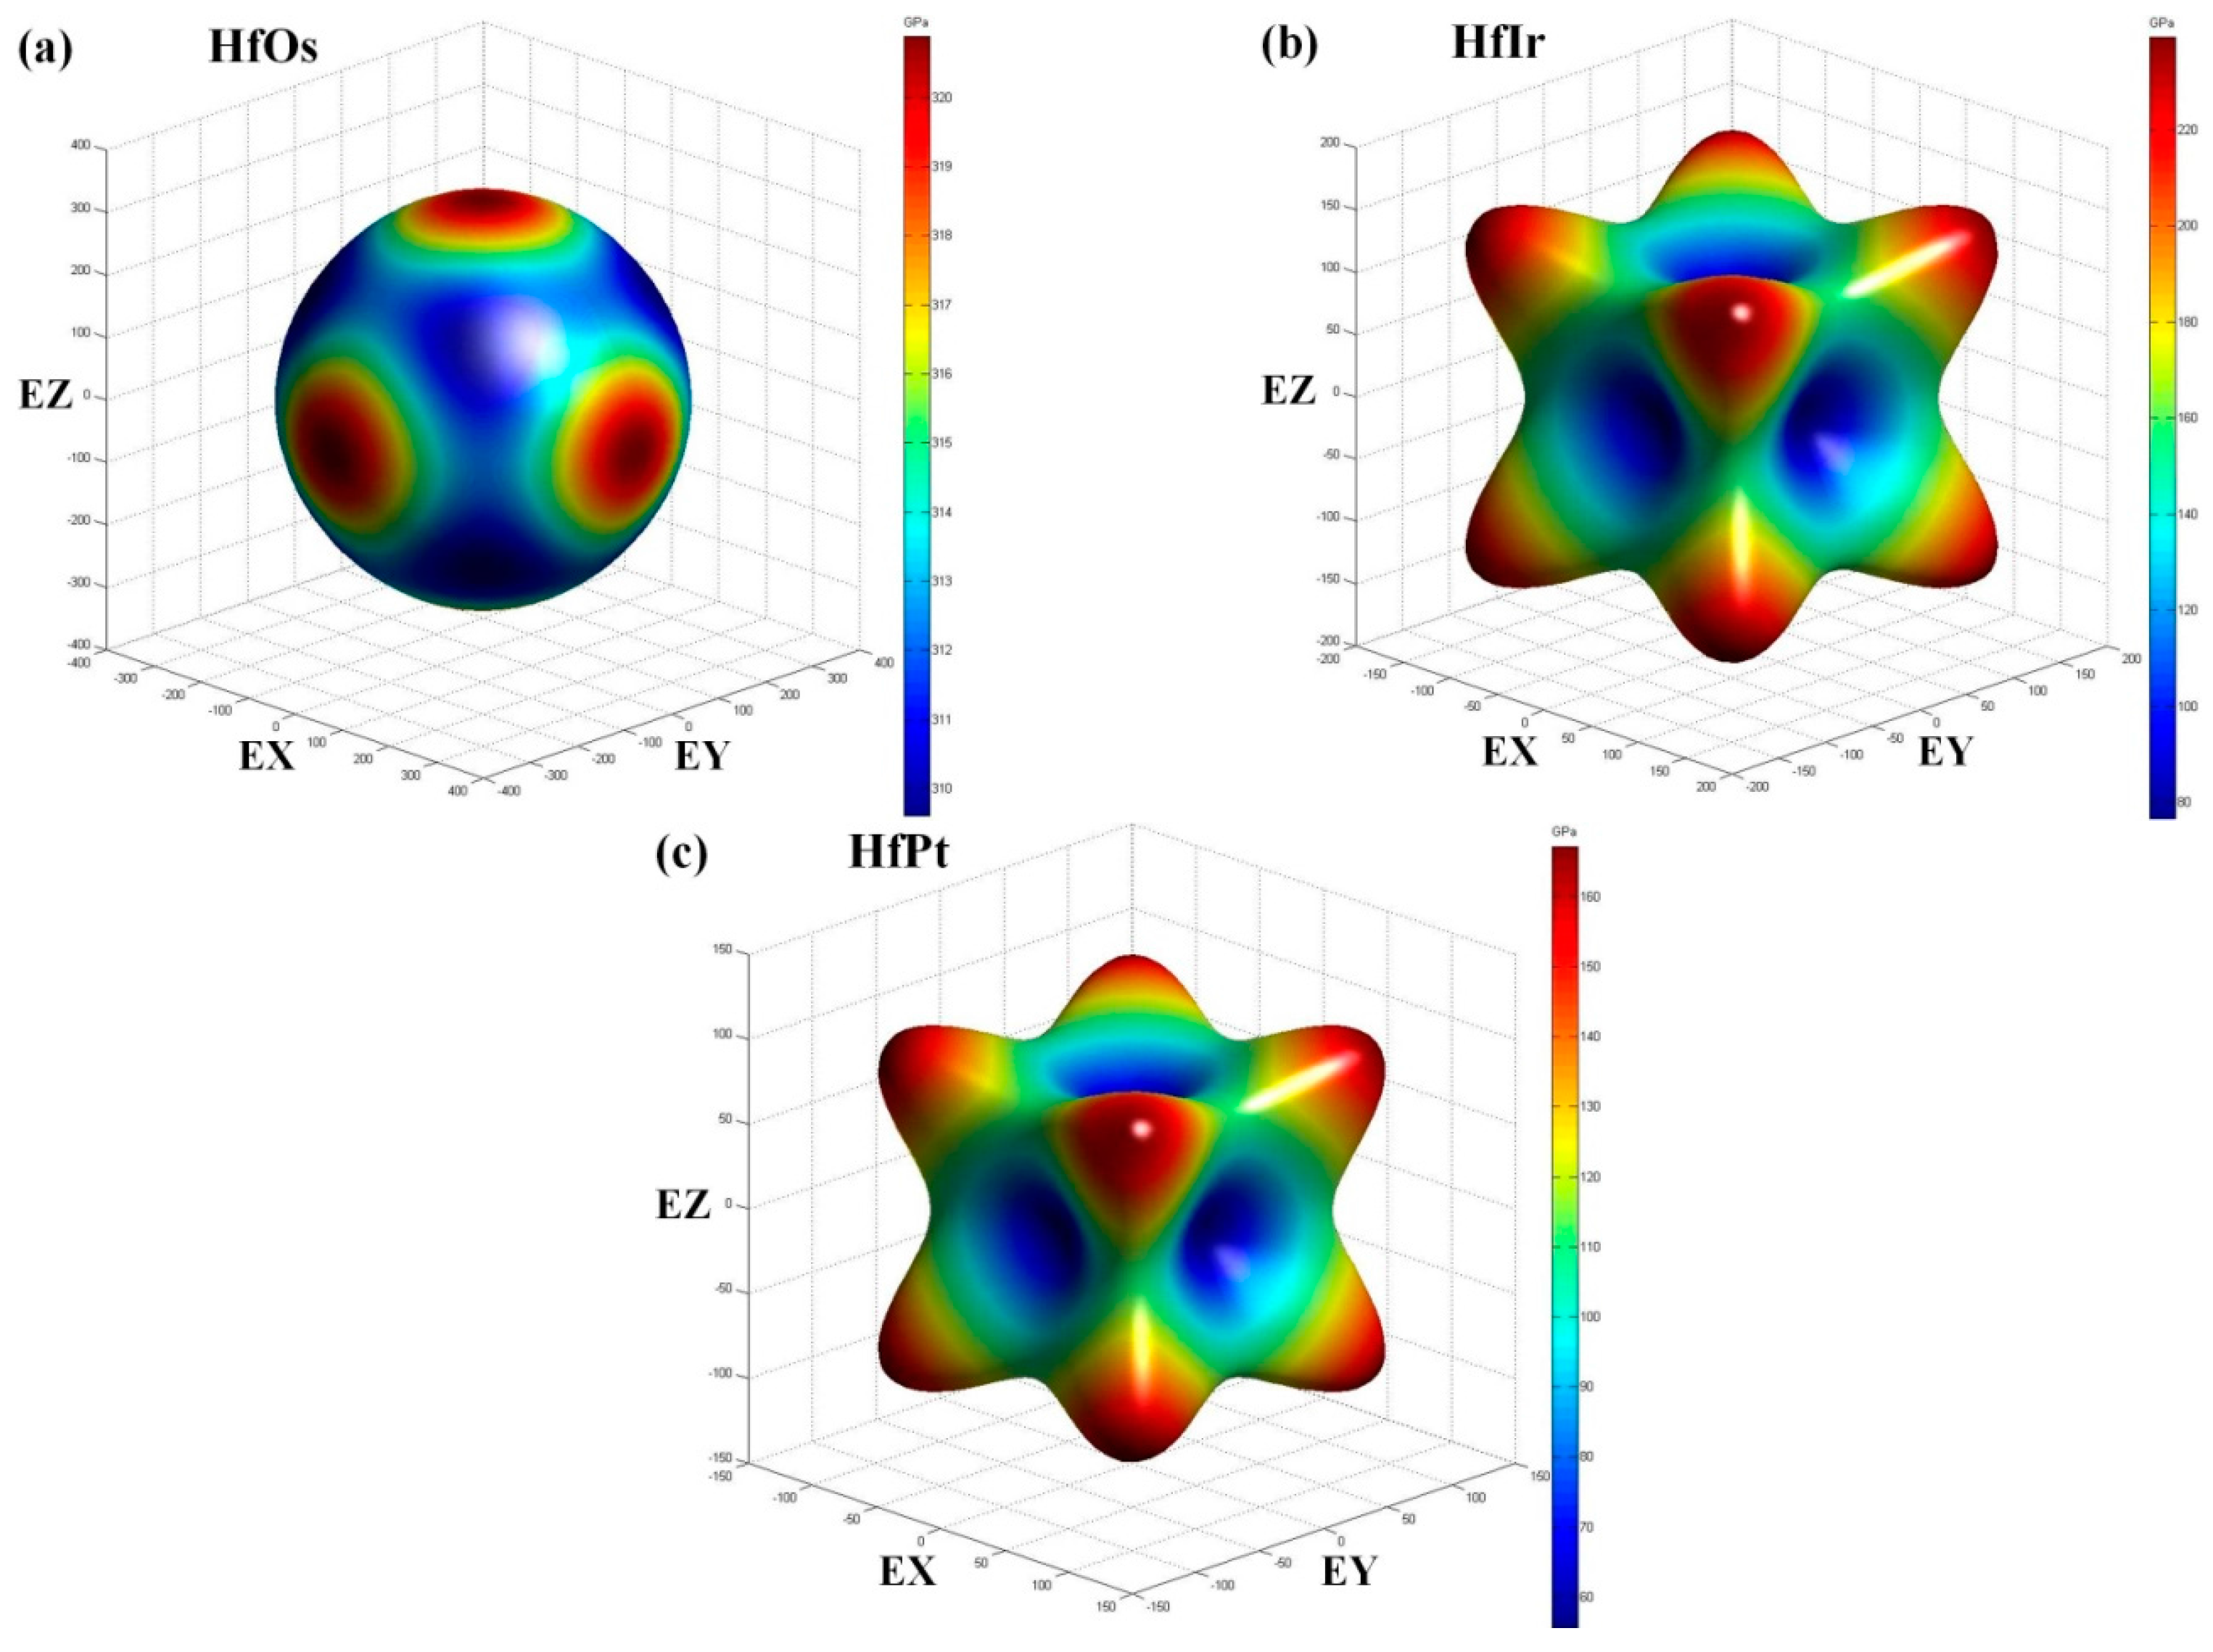
In order to analyze the elastic properties of HfX compounds, the elastic constants generated using GGA method are used as the example. C11 is the symbol of compressive resistance along x axis. In each compound, the calculated C11 has the largest value, indicating the incompressible essence of the compound under the x direction uniaxial stress [38]. HfOs has the most incompressible ability owing to the largest C11 (402.1 GPa). Moreover, a larger C44 (121.0 GPa) can reflect a stronger resistance to monoclinic shear in (100) plane, suggesting HfOs also has the strongest ability to resist shear distortion in (100) plane.
Furthermore, the mechanical stability is evaluated by Born’s criteria [39] for cubic crystals:
C11 > 0; C44 > 0; C11C12 > 0; C11 + 2C12 > 0.
HfX (X = Os, Ir and Pt) compounds are all found mechanically stable at the ground state by the successful validation of Born’s criteria.
In the engineering application, the elastic properties, i.e., bulk modulus (B), shear modulus (G), and Young’s modulus (E), are demanded in practice. Generally, the elastic properties can be derived from Voigt-Reuss-Hill (VRH) methods using elastic constants [40]. For cubic crystals, the equations are expressed as following [27,41,42]:
B V = B R = 1 3 ( C 11 + 2 C 12 ) ,
G V = 1 5 ( C 11 C 12 + 3 C 44 ) ,
G R = 5 ( C 11 C 12 ) C 44 4 C 44 + 3 ( C 11 C 12 ) ,
B = B V + B G 2 ,
G = G V + G G 2 ,
As soon as the bulk and shear moduli are achieved, Young’s modulus (E) and Poisson’s ratio (ν) can be predicted:
E = 9 B G 3 B + G ,
ν = 3 B 2 G 2 ( 3 B + G ) ,
The calculated elastic moduli, Poisson’s ratio and B/G ratio using the VRH method at the ground state are tabulated for HfX compounds in Table 3, including the elastic moduli for pure Hf results for comparison. Overall, the elastic moduli obtained using GGA method are smaller than those provided by LDA method. Comparably, the calculated elastic moduli generated by the GGA method are in good agreement with theoretical values for HfOs. In detail, the elastic moduli are all larger than pure Hf in HfOs. However, HfIr has the similar shear and Young’s modulus over pure Hf, and HfPt owns the smaller values correspondingly. Therefore, HfOs should be a credible hardening phase in pure Hf.
Typically, the bulk modulus (B) suggests the resistant ability against volume change under pressure of materials. In addition, the bulk moduli calculated by both methods using VRH principles are in good agreement with those provided by the EOS equations (Table 1), confirming good self-consistency of this work. From 
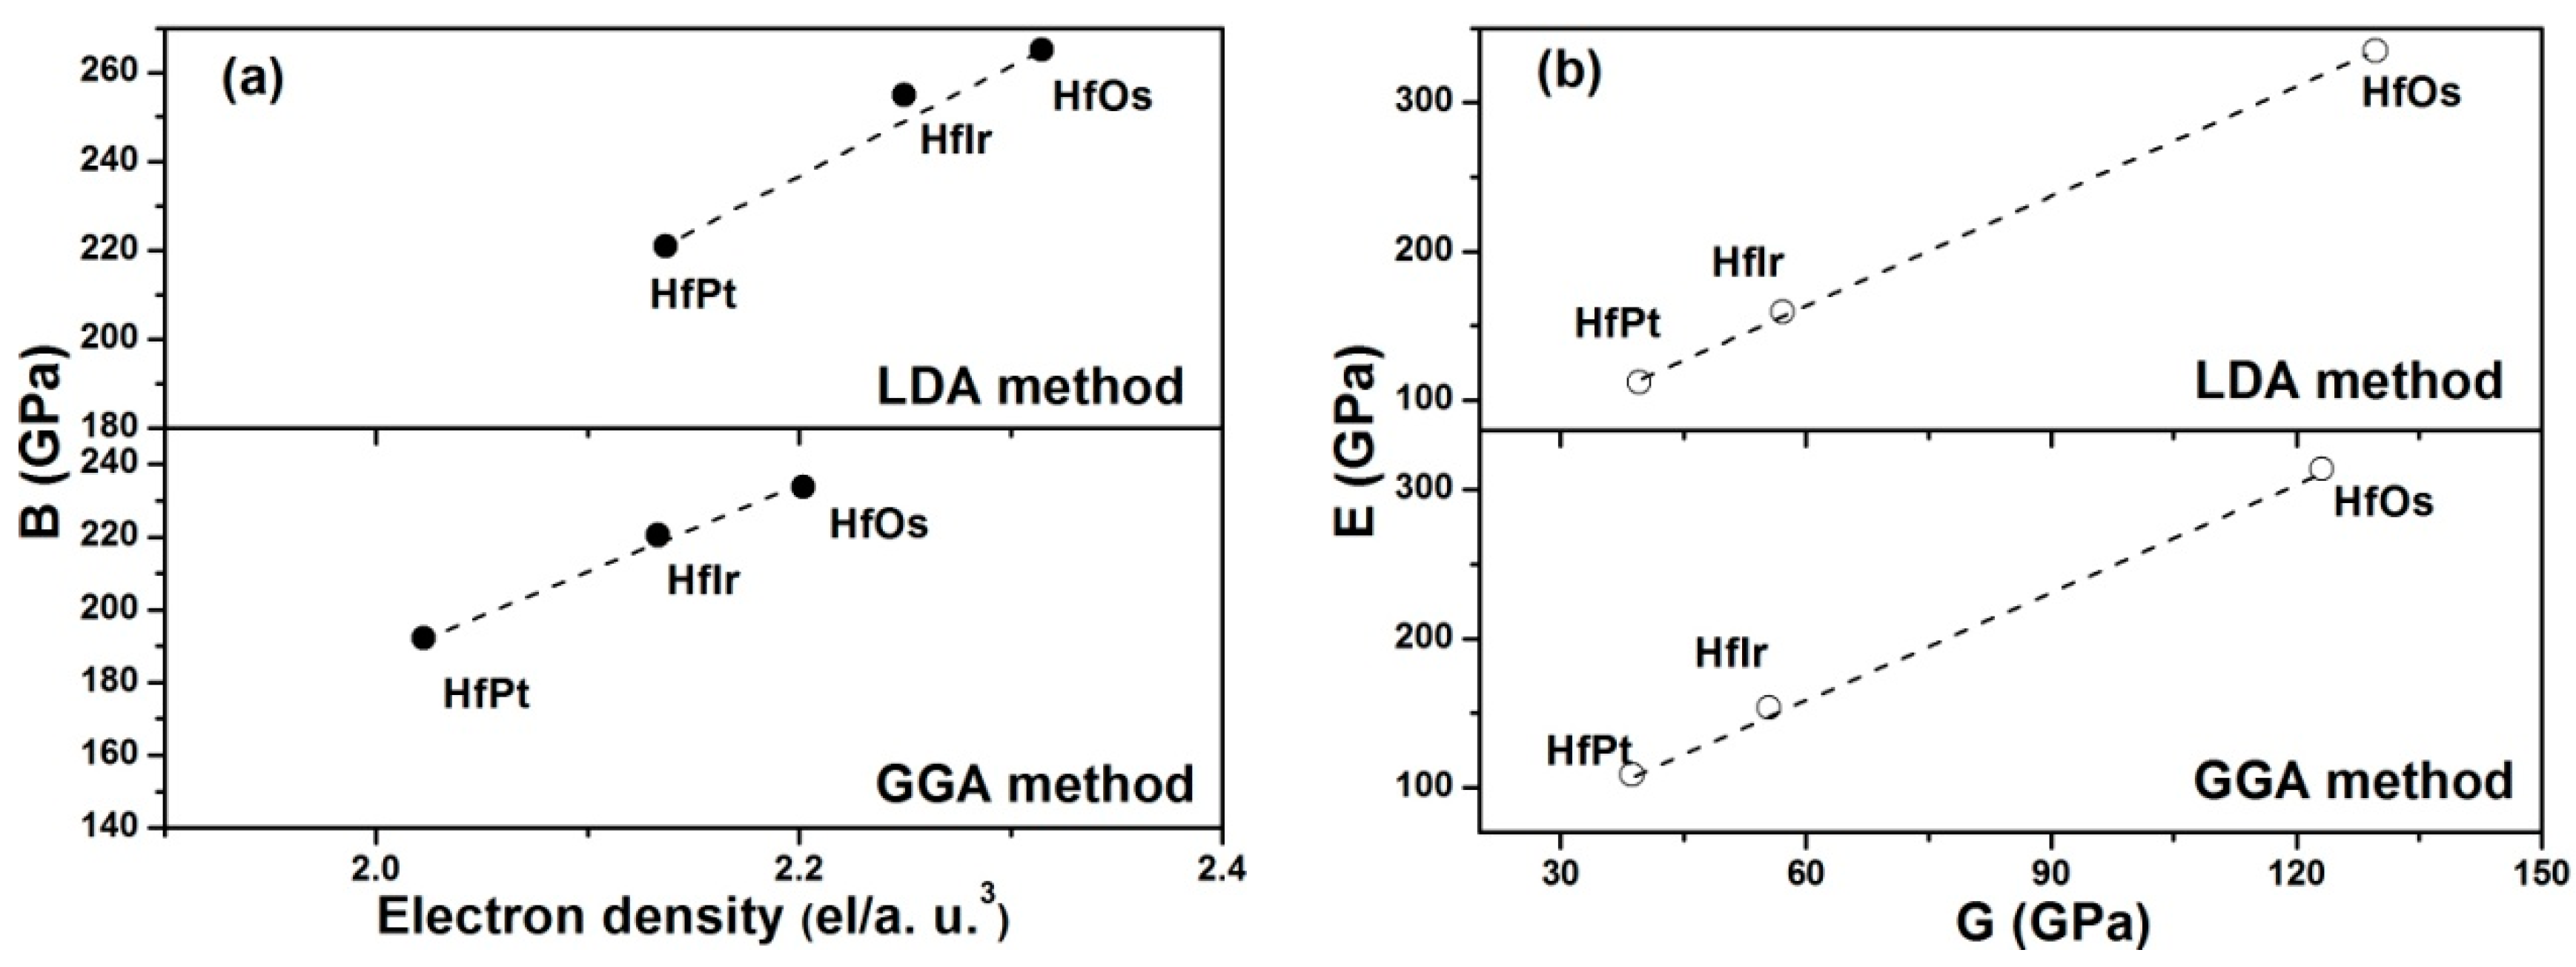
Table 3, it is seen that HfOs possesses the largest resistance to volume change by applied pressure, while HfPt has the smallest. In order to illustrate the fundamental factor on bulk moduli of HfX compounds, the relationship between electron densities and bulk moduli are constructed in Figure 3a. Herein, the electron density (n) is the quotient of the bonding valence (ZB) and the volume per atom (VM) in metal [43]. For example, the electron density (n) is evaluated using the following equation in HfX compounds:
n ( HfX ) = Z B ( HfX ) / V M ( HfX ) ,
where VM(HfX) is the volume (cm3/mol) of each HfX compound; ZB(HfX) is the bonding valence in (el/atom) rationalized from Vegard’s law [44]:
Z B ( HfX ) = ( Z B ( Hf ) + Z B ( X ) ) / 2 ,
where the bonding valence of pure element can be found in the reference [45].
In Figure 3a, the correlation between the electron density and bulk modulus can be constructed using the computed values either by LDA or GGA method. In detail, the linear relationships between the electron density and bulk modulus are clearly seen in HfX compounds.
The shear modulus has reflected the resistance to reversible deformations under the shear stress [27]. A larger shear modulus for HfOs suggests its higher resistance to reversible deformations. Young’s modulus is a symbol of the stiffness of a solid [46]. The material with a larger Young’s modulus is stiffer. Therefore, HfOs is much stiffer than any other considered HfX compounds due to its higher Young’s modulus. Overall, Young’s modulus has linearly improved with the shear modulus in the order of HfOs > HfIr > HfPt for both LDA and GGA methods (Figure 3b).
The B/G value [47] and Poisson’s ratio (ν) [32,48] have determined the brittleness and ductility of the solid. A solid with B/G < 1.75 or ν < 0.26 is usually brittle. Otherwise, it is ductile. In Table 3, it is found the HfPt is the most ductile compound with the largest B/G value and Poisson’s ratio, and HfOs is the least ductile compound owing to the smallest B/G value and Poisson’s ratio. Notably, the HfX compounds have similar ductile essence due to the small variations of B/G values and Poisson’s ratios using both GGA and LDA methods.
The hardness (HV) is associated with the plastic and elastic properties of an intermetallic compound. The hardness can be calculated by a semi-empirical equation [49]:
H V = 0.92 ( G / B ) 1.137 G 0.708 ,
where B and G are the bulk modulus and shear modulus, respectively.
The hardness values (HV) of HfX (X = Os, Ir and Pt) compounds are tabulated in Table 3. Generally, the hardness is related with the values of G/B and G that the high values of G/B and G correspond to the high hardness. It is seen that the hardness value computed by GGA method is a bit larger than LDA method. Overall, the hardness values (HV) have followed the order of HfPt < HfIr < HfOs in both GGA and LDA methods.

3.4. Elastic Anisotropy

The degree of elastic anisotropy is a critical property related to the engineering application. The universal anisotropic index (AU) [50] is a universal measure to quantify the single crystalline elastic anisotropy in consideration of the contributions from both the bulk and the shear modulus, i.e., [51],
A U = 5 G V G R + B V B R 6 ,
where BV and GV are the symbols of the Voigt bounds for bulk and shear modulus, respectively. BR and GR are the symbols of the Reuss bounds for bulk and shear modulus, respectively.
If AU = 0 for a crystal, the crystal should be isotropic. A larger deviation of AU from zero has indicated a severer degree of anisotropy. In cubic crystals, BV/BR is always equal to 1. Therefore, the universal anisotropic index is governed by GV/GR. Therefore, the calculated universal anisotropies by both LDA and GGA methods (Table 4) are reduced in the sequence of HfIr > HfPt > HfOs. In detail, HfIr and HfOs have the largest and smallest universal anisotropies, respectively.
In order to describe the elastic anisotropic behavior more directly and effectively, the three-dimensional (3D) surface constructions of the directional dependence of reciprocal of Young’s modulus have also been studied by following equations [52]:
1 E = S 11 2 ( S 11 S 12 S 44 2 ) ( l 1 2 l 2 2 + l 2 2 l 2 3 + l 1 2 l 3 2 ) ,
where Sij is the usual elastic compliance constant, which can be obtained from the inverse of the matrix of elastic constants; l1, l2 and l3 are the direction cosines in the sphere coordination.
If the 3D directional dependence of Young’s modulus exhibits a spherical shape, the crystal is ideal isotropic. Practically, the deviation extent from the spherical shape has reflected the degree of anisotropy. In Figure 4a, HfOs shows a quite spherical shape, signifying its near isotropic behavior. Furthermore, HfIr exhibits the largest deviation from the sphere shape with the strongest deviation along the <111> directions, confirming its intensive anisotropic behavior. Generally, the degree of the elastic anisotropy for HfX has followed the increasing order of HfOs < HfPt < HfIr. This conclusion is in good compliance with the result generated from the universal anisotropic index.

3.5. Anisotropy of Acoustic Velocities and Debye Temperature

In the crystalline material, the sound velocities are related to the crystal symmetry and the propagation direction. In cubic crystals, the pure transverse and longitudinal modes can be found in [111], [110] and [001] directions. With respect to other directions, the sound propagating modes have included the quasi-transverse or quasi-longitudinal waves. Therefore, the sound velocities can be derived from elastic constants using following expressions [53]:
[ 100 ] v l = C 11 / ρ ; [ 010 ] v t 1 = [ 001 ] v t 2 = C 44 / ρ ,
[ 110 ] v l = ( C 11 + C 12 + C 44 ) / ( 2 ρ ) ,
[ 1 1 ¯ 0 ] v t 1 = ( C 11 C 12 ) / ρ , [ 001 ] v t 2 = C 44 / ρ ,
[ 111 ] v 1 = ( C 11 + 2 C 12 + 4 C 44 ) / ( 3 ρ ) ,
[ 11 2 ¯ ] v t 1 = [ 11 2 ¯ ] v t 2 = ( C 11 C 12 + C 44 ) / ( 3 ρ ) ,
where ρ is the density; vl is the longitudinal sound velocity; vt1 and vt2 refer to the first and the second transverse mode of sound velocity, respectively.
Generally, C11 has determined the longitudinal sound velocity along [100] direction. C44 is related to the transverse modes along [010] and [001] directions. C11, C12 and C44 can influence the longitudinal sound velocities along [110] and [111] directions in combination.
The longitudinal and the transverse sound velocities by both LDA and GGA methods along [100], [110] and [111] directions for HfX compounds are exhibited in Table 5. For the sound velocities obtained from LDA method, the longitudinal sound velocity vl of each compound is reduced in the order of [111] > [110] > [100]. The anisotropic properties of sound velocities have also confirmed the elastic anisotropies in these cubic crystals. Meanwhile, the sound velocities derived from GGA method have shown the similar tendencies with those from LDA method.
The theoretically calculated structural properties (i.e., density) and elastic properties (i.e., Bulk modulus, shear modulus and Poisson’s ratio) can be used to deduce Debye temperature (Θ), as shown in the following equation [26,54]:
Θ = h k [ 3 n 4 π ( N A ρ M ) ] 1 3 v D ,
where h is Planck’s constant (h = 6.626 × 10⁻³⁴ J/s); NA is Avogadro’s number (NA = 6.023 × 10⁻²³/mol); k is Boltzmann’s constant (k = 1.381 × 10⁻²³ J/K); M is the molecular weight; n is the number of atoms per formula unit.
vD is the average sound velocity in polycrystalline materials, as exhibited using the equation:
v D = [ 1 3 ( 1 v L 3 + 2 v T 3 ) ] 1 3 ,
where vT and vL are the transverse and longitudinal sound velocities, including:
v T = G ρ ,
v L = B + 4 3 G ρ ,
Table 6 shows the sound velocity (m/s) and Debye temperature (K) for HfX (X = Os, Ir and Pt) calculated by GGA and LDA methods. Generally, these values calculated by LDA method have the larger values than those computed by GGA method. Specifically, the following reduced orders have shown as HfOs > HfIr > HfPt in Debye temperatures.

3.6. Thermal Conductivity

The thermal conductivities (k) is a useful physical parameter for practical applications. The thermal conductivity is reduced with elevating temperature to a limiting value known as the minimum thermal conductivity (kmin), which can be evaluated according to Cahill’s model [55]:
k min = k 2.48 n 2 3 ( v l + v t 1 + v t 2 ) ,
where k is Boltzmann constant; n is the number of density of atoms per volume. vl and vt are the longitudinal and transverse sound velocities, respectively (Table 7).
Table 7 exhibits the calculated kmin values using Cahill’s model. Generally, the lattice thermal conductivity and the electronic thermal conductivity are the main compositions to the total thermal conductivity. At lower temperature, the effect from electron-phonon scattering is considered limited. Therefore, the thermal conductivities of HfX (X = Os, Ir and Pt) are ascribed to the lattice thermal conductivities at the ground state. The derived thermal conductivities are found small thereby. Based on Callaway-Debye theory [56], the lattice thermal conductivity is proportional to Debye temperature. It means a higher Debye temperature should correspond to a larger lattice thermal conductivity. Therefore, HfOs has the larger thermal conductivity than HfIr and HfPt in order. It is seen that the values offered by the GGA method are always smaller, but own the similar tendency with the LDA method. These HfX compounds show the relatively lower thermal conductivities, indicating that they are poor thermal conductors at the ground state.
Cahill’s model is suitable to discuss the anisotropic behavior of compounds on the thermal conductivity, since it has involved with treating the total thermal conductivity in association with each acoustic branch. For instance, it is seen that the calculated thermal conductivities have exhibited anisotropic behaviors owing to the differences of vl, vt1 and vt2 along [100], [110] and [111] directions. In detail, kmin[111] is always smaller than kmin[100] and kmin[110], suggesting that the dependence of thermal conductivities along [111] direction is less prominent than those along [100] and [110] directions. Although there is lacking experimental values for comparison, our theoretical results should prove the guidance for future studies.

4. Conclusions

The structural, electronic and elastic properties of B2 HfX (X = Os, Ir and Pt) compounds have been studied using first-principles calculations. Initially, the structural optimizations are comparable and acceptable for HfX compounds using both GGA and LDA methods. The calculated formation enthalpies by GGA and LDA methods have confirmed that the thermodynamic stability is in the order of HfPt > HfIr > HfOs. Secondly, the calculated electronic structures are derived, and similar features are identified in DOS spectra for HfX. The results show the sequence of structural stability should be HfPt > HfIr > HfOs, which is in good agreement with thermodynamic analyses. Mechanically, the elastic moduli obtained by GGA method are typically smaller than LDA method. In detail, the calculated bulk moduli using VRH method are in good agreement with those provided by EOS equation. Besides, the calculated bulk moduli are in the order of HfOs > HfIr > HfPt, where the bulk moduli can be correlated with electron densities in compounds. Additionally, Young’s modulus has augmented linearly with the shear modulus. HfOs has the Young’s modulus of 314.1 GPa and hardness of 13.4 GPa by GGA method, which should be a credible hardening phase in pure Hf. Then, the ductile essence is in the sequence of HfPt > HfIr > HfOs according to the analyses on Poisson’s ratio and B/G ratio. Based the universal anisotropic indexes and 3D surface constructions, the elastic anisotropy has followed the increasing order of HfIr > HfPt > HfOs. Finally, the anisotropy of acoustic velocities, Debye temperatures and thermal conductivities are obtained and discussed. Our results are hoped to inspire future experimental and theoretical investigations on these Hf-based compounds.

Acknowledgments

This work is sponsored by the Research Fund (Project No. 15X100040018) at Shanghai Jiao Tong University, China.

Author Contributions

Xianfeng Li has conducted on the literature search, data collection, data analysis, data interpretation and writing the manuscript. Cunjuan Xia has conducted on the data collection, figure preparation and commenting on the manuscript. Mingliang Wang has conducted on the literature search, study design, data interpretation and revising the manuscript. Yi Wu has conducted on the data analysis, figure preparation and commenting on the manuscript. Dong Chen has conducted on the study design, data analysis, data interpretation and revising the manuscript.

Conflicts of Interest

The authors declare no conflict of interest.

References

  1. Wallenius, J.; Westlén, D. Hafnium clad fuels for fast spectrum BWRs. Ann. Nucl. Energy 2008, 35, 60–67. [Google Scholar] [CrossRef]
  2. Herranz-Diez, C.; Mas-Moruno, C.; Neubauer, S.; Kessler, H.; Gil, F.J.; Pegueroles, M. tuning mesenchymal stem cell response onto titanium-niobium-hafnium alloy by recombinant fibronectin fragments. ACS Appl. Mater. Interfaces 2016, 8, 2517–2525. [Google Scholar] [CrossRef] [PubMed] [Green Version]
  3. Levy, O.; Hart, G.L.; Curtarolo, S. Hafnium binary alloys from experiments and first principles. Acta Mater. 2010, 58, 2887–2897. [Google Scholar] [CrossRef]
  4. Novaković, N.; Ivanović, N.; Koteski, V.; Radisavljević, I.; Belošević-Čavor, J.; Cekić, B. Structural stability of some CsCl structure HfTM (TM = Co, Rh, Ru, Fe) compounds. Intermetallics 2006, 14, 1403–1410. [Google Scholar] [CrossRef]
  5. İyigör, A.; Özduran, M.; Ünsal, M.; Örnek, O.; Arıkan, N. Ab-initio study of the structural, electronic, elastic and vibrational properties of HfX (X = Rh, Ru and Tc). Philos. Mag. Lett. 2017, 97, 110–117. [Google Scholar] [CrossRef]
  6. Xing, W.; Chen, X.Q.; Li, D.; Li, Y.; Fu, C.L.; Meschel, S.V. First-principles studies of structural stabilities and enthalpies of formation of refractory intermetallics: TM and TM3 (T = Ti, Zr, Hf; M = Ru, Rh, Pd, Os, Ir, Pt). Intermetallics 2012, 28, 16–24. [Google Scholar] [CrossRef]
  7. Wu, J.; Liu, S.; Zhan, Y.; Yu, M. Ternary addition and site substitution effect on B2 RuHf-based intermetallics: A first-principles study. Mater. Des. 2016, 108, 230–239. [Google Scholar] [CrossRef]
  8. Gueorguiev, G.K.; Pacheco, J.M. Silicon and metal nanotemplates: Size and species dependence of structural and electronic properties. J. Chem. Phys. 2003, 119, 10313. [Google Scholar] [CrossRef]
  9. Gueorguiev, G.K.; Pacheco, J.M.; Stafström, S.; Hultman, L. Silicon-metal clusters: Nano-templates for cluster assembled materials. Thin Solid Films 2006, 515, 1192. [Google Scholar] [CrossRef]
  10. Dwight, A.E. CsCl-type equiatomic phases in binary alloys of transition elements. Trans. AIME 1959, 215, 283–286. [Google Scholar]
  11. Korniyenko, K.Y.; Kriklya, L.S.; Khoruzhaya, V.G. The Hf-Ir-Ru (Hafnium-Iridium-Ruthenium). J. Ph. Equilib. Diffus. 2014, 35, 369–376. [Google Scholar] [CrossRef]
  12. Stalick, J.K.; Waterstrat, R.M. The hafnium-platinum phase diagram. J. Ph. Equilib. Diffus. 2014, 35, 15–23. [Google Scholar] [CrossRef]
  13. Arıkan, N.; Örnek, O.; Charifi, Z.; Baaziz, H.; Uğur, Ş.; Uğur, G. A first-principle study of Os-based compounds: Electronic structure and vibrational properties. J. Phys. Chem. Solids 2016, 96–97, 121–127. [Google Scholar] [CrossRef]
  14. Liu, Q.J.; Zhang, N.C.; Liu, F.S.; Liu, Z.T. Structural, mechanical and electronic properties of OsTM and TMOs2 (TM = Ti, Zr and Hf): First-principles calculations. J. Alloys Compd. 2014, 589, 278–282. [Google Scholar] [CrossRef]
  15. Segall, M.D.; Lindan, P.J.; Probert, M.J.; Pickard, C.J.; Hasnip, P.J.; Clark, S.J. First-principles simulation: ideas, illustrations and the CASTEP code. J. Phys. Condens. Matter 2002, 14, 2717–2744. [Google Scholar] [CrossRef]
  16. Clark, S.J.; Segall, M.D.; Pickard, C.J.; Hasnip, P.J.; Probert, M.J.; Refson, K. First principles methods using CASTEP. Z. Kristallogr. 2005, 220, 567–570. [Google Scholar] [CrossRef] [Green Version]
  17. Vanderbilt, D. Soft self-consistent pseudopotentials in a generalized eigenvalue formalism. Phys. Rev. B 1990, 41, 7892. [Google Scholar] [CrossRef]
  18. Perdew, J.P.; Wang, Y. Accurate and simple analytic representation of the electron-gas correlation energy. Phys. Rev. B 1992, 45, 13244. [Google Scholar] [CrossRef]
  19. Perdew, J.P.; Burke, K.; Ernzerhof, M. Generalized gradient approximation made simple. Phys. Rev. Lett. 1996, 77, 3865. [Google Scholar] [CrossRef] [PubMed]
  20. Perdew, J.P.; Zunger, A. Self-interaction correction to density-functional approximations for many-electron systems. Phys. Rev. B 1981, 23, 5048–5079. [Google Scholar] [CrossRef]
  21. Shanno, D.F. Conditioning of quasi-Newton methods for function minimization. Math. Comput. 1970, 24, 647–656. [Google Scholar] [CrossRef]
  22. Fischer, T.H.; Almlof, J. General Methods for Geometry and Wave Function Optimization. J. Chem. Phys. 1992, 96, 9768–9774. [Google Scholar] [CrossRef]
  23. Blöchl, P.E.; Jepsen, O.; Andersen, O.K. Improved tetrahedron method for Brillouin-zone integrations. Phys. Rev. B 1994, 49, 16223. [Google Scholar] [CrossRef]
  24. Mahdouk, K.; Gachon, J.C. Calorimetric study of the Hf-Os and Os-Ti system. J. Alloys Compd. 1998, 278, 185–189. [Google Scholar] [CrossRef]
  25. Gachon, J.C.; Selhaoui, N.; Aba, B.; Hertz, J. Comparison between measured and predicted enthalpies of formation. J. Ph. Equilib. 1992, 13, 506–511. [Google Scholar] [CrossRef]
  26. Zhong, S.Y.; Chen, Z.; Wang, M.; Chen, D. Structural, elastic and thermodynamic properties of Mo3Si and Mo3Ge. Eur. Phys. J. B 2016, 89, 6. [Google Scholar] [CrossRef]
  27. Chen, D.; Chen, Z.; Wu, Y.; Wang, M.; Ma, N.; Wang, H. First-principles investigation of mechanical, electronic and optical properties of Al3Sc intermetallic compound under pressure. Comput. Mater. Sci. 2014, 91, 165–172. [Google Scholar] [CrossRef]
  28. Chen, D.; Xia, C.; Chen, Z.; Wu, Y.; Wang, M.; Ma, N. Thermodynamic, elastic and electronic properties of AlSc2Si2. Mater. Lett. 2015, 138, 148–150. [Google Scholar] [CrossRef]
  29. Shang, X.; Shen, J.; Tian, F. A first-principles study of the tetragonal and hexagonal R2Al (R = Cr, Zr, Nb, Hf, Ta) phases. Mater. Res. Express 2016, 3, 106503. [Google Scholar] [CrossRef]
  30. Krajci, M.; Hafner, J. Covalent bonding and bandgap formation in intermetallic compounds: A case study for Al3V. J. Phys. Condens Matter 2002, 14, 1865–1879. [Google Scholar] [CrossRef]
  31. Xu, J.H.; Freeman, A.J. Bandfilling and structural stability of trialuminides: YAl3, ZrAl3, and NbAl3. J. Mater. Res. 1991, 6, 1188–1199. [Google Scholar] [CrossRef]
  32. Hu, W.C.; Liu, Y.; Li, D.J.; Zeng, X.Q.; Xu, C.S. First-principles study of structural and electronic properties of C14-type Laves phase Al2Zr and Al2Hf. Comput. Mater. Sci. 2014, 83, 27–34. [Google Scholar] [CrossRef]
  33. Hou, H.; Wen, Z.; Zhao, Y.; Fu, L.; Wang, N.; Han, P. First-principles investigations on structural, elastic, thermodynamic and electronic properties of Ni3X (X = Al, Ga and Ge) under pressure. Intermetallics 2014, 44, 110–115. [Google Scholar] [CrossRef]
  34. Hu, W.C.; Liu, Y.; Li, D.J.; Zeng, X.Q.; Xu, C.S. Mechanical and thermodynamic properties of Al3Sc and Al3Li precipitates in Al-Li-Sc alloys from first-principles calculations. Physica B 2013, 427, 85–90. [Google Scholar] [CrossRef]
  35. Kong, Y.; Duan, Y.; Ma, L.; Li, R. Phase stability, elastic anisotropy and electronic structure of cubic MAl2 (M = Mg, Ca, Sr and Ba) Laves phases from first-principles calculations. Mater. Res. Express 2016, 3, 106505. [Google Scholar] [CrossRef]
  36. Ding, W.J.; Yi, J.X.; Chen, P.; Li, D.L.; Peng, L.M.; Tang, B.Y. Elastic properties and electronic structures of typical Al-Ce structures from first-principles calculations. Solid State Sci. 2012, 14, 555–561. [Google Scholar] [CrossRef]
  37. Chen, Q.; Sundman, B. Calculation of debye temperature for crystalline structures—A case study on Ti, Zr, and Hf. Acta Mater. 2001, 49, 947–961. [Google Scholar] [CrossRef]
  38. Gao, X.; Jiang, Y.; Zhou, R.; Feng, J. Stability and elastic properties of Y-C binary compounds investigated by first principles calculations. J. Alloys Compd. 2014, 587, 819–826. [Google Scholar] [CrossRef]
  39. Born, M.; Huang, K. Dynamical Theory of Crystal Lattices; Oxford University Press: Oxford, UK, 1954. [Google Scholar]
  40. Hill, R. The Elastic Behaviour of a Crystalline Aggregate. Phys. Soc. Lond. Sect. A 1952, 65, 349–354. [Google Scholar] [CrossRef]
  41. Voigt, W. Lehrbuchde Kristallphysik; B.G. Teubner: Leipzig/Berlin, Germany, 1928. [Google Scholar]
  42. Reuss, A. Calculation of the flow limits of mixed crystals on the basis of the plasticity of monocrystals. Z. Angew. Math. Mech. 1929, 9, 49–58. [Google Scholar] [CrossRef]
  43. Huang, S.; Zhang, C.H.; Li, R.Z.; Shen, J.; Chen, N.X. Site preference and alloying effect on elastic properties of ternary B2 RuAl-based alloys. Intermetallics 2014, 51, 24–29. [Google Scholar] [CrossRef]
  44. Jacob, K.T.; Raj, S.; Rannesh, L. Vegard’s law: A fundamental relation or an approximation? Int. J. Mater. Res. 2007, 98, 776. [Google Scholar] [CrossRef]
  45. Li, C.; Wu, P. Correlation of Bulk Modulus and the Constituent Element Properties of Binary Intermetallic Compounds. Chem. Mater. 2001, 13, 4642. [Google Scholar] [CrossRef]
  46. McNaught, A.D.; Wilkinson, A. Compendium of Chemical Terminology. In The Gold Book, 2nd ed.; Blackwell Scientific Publications: Oxford, UK, 1997; Volume 2, pp. 12–14. ISBN 0-86542-684-8. [Google Scholar]
  47. Pugh, S.F. XCII. Relations between the elastic moduli and the plastic properties of polycrystalline pure metals. Philos. Mag. 1954, 45, 823–843. [Google Scholar] [CrossRef]
  48. Greaves, G.N.; Greer, A.L.; Lakes, R.S.; Rouxel, T. Poisson’s ratio and modern materials. Nat. Mater. 2011, 10, 823–837. [Google Scholar] [CrossRef] [PubMed]
  49. Tian, Y.; Xu, B.; Zhao, Z. Microscopic theory of hardness and design of novel superhard crystals. Int. J. Refract. Met. Hard Mater. 2012, 33, 93–106. [Google Scholar] [CrossRef]
  50. Lv, Z.Q.; Zhang, Z.F.; Zhang, Q.; Wang, Z.H.; Sun, S.H.; Fu, W.T. Structural, electronic and elastic properties of the Laves phases WFe2, MoFe2, WCr2 and MoCr2 from first-principles. Solid State Sci. 2016, 56, 16–22. [Google Scholar] [CrossRef]
  51. Duan, Y.H.; Huang, B.; Sun, Y.; Peng, M.J.; Zhou, S.G. Stability, elastic properties and electronic structures of the stable Zr-Al intermetallic compounds: A first-principles investigation. J. Alloys Compd. 2014, 590, 50–60. [Google Scholar] [CrossRef]
  52. Chen, S.; Sun, Y.; Duan, Y.H.; Huang, B.; Peng, M.J. Phase stability, structural and elastic properties of C15-type Laves transition-metal compounds MCo2 from first-principles calculations. J. Alloys Compd. 2015, 630, 202–208. [Google Scholar] [CrossRef]
  53. Duan, Y.H.; Sun, Y.; Peng, M.J.; Zhou, S.G. Anisotropic elastic properties of the Ca-Pb compounds. J. Alloys Compd. 2014, 595, 14–21. [Google Scholar] [CrossRef]
  54. Vajeeston, P.; Ravindran, P.; Fjellvag, H. Prediction of structural, lattice dynamical, and mechanical properties of CaB2. RSC Adv. 2012, 2, 11687–11694. [Google Scholar] [CrossRef]
  55. Cahill, D.G.; Watson, S.K.; Pohl, R.O. Lower limit to the thermal conductivity of disordered crystals. Phys. Rev. B 1992, 46, 6131. [Google Scholar] [CrossRef]
  56. Duan, Y.; Sun, Y. Thermodynamics properties and thermal conductivity of Mg2Pb at high pressure. Sci. China Phys. Mech. Astron. 2013, 56, 1854–1860. [Google Scholar] [CrossRef]
Figure 1. The relative changes of (a) lattice constant (a); (b) unit cell volume (V) with the elevating pressures computed by GGA method for HfX (X = Os, Ir and Pt).
Metals 07 00317 g001
Figure 2. TDOS and PDOS spectra for (a) HfOs, (b) HfIr and (c) HfPt.
Metals 07 00317 g002
Figure 3. (a) Correlations between bulk modulus and electron density; (b) Correlations between shear modulus and Young’s modulus for HfX (X = Os, Ir and Pt).
Metals 07 00317 g003
Figure 4. The 3D surface construction of Young’s modulus in (a) HfOs, (b) HfIr and (c) HfPt by GGA method. (Magnitude of Young’s modulus at different directions is presented by the contour along each graph with the unit of GPa.)
Metals 07 00317 g004
Table 1. The optimized (atheo) and experimental (aexp) lattice constants, calculated deviations, bulk moduli (B0) and its pressure derivatives (B0’), and formation enthalpies (Hf) for HfX (X = Os, Ir and Pt).
Compoundsatheo (Å)aexp (Å)Calculated Deviation (%)B0 (GPa)B0Hf (eV/atom)
HfOs3.291 a3.239 c1.600 a234.3 a4.43 a−0.474 a
3.236 b-−0.083 b266.2 b4.47 b−0.451 b
3.294 d----−0.495 d
3.257 e----−0.707 f
-----−0.793 g
----−0.484 ± −0.052 h
HfIr3.311 a3.21 i3.143 a220.9 a4.66 a0.807 a
3.253 b-1.331 b255.6 b4.69 b−0.769 b
3.275 g----−0.977 g
-----−1.016 ± −0.016 j
HfPt3.359 a3.3623 k−0.096 a191.6 a4.64 a−0.903 a
3.298 b-−1.907 b221.7 b4.66 b−0.900 b
- ---−1.063 g
-----−1.175 ± −0.062 j
a Theoretical values from GGA method in current work; b Theoretical values from LDA method in current work; c Experimental values from reference [10]; d Theoretical values from reference [14]; e Theoretical values from reference [13]; f Theoretical values from reference [3]; g Theoretical values from reference [6]; h Experimental values from reference [24]; i Experimental values from reference [11]; j Experimental values from reference [25]; k Experimental values from reference [12].
Table 2. The elastic constants (Cij) for HfX (X = Os, Ir and Pt).
CompoundsC11 (GPa)C12 (GPa)C13 (GPa)C33 (GPa)C44 (GPa)
HfOs402.1 a149.7 a--121.0 a
436.5 b179.3 b--130.5 b
393.7 c139.8 c--110.1 c
366.1 d152.6 d--105.6 d
HfIr285.7 a239.5 a--103.2 a
255.7 b202.9 b--90.7 b
HfPt244.3 a209.2 a--67.8 a
217.7 b179.3 b--61.7 b
Hf214.0 a90.6 a92.2 a235.8 a54.6 a
193.6 b82.7 b77.4 b205.1 b56.3 b
181.0 e77.0 e66.0 e197.0 e55.7 e
a Theoretical values from GGA method in current work; b Theoretical values from LDA method in current work; c Theoretical values from reference [13]; d Theoretical values from reference [14]; e Experimental values from reference [37].
Table 3. The bulk modulus (B), shear modulus (G), Young’s modulus (E), Poisson’s ratio (ν), B/G ratio and hardness (HV) for HfX (X = Os, Ir and Pt) and pure Hf deduced from the VRH method.
CompoundsB (GPa)G (GPa)E (GPa)νHV (GPa)B/G
HfOs233.8 a123.1 a314.1 a0.276 a13.4a1.900 a
265.1 b129.7 b334.6 b0.290 b12.8b2.043 b
224.4 c116.5 c298.0 c0.279 c12.7c1.926 c
223.8 c106.1 c274.8 c0.295 c10.7c2.110 c
HfIr220.5 a55.5 a153.5 a0.384 a3.3a3.977 a
254.9 b57.2 b159.6 b0.396 b3.0b4.458 b
HfPt192.1 a38.7 a108.8 a0.406 a2.0a4.962 a
220.9 b39.6 b112.2 b0.415 b1.8b5.572 b
Hf118.6 a57.2 a147.8 a0.292 a-2.074 a
134.8 b59.9 b156.5 b0.306 b-2.251 b
108.5 e55.8 e142.9 e0.28 e-1.944 e
a Theoretical values from GGA method in current work; b Theoretical values from LDA method in current work; c Theoretical values from reference [13]; d Theoretical values from reference [14]; e Experimental values from reference [37].
Table 4. The calculated Voigt and Reuss bounds for bulk (shear) modulus, and universal anisotropic index (AU) for HfX (X = Os, Ir and Pt).
CompoundsBVBRGVGRBV/BRGV/GRAU
GGA method
HfOs233.8233.8123.1123.011.0000.0022
HfIr220.5220.565.045.911.4152.077
HfPt192.1192.144.732.711.3671.830
LDA method
HfOs265.1265.1129.7129.711.0000.00026
HfIr254.9254.971.143.211.6463.229
HfPt220.9220.947.731.611.4942.470
Table 5. The calculated anisotropic sound velocities (m/s) for HfX (X = Os, Ir and Pt).
[111][110][100]
Crystal orientations[111]vl[ 11 2 ¯ ]vt1,2[110]vl[ 1 1 ¯ 0 ]vt1[001]vt2[100]vl[010]vt1[001]vt2
GGA method
HfOs4796.02691.94425.23833.62653.84838.32653.82653.8
HfIr4487.11679.34024.31763.52313.03882.62313.02313.0
HfPt4094.41427.93743.51531.81941.73647.21941.71941.7
LDA method
HfOs4930.22674.74545.33773.42687.74916.02687.72687.7
HfIr4684.41668.44191.31607.12401.73996.82401.72401.7
HfPt4243.21408.43882.71424.51980.33758.81980.31980.3
Table 6. Sound velocity (m/s) and Debye temperature (K) for HfX (X = Os, Ir and Pt).
CompoundsvL (m/s)vT (m/s)vD (m/s)Θ (K)
GGA method
HfOs4812.72676.52978.3339.5
HfIr4166.61808.22040.8231.2
HfPt3859.01538.01741.1194.4
LDA method
HfOs4924.52679.92987.0346.2
HfIr4303.01788.12021.4233.1
HfPt3979.11514.31716.5195.2
Table 7. Calculated minimum thermal conductivities kmin (W/m/K) for HfX (X = Os, Ir and Pt).
Compoundsn (10303)[100] kmin[110] kmin[111] kminkmin
GGA method
HfOs0.05610.8280.8900.3910.829
HfIr0.05510.6860.6530.3620.627
HfPt0.05280.5900.5650.3210.543
LDA method
HfOs0.05900.8680.9290.4160.868
HfIr0.05810.7350.6850.3910.658
HfPt0.05580.6270.5920.3450.569

