Method to Evaluate the Kinetics of Bainite Transformation in Low-Temperature Nanobainitic Steel Using Thermal Dilatation Curve Analysis


1
The State Key Laboratory of Refractories and Metallurgy, Wuhan University of Science and Technology, Wuhan 430081, China
2
Wuhan Iron and Steel Co., Ltd., Wuhan 430083, China
*
Author to whom correspondence should be addressed.
Metals 2017, 7(9), 330; https://doi.org/10.3390/met7090330
Submission received: 4 July 2017
/
Revised: 14 August 2017
/
Accepted: 23 August 2017
/
Published: 28 August 2017
Abstract
:The aim of this work was to develop a method to evaluate the kinetics of bainite transformation by theoretical deduction and thermal dilatation curve analysis. A Gleeble-3500 thermomechanical simulator and dilatometer (DIL805A) were employed to study the isothermal transformation in deformed (360 , 600 , and 860 ) and undeformed conditions. The thermal dilatation information during isothermal transformation was recorded, and the dilatation curves were well smoothed. By taking a derivative of the dilation curve with respect to the transformation time, the peak time of transformation rate (PTTR) was obtained, which can serve as the essence of isothermal transformation time. The relative change of length () due to phase transformation was theoretically deduced, and the effect of temperature was taken into consideration. Combing experimental data, the volume fraction of bainite in isothermal transformation was calculated. Making a graph of volume fraction versus PTTR was a good method to evaluate the kinetics of bainitic transformation clearly and concisely which facilitated optimization of the preparation technique for low-temperature nanobainitic steel.
1. Introduction
Dilatometry is a powerful technique to study the phase transformation kinetics of steels [1,2,3,4,5,6,7,8]. Compared with metallographic analysis, dilatometry is real-time, direct, and simple [9]. The lattice structure of steels is temperature-dependent, and within a considerable temperature range, the volume of the sample is proportional to the temperature if no phase transformation takes place. However, when the driving force is large enough, a new phase appears which is accompanied by the changes of crystal structure and lattice parameters. These changes give rise to volume change in micron scale which can be monitored by a dilatometer. By observing the point at which the dilatation curve diverges from the trend caused by temperature, the onset and finish of phase transformation can be determined.
The low-temperature nanobainitic steel developed by Bhadeshia and his co-workers [4,10] has good mechanical properties [11] which interest many researchers. However, the prolonged transformation time hinders its application [12]. A great deal of research has been conducted to understand the effect of ausforming conditions [13,14,15,16], chemical compositions [17], and isothermal temperature [18] on the kinetics and mechanical properties. Obtaining bainitic microstructure is fundamental, and involves the chance to exhibit a good mechanical performance. Dilatometry is one of the most useful techniques to study the kinetics of bainitic transformation by analyzing the relative change of length due to phase transformation [16].
However, applying conventional methods to determine the onset and finish of phase transformation may vary from person to person. This make it difficult to compare different processes of phase transformation. Additionally, it is inappropriate to use relative change directly to study phase transformation without taking the temperature into consideration. Consequently, in this study we would develop a method to evaluate the kinetics of bainitic transformation by theoretical deduction and dilatation curve analysis. It is useful to optimize techniques to shorten nanobainitic transformation time.
2. Materials and Experimental Procedure
The material used in this study was a low-temperature nanobainitic steel with chemical composition shown in Table 1. The steel ingot was cast in 50 kg vacuum furnace followed by hot rolling to a plate with 20 mm thickness. The microstructure of the plate was predominantly high-strength bainite, of which the tensile strength was about 1840 MPa. We machined samples from the plate and divided them into two batches.
Samples in one batch had dimensions of 4 mm in diameter and 10 mm in length. In order to control the heating condition, a thermal dilatometer (DIL805A, TA, New Castle, DE, USA) was employed. The thermal couple was spot-welded at the center of the sample around circumference surface. Induction heating and N were employed to heat and cool the samples to the desired temperature. A thermo-couple feedback system was used to monitor the temperature of samples. Prior to the test, the chamber was evacuated to a vacuum of approximately 0.05 Pa to minimize surface oxidation and decarburization. Homogenized austenite was obtained by heating samples to 900 with a heating rate of 10 /s and holding for 5 min. At a cooling rate of 30 /s, the samples were cooled to the desired temperature (i.e., 300 , 350 , 400 , 450 ) and held for 2000 s to 16,200 s to subject to bainitic transformation. After heating treatment, samples were quenched to room temperature to avoid the interference of bainite transformed during the cooling process. Dilatation information along the axial direction was recorded by a dilatometer. The experimental procedure is shown in Figure 1a.
Samples in the other batch had a deformation zone of 6 mm in diameter and 15 mm in length. In order to uncover the effect of ausforming on bainite transformation, a Gleeble-3500 thermomechanical simulator (DSI, New York, NY, USA) was employed. The samples were austenized in the same condition as undeformed ones. After cooling to 860 , 600 , and 360 with a cooling rate of 10 /s, the samples were compressed to 30% with strain rate of 10 s. The samples were then held at 300 , 350 , and 400 for 1800 s to 5500 s, following a rapid cooling with cooling rate of 30 /s. The dilatation information along the radial direction was recorded by using a dilatometer. The experimental process is shown schematically in Figure 1b.
3. Method
Austenite in steel at elevated temperature will generally undergo a phase transformation when the temperature decreases. As phase transformation occurs, the crystal structure may change from face-centered cubic to body-centered cubic, causing a volume change in macroscopic scale. The relative change in volume and length can be derived from
where and are changes of volume and length due to phase transformation, and and are initial volume and length, respectively. It can be seen from Equation (1) that the relative change of volume is approximately three times that of length.
When determining the relative change of length () in austenite decomposition, we substituted at room temperature for , owing to the fact that the change of length is five orders of magnitude smaller than initial length. Taking the transformation of gamma phase to alpha phase as an example, the relative change of length as a function of volume of gamma and alpha can be expressed as follows:
where the subscripts and denote gamma phase with face-centered cubic structure and alpha phase with body-centered cubic structure, respectively.
Crystal structure alters, leading to a change in the density of the steel, which can be expressed as
where is the mass of a unit cell, is the volume of a unit cell, is the number of iron atoms contained in a unit cell, is the mass of an iron atom, and is the lattice parameter of the unit cell with cubic structure. So, the density of alpha and gamma phases can be given as
where and are lattice parameters of alpha and gamma phase, respectively. It should be noted that Equations (3)–(5) are reliable provided that the effect of carbon and alloy elements on the density is not taken into consideration. The volume of a unit cell before and after phase transformation as a function of lattice parameter can be expressed as
Taking Equation (6) into Equation (2), we get
According to previous research [19], the lattice parameter of the gamma phase is proportional to the temperature in the form of
where T is the temperature in kelvin, is linear thermal expansion of gamma phase which was taken K for austenite in this research, and is the lattice parameter of gamma phase at room temperature which is given as a function of chemical composition [19,20]:
where the subscript denotes the content of alloy elements in weight percent. Similarly, the lattice parameter of alpha phase can also be written as
where is the linear thermal expansion of alpha phase ( K [21] for bainite in this research), is the lattice parameter of alpha phase at room temperature which can be calculated as a function of chemical composition [22]:
where is the lattice parameter of pure iron at room temperature (2.8664 Å), and the subscript denotes atomic fraction.
4. Results and Discussion
4.1. Isothermal Transformation
The volume of steels expands with temperature on the condition that no phase transformation occurs. The relative change of volume or length is proportional to increasing temperature. This relationship is caused by the fact that the thermal expansion coefficient of steels can be safely regarded as a constant within a temperature range of several hundred kelvin. However, when the driving force is large enough, a new phase occurs with different crystal structure from that of the parent phase. Consequently, the linear relationship between relative change of volume or length and the increasing temperature is broken. According to this principle, phase transformation can be detected by observing the dilatation curve diverging from the trend caused by the temperature.
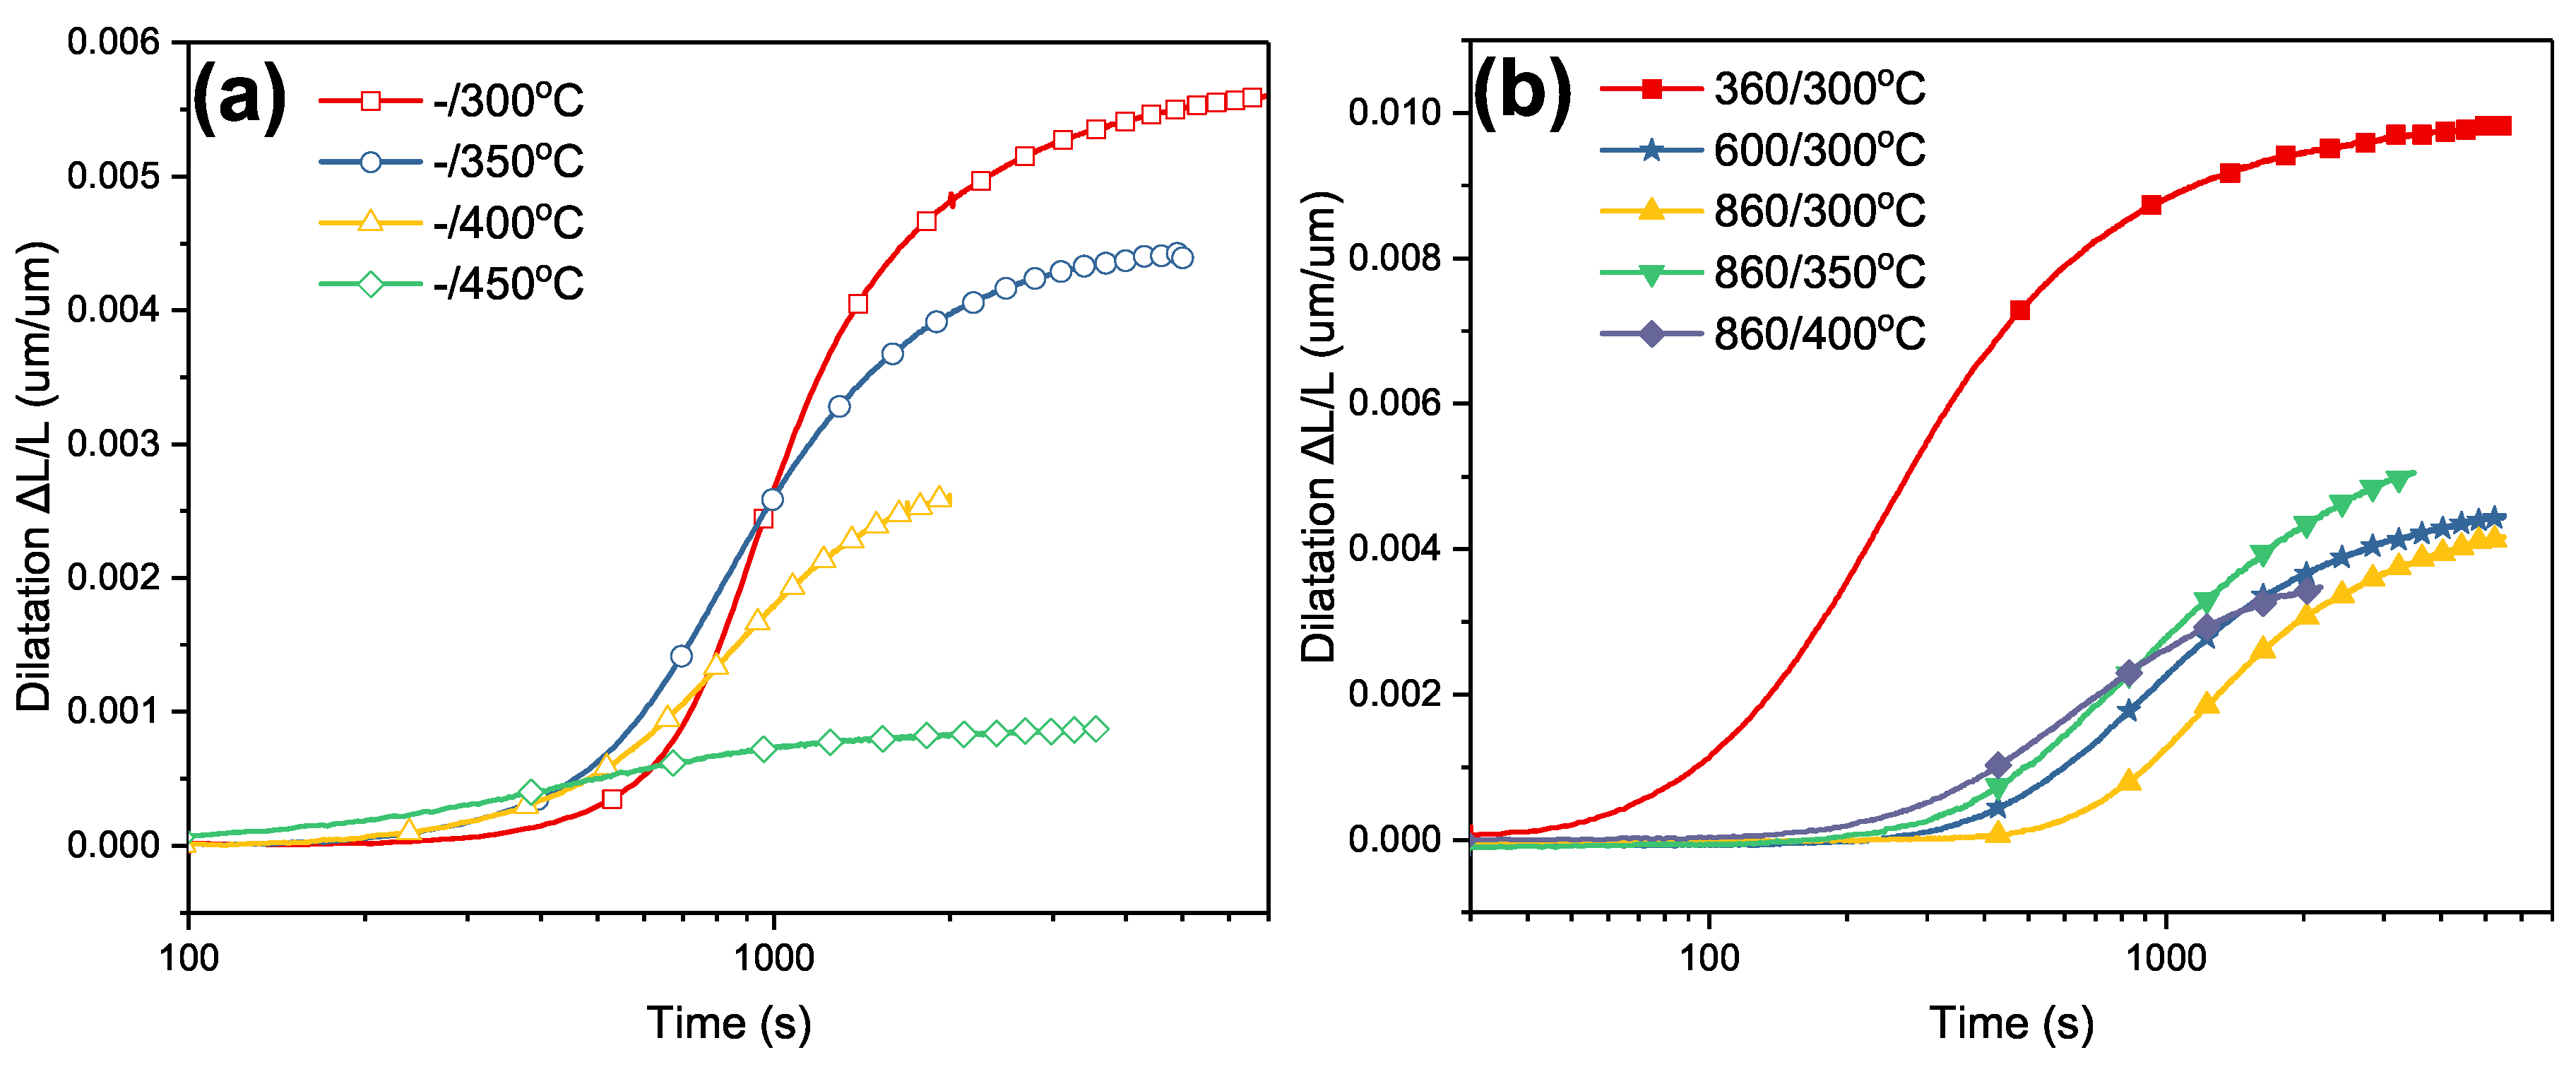
Figure 2 shows the dilatation curves as a function of holding time in different temperature and deformation conditions. They are typical isothermal phase transformations which feature “S” shape. The transformation is often slow in the beginning, and in some cases there is even a considerable incubation time. Following a relatively fast stage of transformation, the dilatation curves approach to a constant, which indicates the end of transformation. Start and end times are important information used to evaluate phase transformation. A common practice is to set a small amount (5%) and a large amount (95%) of phase transformation for the threshold of start and end of phase transformation. However, there are barriers to the implementation. Different researchers may have different criteria for the start and end of transformation, thus giving quite different numbers. It can be seen from Figure 2 that there is no obvious difference for the start time of phase transformation, except the dilatation curve in the condition of deforming at 360 and holding at 300 which increases sharply after the onset of isothermal treatment. Owing to personal assessment, the time for the end of transformation in every dilatation curve varies greatly. The difference may exist from several hundreds to several thousands of seconds, all of which are reasonable.
We took a derivative of the dilatation curve with respect to holding time in Figure 2, revealing the information of transformation rate. Figure 3 shows the transformation rate as a function of holding time in the condition of (a) undeformed and (b) deformed samples at different temperature followed by isothermal transformation. It was easy to obtain the peak time of transformation rate (PTTR) on all transformation rate curves. In undeformed condition, the PTTR increased with decreasing holding temperature (Figure 3a). This relationship was also applied to the cases where samples were subjected to the deformation at 860 followed by isothermal transformation at 300–400 . When isothermal transformation temperature was kept constant at 300 , the PTTR decreased with increasing deformation temperature.
The PTTR is capable of representing the concentrated information of time for isothermal phase transformation. In an isothermal transformation, the onset time of transformation involves the incubation period and nucleation stage. A short transformation onset time does not definitely result in a short time of transformation termination. Compared with Figure 2, we can differentiate one transformation from others in Figure 3 with ease. The transformation rate increases with holding time after the onset of transformation, and goes up to a peak followed by a decline. The critical point at which the trend of transformation rate varies is PTTR. It decreases and approaches zero, provided that the time lasted infinitely long. When transformation is approaching completion, a small amount of new phase occurs at the expense of more holding time. In the “long tail” part, the amount of phase transformation is usually negligible and can be disregarded. It is not wise to try to achieve exactly 100 % transformation at the cost of a too-long holding time. The mechanical properties of steels depend on the major type of microstructures. Most of the new phase can be obtained within two times of PTTR. Therefore, from a practical view, we can safely say that a transformation with smaller value of PTTR reacts faster than that with larger value of PTTR, and PTTR is sufficient to describe the isothermal transformation time as a whole.
4.2. Volume Fraction of Phase Transformation
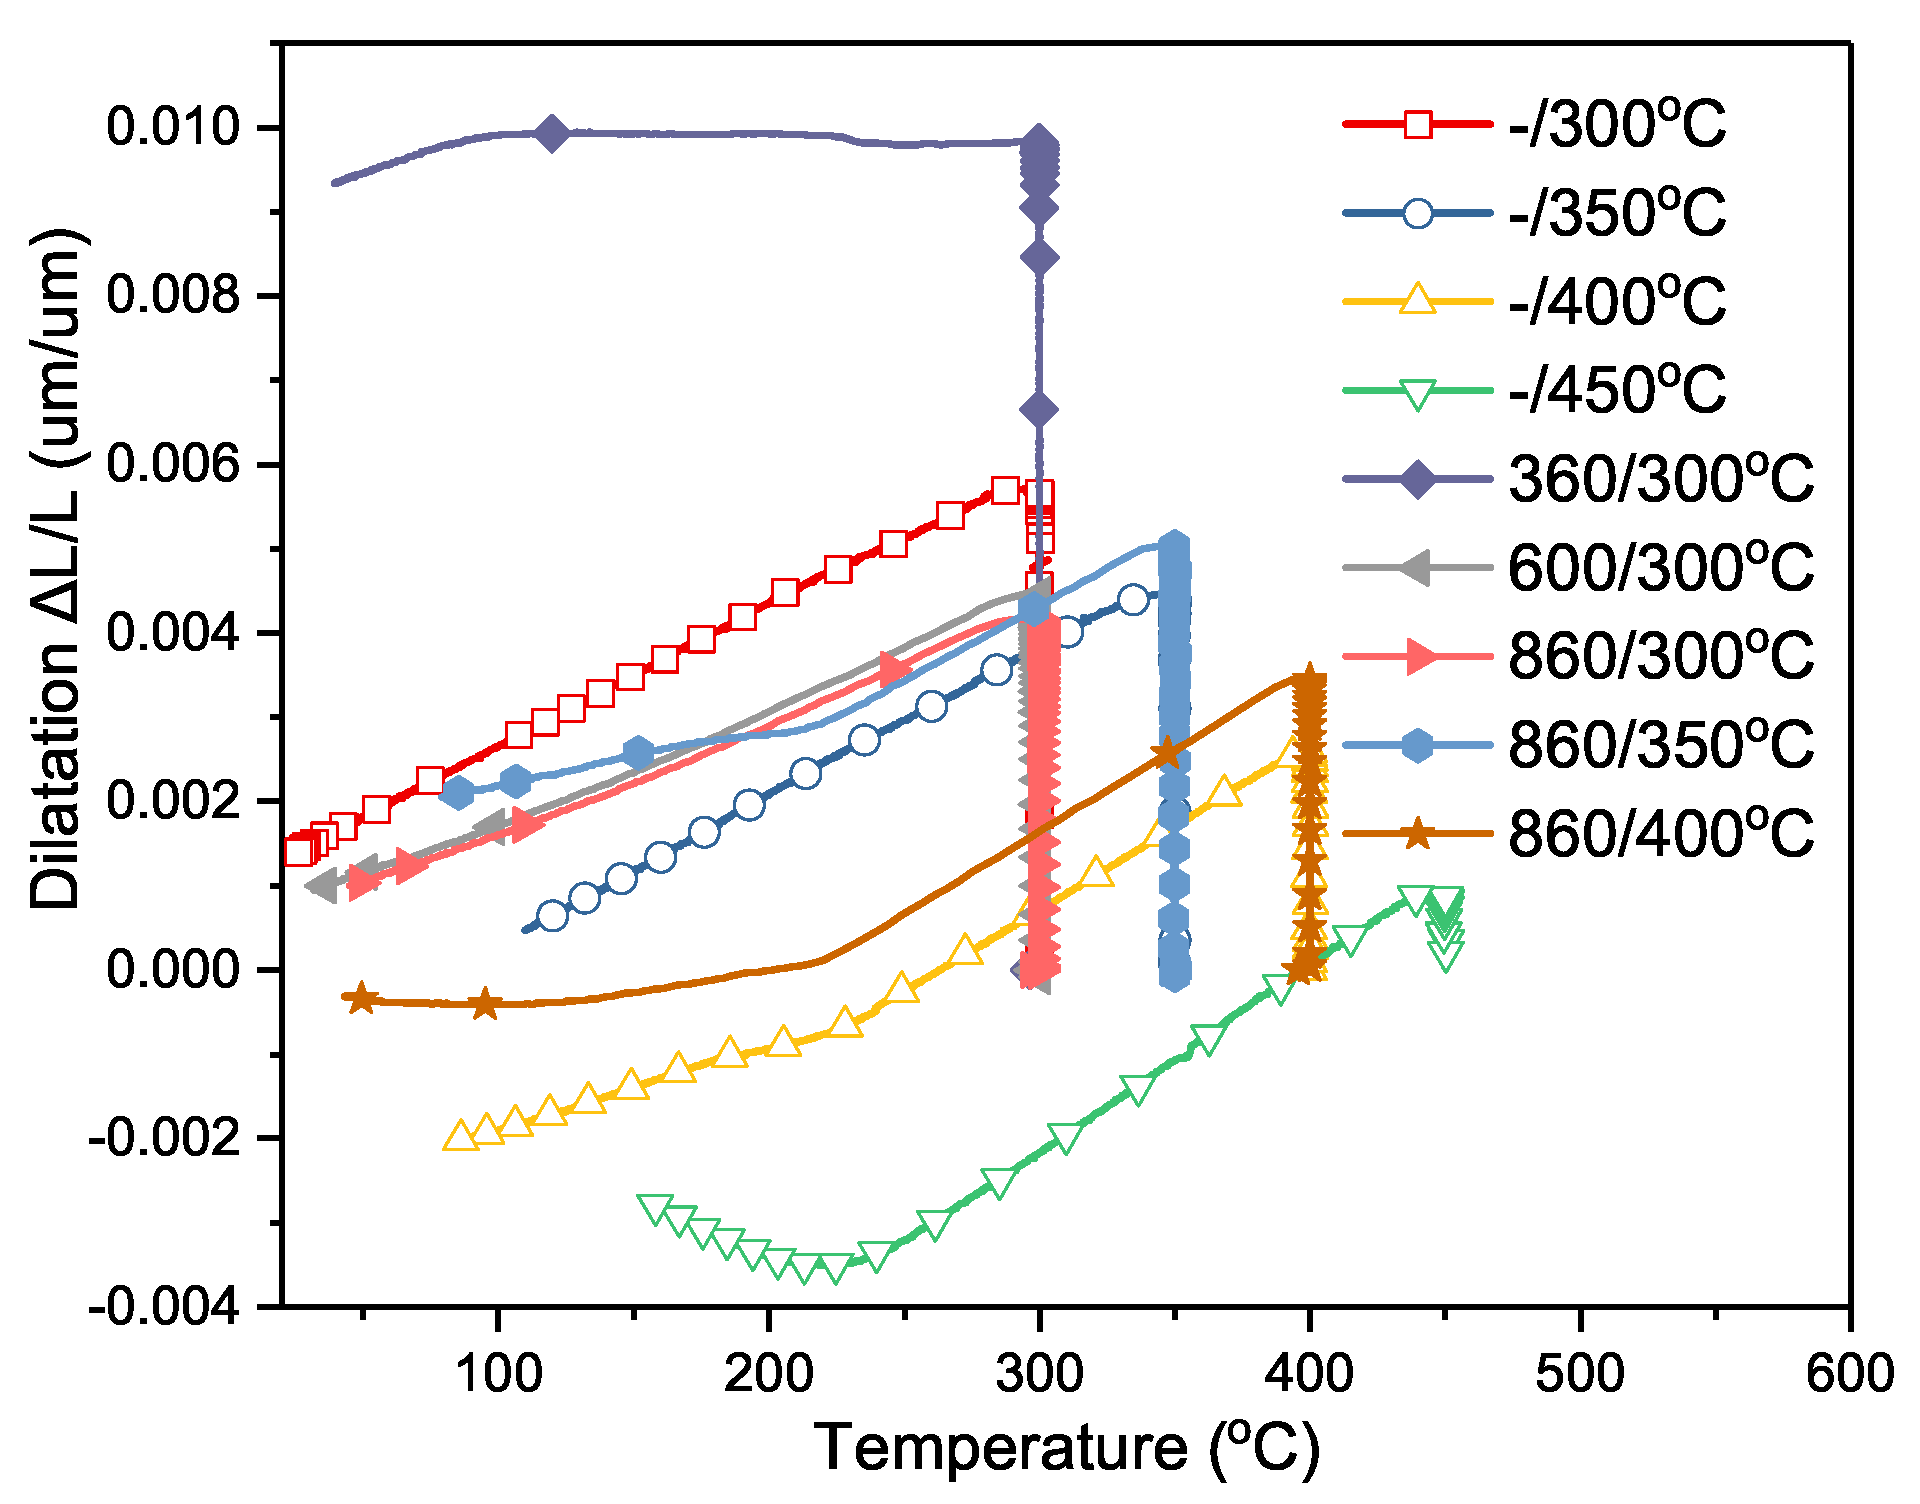
A too-long transformation time will hinder the application of the steel. Whereas a desired amount of phase—bainite with plates of nanoscale, for example—matters the performance of the steel. Figure 4 shows the dilatation curves of bainitic steel as a function of isothermal temperature. The maximum value of relative change of length at a specific temperature reflects the amount of phase transformation to some extent. The relative change of length decreases with temperature after isothermal transformation, and is proportional to the temperature if no further transformation occurs. As against, if this linear relationship is broken, it indicates that further phase transformation is taking place. In the case of “-/450 ” (holding at 450 without deformation), a small value of indicated a small amount of bainitic phase presented. The residual austenite remained untransformed after the cessation of the bainite reaction and kept stable until the temperature was as low as 240 when martensite appeared. The dilatation curve rose greatly below 240 , which implied that a considerable amount of austenite had transformed into martensite rather than bainite. However, it is inappropriate to compare the volume fraction of aimed phase by measuring the relative change directly in different isothermal temperature.
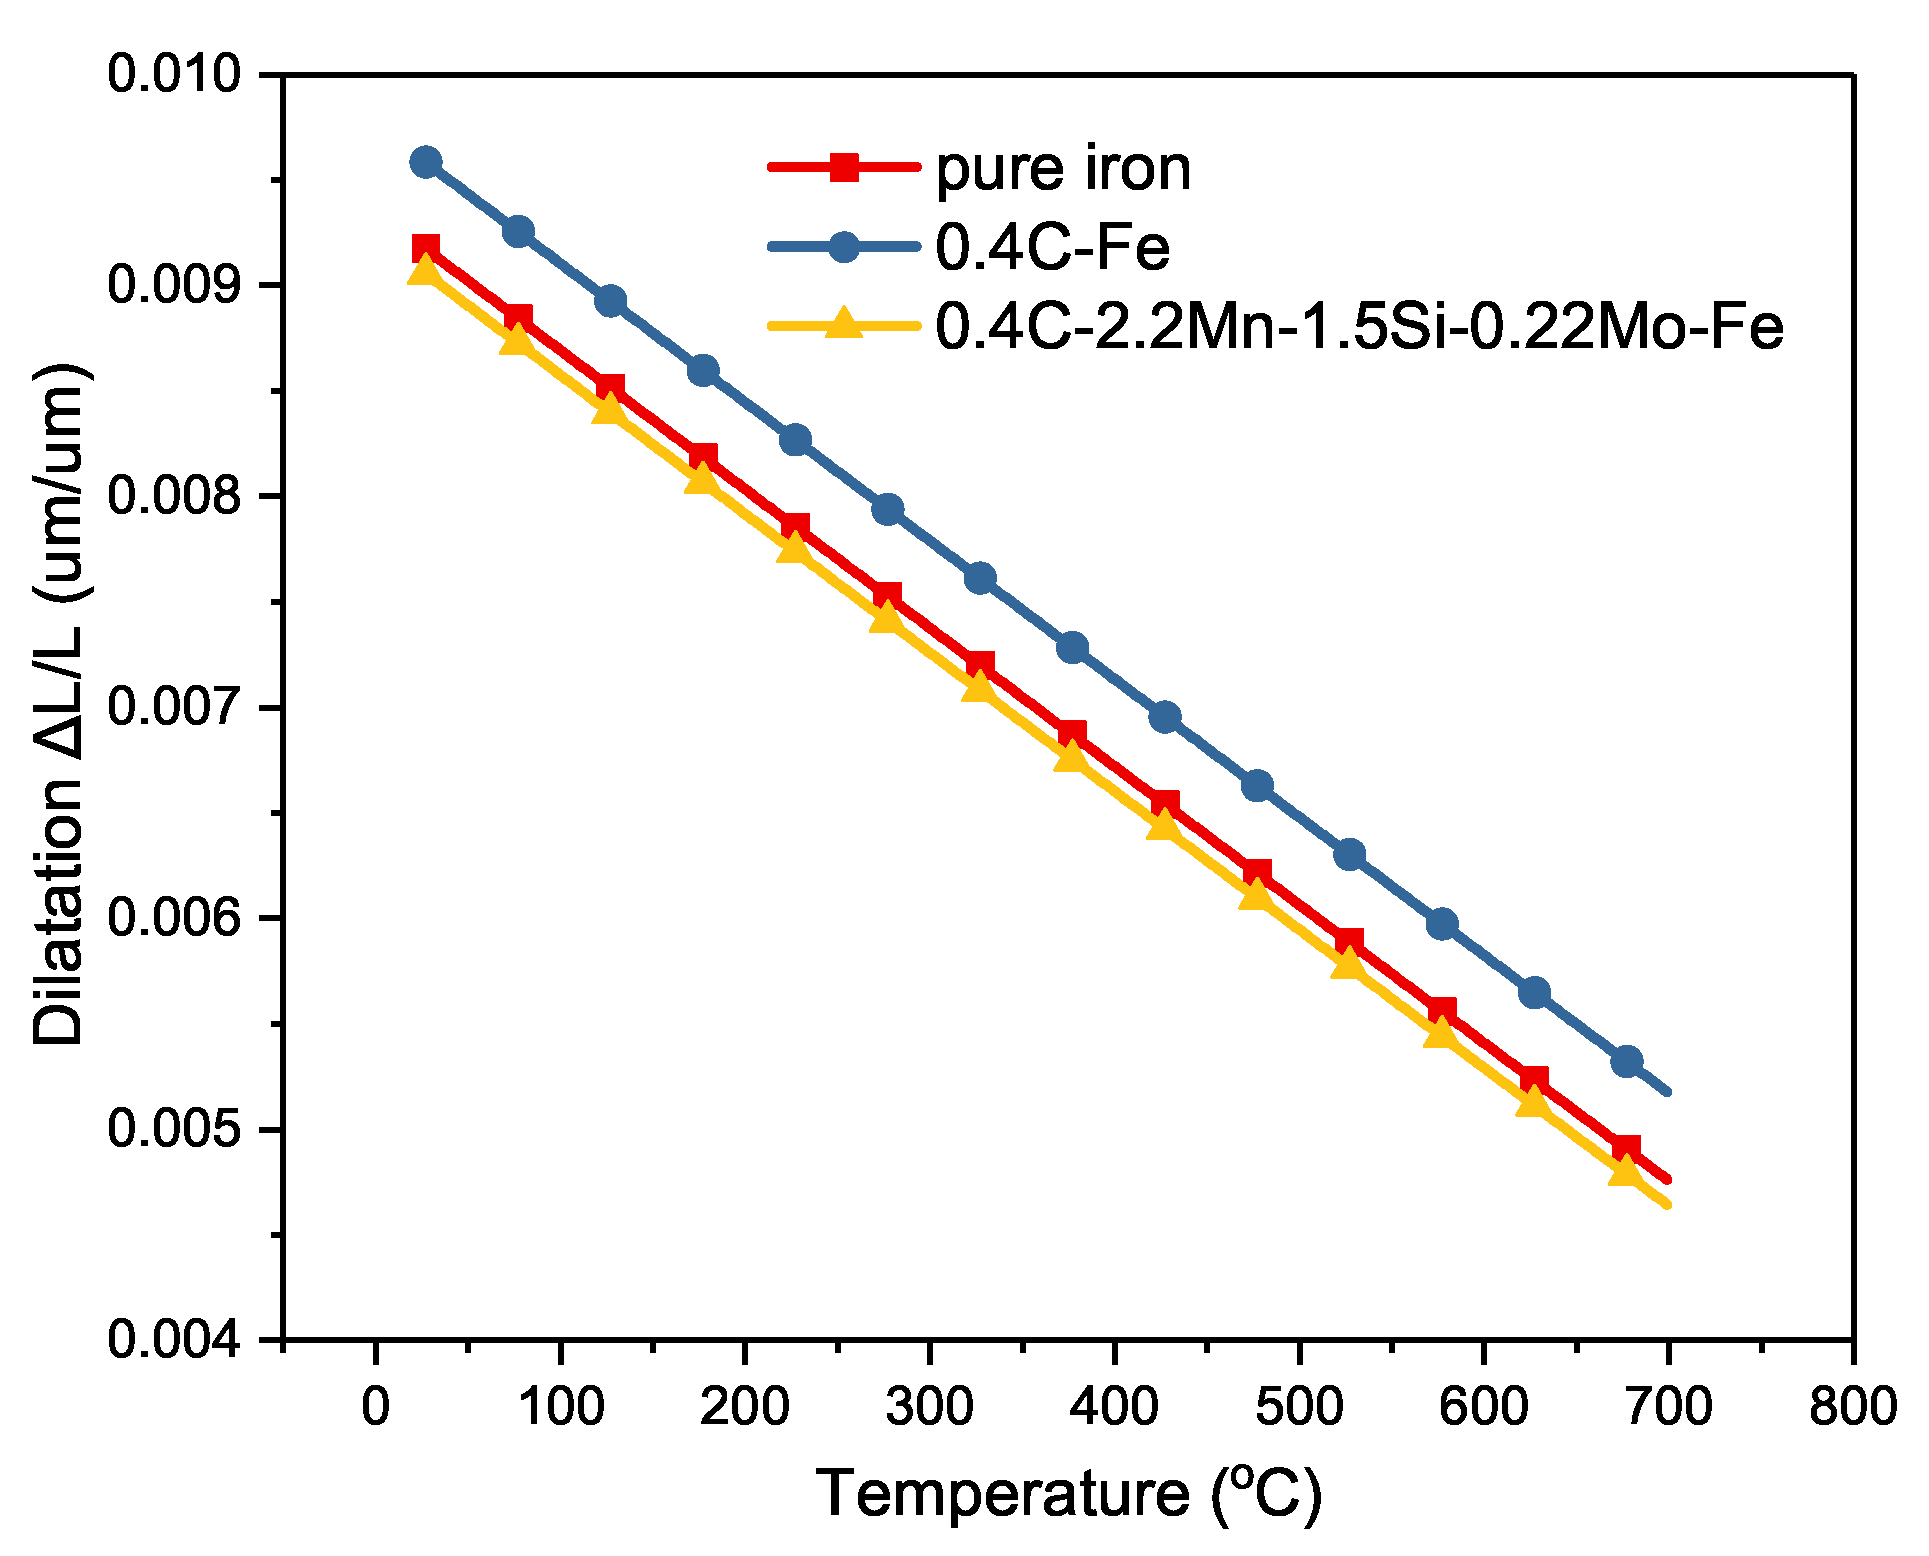
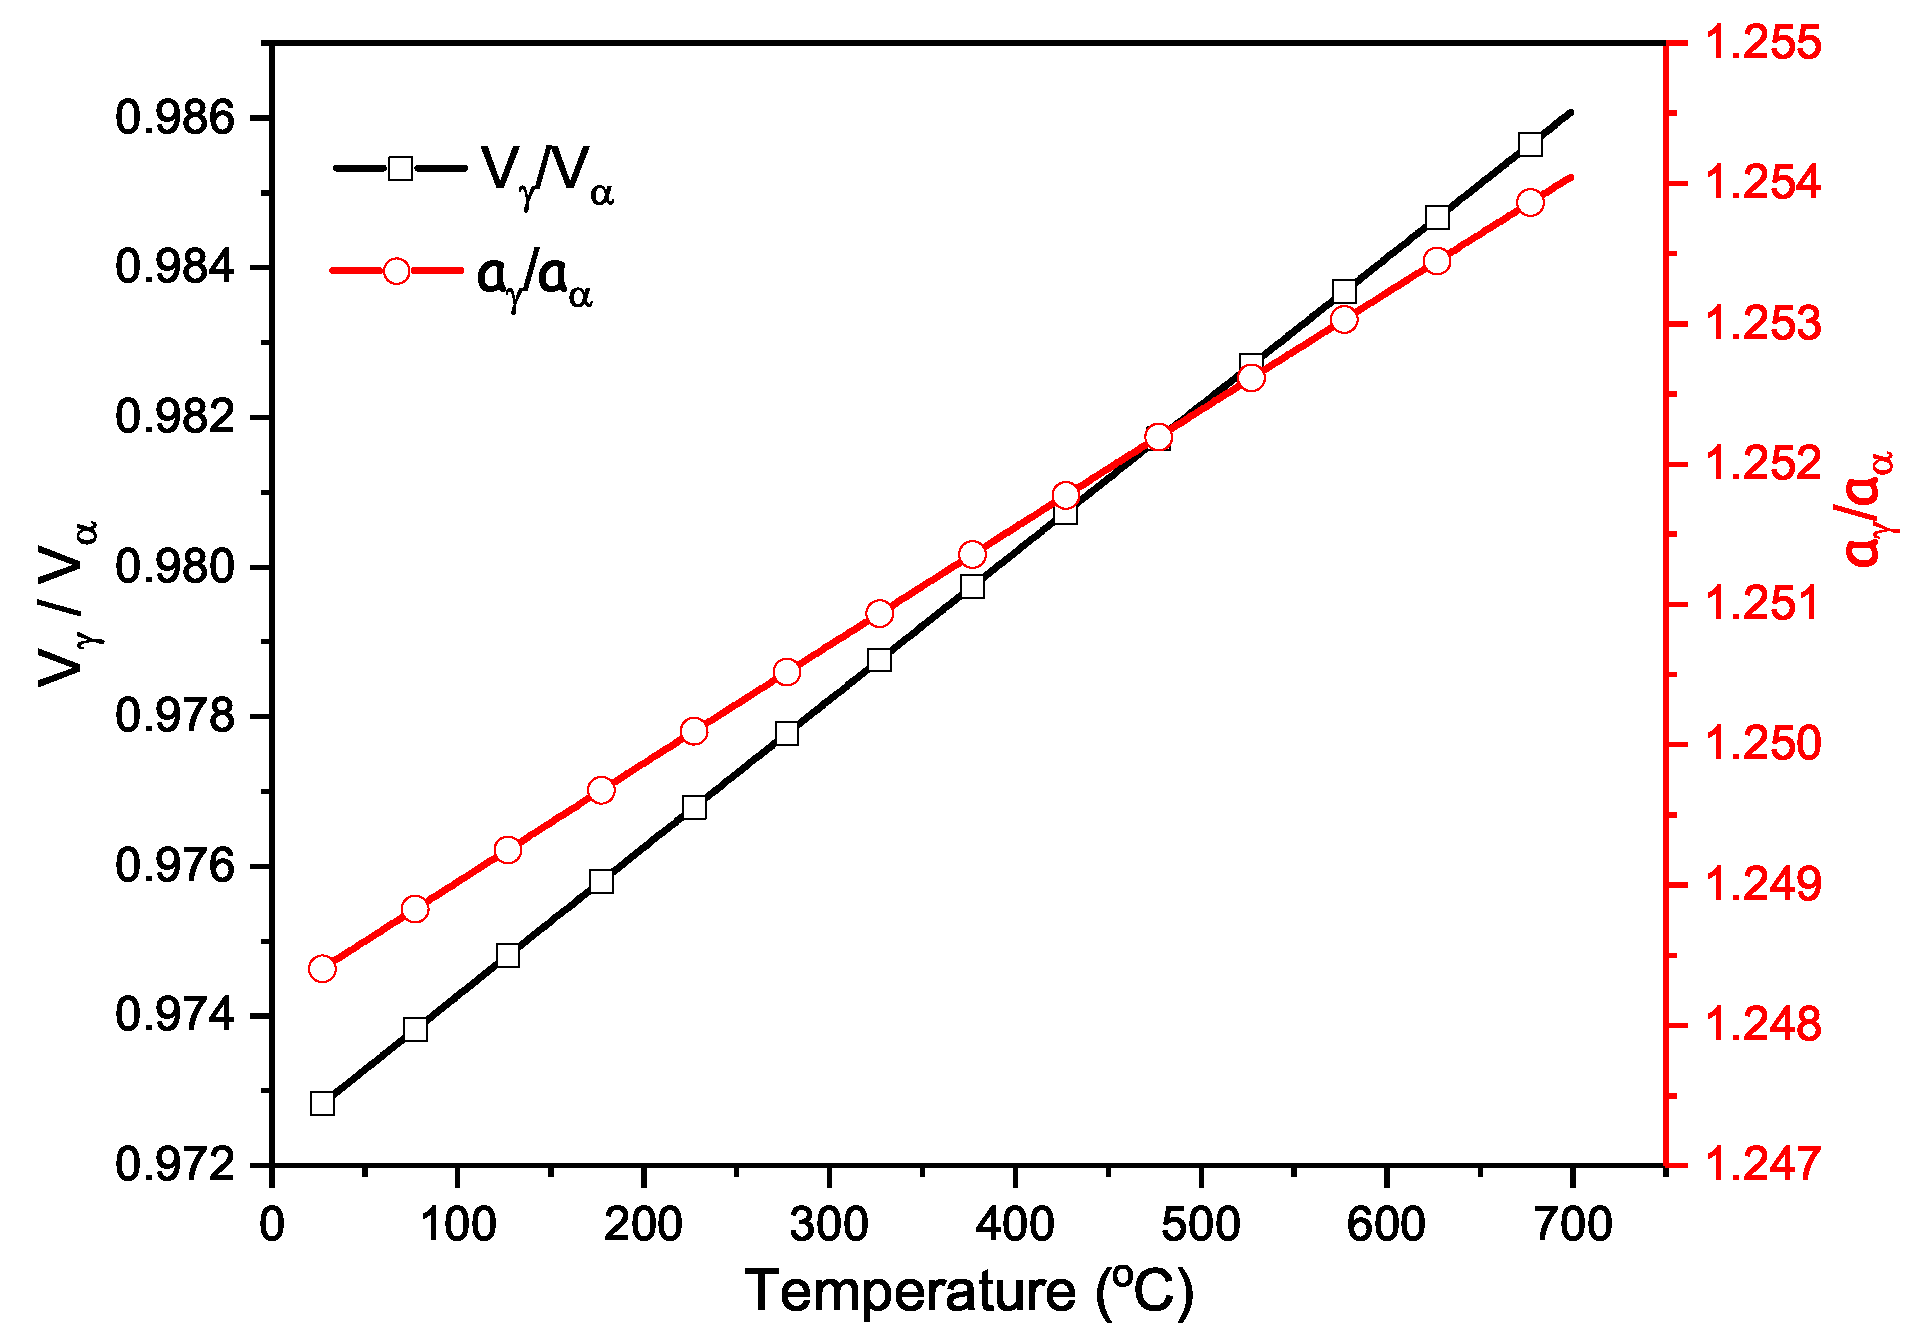
According to theoretical deduction, the relative change of length () of complete transformation from gamma to alpha phase is affected by the temperature. Figure 5 gives a comparison of as a function of the temperature among pure iron, low carbon steel, and low-temperature nanobainitic steel which transform from gamma phases into alpha phases completely. The relative change of length () in complete transformation is proportional to the temperature in the range of room temperature to 700 , and it decreases with increasing temperature. Low-carbon steel (0.4C-Fe) exhibits a larger value of in complete transformation. By contrast, compared with low-carbon steel, low-temperature bainitic steel containing alloy elements Mn, Si, and Mo showed smaller value of —even lower than that of pure iron. Consequently, the effect of temperature should be taken into consideration when we compare the amount of transformation in different isothermal temperatures by measuring the value of relative change of length .
According to Equation (7), is dependent on the lattice parameters of parent phase gamma and formed phase alpha. The lattice parameters are found proportional to the temperature in the form of Equations (8) and (10). That the linear relationship can safely be maintained within a temperature range of several hundred kelvin attributed to the assumption that the thermal expansion coefficient are regarded as constant, although according to recent study, of iron alloys may obey nonlinear equations [23] in the temperature range 100–1600 K. The classical method to develop lattice parameters as a function of temperature was on the basis of lattice parameter at specific temperature (e.g., room temperature). A great deal of research has been conducted to develop a model of lattice parameters by regression of chemical composition of alloy elements with the help of XRD (X-ray diffraction) [21]. There are other forms of lattice parameter equations except Equations (9) and (11) [1,5,24]:
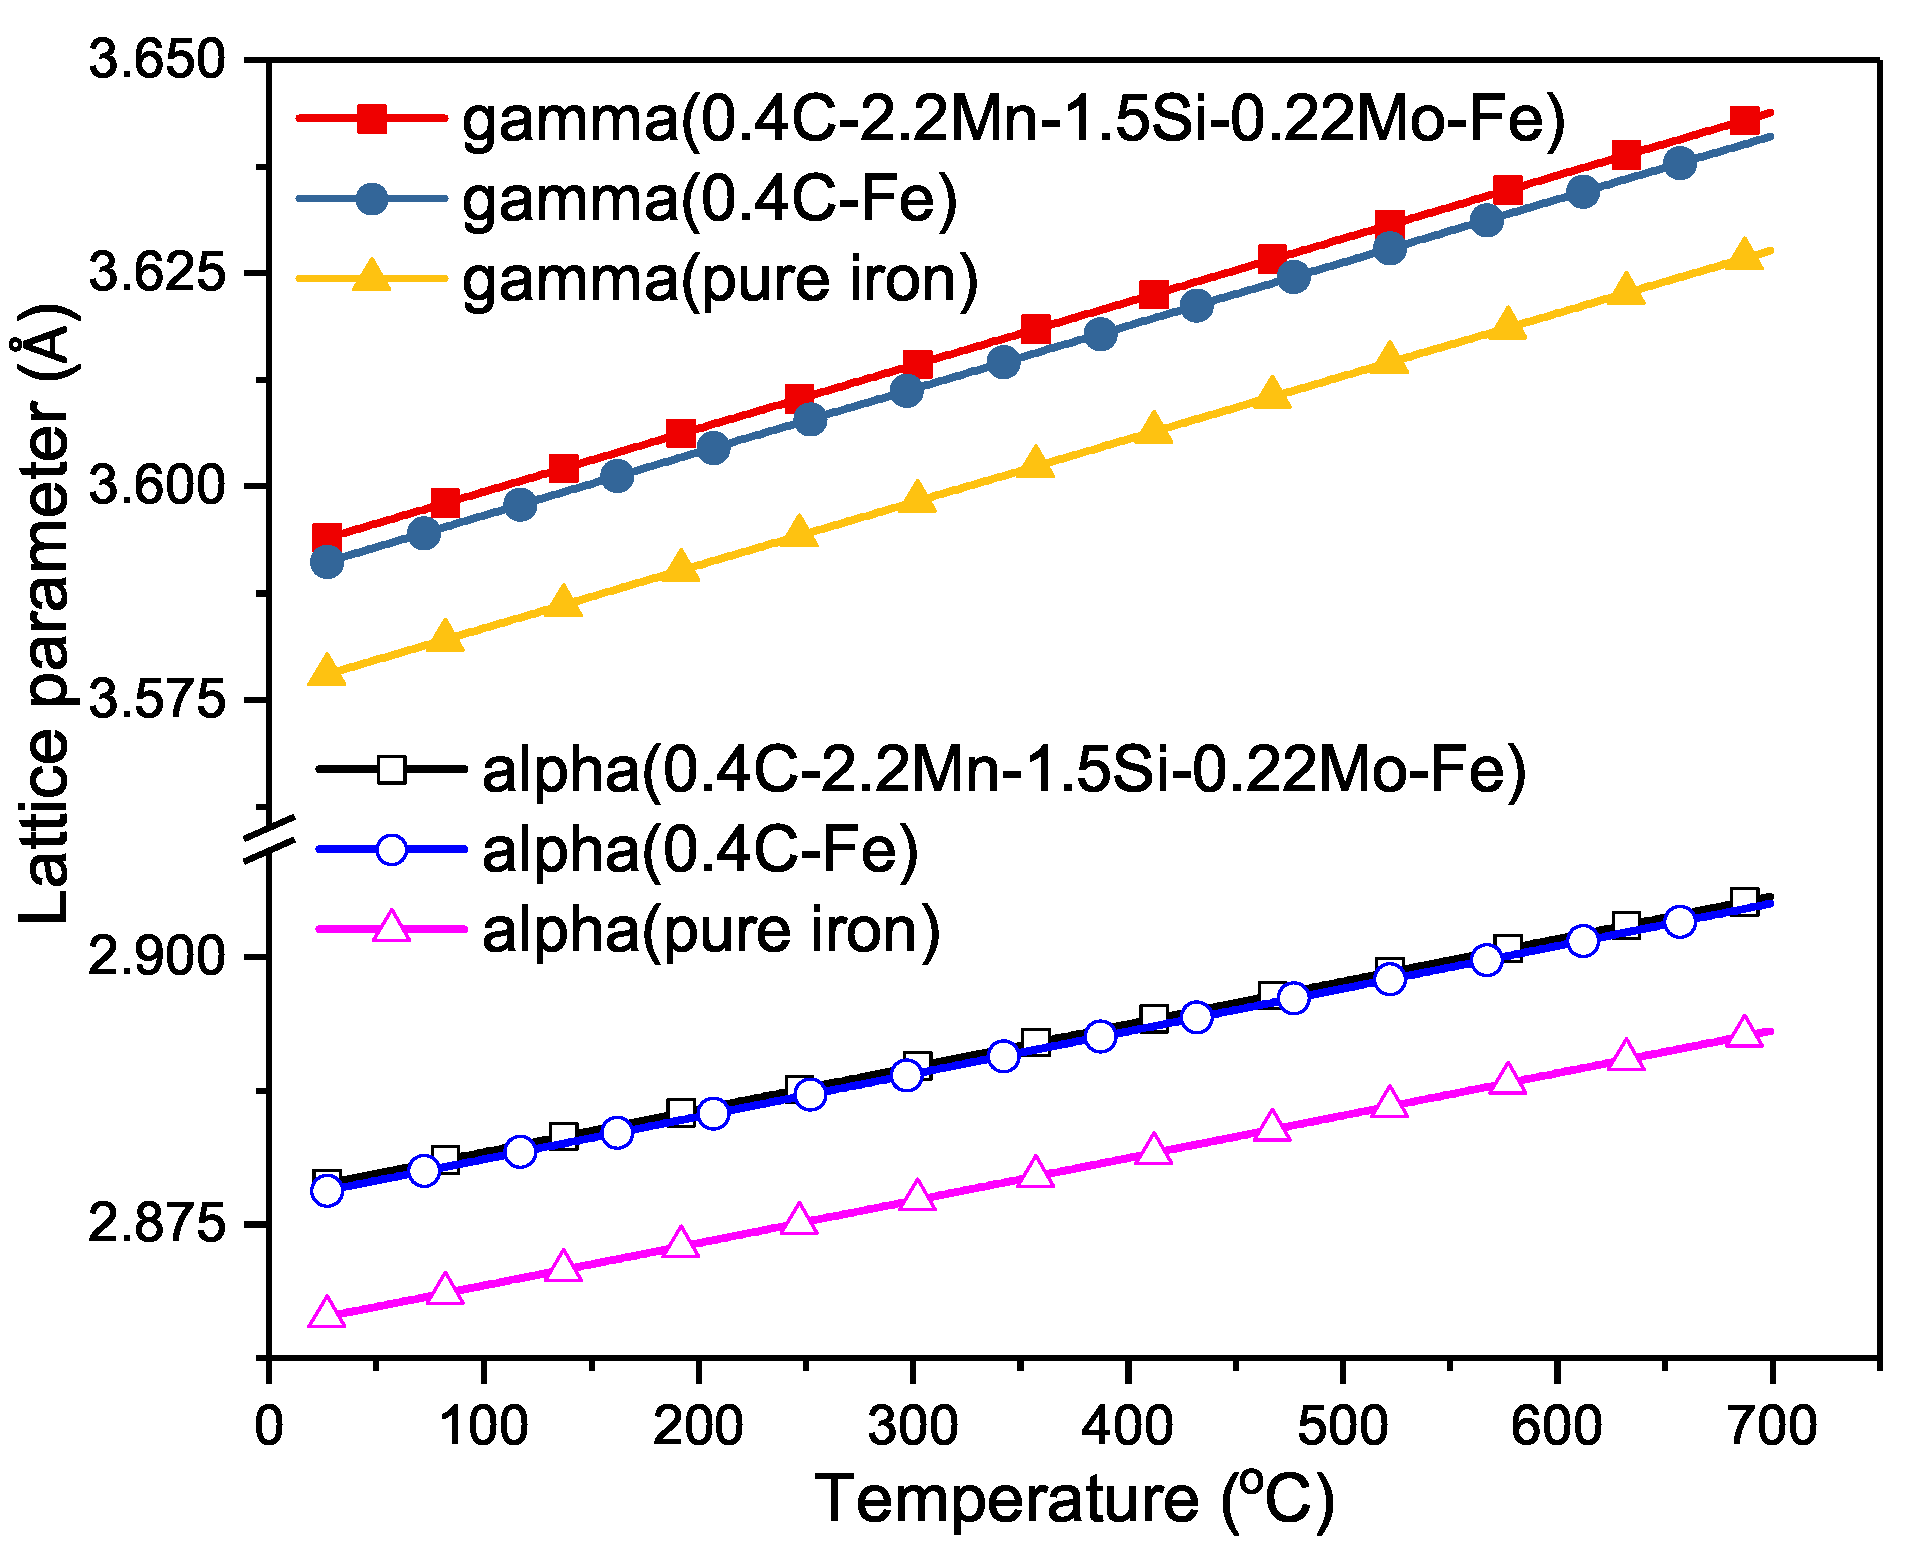
where is the carbon content within the range 0.0005 to 0.0365 in atomic fraction, and the applicable temperature is 1000 K 1250 K and 800 K 1200 K for gamma and alpha phase, respectively. The calculated result was found unreasonable if we used Equations (12) and (13) arbitrarily. Equations for lattice parameters may have their own applicable conditions. More research should be conducted in order to develop versatile lattice parameter models which can account for steels with complex composition and wide range of temperature. According to previous research, lattice parameters were found to be composition-dependent. Carbon in steels is small enough to fit at interstitial sites between solvent iron atoms. As against, substitutional atoms are usually large enough that they can replace iron atoms in their lattice positions. These solid dissolved atoms may cause the bonds of the solvent atoms to compress or stretch, and consequently give rise to lattice distortion [21]. Carbon serves the main contribution to the change of lattice parameters in steels, shown in Figure 6. The effects of alloy elements in gamma and alpha phase on the lattice change are different, giving the results of Figure 5.
The relative change of length decrease with temperature is attributed to the discrepancy between the lattice parameters of alpha and gamma phase Equation (7). According to Equations (9) and (11), is larger than . Further, the thermal expansion coefficient is larger than as well. As a consequence, the difference between and increases with temperature, as shown in Figure 7. According to Equation (6), the value of / increases with temperature, approaching 1 by extrapolation, indicating that the volume change before and after transformation diminishes.
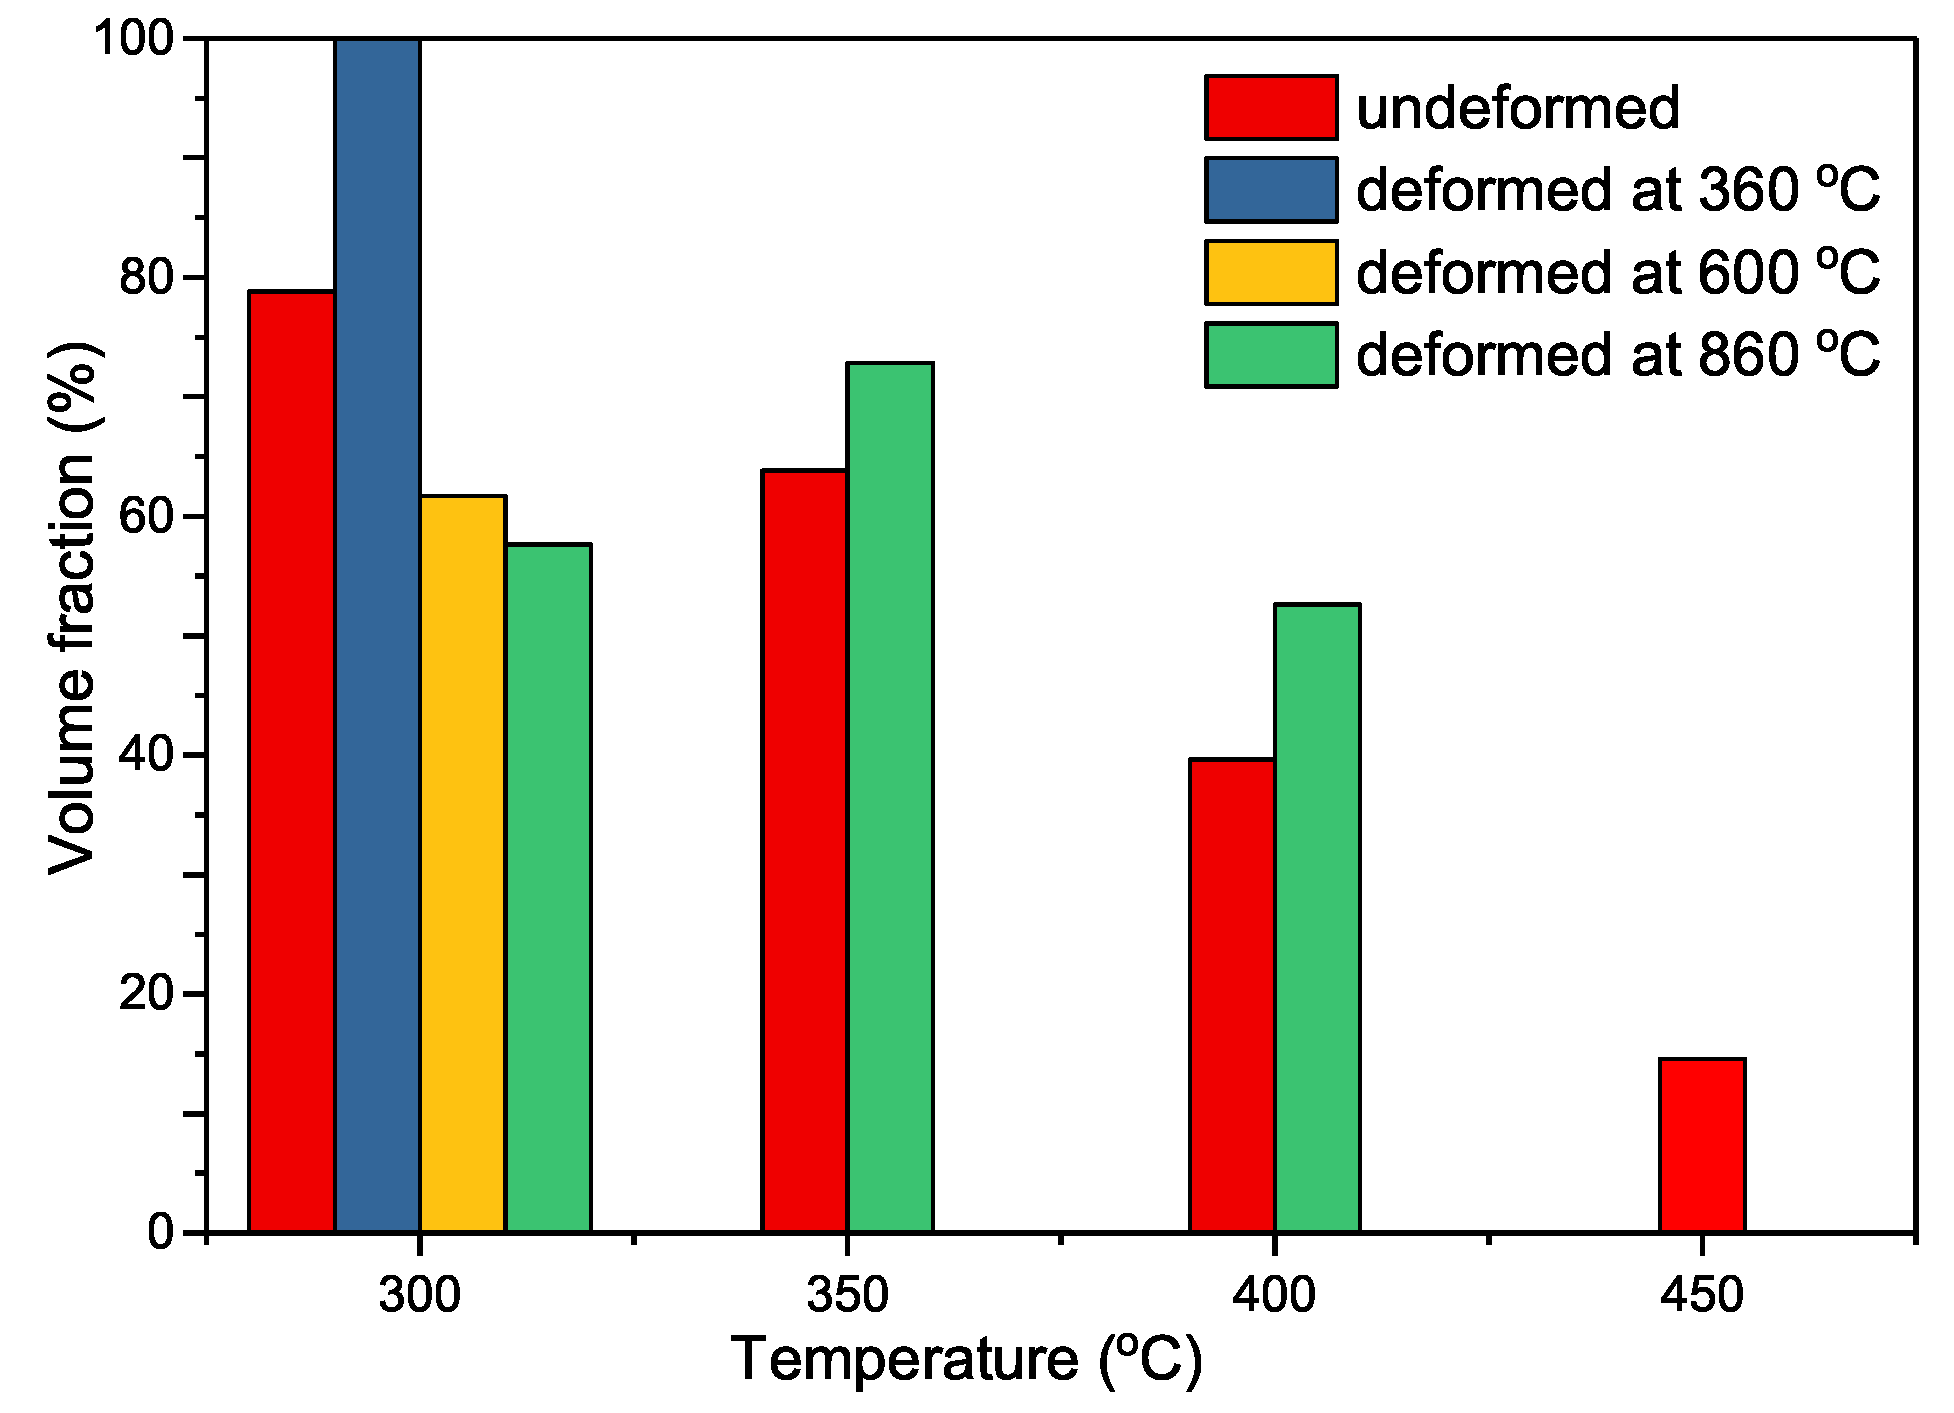
The volume fraction of transformation in different isothermal temperatures can be obtained, given that the relative change of length in real time can be measured by using a dilatometer; the relative change of length in complete transformation can be deduced by theoretical deduction. Figure 8 gives the volume fraction of bainite transformed from austenite in different isothermal temperature and deformation conditions. In undeformed condition, the volume fraction of bainite decreased with increasing temperature from 78% at 300 to 15% at 450 . However, this decreasing trend did not maintain when the samples were deformed at 860 , which had a peak value of 73% at 350 . When temperature was kept isothermal at 300 , the volume fraction decreased with deformation temperature.
The types of phase transformation can be speculated by relating temperature in which the isothermal transformation occurs. As for low-temperature nanobainitic steel, a high level of silicon content compresses the formation of cementite. So, the transformation taken place within 200 above the martensite start temperature can be deduced as bainitic phase transformation. The bainite transformation at higher isothermal temperature (450 ) may involve carbon diffusion. The carbon-enriched residual austenite with decreased driving force made the bainite transformation cease quickly.
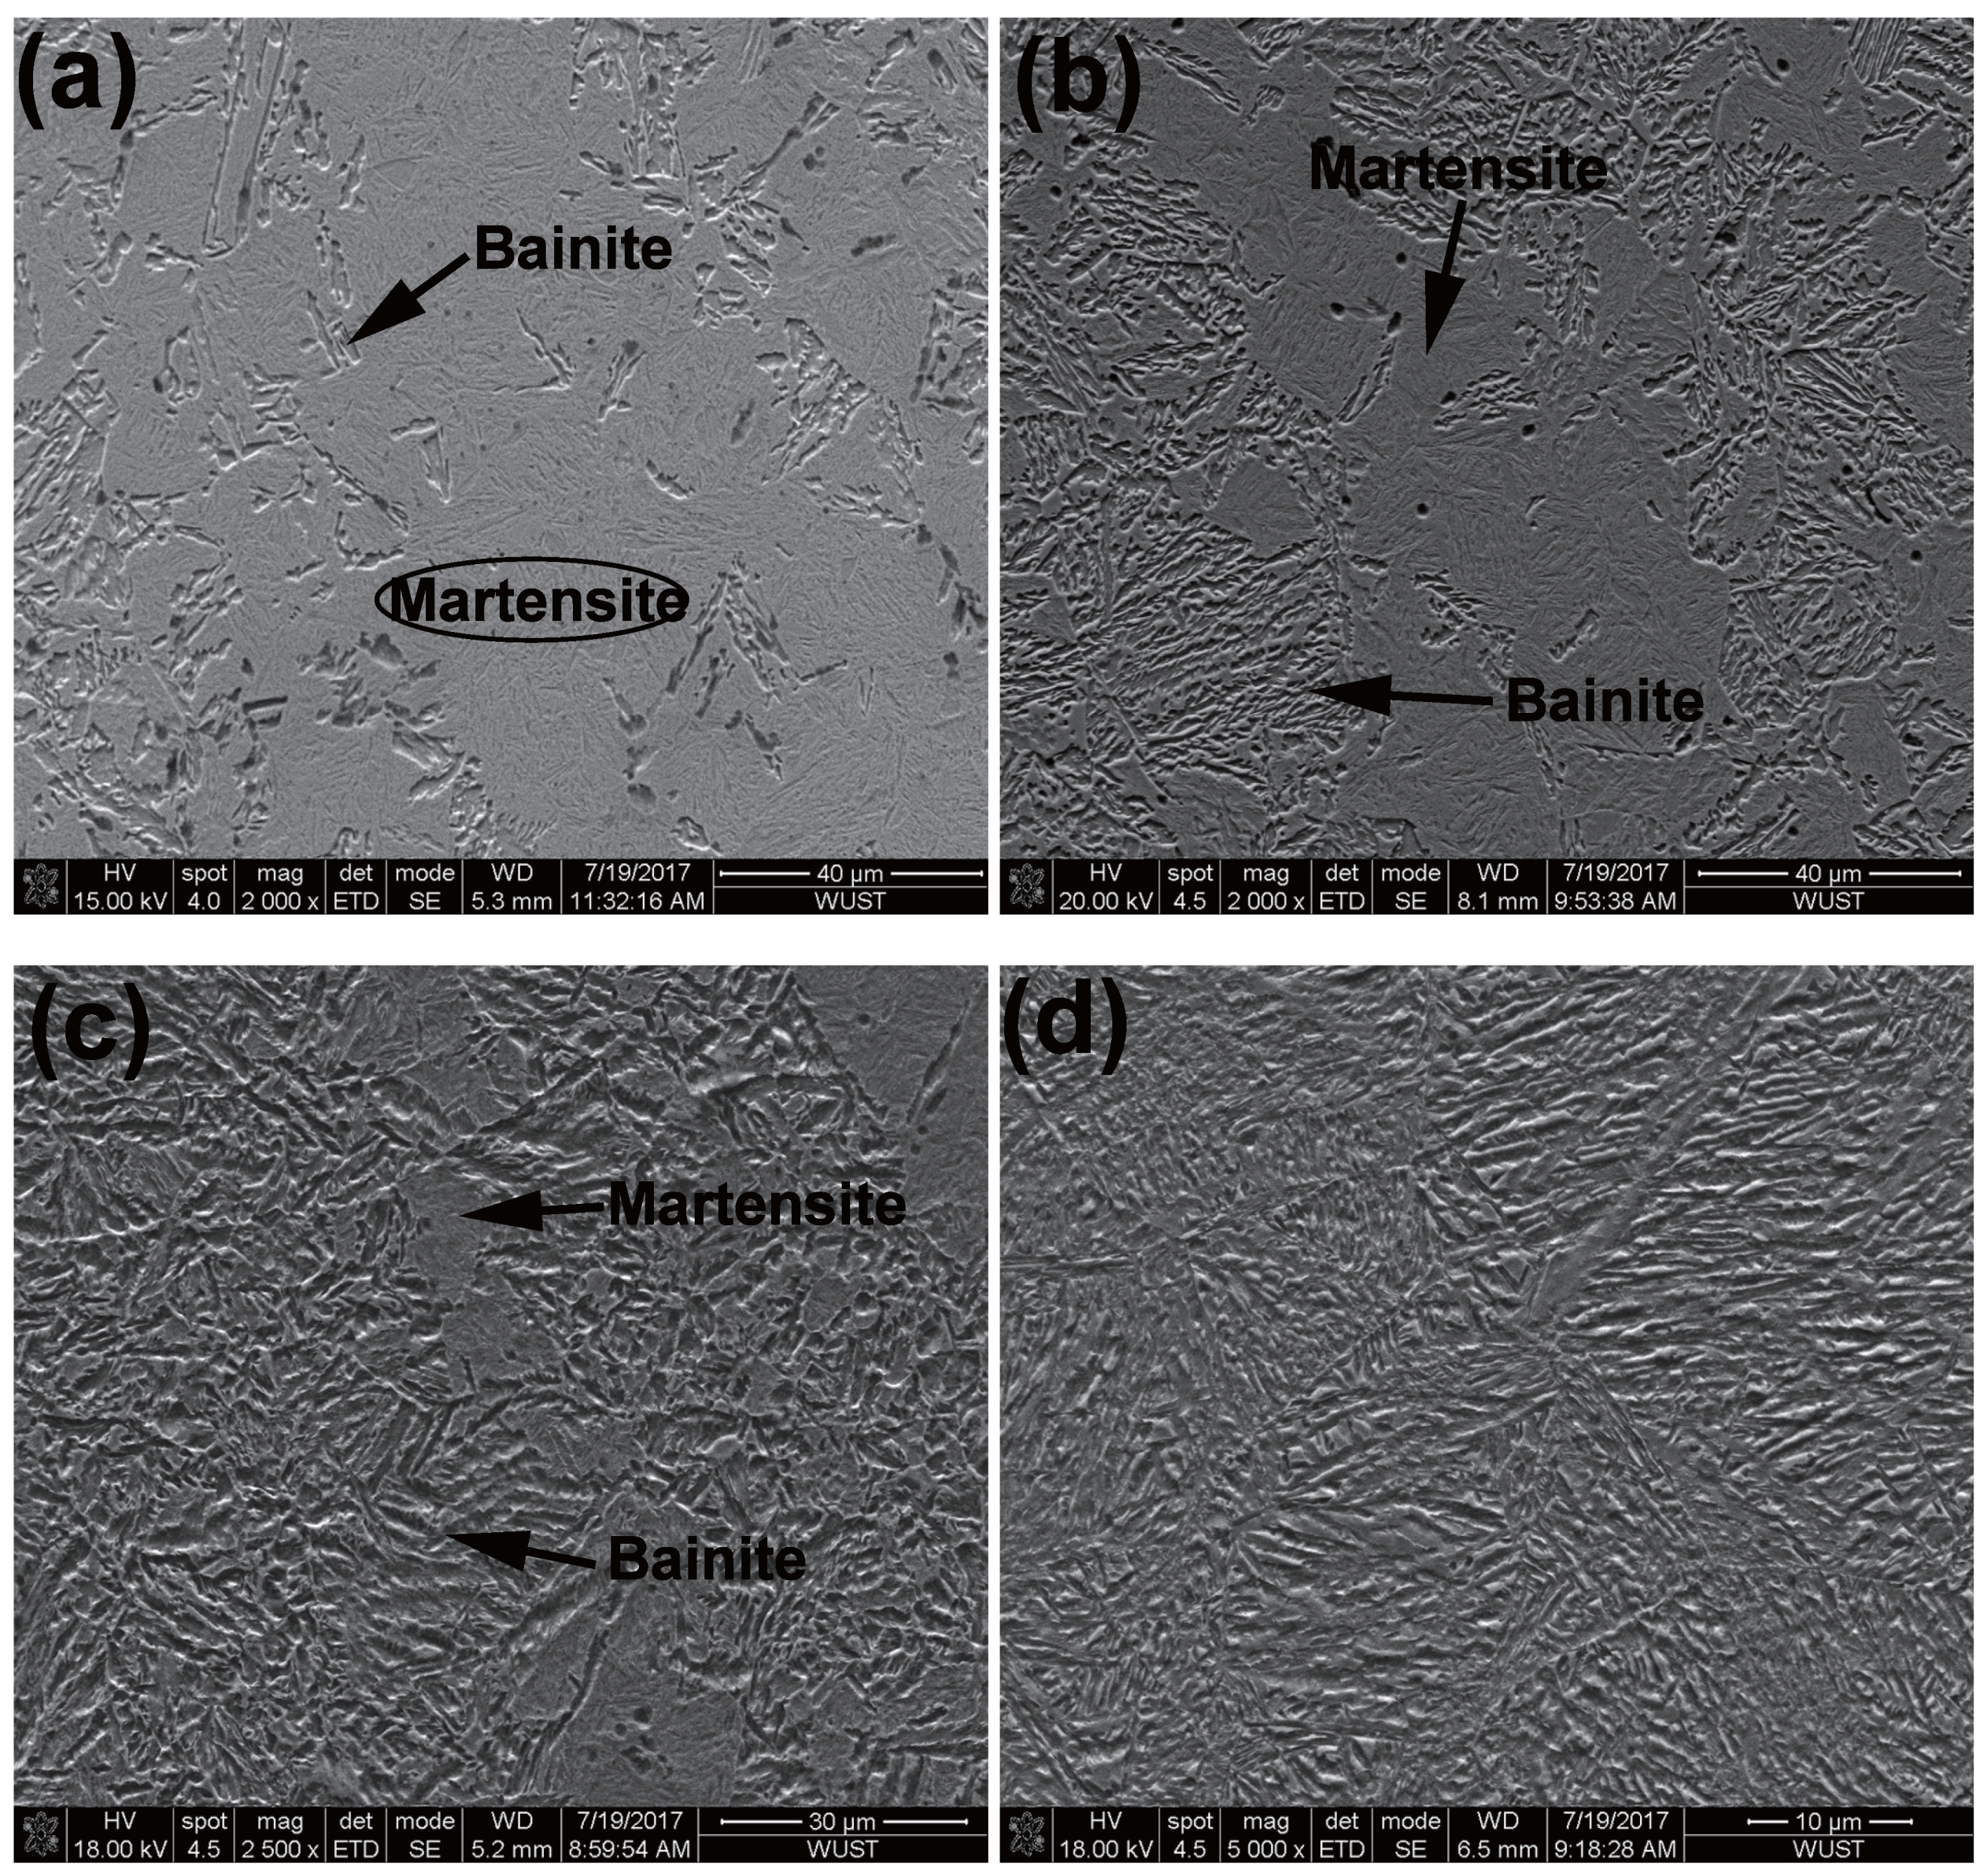
Figure 9 shows some representative microstructures of nanobainitic steel subjected to different treatments. The microstructures are predominantly bainite and martensite. From Figure 9a–d, the content of bainite increases gradually. It can be seen that there is only a small amount of bainite surrounded by the martensite matrix in Figure 9a, whereas the microstructure in Figure 9d is almost completely occupied by bainite—no obvious martensite can be found. These are consistent with the results predicted by the proposed model in Figure 8. It is difficult to obtain the volume fraction of bainite quantitatively in micrograph, as the shape of bainite is usually irregular and dispersed in martensite matrix. Dilatation curve analysis exhibits its advantage to provide an alternative method to solve this problem.
On the basis of the method developed in this study, the volume fraction of bainite in the condition that was deformed at 360 and isothermally transformed at 300 was up to 100%, which meant that the transformation was completed. However, the dilatation curve in Figure 4 does not decrease with temperature. In other words, more phase transformed in the cooling process below 300 . The calculated value was overestimated. This discrepancy may attribute to the models’ limitation and instrumental error. Deformation of steels involves the introduction of crystal defects. These defects can also cause crystal distortion like alloy elements. However, the present equations of lattice parameters may fail to perfectly account for the cases of steels with enriched defects. On the other hand, stress in compression test of low-temperature was so high that the deformation became nonuniform. Barreling and off-axis deformation happened, causing inaccurate dilation data recording. Additionally, the existence of residual stress may cause phase transformation in the preferred orientation [25]. The discrepancy arose when the relative change of length was used to calculate the volume fraction [26].
4.3. Evaluation of Bainitic Transformation
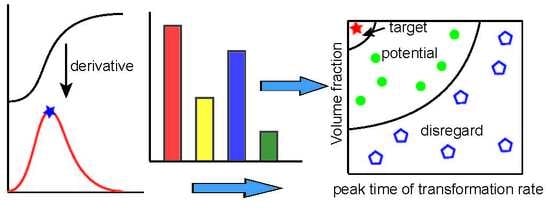
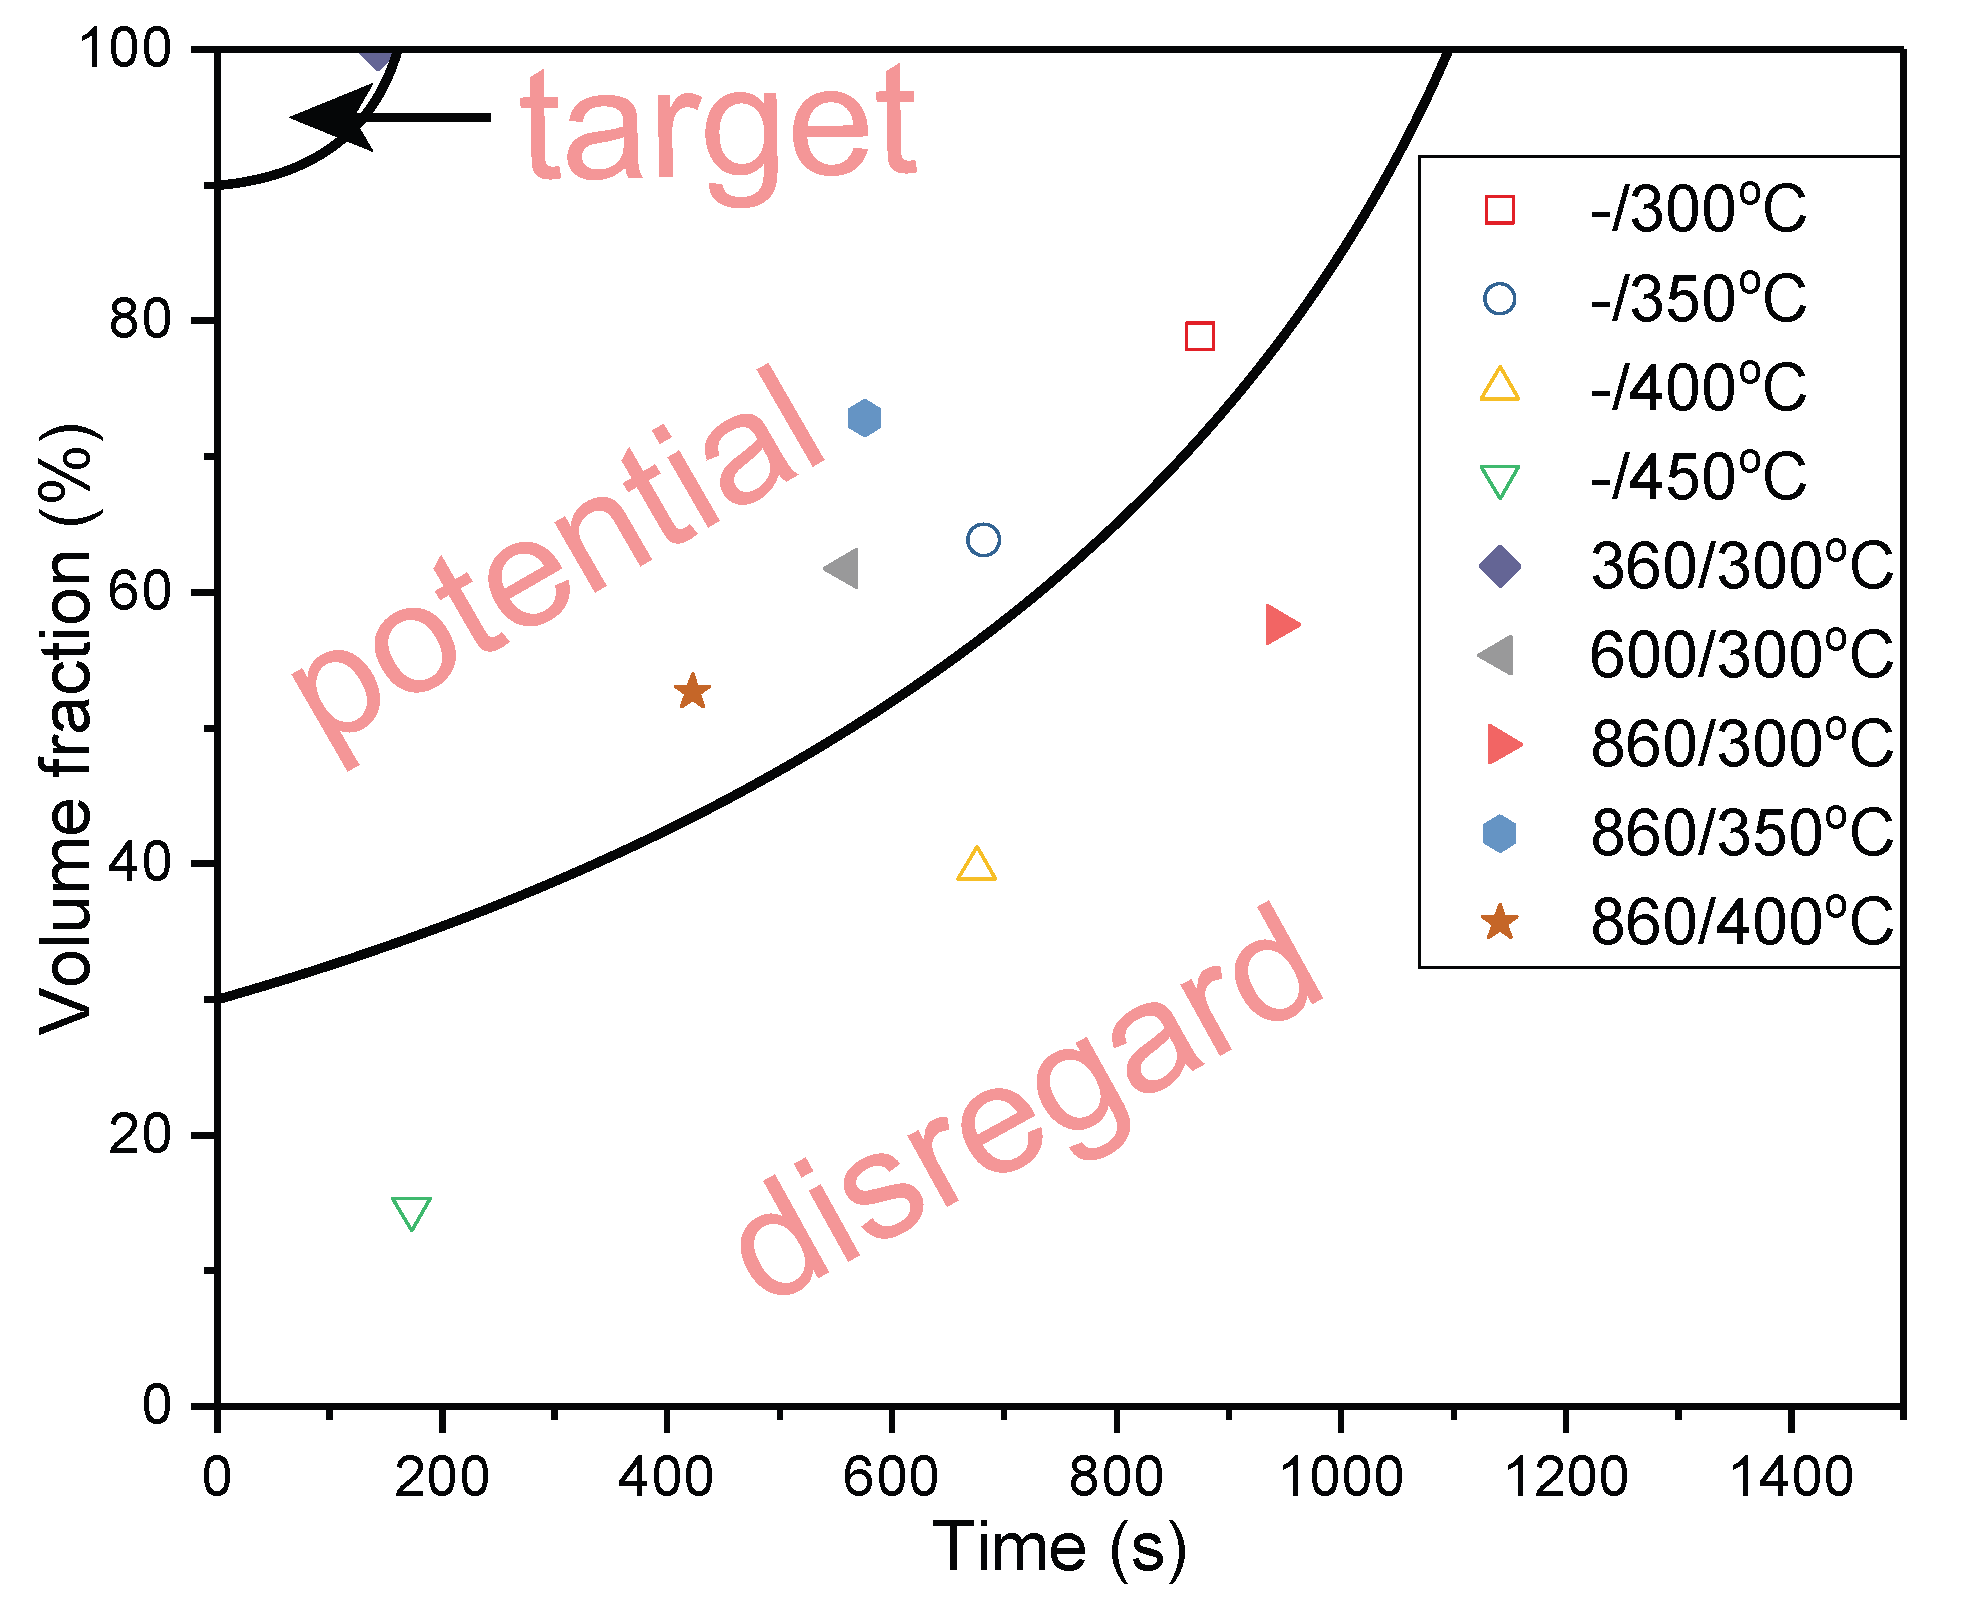
Combining the volume fraction of transformed bainite in different conditions and the corresponding PTTR gave Figure 10. We divided the diagram into three regions. Points in the aimed region had a small value of PTTR and a large (over 90%) volume fraction of aimed phase (bainite in this study). Points in the potential region corresponded to samples which had some amount (more than 30%) volume fraction of bainite, and not too great a PTTR value. It is possible to move these points into the aimed region by optimizing chemical composition, deformation, and isothermal conditions. However, if the points had a prolonged value of PTTR and a small volume fraction of aimed phase, the corresponding process should be disregarded.
The PTTR is a concise and effective parameter which can account for the information of transformation time. In the conventional method, transformation start and finish times may vary from person to person, which hinders the comparison of different techniques. The dilatation data obtained from dilatometer was scattered, and the noise would be introduced. If we directly take a derivative of the dilation curve with respect to the time, no meaningful information can be obtained, as the tendency of the curve is concealed by the local irregular data. So, curves smoothing is essential and is a prerequisite for the sequential work [27]. Low-temperature nanobainitic steel has good mechanical properties. A great deal of research has been conducted to try to decrease the bainitic transformation time, as the prolonged transformation time is an application barrier. By making a volume fraction versus PTTR graph, we could evaluate the bainite transformation clearly and concisely, which facilitates comparison of the preparation techniques.
5. Conclusions
The isothermal transformation of a low-temperature nanobainitic steel in deformed and undeformed conditions was studied by using a Gleeble-3500 thermomechanical simulator and a dilatometer (DIL805A). Combing theoretical deduction and dilatation curve analysis, the kinetics of bainitic transformation was evaluated. The following conclusions can be drawn:
- The relative change due to phase transformation is temperature-dependent and can be calculated theoretically.
- The peak time of transformation rate (PTTR) which was obtained by taking a derivative of the dilatation curve with respect to time can serve as a clear and effective parameter that accounts for the information of transformation time.
- By making a volume fraction versus PTTR graph, the bainite transformation was evaluated clearly and concisely, and can be used to optimize preparation techniques.
Acknowledgments
This work was supported by the National Natural Science Foundation of China (NSFC) (No. 51274154).
Author Contributions
Yaowen Xu conceived and designed the experiments. Yaowen Xu, Siqian Bao performed the experiments. Yaowen Xu and Gang Zhao analyzed the data. All authors discussed the results. Yaowen Xu wrote and edited the manuscript.
Conflicts of Interest
The authors declare no conflict of interest.
Abbreviations
The following abbreviations are used in this manuscript:
| PTTR | peak time of transformation rate |
References
- Onink, M.; Tichelaar, F.D.; Brakman, C.M.; Mittemeijer, E.J.; Van der Zwaag, S. Quantitative analysis of the dilatation by decomposition of Fe-C austenites; Calculation of volume change upon transformation. Z. Für Metallkd. 1996, 87, 24–32. [Google Scholar]
- García de Andrés, C.; Caballero, F.G.; Capdevila, C.; Bhadeshia, H.K.D.H. Modelling of kinetics and dilatometric behavior of non-isothermal pearlite-to-austenite transformation in an eutectoid steel. Scr. Mater. 1998, 39, 791–796. [Google Scholar] [CrossRef]
- Reed, R.C.; Akbay, T.; Shen, Z.; Robinson, J.M.; Root, J.H. Determination of reaustenitisation kinetics in a Fe-0.4C steel using using dilatometry and neutron diffraction. Mater. Sci. Eng. A 1998, 256, 152–165. [Google Scholar] [CrossRef]
- Caballero, F.G.; Capdevila, C.; Andrés, C.G.d. Kinetics and dilatometric behaviour of non-isothermal ferrite-austenite transformation. Mater. Sci. Technol. 2001, 17, 1114–1118. [Google Scholar] [CrossRef] [Green Version]
- Gómez, M.; Medina, S.F.; Caruana, G. Modelling of phase transformation kinetics by correction of dilatometry results for a ferritic Nb-microalloyed steel. ISIJ Int. 2003, 43, 1228–1237. [Google Scholar] [CrossRef] [Green Version]
- Choi, S. Model for estimation of transformation kinetics from the dilatation data during a cooling of hypoeutectoid steels. Mater. Sci. Eng. A 2003, 363, 72–80. [Google Scholar] [CrossRef]
- San Martín, D.; Rivera-Díaz-del Castillo, P.E.J.; García-de Andrés, C. In situ study of austenite formation by dilatometry in a low carbon microalloyed steel. Scr. Mater. 2008, 58, 926–929. [Google Scholar] [CrossRef] [Green Version]
- Kamyabi-Gol, A.; Clark, S.J.; Gibbs, J.W.; Sridhar, S.; Mendez, P.F. Quantification of evolution of multiple simultaneous phase transformations using dilation curve analysis (DCA). Acta Mater. 2016, 102, 231–240. [Google Scholar] [CrossRef]
- Xu, G.; Liu, F.; Wang, L.; Hu, H. A new approach to quantitative analysis of bainitic transformation in a superbainite steel. Scr. Mater. 2013, 68, 833–836. [Google Scholar] [CrossRef]
- Bhadeshia, H.; Edmonds, D. Bainite in silicon steels: New composition-property approach Part 1. Metal Sci. 1983, 17, 411–419. [Google Scholar] [CrossRef]
- Caballero, F.G.; Bhadeshia, H.K.D.H. Very strong bainite. Curr. Opin. Solid State Mater. Sci. 2004, 8, 251–257. [Google Scholar] [CrossRef]
- Caballero, F.; Bhadeshia, H.; Mawella, K.; Jones, D.; Brown, P. Very strong low temperature bainite. Mater. Sci. Technol. 2002, 18, 279–284. [Google Scholar] [CrossRef] [Green Version]
- Gong, W.; Tomota, Y.; Adachi, Y.; Paradowska, A.M.; Kelleher, J.F.; Zhang, S.Y. Effects of ausforming temperature on bainite transformation, microstructure and variant selection in nanobainite steel. Acta Mater. 2013, 61, 4142–4154. [Google Scholar] [CrossRef]
- Zhang, M.; Wang, Y.H.; Zheng, C.L.; Zhang, F.C.; Wang, T.S. Effects of ausforming on isothermal bainite transformation behaviour and microstructural refinement in medium-carbon Si-Al-rich alloy steel. Mater. Des. 2014, 62, 168–174. [Google Scholar] [CrossRef]
- He, J.; Zhao, A.; Zhi, C.; Fan, H. Acceleration of nanobainite transformation by multi-step ausforming process. Scr. Mater. 2015, 107, 71–74. [Google Scholar] [CrossRef]
- Hu, H.; Zurob, H.S.; Xu, G.; Embury, D.; Purdy, G.R. New insights to the effects of ausforming on the bainitic transformation. Mater. Sci. Eng. A 2015, 626, 34–40. [Google Scholar] [CrossRef]
- Hu, F.; Wu, K.M.; Zheng, H. Influence of Co and Al on bainitic transformation in super bainitic steels. Steel Res. Int. 2013, 84, 1060–1065. [Google Scholar] [CrossRef]
- Zhao, L.; Qian, L.; Meng, J.; Zhou, Q.; Zhang, F. Below-Ms austempering to obtain refined bainitic structure and enhanced mechanical properties in low-C high-Si/Al steels. Scr. Mater. 2016, 112, 96–100. [Google Scholar] [CrossRef]
- Kang, J.Y.; Park, S.J.; Suh, D.W.; Han, H.N. Estimation of phase fraction in dual phase steel using microscopic characterizations and dilatometric analysis. Mater. Charact. 2013, 84, 205–215. [Google Scholar] [CrossRef]
- Dyson, D.; Holmes, B. Effect of alloying additions on the lattice parameter of austenite. J. Iron Steel Inst. 1970, 208, 469–474. [Google Scholar]
- Babu, S.S.; Specht, E.D.; David, S.A.; Karapetrova, E.; Zschack, P.; Peet, M.; Bhadeshia, H.K.D.H. In-situ observations of lattice parameter fluctuations in austenite and transformation to bainite. Metall. Mater. Trans. A 2005, 36, 3281–3289. [Google Scholar] [CrossRef]
- Bhadeshia, H.; David, S.; Vitek, J.; Reed, R. Stress induced transformation to bainite in Fe-Cr-Mo-C pressure vessel steel. Mater. Sci. Technol. 1991, 7, 686–698. [Google Scholar] [CrossRef]
- van Bohemen, S.M.C. The nonlinear lattice expansion of iron alloys in the range 100–1600 K. Scr. Mater. 2013, 69, 315–318. [Google Scholar] [CrossRef]
- Onink, M.; Brakman, C.; Tichelaar, F.; Mittemeijer, E.; Van der Zwaag, S.; Root, J.; Konyer, N. The lattice-parameters of austenite and ferrite in Fe-C alloys as functions of carbon concentration and temperature. Scr. Metall. Mater. 1993, 29, 1011–1016. [Google Scholar] [CrossRef]
- Zhou, M.-X.; Xu, G.; Wang, L.; Xue, Z.-L.; Hu, H.-J. Comprehensive analysis of the dilatation during bainitic transformation under stress. Metals Mater. Int. 2015, 21, 985–990. [Google Scholar] [CrossRef]
- Suh, D.W.; Oh, C.S.; Han, H.N.; Kim, S.J. Dilatometric analysis of austenite decomposition considering the effect of non-isotropic volume change. Acta Mater. 2007, 55, 2659–2669. [Google Scholar] [CrossRef]
- Park, B.J.; Choi, J.M.; Lee, K.J. Analysis of phase transformations during continuous cooling by the first derivative of dilatation in low carbon steels. Mater. Charact. 2012, 64, 8–14. [Google Scholar] [CrossRef]
Figure 1.
Schematic illustration of experimental process. (a) Isothermal transformation of undeformed austenite; (b) Isothermal transformation of deformed austenite.
Figure 1.
Schematic illustration of experimental process. (a) Isothermal transformation of undeformed austenite; (b) Isothermal transformation of deformed austenite.
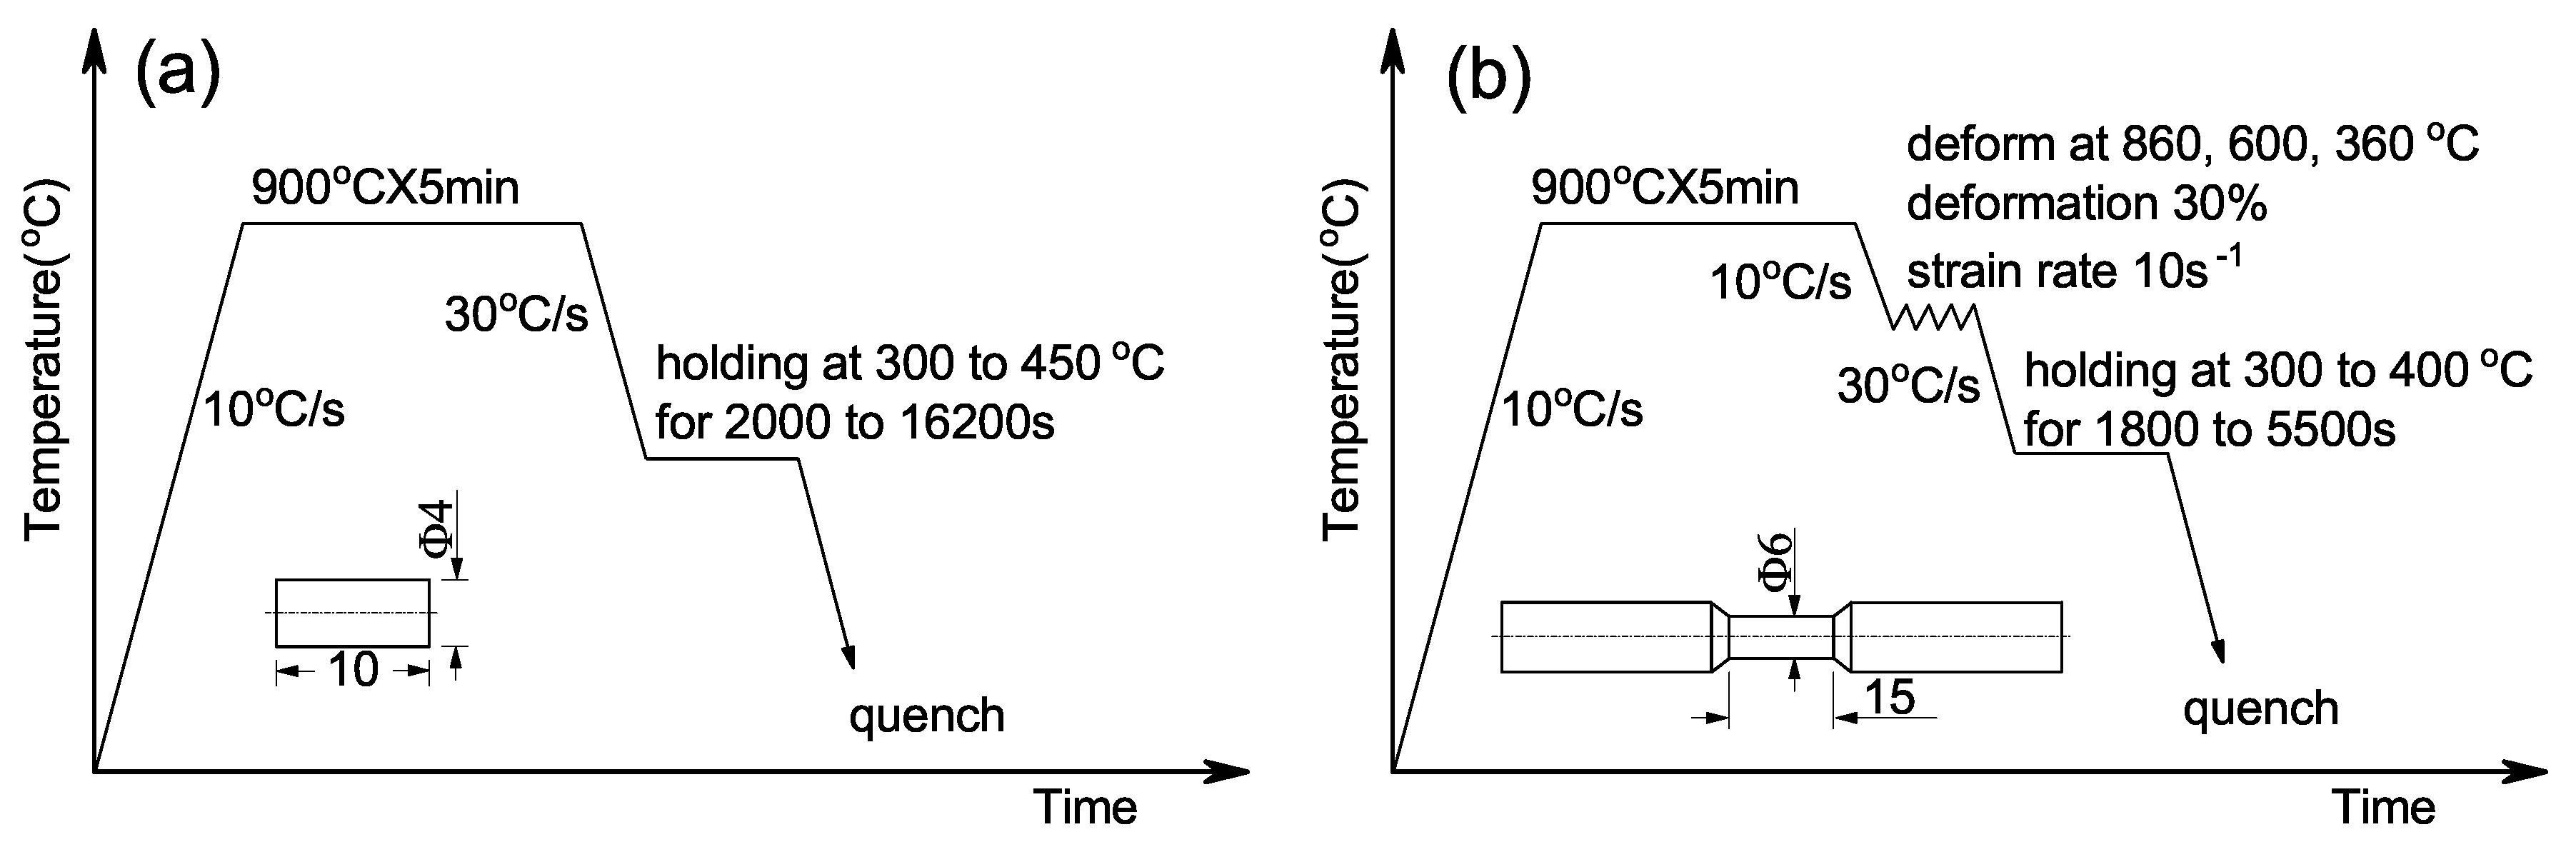
Figure 2.
Relationship between dilatation () and holding time in different isothermal conditions of (a) undeformed and (b) deformed at different temperature. The number on the left and right side of the symbol “/” denotes the deformation and isothermal temperature respectively.
Figure 2.
Relationship between dilatation () and holding time in different isothermal conditions of (a) undeformed and (b) deformed at different temperature. The number on the left and right side of the symbol “/” denotes the deformation and isothermal temperature respectively.

Figure 3.
Transformation rate as a function of holding time in the condition of (a) undeformed and (b) deformed at different temperature followed by isothermal transformation.
Figure 3.
Transformation rate as a function of holding time in the condition of (a) undeformed and (b) deformed at different temperature followed by isothermal transformation.
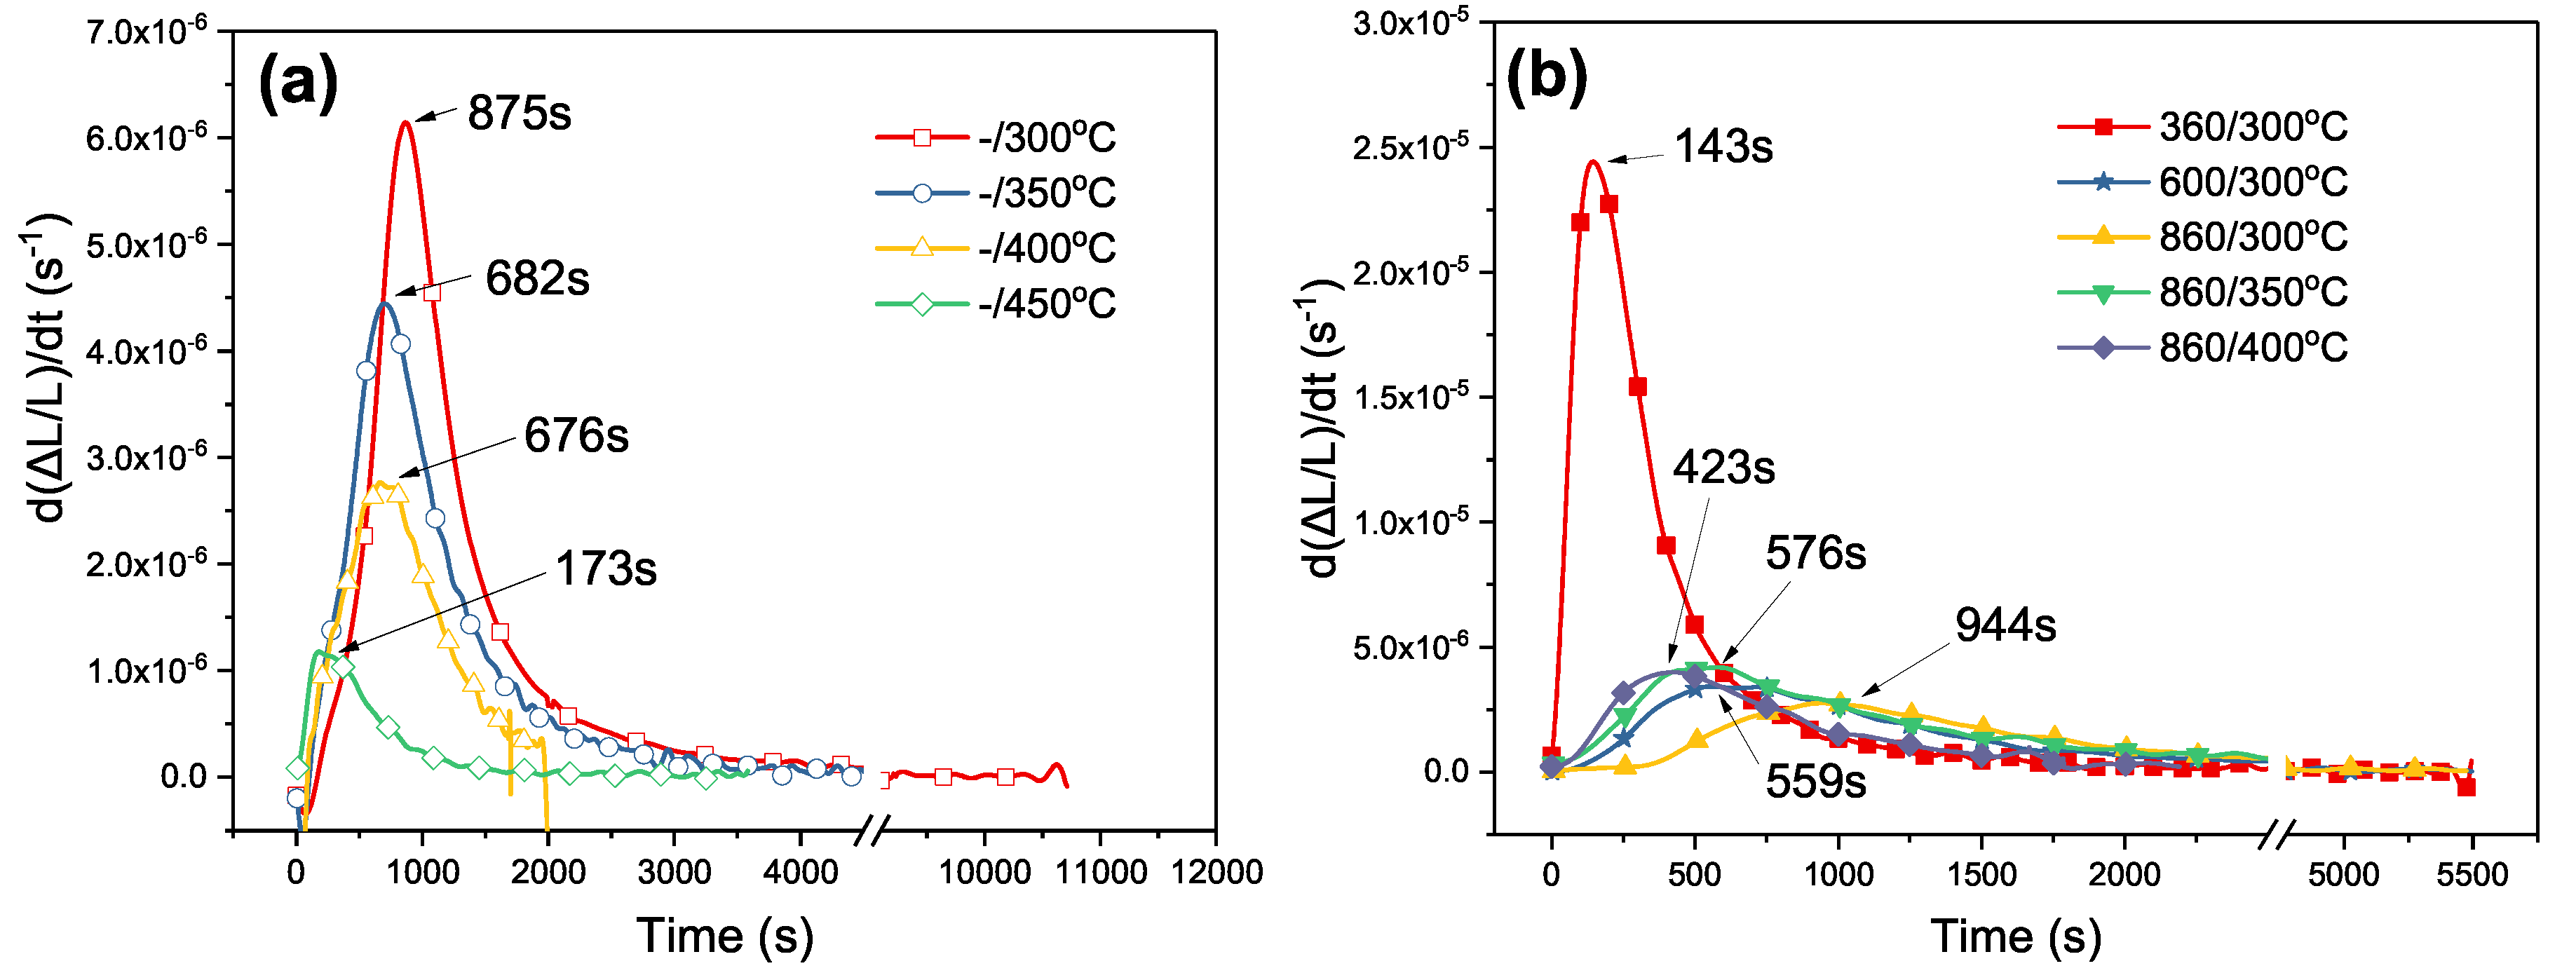
Figure 4.
Dilatation at specific isothermal temperature and in subsequent cooling process.

Figure 5.
Relative change of length in two steels and pure iron as a function of temperature by theoretical calculation in complete transformation from face-centered cubic to body-centered cubic crystal structure.
Figure 5.
Relative change of length in two steels and pure iron as a function of temperature by theoretical calculation in complete transformation from face-centered cubic to body-centered cubic crystal structure.

Figure 6.
Lattice parameters of gamma and alpha phase as a function of temperature in pure iron, C-Mn, and bainitic steels.
Figure 6.
Lattice parameters of gamma and alpha phase as a function of temperature in pure iron, C-Mn, and bainitic steels.

Figure 7.
Ratio of volume and lattice parameter in gamma and alpha phase as a function of temperature.
Figure 7.
Ratio of volume and lattice parameter in gamma and alpha phase as a function of temperature.

Figure 8.
Volume fraction of transformed bainite as a function of isothermal temperature in different deformation conditions.
Figure 8.
Volume fraction of transformed bainite as a function of isothermal temperature in different deformation conditions.

Figure 9.
SEM micrographs of nanobainitic steel subjected to the treatments of (a) -/450, holding at 450 without deformation; (b) -/400, holding at 400 without deformation; (c) 860/350, deformed at 860 and followed by isothermal holding at 350 ; (d) 360/300, deformed at 360 and followed by isothermal holding at 300 .

Figure 10.
Volume fraction of transformed bainite versus PTTR (peak time of transformation rate).


Table 1.
Chemical composition (wt %) of the steel used in this study.
| C | Si | Mn | Al | P | S | Mo |
|---|---|---|---|---|---|---|
| 0.4 | 1.5 | 2.2 | 0.033 | 0.008 | 0.001 | 0.22 |
© 2017 by the authors. Licensee MDPI, Basel, Switzerland. This article is an open access article distributed under the terms and conditions of the Creative Commons Attribution (CC BY) license (http://creativecommons.org/licenses/by/4.0/).
Share and Cite
MDPI and ACS Style
Xu, Y.; Xu, G.; Mao, X.; Zhao, G.; Bao, S. Method to Evaluate the Kinetics of Bainite Transformation in Low-Temperature Nanobainitic Steel Using Thermal Dilatation Curve Analysis. Metals 2017, 7, 330. https://doi.org/10.3390/met7090330
AMA Style
Xu Y, Xu G, Mao X, Zhao G, Bao S. Method to Evaluate the Kinetics of Bainite Transformation in Low-Temperature Nanobainitic Steel Using Thermal Dilatation Curve Analysis. Metals. 2017; 7(9):330. https://doi.org/10.3390/met7090330
Chicago/Turabian StyleXu, Yaowen, Guang Xu, Xinping Mao, Gang Zhao, and Siqian Bao. 2017. "Method to Evaluate the Kinetics of Bainite Transformation in Low-Temperature Nanobainitic Steel Using Thermal Dilatation Curve Analysis" Metals 7, no. 9: 330. https://doi.org/10.3390/met7090330
Note that from the first issue of 2016, this journal uses article numbers instead of page numbers. See further details here.