2. Materials and Methods
Many models for the calculation of the yield strength of austenitic steels have been published in the past. Those models generally employ two mechanisms to describe the yield strength: a strengthening by grain size reduction, the Hall-Petch effect, and the alloying elements’ contribution to the material’s strength [
15,
36,
37]. Many of those models have used databases with significant amounts of different alloys to employ a linear regression in order to get parameters that determine the effect of alloying elements on the yield strength of the austenitic steel. Assuming that SRO in HMnS influences the yield strength
significantly, a term describing this effect has to be added to the equation [
14], resulting in:
where
is the base strength of a pure austenitic iron lattice and is assumed to be
[
14].
is the contribution of alloying elements to the change in yield strength relative to a pure austenitic lattice. Since this paper focuses on HMnS with the main alloying elements C, Mn, and Al, those elements are assumed to be the main contributors to solid solution strengthening and the contributions of other alloying elements are neglected. It is assumed that this does not lead to a large mistake in calculating
because, apart from Mn and Al, no substitutional alloying element exceeds alloying contents of more than
.
is the change in yield strength stemming from the existence of short-range ordered regions in the material. Based on the work of [
14], this contribution to yield strength can be calculated as:
where
is the Taylor-factor for fcc with
being the magnitude of the Burgers vector and the lattice parameter in austenite in Ȧ depending on the molar fractions
of the alloying elements and temperature in K [
38]:
Looking at Equation (3), the temperature dependence of the lattice parameter is assumed to be linear.
describes the strengthening by grain refinement in accordance with the Hall-Petch effect and can be formulated as:
Even though
depends on the cooling procedure and the carbon content [
39], the value
seems to be a reasonable assumption for HMnS in general, based on the findings in the literature [
1,
2,
14,
39,
40,
41].
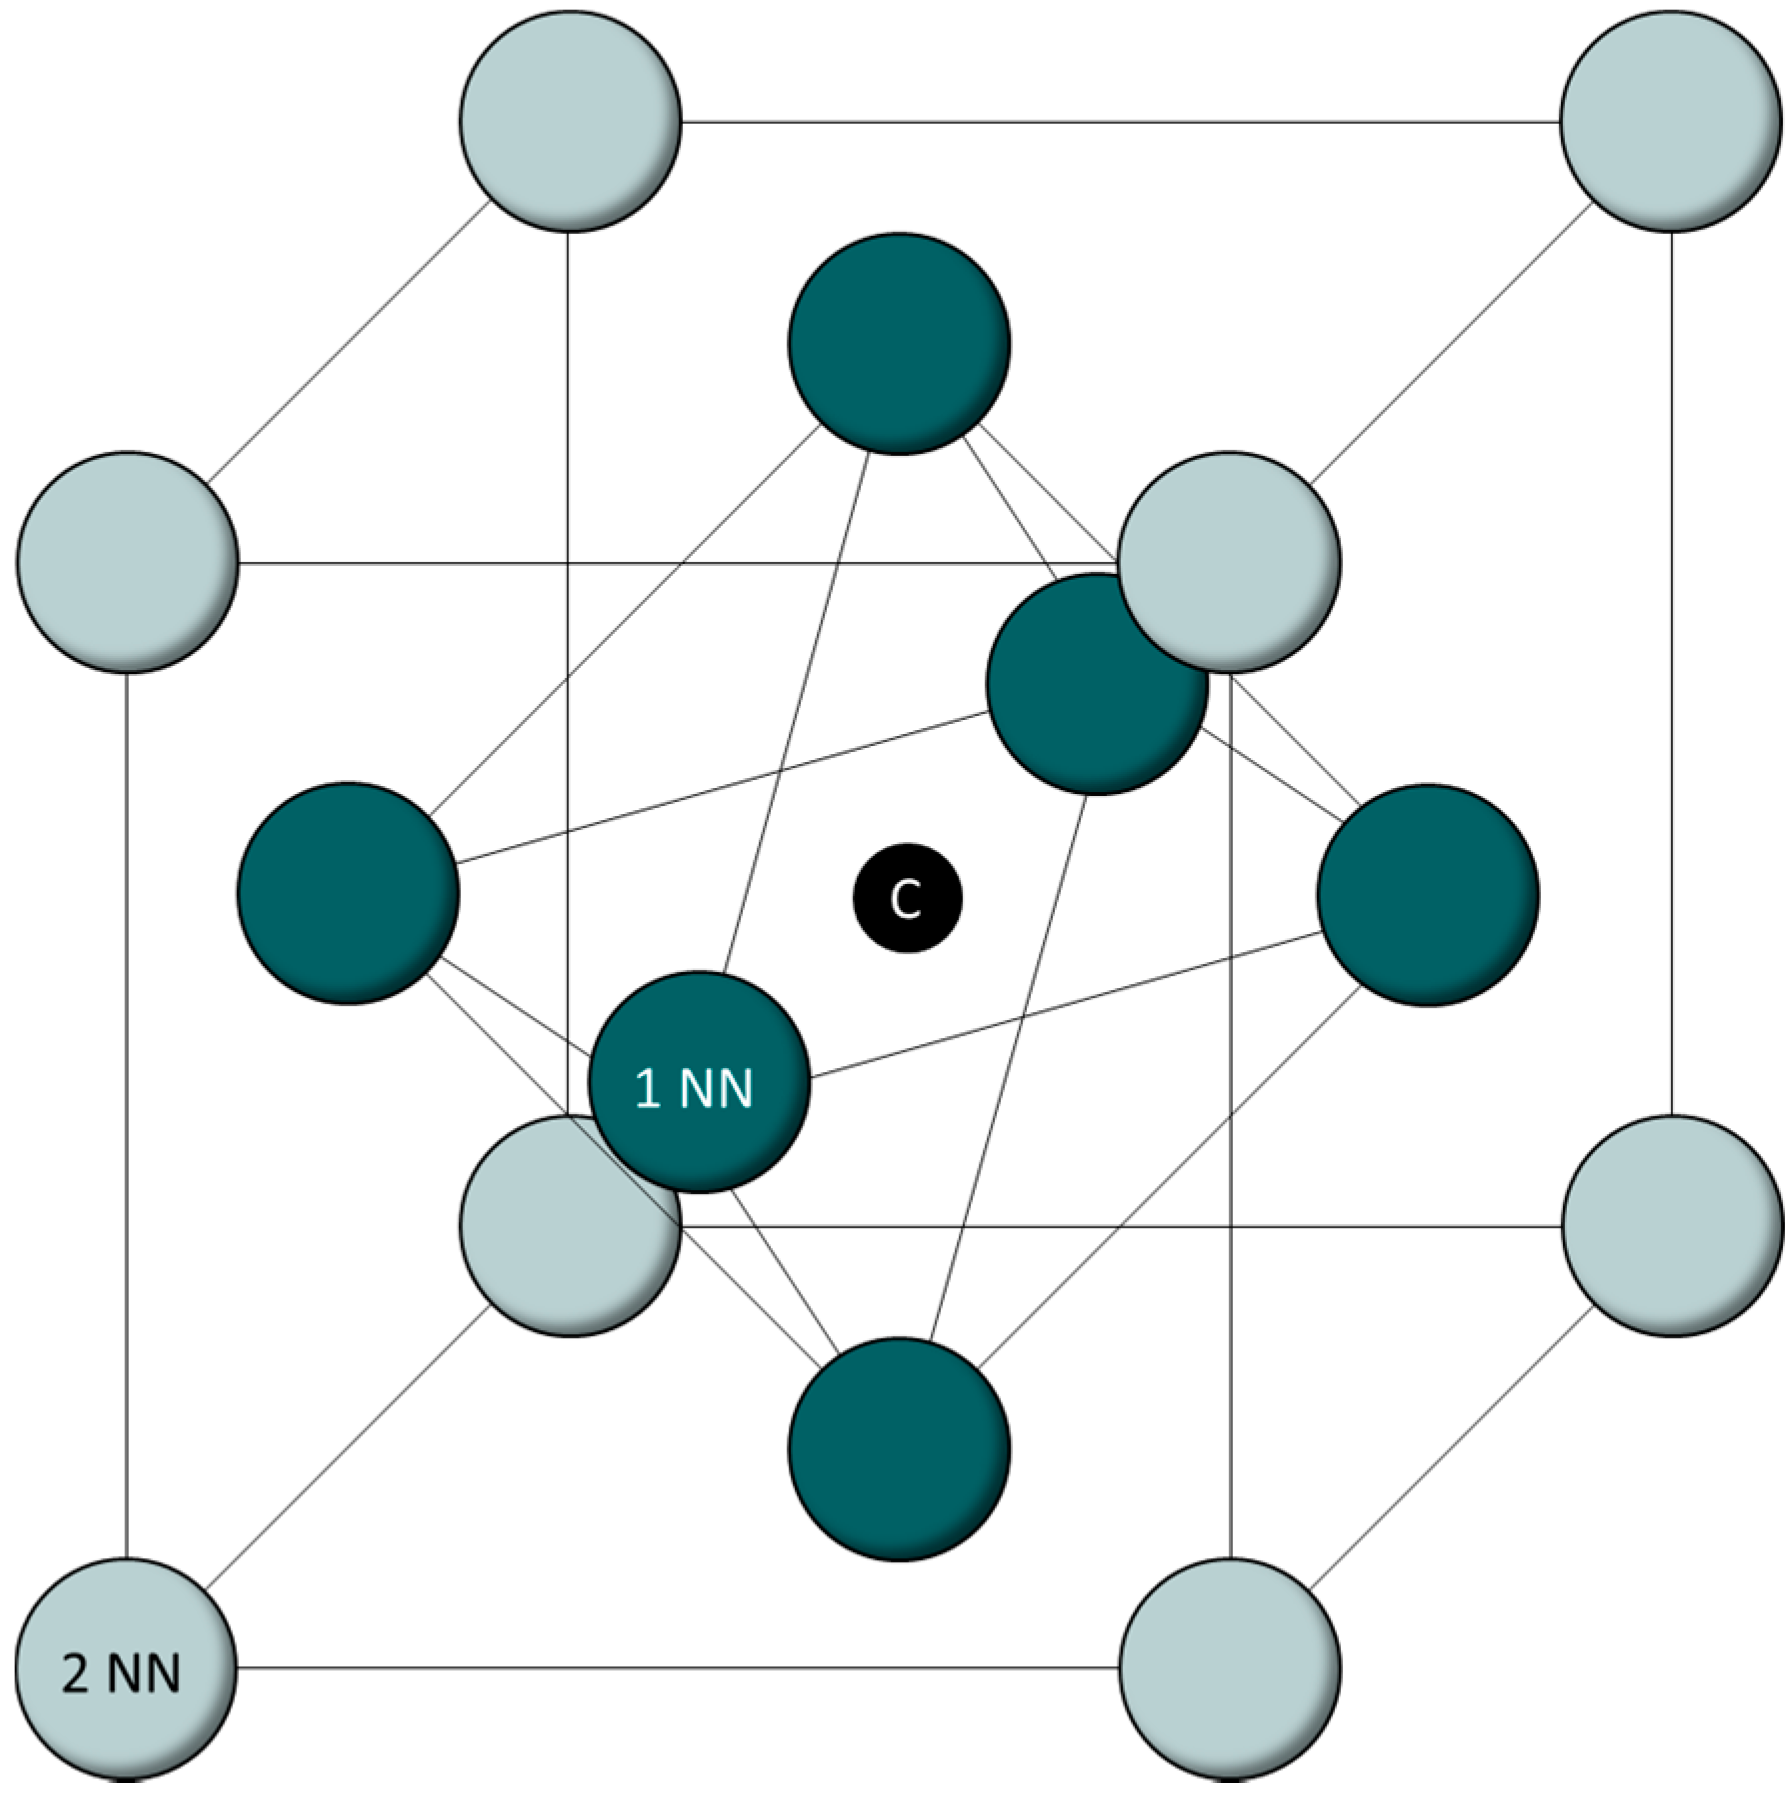
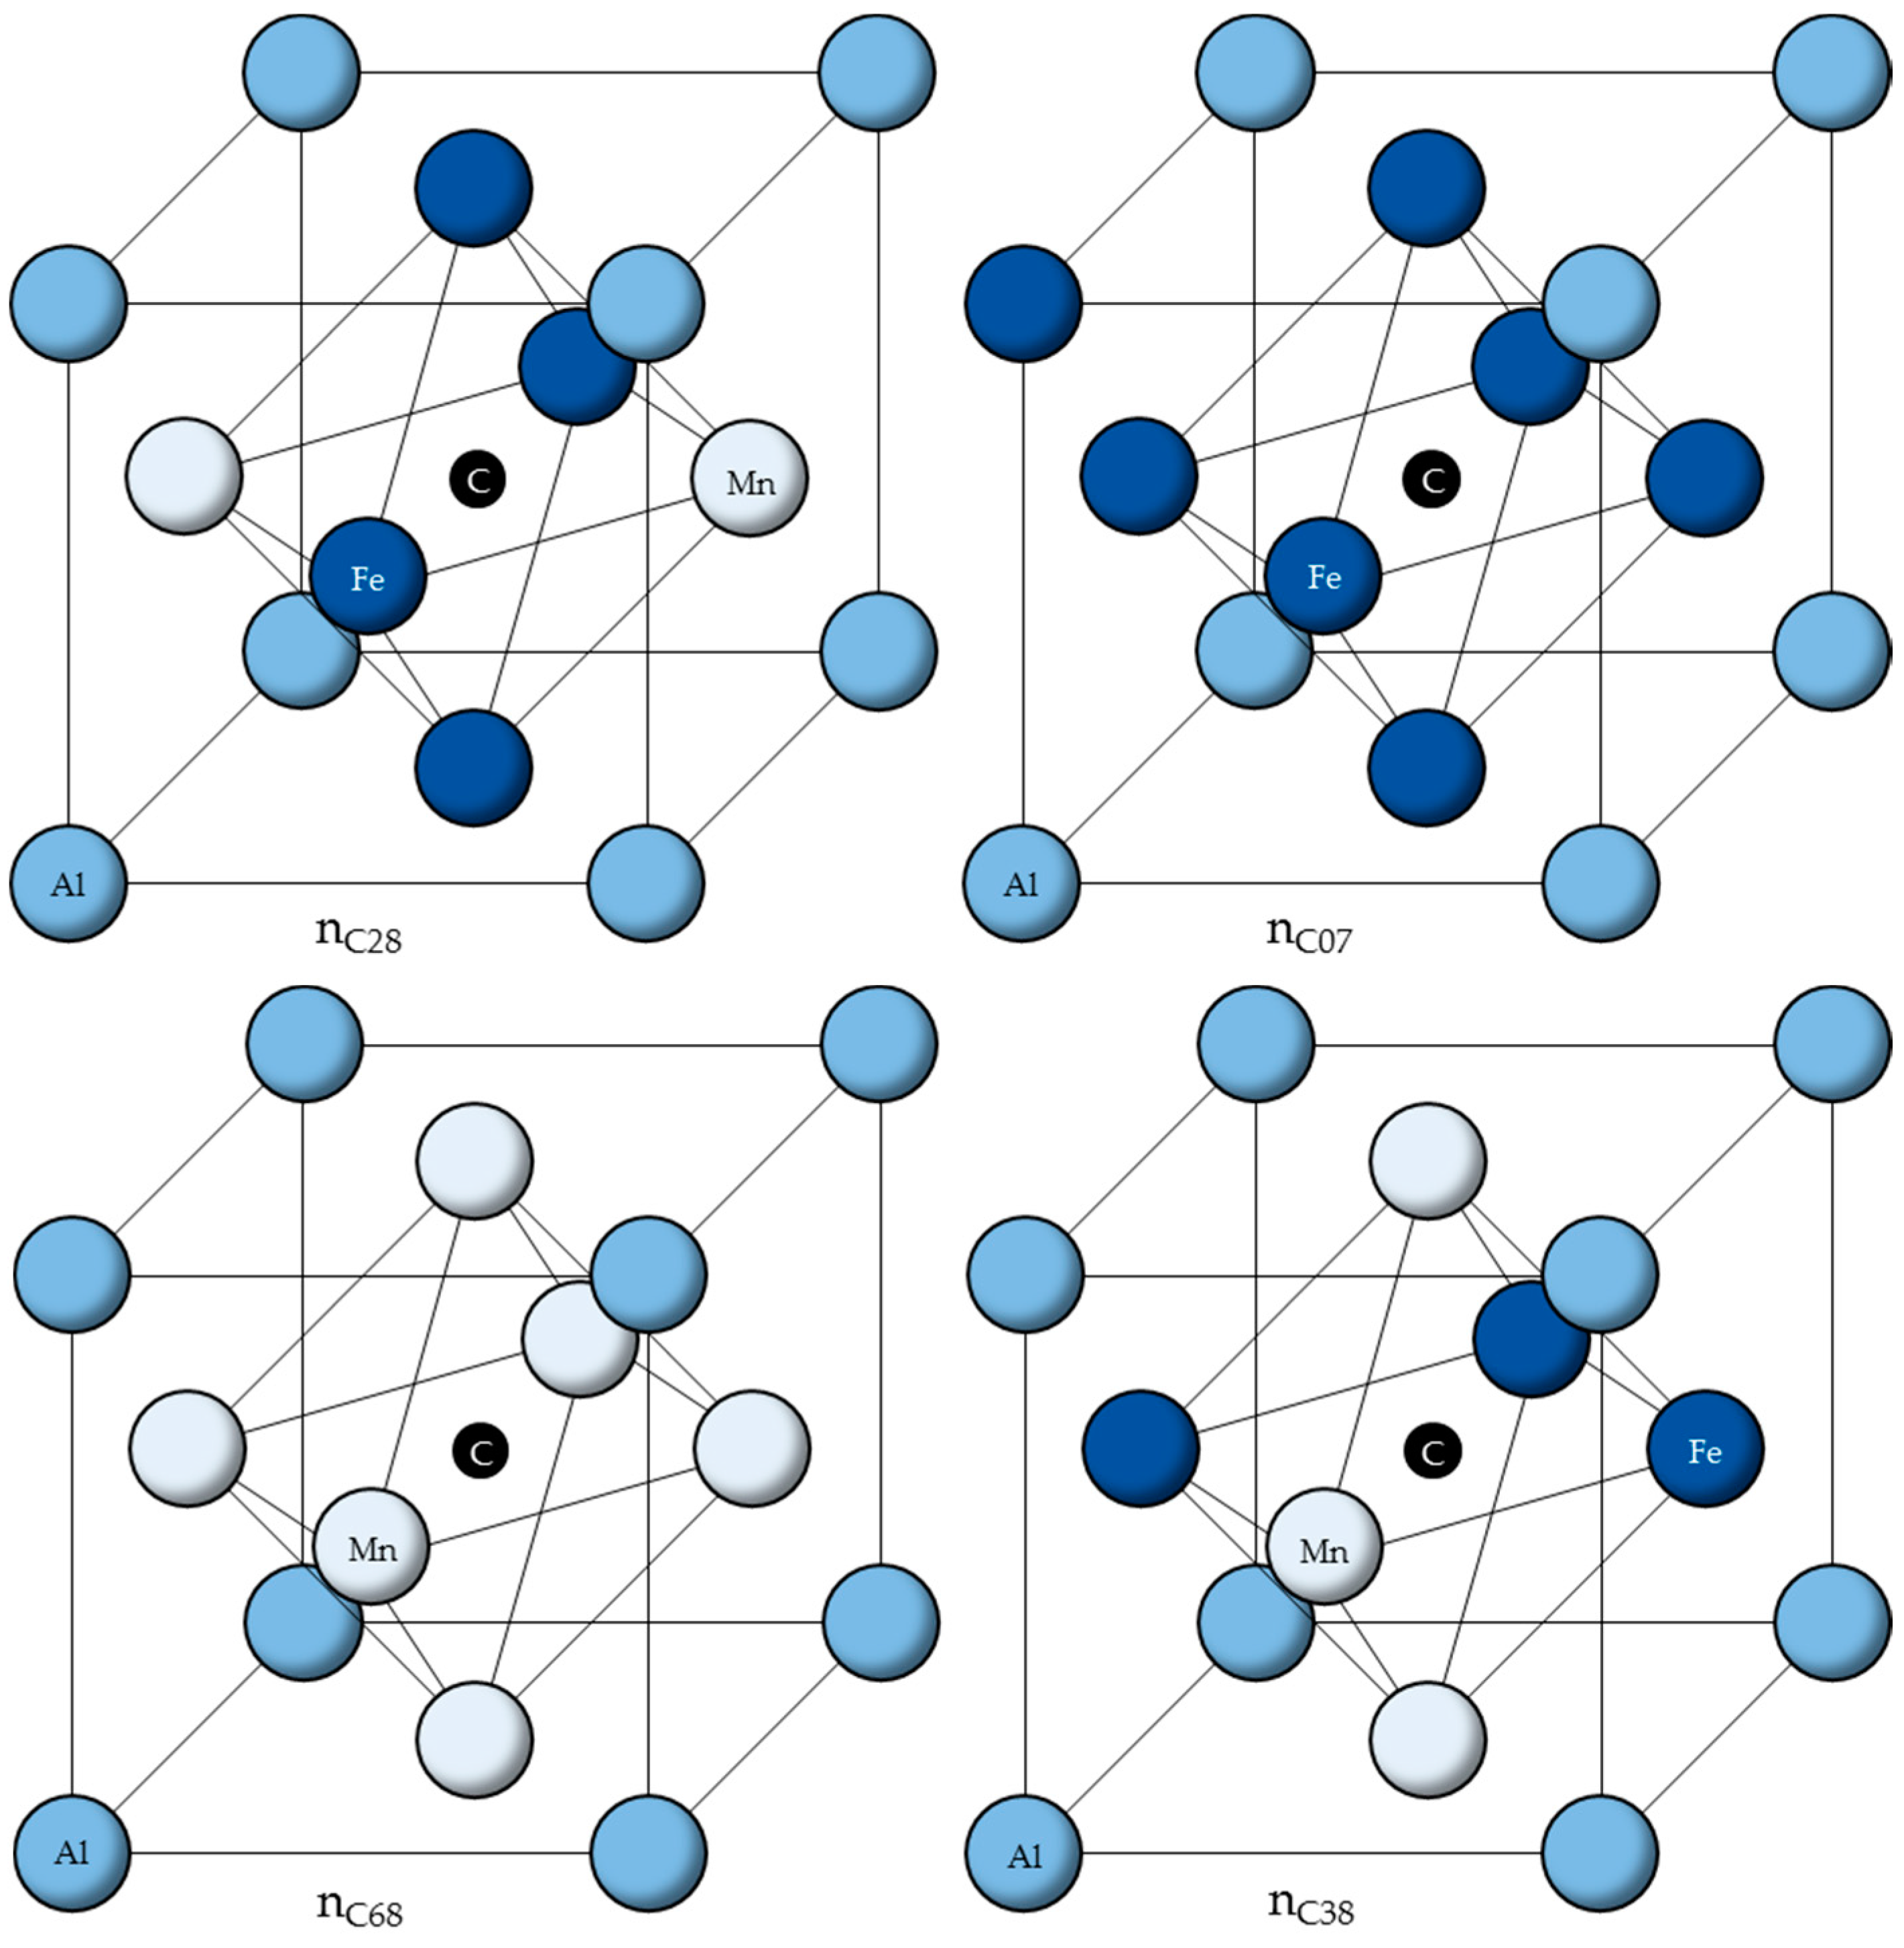
As can be seen in
Figure 1, one unit cell consists of 14 atoms situated on the lattice positions of the FCC bracket and one central octahedral interstitial site, where a single carbon atom can be situated.
First-nearest neighbors (1NN) are the six direct neighbors of the carbon atom. In
Figure 1, they are shown in green. Second-nearest neighbors (2NN) in this model are the grey atoms on the corners of the FCC lattice. Although third-nearest neighbors (3NN) can be included in first-principle calculations, a recent study has shown that neither 3NN Al atoms nor 3NN Mn atoms have a positive impact on the ordering energy [
33]. To reduce the complexity of the calculations and limit the amount of possible cell configurations, the presence of 3NN alloying atoms is not accounted for in the analysis carried out in this paper. Instead, it is assumed that the material is the sum of FCC-unit cells that do not impact each other. This is obviously not true in reality, but for the purposes of this study, which is aimed at providing a basic model to connect ab initio calculations with experimental results, it is suitable, since it leads to reduced mathematical complexities. The term “cell configuration” is used to describe the combination of alloying atoms and matrix atoms in the cell. “Coordination sphere” is used throughout this paper to refer to the position of atoms relative to the central carbon atom.
The configurations of the cells based on the alloying contents for this 14-cell model are calculated according to [
27]:
where
is the fraction of all cells that have a configuration with
k Mn atoms and
l Al atoms with
being the molar fraction of Fe, Mn, and Al, denying the existence of other substitutional alloying elements and ignoring C, since carbon is an interstitial alloying element. Since diffusion rates of substitutional atoms in austenitic steels are very low, it is assumed that the distribution of substitutional elements according to Equation (5) is fixed and that the carbon atom is distributed in accordance with a minimum ordering energy. For clusters of nitrogen and chromium, this approach has been shown to be a realistic approximation, since the presence of nitrogen does not negatively influence the homogeneous distribution of chromium [
34]. Cells of type
that contain a carbon atom are classified as
. It should be noted that the assumption that substitutional atoms are distributed according to minimum ordering energies with respect to the presence of a central carbon atom is a very strong assumption, which is unlikely to be true in reality. However, without this assumption, the calculation of ordering energies
is not possible since ab initio results are presently not available for those unfavorable configurations.
The ordering energy
of a cell with
k Mn atoms,
l Al atoms and a central carbon atom is the combination of two energy contributions in comparison to a FCC-unit cell consisting only of Fe atoms and a central interstitial carbon atom. First, the energy required to bring a carbon atom in solution
in a FCC-unit cell with respect to the presence of
k Mn atoms and
l Al atoms in the first two coordination spheres. The second factor is the change in energy level
resulting from a lattice distortion due to the presence of Mn and Al:
Ab initio calculations show that Al is preferentially situated in the second coordination sphere and Mn has a positive effect on the ordering energy level if it sits on a lattice position as a 1NN [
22,
25,
33]. According to those studies, this means that the difference in ordering energy is so profound that the likelihood of a cell configuration that contains 1NN Al atoms instead of 2NN Al atoms or 2NN Mn atoms instead of 1NN Mn atoms is very low. Accordingly, for further calculations in this work and to reduce the model’s complexity, it is assumed that for any number of Mn atoms up to six, they will always be 1NN and for any number of Al atoms up to 8, they will always be 2NN.
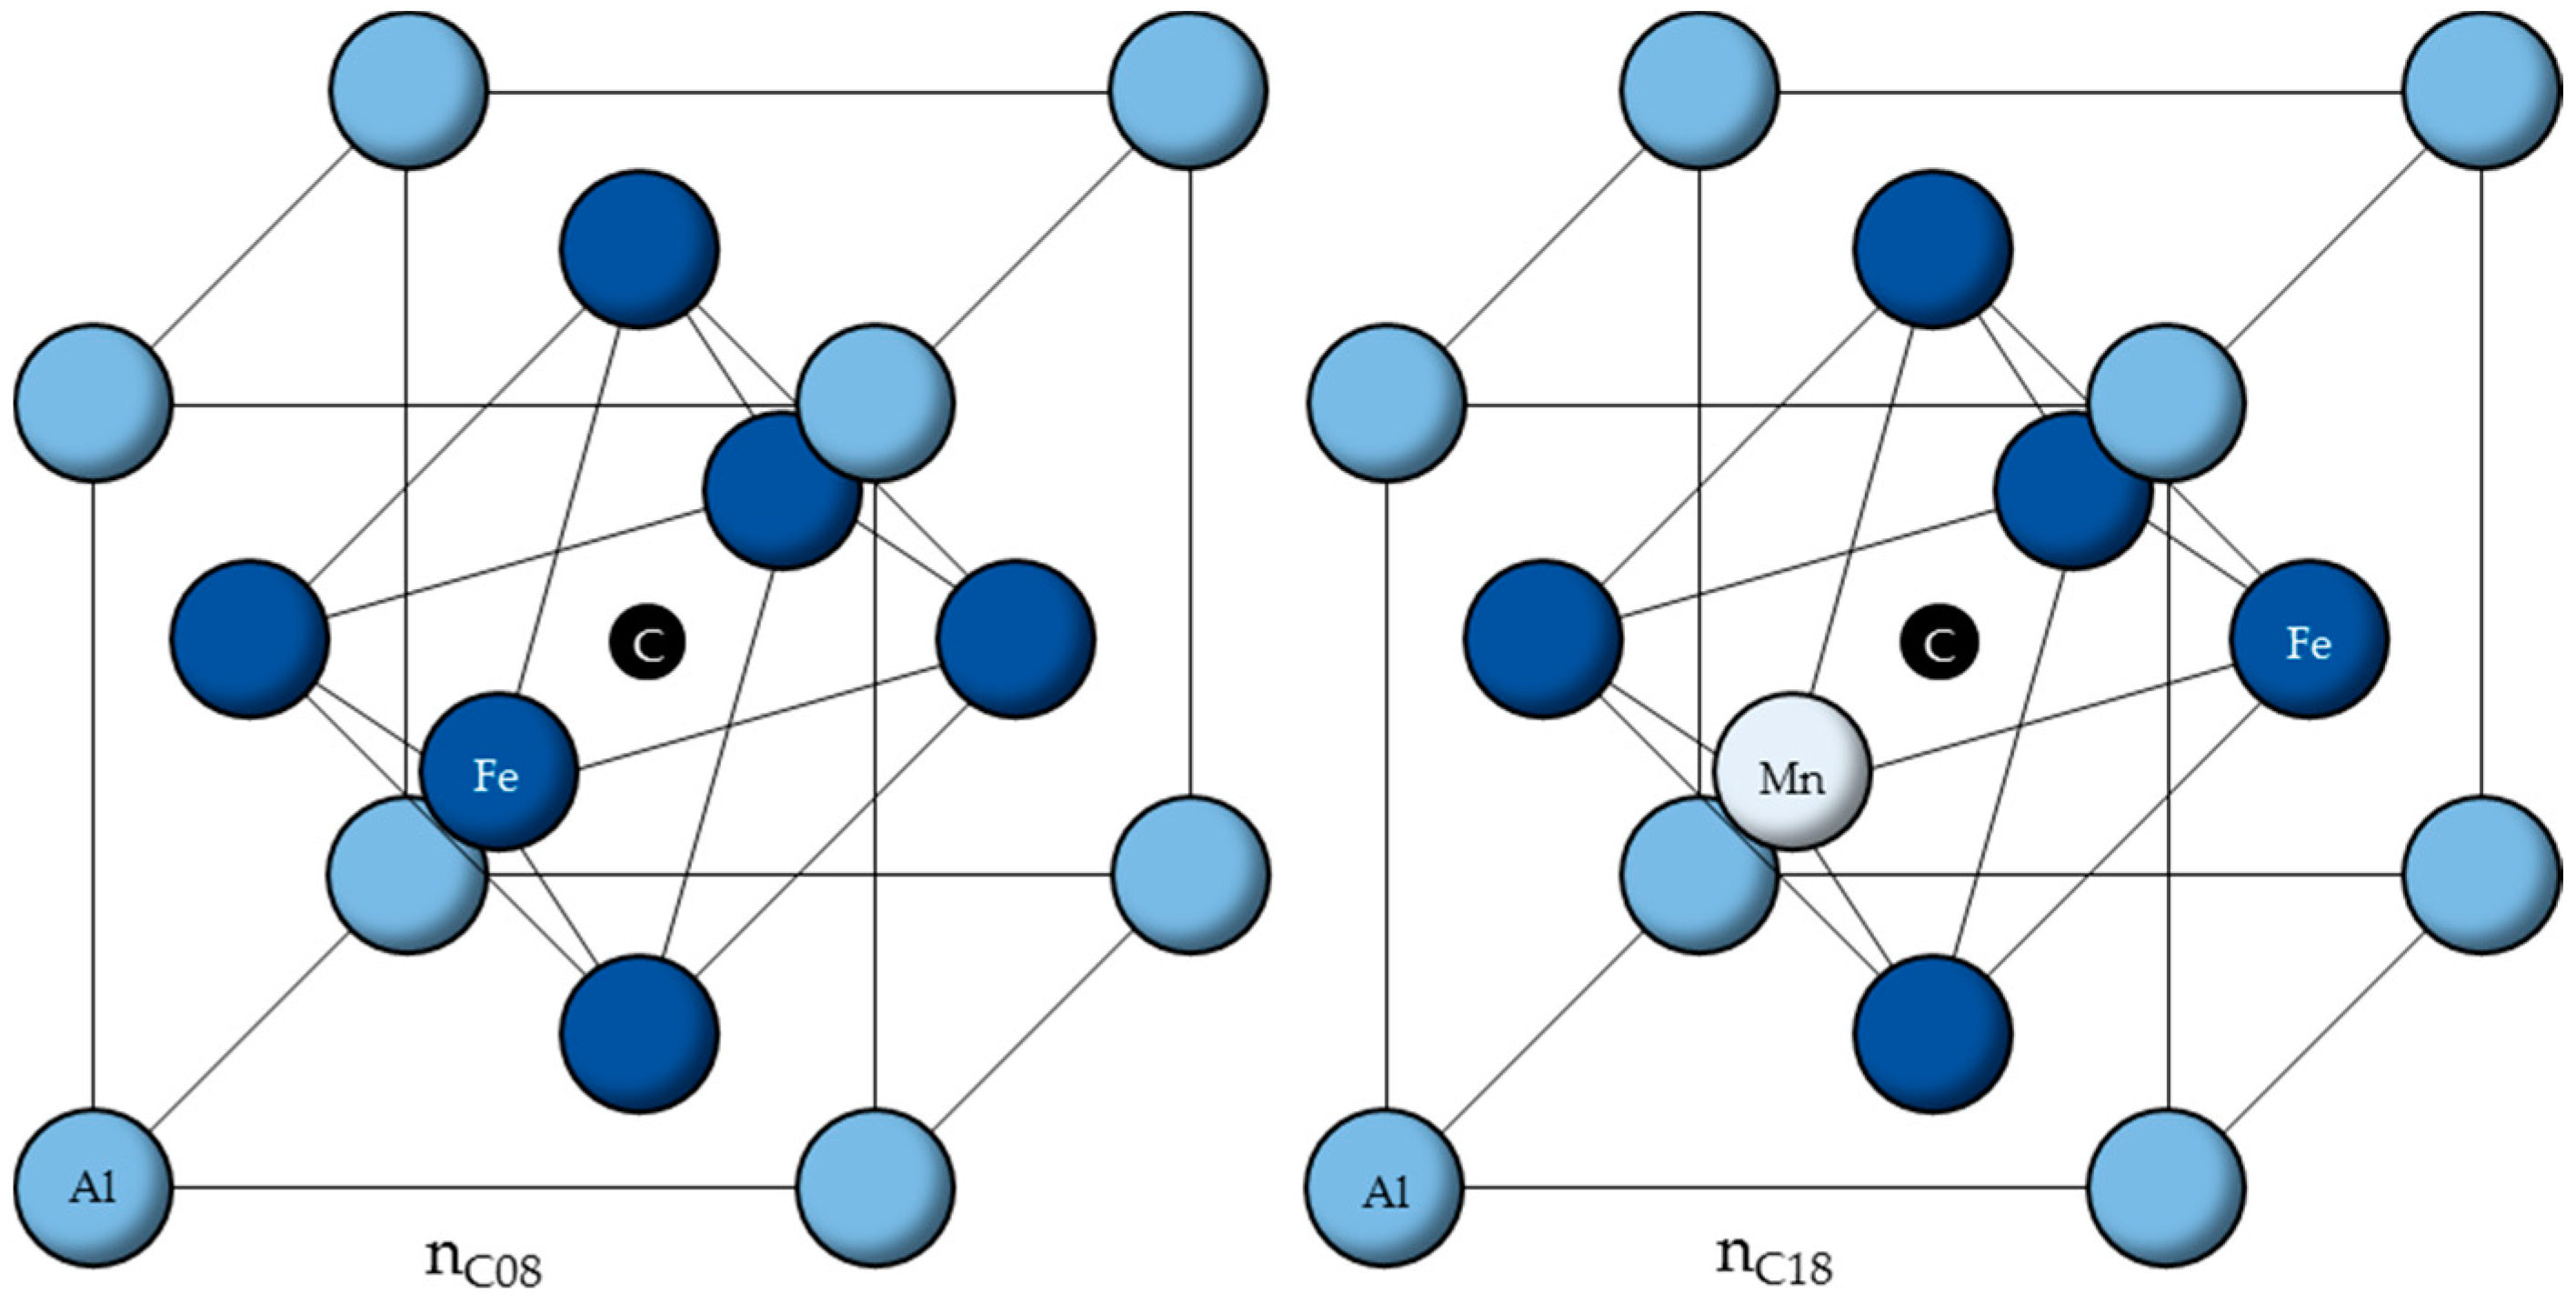
Using the calculated ordering energies
from [
33], the six cells with the lowest ordering energies are listed in
Table 1 and shown in
Figure 2.
In Equation (2), describes the energy state of an unordered alloying system. In this case, a single carbon atom is situated in the central octahedral sites of a randomly chosen FCC-unit cell. This distribution is based on the assumption that there are no preferential octahedral sites, so neither the presence of Mn nor Al influences the position of carbon atoms. Thus, it can be assumed that, for the calculation of , the likelihood of the presence of carbon is the same for each type of cell.
Using the random C distribution for
,
is calculated according to:
Since , this method of determining ensures that carbon is distributed homogeneously in the material, as well as ensuring that every available carbon atom is situated in an octahedral site of a cell.
Contrary to the homogeneous distribution of carbon for
, the distribution of C for the calculation of
is based on the calculated ordering energies [
33]. Since the differences in ordering energy between different cell configurations are significant, as is shown in
Table 1, it is assumed that carbon is always situated in the most favorable cell that has not already been assigned a carbon atom. Assuming that at higher temperatures, for example during recrystallization annealing, the diffusion of carbon as an interstitial alloying element is possible, carbon will diffuse to positions with minimal ordering energy in order to minimize the system’s Gibbs energy. This means that the cells selected for saturation with carbon are the cells with the lowest
until
.
The calculation of ordering energies in the model presented within this work was performed via ab initio simulations based on quantum-mechanical structure optimizations employing density-functional theory (DFT) within the Vienna ab initio Simulation Package (VASP) [
33]. The quantum-mechanical structure optimizations are performed based on calculations of lowest-energy states of the electron structure and thus, are conducted at 0 K. Results from ab initio approaches employing DFT have offered good results that are in line with experimental evidence. For example, Mössbauer spectroscopy [
17], atom-probe tomography (APT) [
42], in situ synchrotron X-ray diffraction measurements [
23], and correlative TEM/APT approaches [
43] have shown that results from ab initio simulations employing DFT are applicable to systems containing nano-sized κ-carbides that are usually formed during isothermal annealing at temperatures of 600 °C and above. Generally speaking, the effect of temperature changes on the lattice parameter and on intrinsic material properties that derive from electron effects like electrical conductivity is often approximated to be linear [
44]. The serrated flow curves of many high-manganese TWIP steels usually occur at temperatures of up to about 200 °C. At higher temperatures, this dynamic strain aging-like effect is either very small or is not detected at all [
2,
7].
In order to model the temperature dependence of , the ab initio results are fitted using a linear approximation of a decrease in between 0 K and 500 K. For this purpose, it is assumed that the fact that no serrated flow curve is expected at 500 K can be interpreted as a result of no significant strength increase by short-range ordered clusters.
Based on those assumptions and equations,
in MPa was calculated using Equations (2), (3), and (7) for 13 different HMnS with known average grain sizes
in μm, listed in
Table 2. The alloying contents are given in
.
Experimental yield strength data was taken from the literature [
5,
14]. Additionally, quasistatic tensile tests have been carried out using a Zwick Z250 tensile testing machine of the AllroundLine by Zwick Roell (Ulm, Germany).
has been calculated using a linear approximation to explain the differences between experimental and calculated values for the yield strength using the following equation that is a direct result of Equation (1):
This way,
was determined for all steels in
Table 2. A regression analysis was performed with respect to the alloying contents of C, Mn, and Al.
The regression analysis lead to the following equation to calculate
with respect to the alloying contents
in weight percent:
Overall, the lattice distortion effect of carbon is by far the strongest contribution to solid solution hardening. This is in accordance with calculations of the misfit of C in an octahedral site using the crystallographic correlation
. Comparing the size of the octahedral site to the size of a carbon atom shows that a carbon atom is approximately 8% bigger than the octahedral site, leading to a lattice distortion. Using the lattice parameter calculated according to Equation (3), this size difference can be calculated to approximately 0.03 nm. Comparing this value with the lattice distortion effects by Al and Mn in an austenitic steel according to [
45], which are
and
respectively, the difference in contributions between C and Mn and Al in Equation (10) appear to be reasonable.
3. Results and Discussion
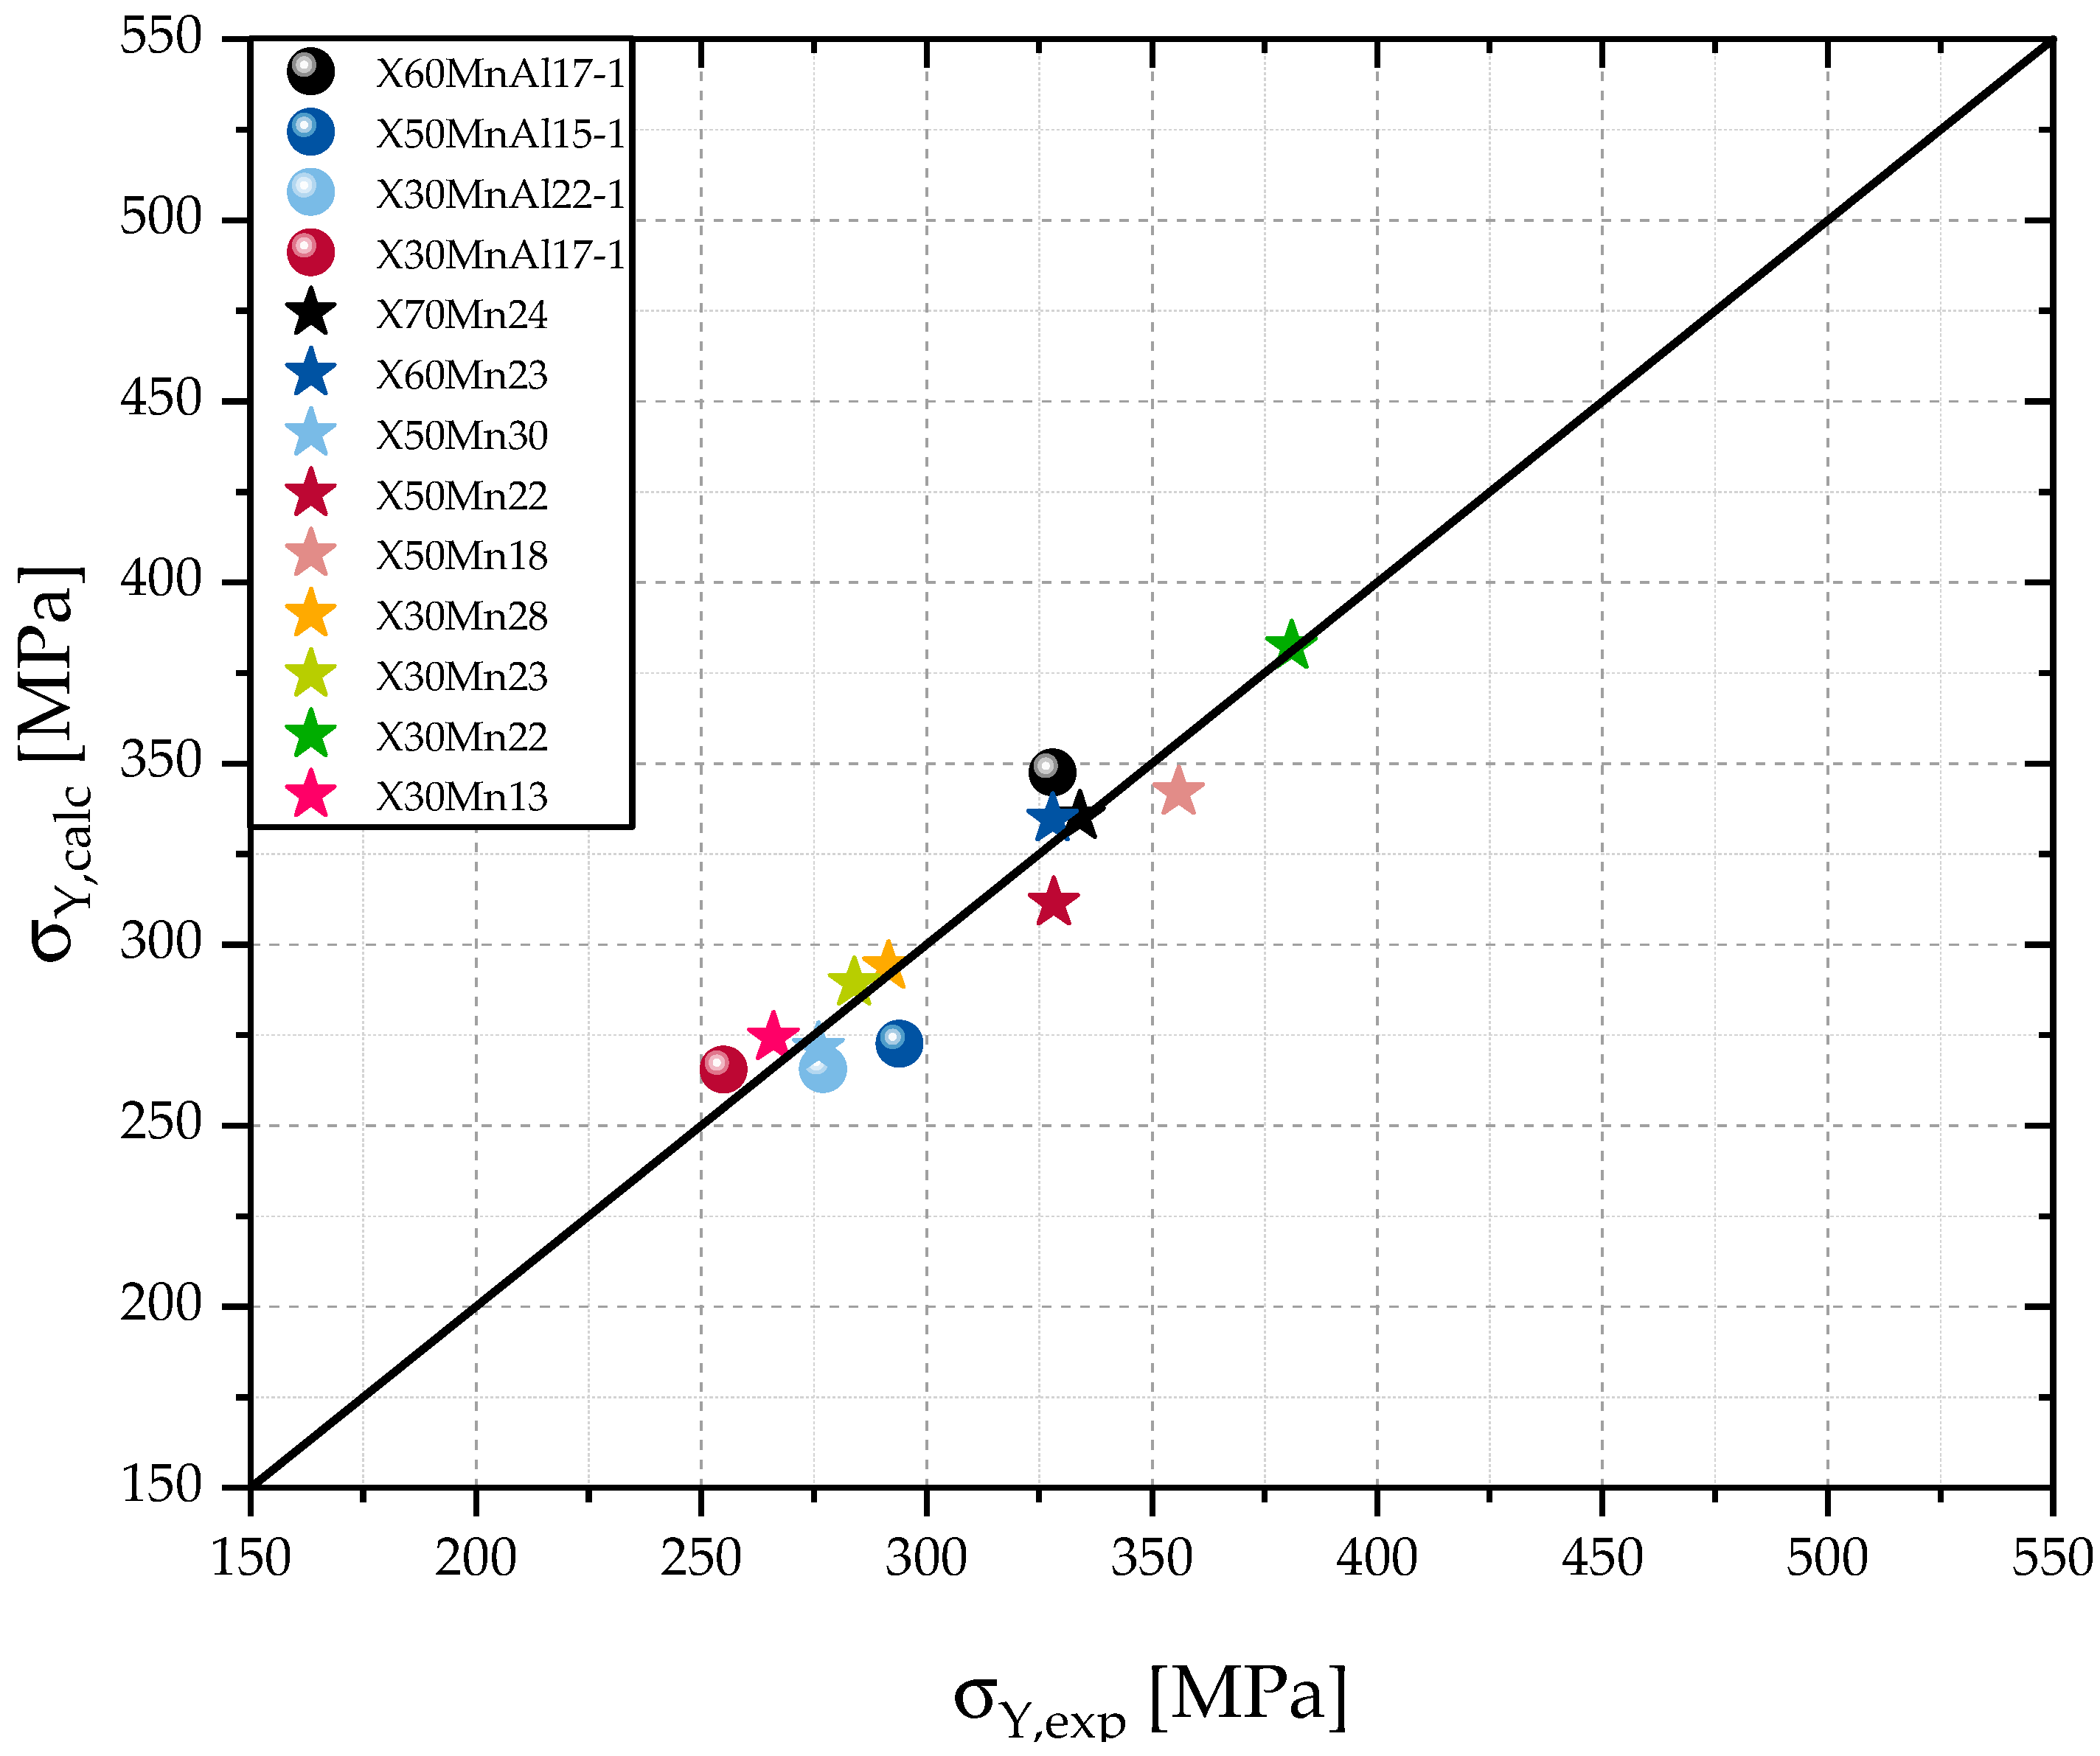
Figure 3 shows that the calculations for the yield strength
using the proposed model show good agreement with the experimental data.
The calculations used in this work lead to differences between and that are smaller than 10%. Those small differences between and might be a result of a negligence of other alloying elements that participate in solid solution hardening, minor inaccuracies of the measurement of the alloying contents, or .
Since can also be understood as a deviation from linear solid solution hardening behavior, a close relationship between and seems logical. Higher alloying contents of C, Mn, and Al lead to a higher solid solution strengthening, but also to more carbon atoms integrated in Mn-C, Al-C, and Mn-Al-C clusters, as well as a higher amount of cells with more Al atoms in the second coordination sphere or Mn atoms in the first coordination sphere according to Equation (5).
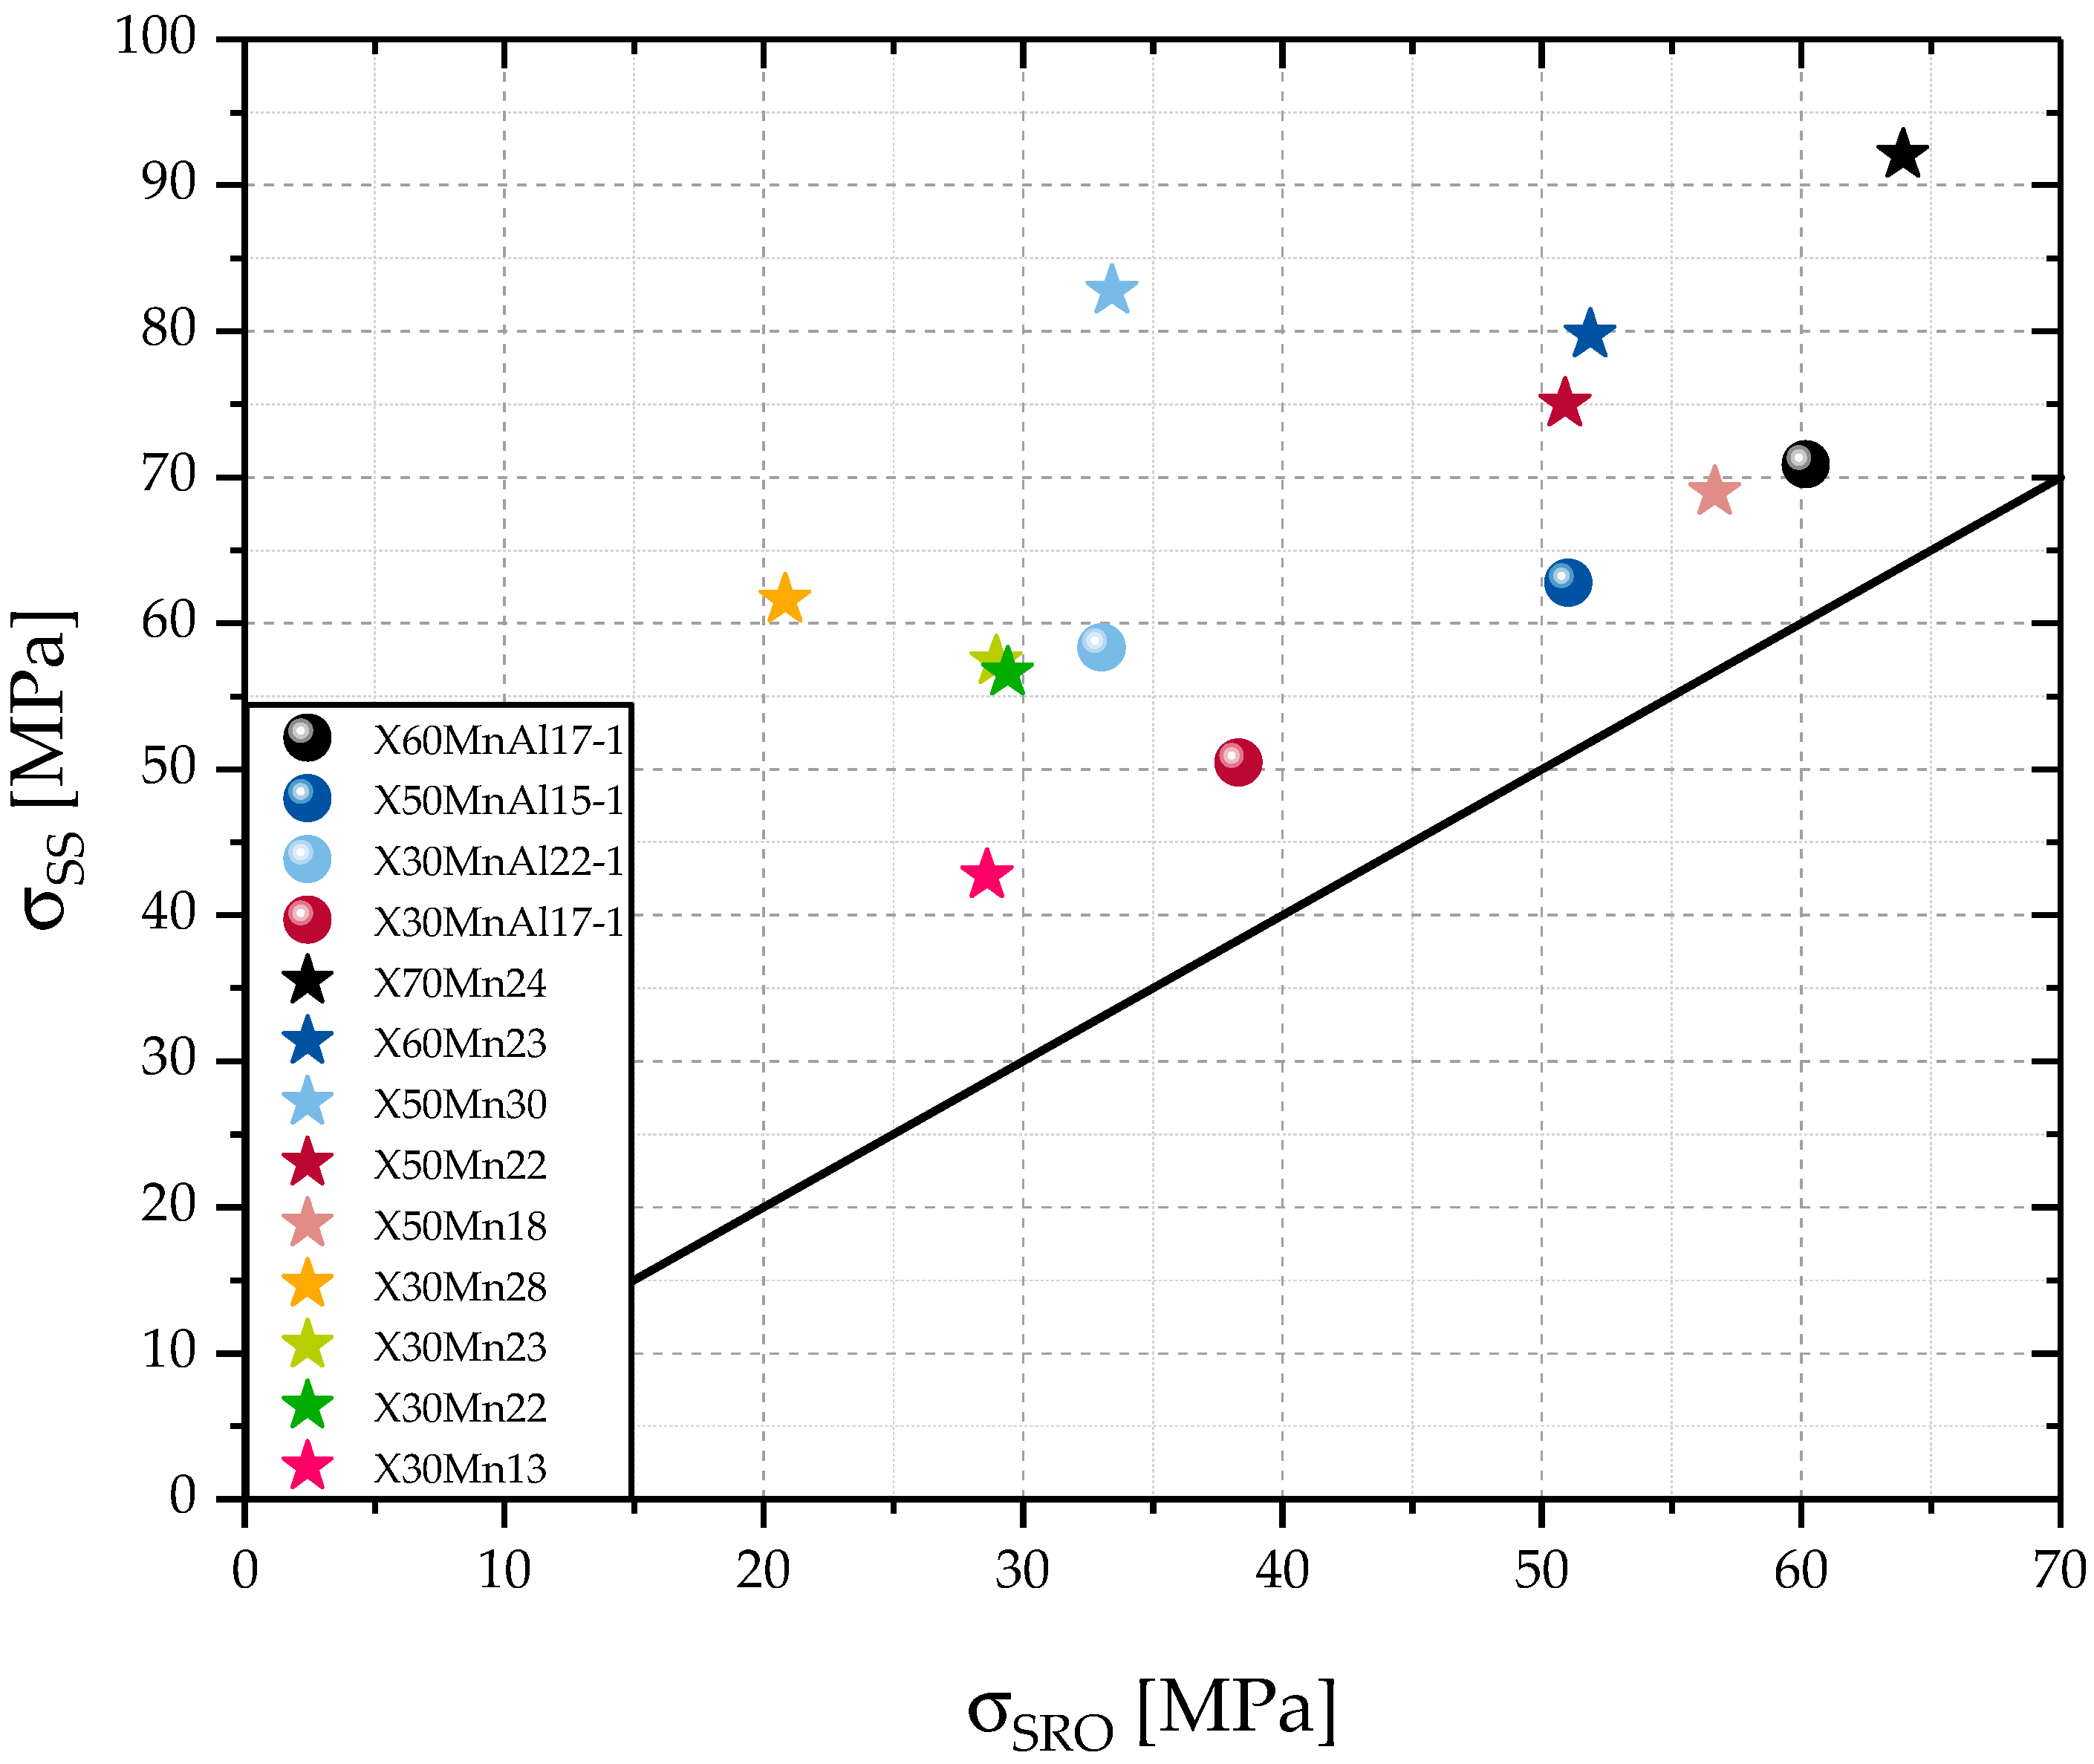
The individual contributions of solid solution hardening
and
are illustrated in
Figure 4.
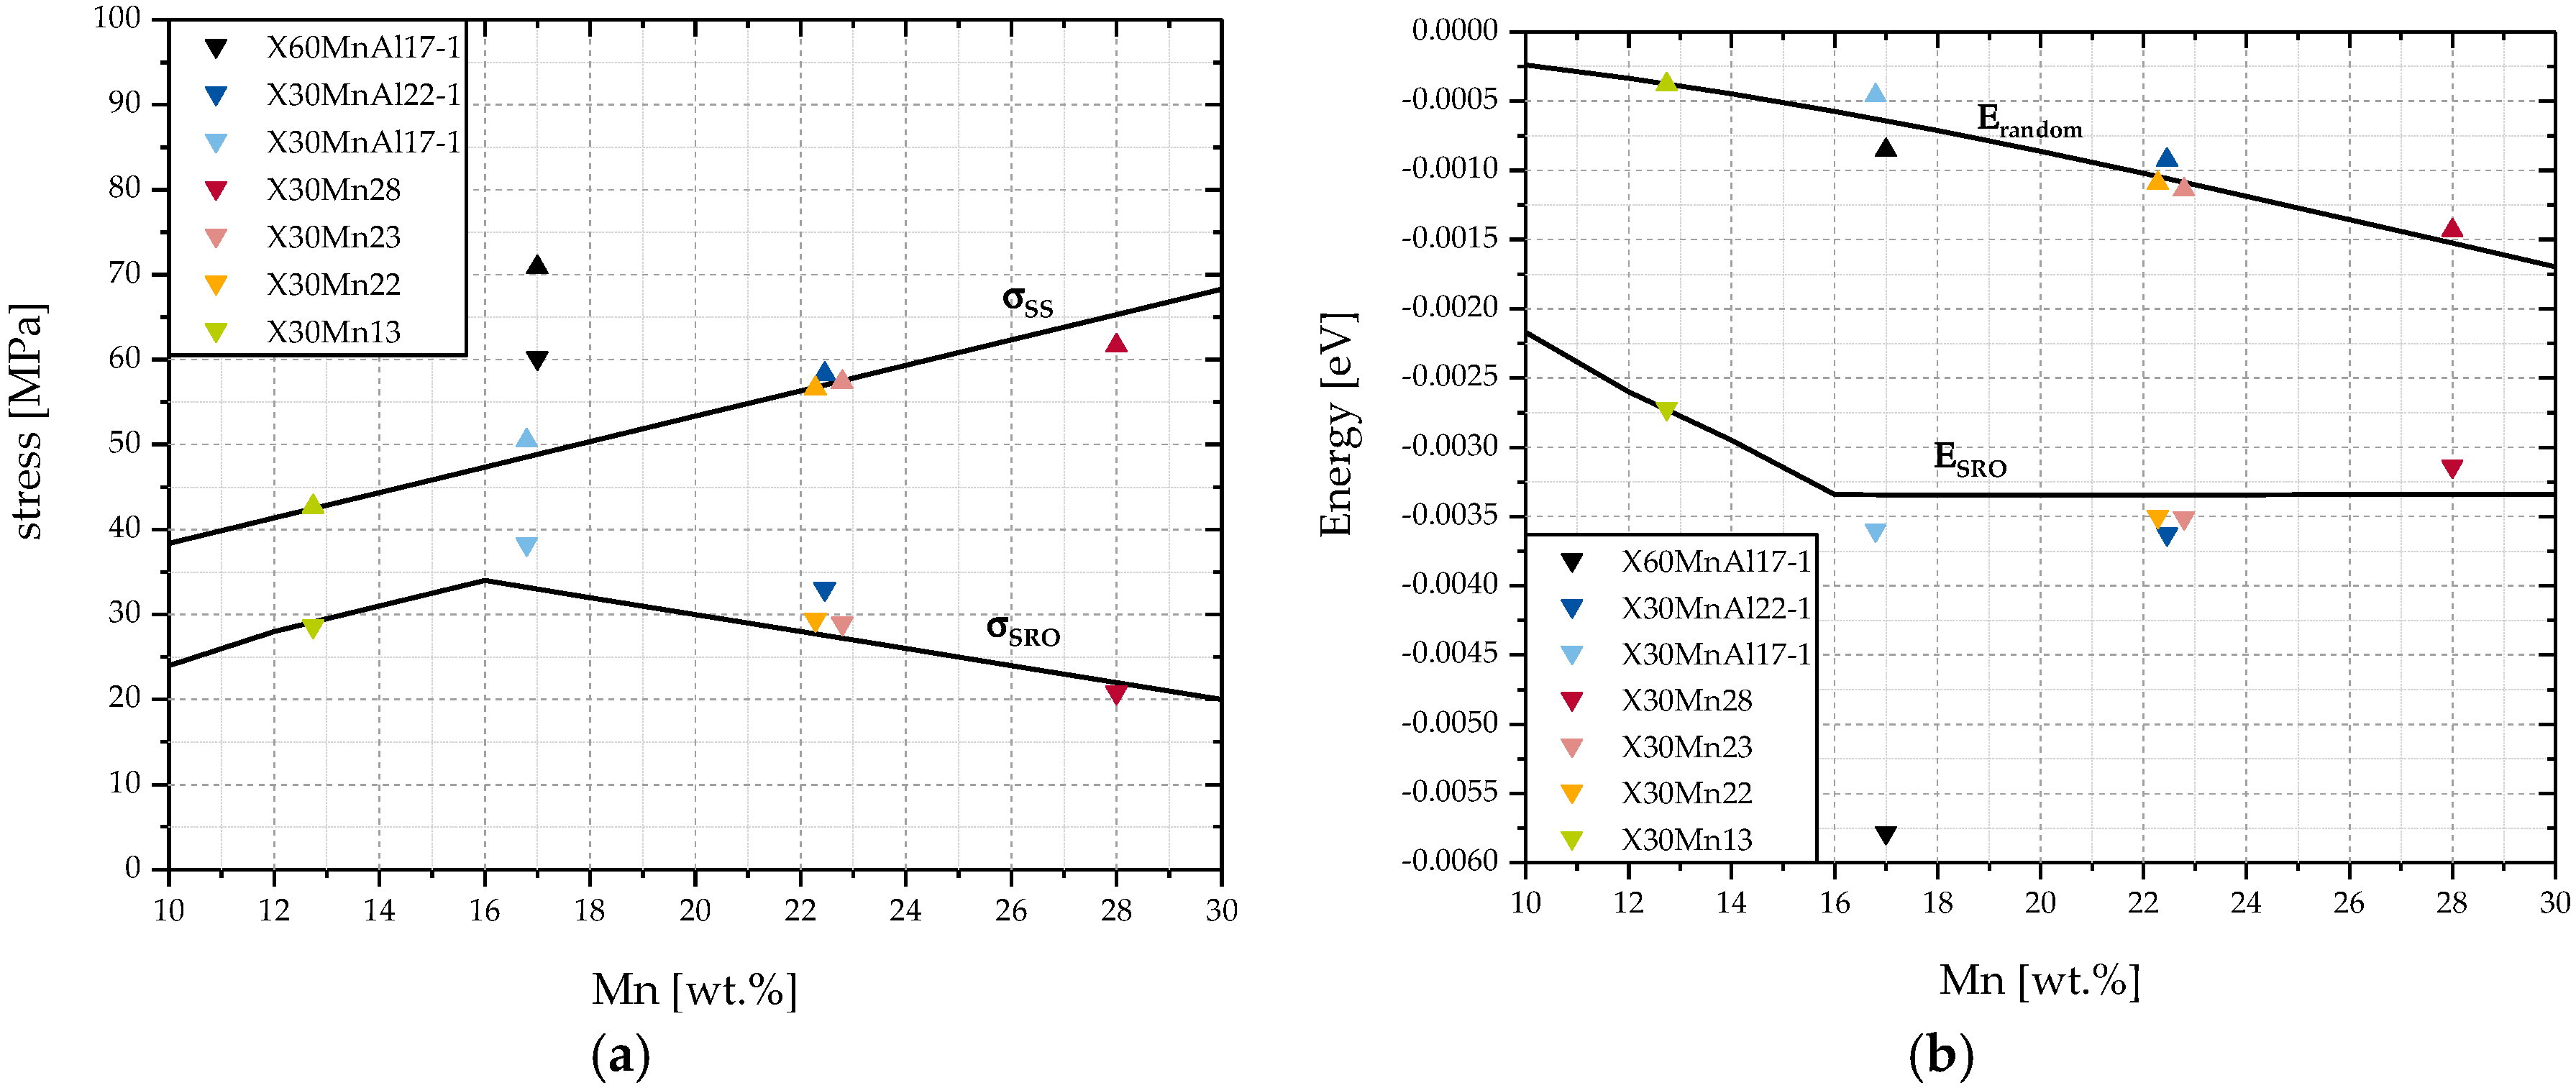
The strengthening effect of short-range ordered clusters is dependent on the chemical composition. For the steel compositions analyzed within the scope of this work, at room temperature is approximately in the range of 20 MPa for X30Mn28, containing 0.28 wt. % C and 28.00 wt. % Mn, and 65 MPa for X60MnAl17-1, containing 0.56 wt. % C, 17.00 wt. % Mn, and 1.35 wt. % Al.
Based on
Figure 4, one could think, that the connection between
and
is approximately linear. However, it needs to be kept in mind that the calculation of
is based on linear approximations as well. Additionally, it should be pointed out that although the contribution of
to
is always greater than that of
, the proportion between
and
does not seem to follow a linear trend based on chemical composition. This is illustrated by the line in
Figure 4 that represents a relation of
. To further point out the differences in the contributions to
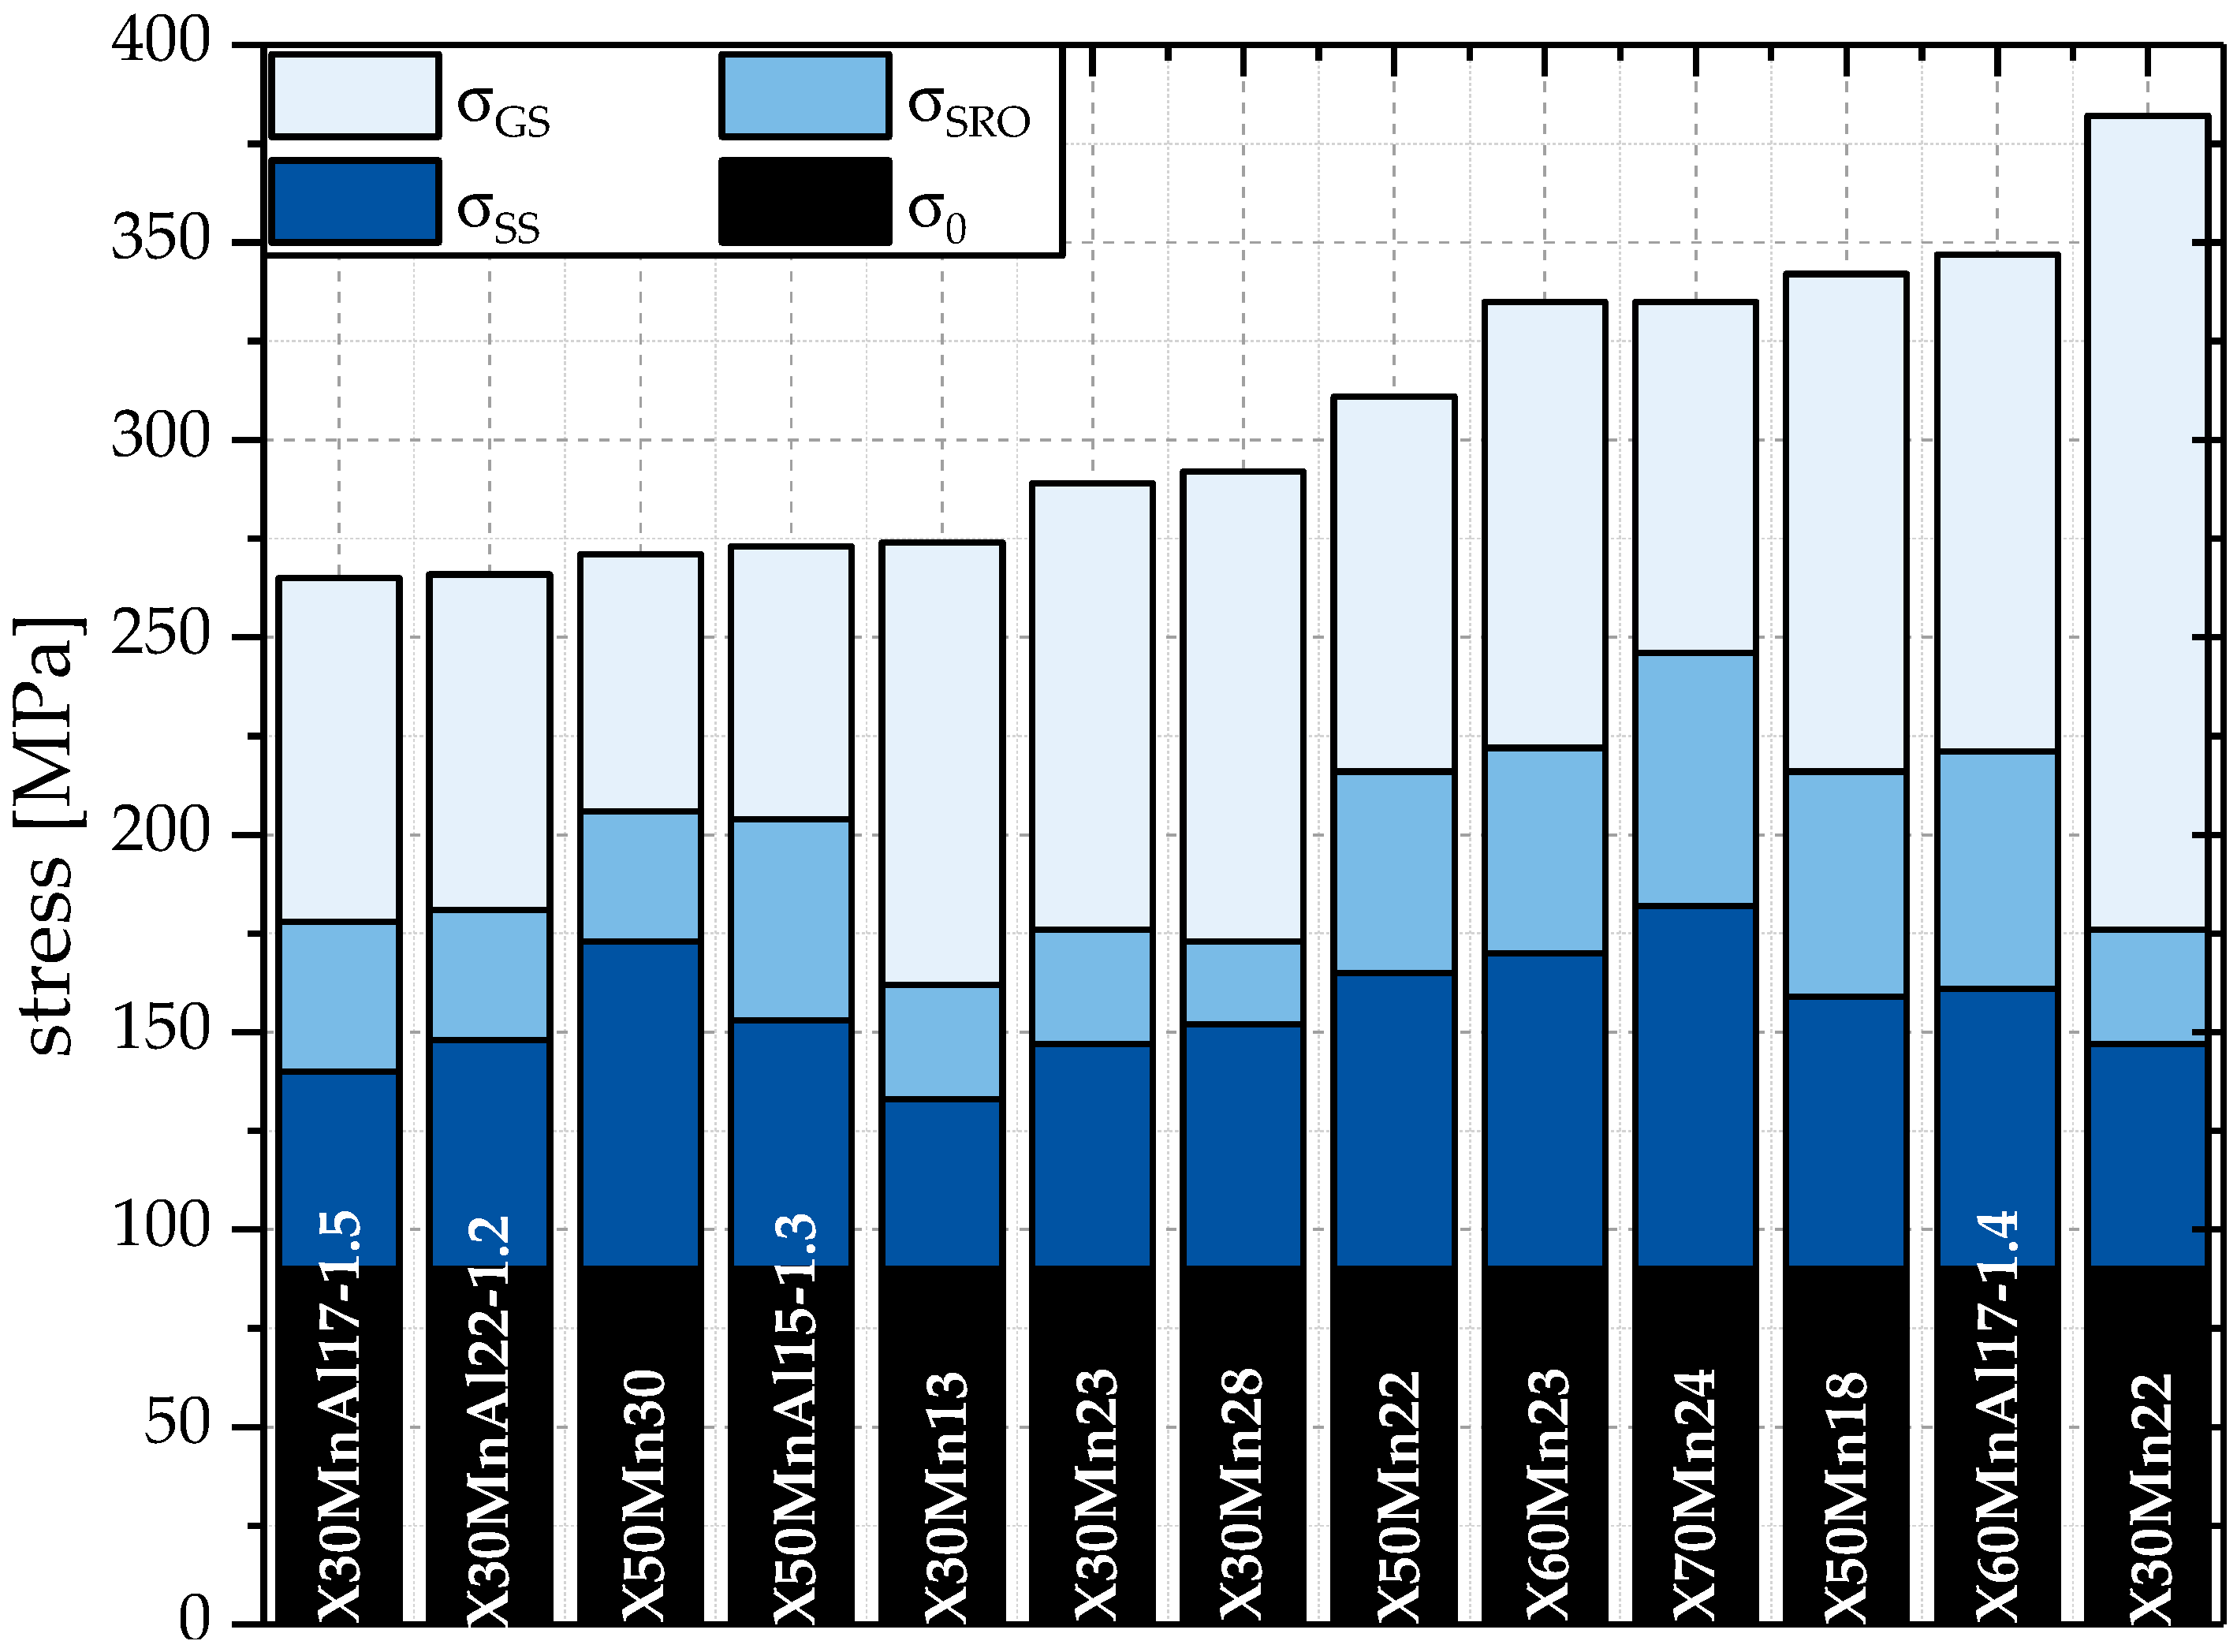
, the individual contributions of
,
, and
are portrayed in
Figure 5.
According to
Figure 5, the contribution of
to
is significant. The proportional contribution of
to
is in the range of 7.1% for X30Mn28 up to 19.1% for X70Mn24. Since a grain size effect on
is not assumed in this work, the impact of
for a given steel composition with larger grain size is higher than for the same steel composition with finer grains. Correspondingly, the proportional contribution of
that is portrayed in
Figure 5 is higher for compositions with larger grains and thus, with smaller grain size strengthening effects
.
The comparison of and for the steels X30Mn13 and X30Mn22 could lead to the conclusion that an increase in Mn content does not significantly influence . On the other hand, by comparing X30Mn22 with X30Mn28, it does appear that Mn actually reduces . Accordingly, based on these calculations, no clear tendency of the impact of a single alloying element on can be found.
For a more detailed analysis, the impact of C and Mn on
is portrayed in
Figure 6 and
Figure 7 with regards to the development of
,
,
, and
for steels with and without Al.
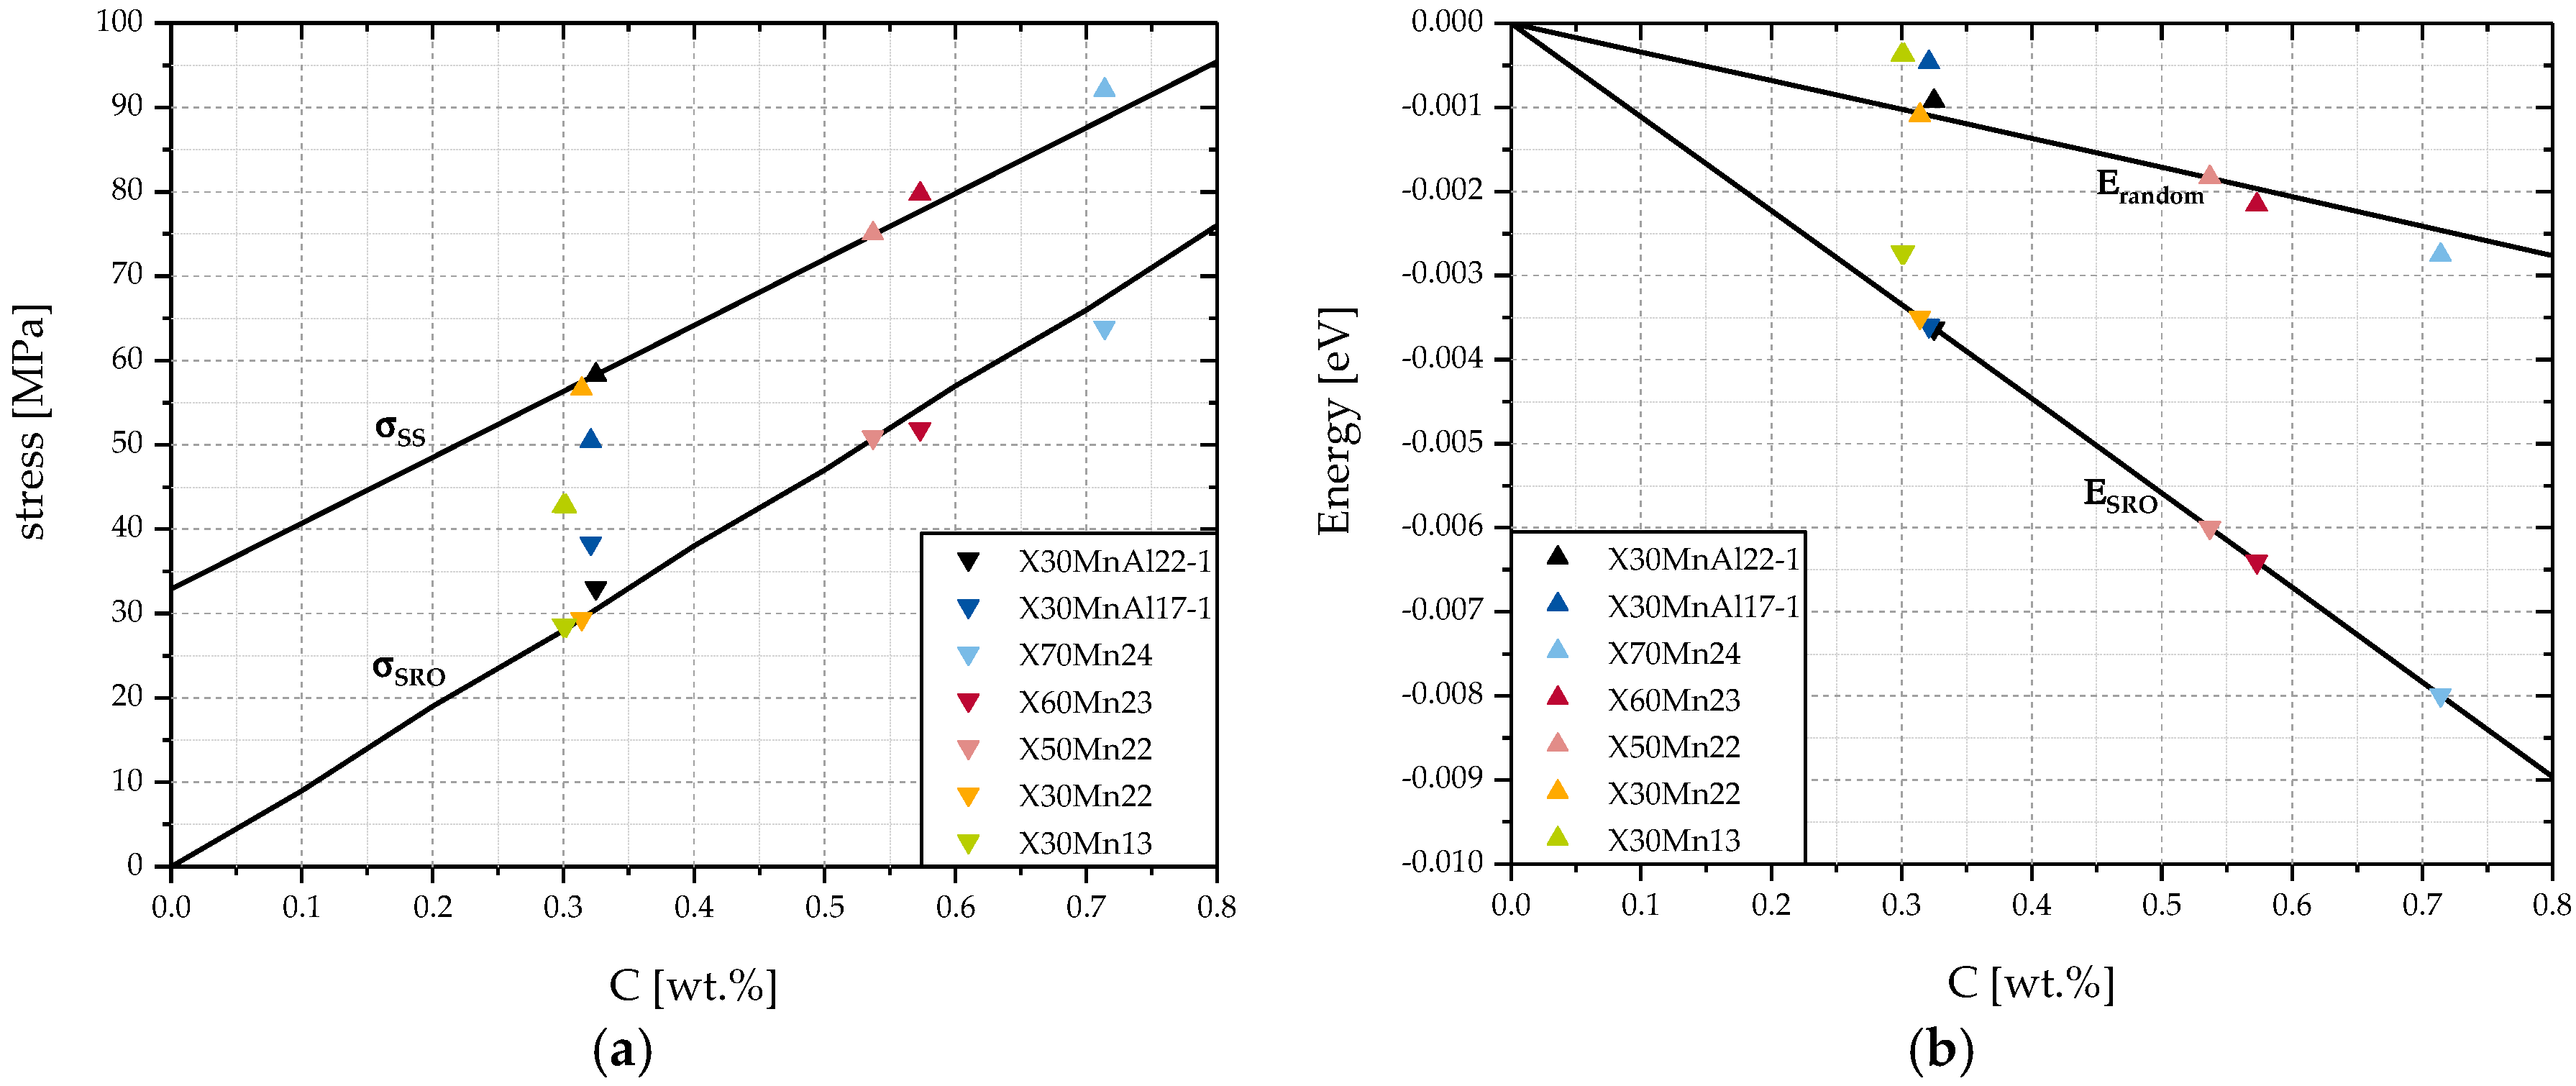
Figure 6 analyzes a steel with a constant Mn content of 22 wt. % with increasing C content from 0.0 wt. % up to 0.8 wt. %. Additionally, seven steels that were studied in this work were selected to illustrate the impact of changes in Mn content and Al content.
According to
Figure 6a,
and
increase approximately linearly with C content. This can be explained by an increasing number of cells with carbon atoms. In theory, this increase in
will only occur as long as there are cells with a preferential structure available, which leads to a decrease in ordering energy
, as can be seen in
Figure 6b. If no preferential cells were available, C atoms would have to be situated in non-preferential cells with
. To a small degree, this effect is included in the calculation of
because C is assumed to be homogeneously distributed among all cells, including those with positive and, thus, unfavorable values of
. This explains the lower rate of decrease of
in
Figure 6b compared to
. However,
will always remain positive because, according to Equation (2), as long as
is bigger than
,
will be positive. This premise is always fulfilled by using the assumption in this work, that carbon will be situated in the cells of lowest possible ordering energy first and that the distribution of alloying elements for the calculation of
and
is the same.
Looking at
Figure 6a, the steels with Al, X30MnAl22-1 and X30MnAl17-1, show positive deviations for the calculated values of
and X30MnAl17-1 shows a negative deviation for
. In the case of solid solution strengthening for X30MnAl17-1, this can be explained by the low Mn content of 16.80 wt. % compared to the 22.00 wt. % used as a basis of calculation of
in
Figure 6. Accordingly, X70Mn24 and X60Mn23 show slightly higher values for than
it would be the case for 22.00 wt. % Mn.
The increase of
can be explained by the impact of the introduction of new cell configurations containing Al atoms. According to
Table 1,
is the lowest possible energy configuration. However, since the Al content of the steels in this study is very low, only very few cells with the configuration
are available. The majority of Al atoms is in cells also containing Mn atoms. According to [
33], the introduction of Al atoms as a 2NN into cells with Mn atoms as 1NN does not necessarily lead to a lower ordering energy, but is rather dependent of the number of 1NN Mn atoms. The molar fraction of Mn in a steel containing 22 wt. % Mn obviously depends on the wt. % of the other alloying elements. For the X30MnAl22-1, the molar fraction of Mn is approximately
. According to Equation (5), the most common cell configuration is expected to be
. The ordering energy of the cell configuration
is
. This means that this cell configuration is preferential to a pure iron FCC-unit cell. Increasing the number of Al atoms in this cell configuration to 1 and 2 respectively results in
and
. Both cell configurations are not preferential with respect to
which according to previous assumptions means that the cells
and
will not contain a carbon atom as long as there are other more preferential cell configurations like
that do not already contain a carbon atom. In turn,
will not be negatively influenced by cell configurations like
and
. However,
will include the negative impact of unfavorable cell configurations which will lead to an increase of
and a total increase of
.
Overall, it can be said that the positive impact of Al on is a result of an introduction of favorable cell configurations containing Al atoms that inhibit a carbon atom and the avoidance of cell configurations of unfavorable cell configurations.
Figure 7 analyzes a steel with a constant C content of 0.3 wt. % with increasing Mn content from 10 wt. % up to 30 wt. %. Seven steels with varying Al and C content were added to the diagram.
Contrary to the impact of C that is documented in
Figure 6, a local maximum of
at approximately 16 wt. % Mn is observed. Looking at
Figure 7b, this can be explained by the stagnation of
for Mn contents of 16 wt. % and higher. At the same time,
is decreasing, leading to a smaller difference between
and
and accordingly to a lower
.
The stagnation of can be explained by considering the method of calculation for . For Al-free steels, the energetically optimal cell is . As long as , an increase in the amount of C atoms will decrease . This is due to the underlying assumption that C atoms will be situated in preferential cells of lowest possible ordering energy. At , all C atoms are situated in cells of optimal configuration and thus, is minimized. Due to the way is calculated in Equation (7), continues to decrease at . As a result, decreases.
In accordance with
Figure 6a,
Figure 7a shows that additions of Al and C increase
significantly.
The contribution of solid solution hardening increases linearly with the Mn and C content, as it is to be expected considering Equation (10).
To conclude, unlike for the addition of C, Mn additions do not always increase . This is a result of a stagnation of because of a saturation of preferential cells with carbon. In theory, the same effect should be noticeable for C and Al, as well. However, because of the comparably low alloying contents of those elements, it is very unlikely that a point of saturation will be reached in common alloys.
This decrease in can be understood as the impact of the deviation from linear solid solution hardening. If the ratio of Mn atoms to Fe atoms becomes increasingly larger and the amount of cells with randomly-distributed Mn increases, the impact of an actual ordering of Mn decreases since fewer cells are brought into short-range ordering to minimize the ordering energy.
Overall, the change of
with varying contents of alloying elements can be understood as the effectiveness of an alloy addition of those elements with respect to the increase in strength by short-range ordering. Since it is assumed that
follows a linear trend and
is fixed,
is an indicator for the effectiveness of an addition of an alloying element. A higher
means a greater efficiency in employing an addition of the alloying element
i. Looking at
Figure 6 and
Figure 7, C and Al both appear to be more efficient than Mn in increasing the yield strength by short-range ordering.
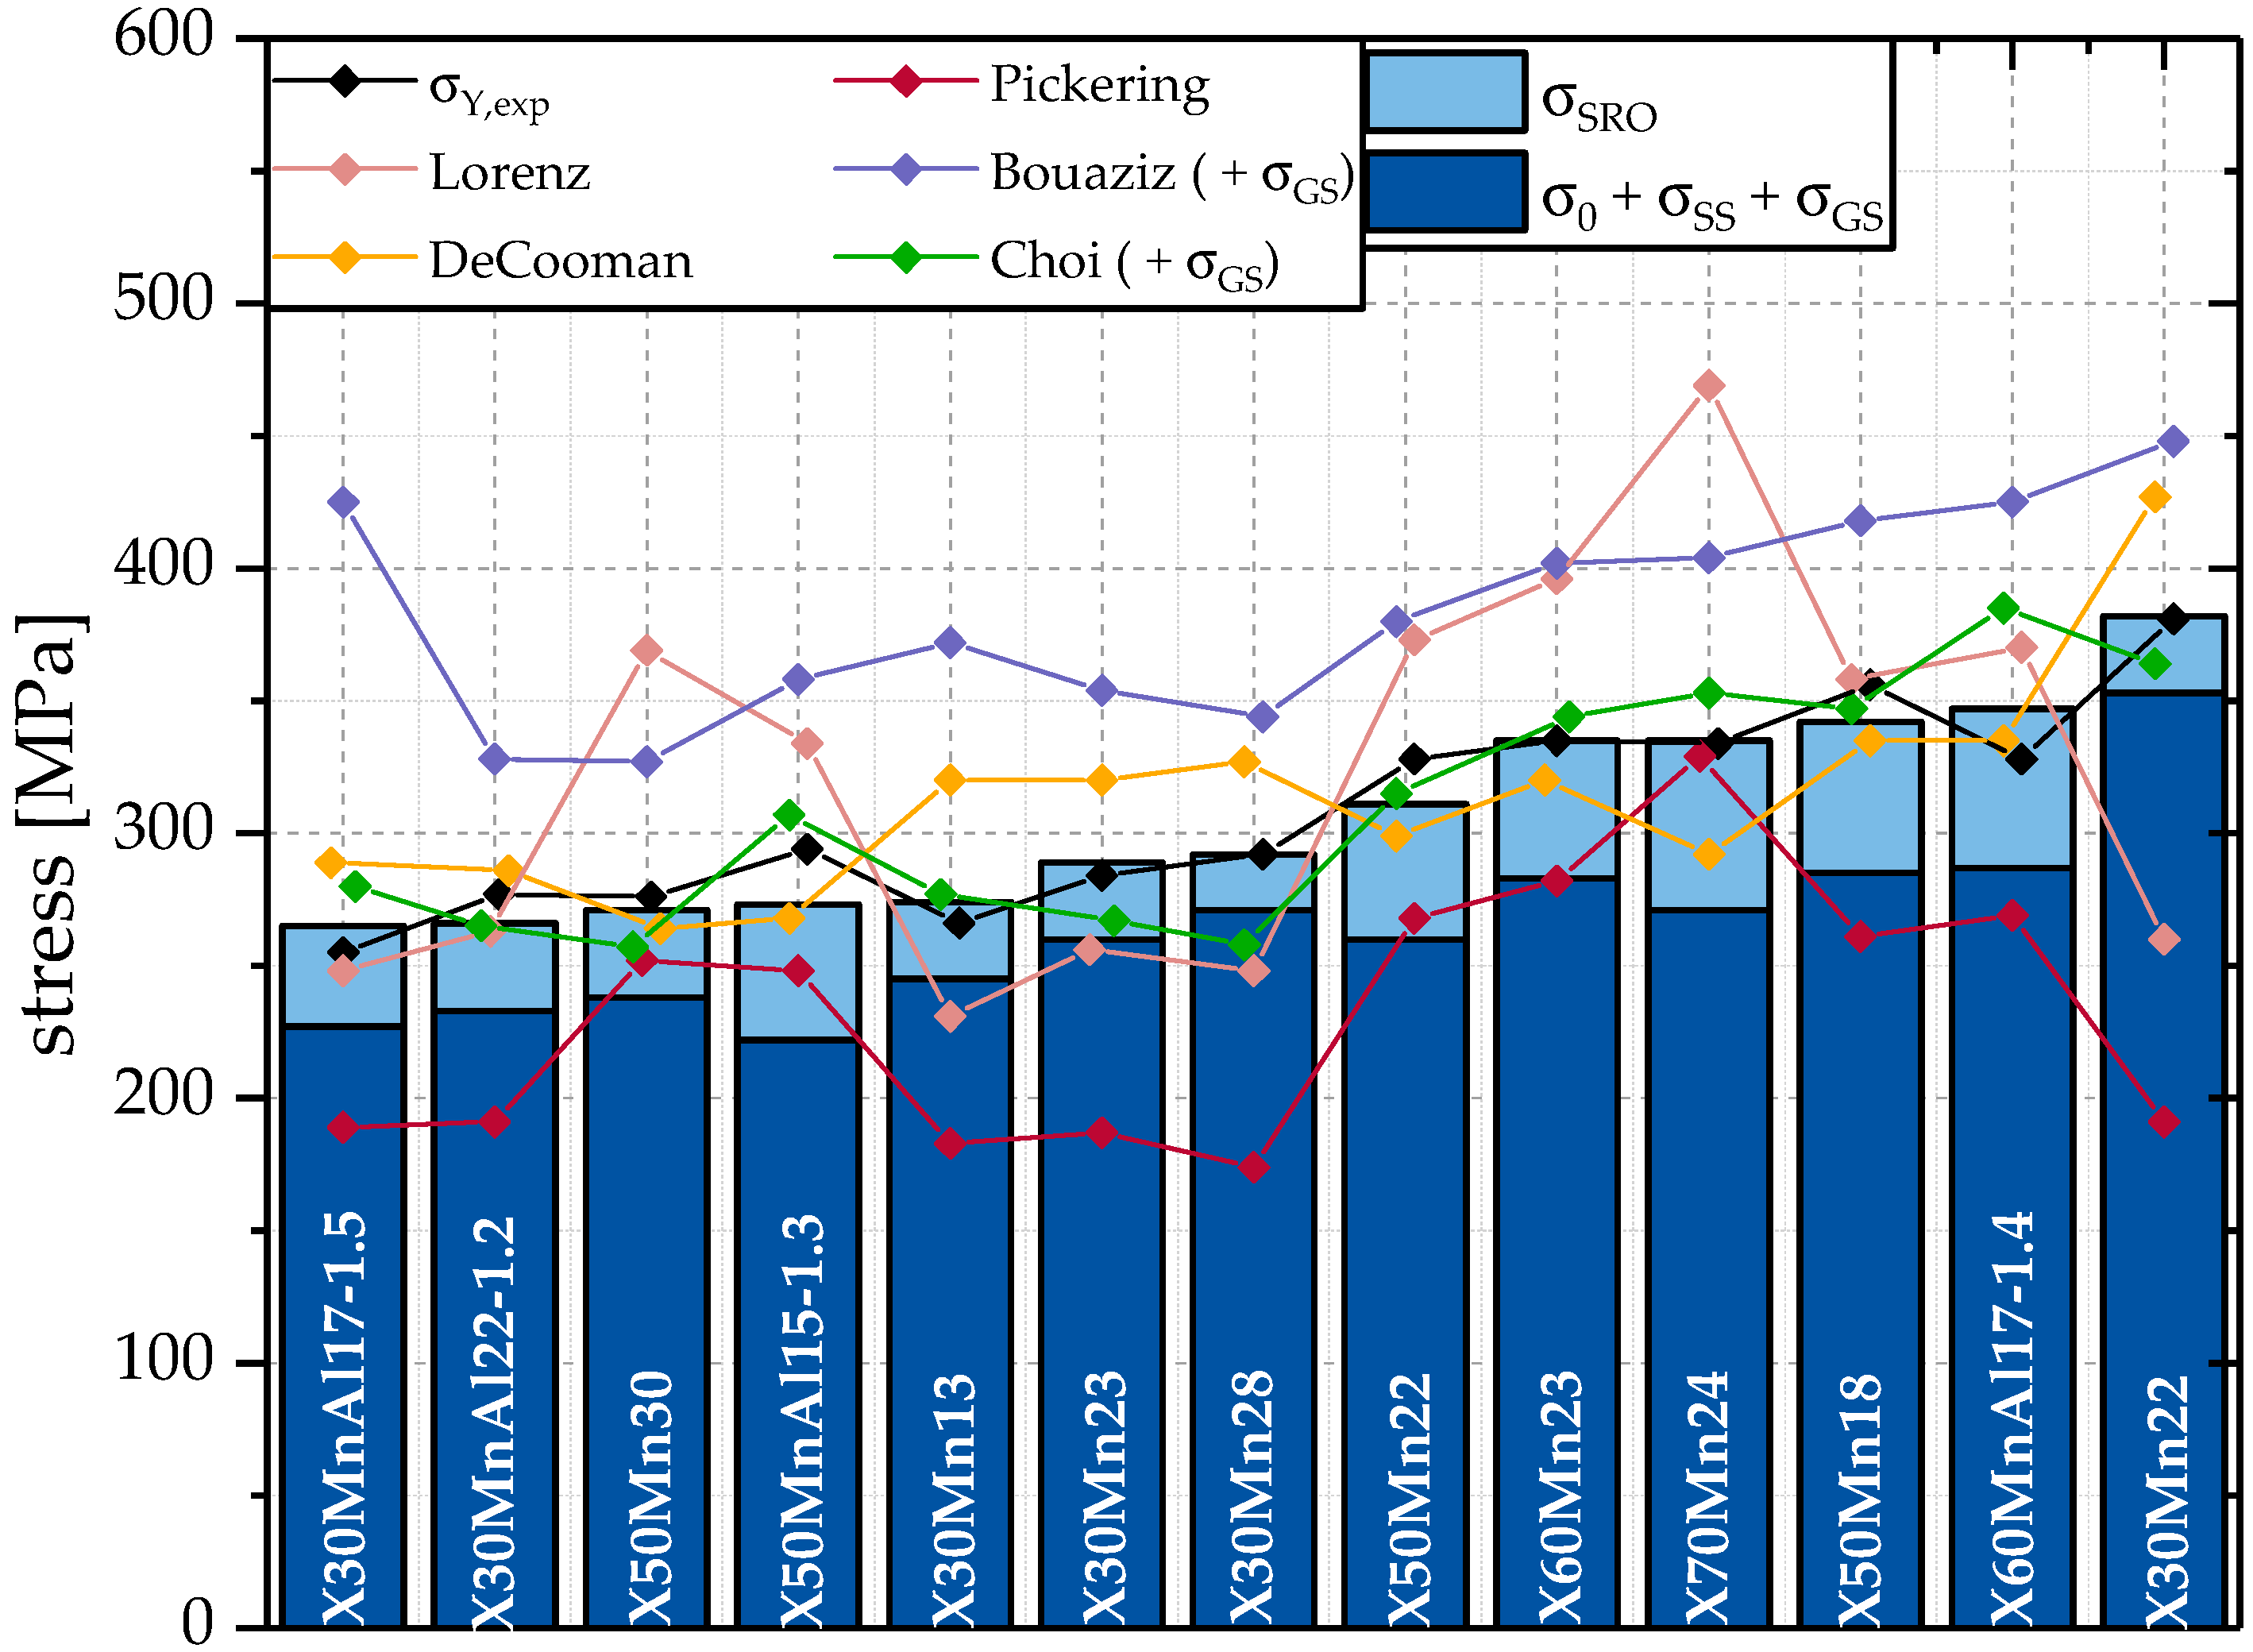
In order to compare the accuracy of the model used in this work to calculate
with other descriptive models,
according to models by Pickering [
15], Lorenz [
15], Bouaziz [
11], De Cooman [
2], and Choi [
46] has been calculated. The equations used for
are listed in
Table 3. The coefficients used for the alloying contents are in
, coefficients for grain size influence are in MPam
0.5 unless stated otherwise. It needs to be pointed out that although all of the models are for austenitic steels, only the models of Bouaziz, De Cooman, and Choi are specifically for HMnS. Additionally, some of the models include coefficients for the Hall-Petch effect while others neglect them. In order to be able to compare the models, the grain size effect has been calculated according to Equation (4) and added to the model calculations of Choi and Bouaziz.
Figure 8 compares
with
and
.
Due to the difference in the steel concepts those models were developed for, significant deviations from
can be seen. Those deviations are a result of a focus on other alloying elements. For example, Pickering does not consider the impact of Mn on yield strength. Nevertheless, the models of Choi [
46] and De Cooman [
2] offer reasonable results, but are not as close to the experimental data as the model developed in this work. Additionally, the model by De Cooman does not take compositional variances into account, while the model of Choi considers the impact of Mn on yield strength to be negative.
The models of Pickering and Lorenz are not applicable to HMnS based on the results of the calculations. The model by Bouaziz tends to overestimate the yield strength.


