Article

Study of the Influence of Intermix Conditions on Steel Cleanliness

1
Faculty of Metallurgy, Technical University of Košice, Institute of Metallurgy, Department of Metallurgy and Foundry, 042 00 Košice, Slovakia
2
U. S. Steel Košice, s.r.o., Vstupný areál U. S. Steel, 044 54 Košice, Slovakia
*
Author to whom correspondence should be addressed.
Metals 2018, 8(10), 852; https://doi.org/10.3390/met8100852
Submission received: 28 September 2018 / Revised: 16 October 2018 / Accepted: 17 October 2018 / Published: 19 October 2018
(This article belongs to the Special Issue Refining and Casting of Steel)

Abstract

:
Modern steel plants produce today a large portfolio of various steel grades, many for end-uses demanding high quality. In order to utilize the maximum productivity of the continuous-casting machine, it is sometimes necessary to cast steel grades with different chemical compositions in one sequence. It is important, therefore, to know the possibilities of a specific continuous-casting machine to make the Intermix connections as short as possible. Any interference with established procedures may, however, have a negative impact on the cleanliness of the cast steel. Using physical and numerical simulation tools, it was found that reducing the steel level in the tundish during the exchange of ladles makes it possible to shorten the transition zone. However, when the steel level is reduced, the flow of steel is impaired, which can have a negative effect on the cleanliness of the cast steel and, in extreme cases, may even lead to entrapment of slag in the mold. The cleanliness of cast steel was evaluated using one of the most advanced tools for automatic steel cleanliness evaluation, AZtecFeature (Oxford Instruments, Abingdon, UK), which enables determination of the type, size, distribution, and shape, as well as the chemical composition, of individual types of non-metal inclusions.

1. Introduction

Resolution of the Intermix problem, shortening the chemical composition transition zone in cast slabs when various steel grades are cast in succession, generally includes several options and operating parameters, which more or less affect its overall range. Apart from the chemical concept itself and the real possibilities of logistical planning of specific ways of joining different steel grades, the overall range of the Intermix is influenced mainly by the flow and mixing conditions of the liquid steel in the tundish during the casting process. For a more detailed study and definition of the Intermix range, a number of methods and procedures were published regarding the flow conditions of the steel in the tundish [1,2,3,4,5,6], as well as, to a certain extent, in the mold and the casting stream [7].
The most commonly reported operating criteria and parameters directly related to the Intermix are the chemical composition of the steel, the geometry and specific configuration of the given tundish, the volume (or operating level) of the steel, and the mass flow rate of the steel, limited by the combination of the given casting speed and the dimensions of the cast slab.
In order to verify certain operations intended to optimize the Intermix range during hard transitions in which the steel level in the tundish [8,9] is deliberately reduced, operational testing of a joining process for alternate batches was performed, in which not only the effect on the total length of the chemical composition transition zone was analyzed, but also the impact of specific casting conditions on the final cleanliness of the cast steel.

2. Materials and Methods

The main focus of this research was to verify the impact of the ultra-low tundish practice (ULT), whereby the steel level in the tundish is lowered to 15 tons during the initiation of the operating tests. Due to the specific operating conditions of the continuous-casting machine (CCM), i.e., a symmetrical, two-strand boat-type tundish with a capacity of 50 tons, the standard procedure for a hard transition is to lower the level of steel in the tundish to 20–22 tons.
The basic nature of this tested alternative batch-joining process during the Intermix (ULT practice) is characterized in Figure 1.
Equation (1) was developed for grade transitions based on the results of a series of trials.
The equation is a fairly simple exponential function which predicts the normalized composition of the steel on the narrow face of the strand as a function of tons cast in the mold after the new ladle is opened to start the grade transition. The equation includes tundish weight as a variable and should be applicable for all types of grade transitions under normal casting conditions.
Every grade transition starts from 0% completion and the percentage grows as the number of tons cast increases. The main purpose of the transition equation is to calculate when the transition reaches a certain percentage of completion. The percentage of completion is contained in the transition equation as a normalized composition ranging from 0 to 1 instead of 0% to 100%.
N o r m a l i z e d   c o m p o s i t i o n = 1 e T M A . T T + B . T T 2 ,
where TM is the number of tons in the mold after ladle opening and TT is the number of tons in the tundish at ladle opening, while A and B are coefficients depending on the tundish internal design, configuration, and furniture.
The results calculated using this equation for initial tundish weight values from 10 tons to 50 tons are shown in Figure 1. The data are plotted as a normalized composition (on a 0–1 scale) versus the number of tons in the mold after ladle opening. The number of tons in the mold can be calculated from the casting speed, mold width and thickness, and the density of liquid steel, with zero tons representing the time at which the ladle is opened to start the grade transition. Note that the number of tons in the mold is for one strand, and each strand requires the same number of tons to reach the same fraction of completion of the transition. With regard to the graph of transition curves for different levels of the initial level of steel in the tundish, it is clear that, compared to the standard procedure for lowering the level of the steel to 20–22 tons, it is possible in the case of the ULT practice (15 tons) to assume additional reduction of the Intermix range, i.e., shortening of the length of the chemical composition transition zone. The alternative 10-ton ULT practice was discarded due to the risk of slag entrapment in the submerged entry nozzle, and subsequently, also in the mold.
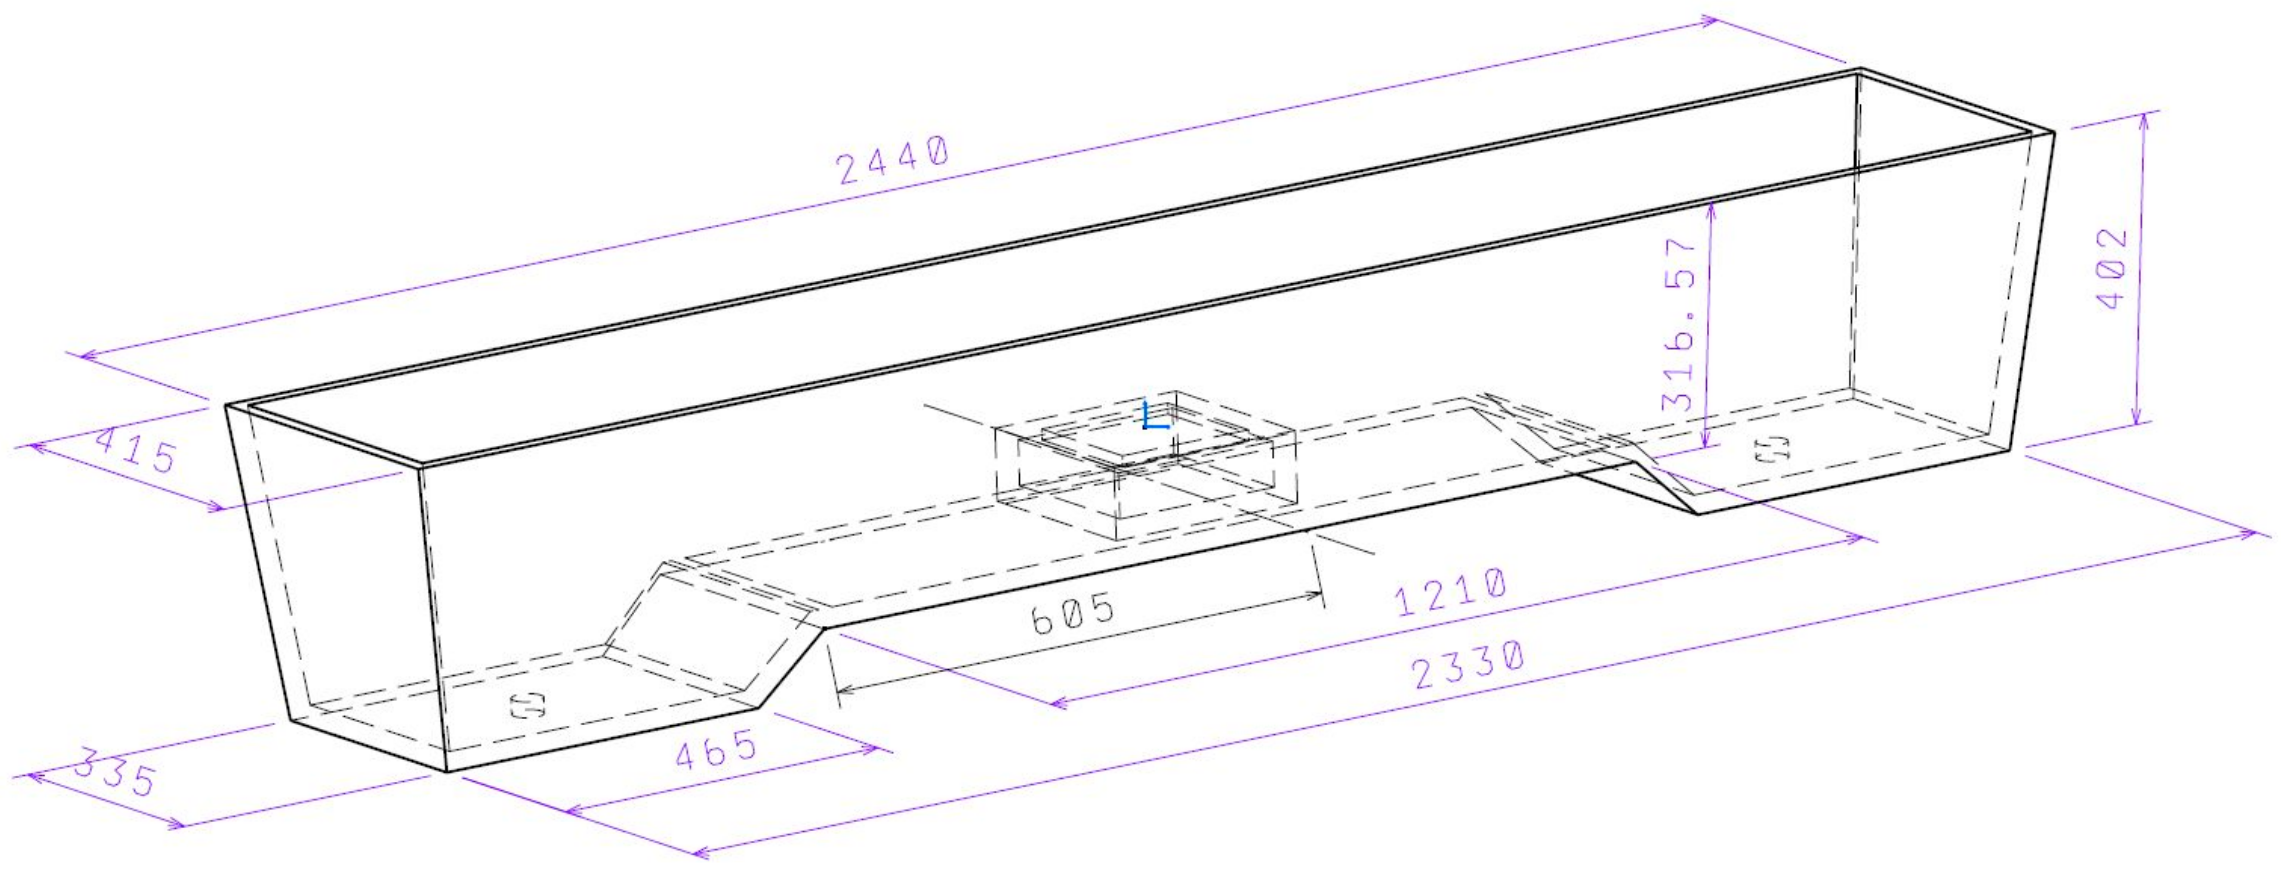
The results of simple numerical simulations for the tested cases of transient casting under standard conditions (20 tons) and ULT practice (15 tons) were verified using a continuous-casting machine (CCM) physical model with a scale of 1:3 at the Faculty of Materials, Metallurgy, and Recycling, Technical University of Košice (Figure 2). The dimensions of the tundish model are given in Figure 3.
The F-curve measurement methodology was used to verify the hypothesis that a lower initial level of steel in the tundish during transient casting can shorten the Intermix zone. Physical simulations were performed for the parameters listed in Table 1.
The measurement of F-curves on a physical model is used to describe the transition zone in the case of Intermix casting [10,11]. The tracer, 150 mL of an aqueous solution containing 10% KCl and 1% KMnO4, was dissolved in the entire volume of the tundish, and when the required level of water in the tundish corresponding to the beginning of the transition was reached, the tundish was filled with pure water, resulting in a change in the concentration of the tracer at the tundish output, which very clearly defines the beginning and the end of the transition zone under specific conditions [12,13,14,15,16]. The water flow was scaled using Froude′s dimensionless number [17].
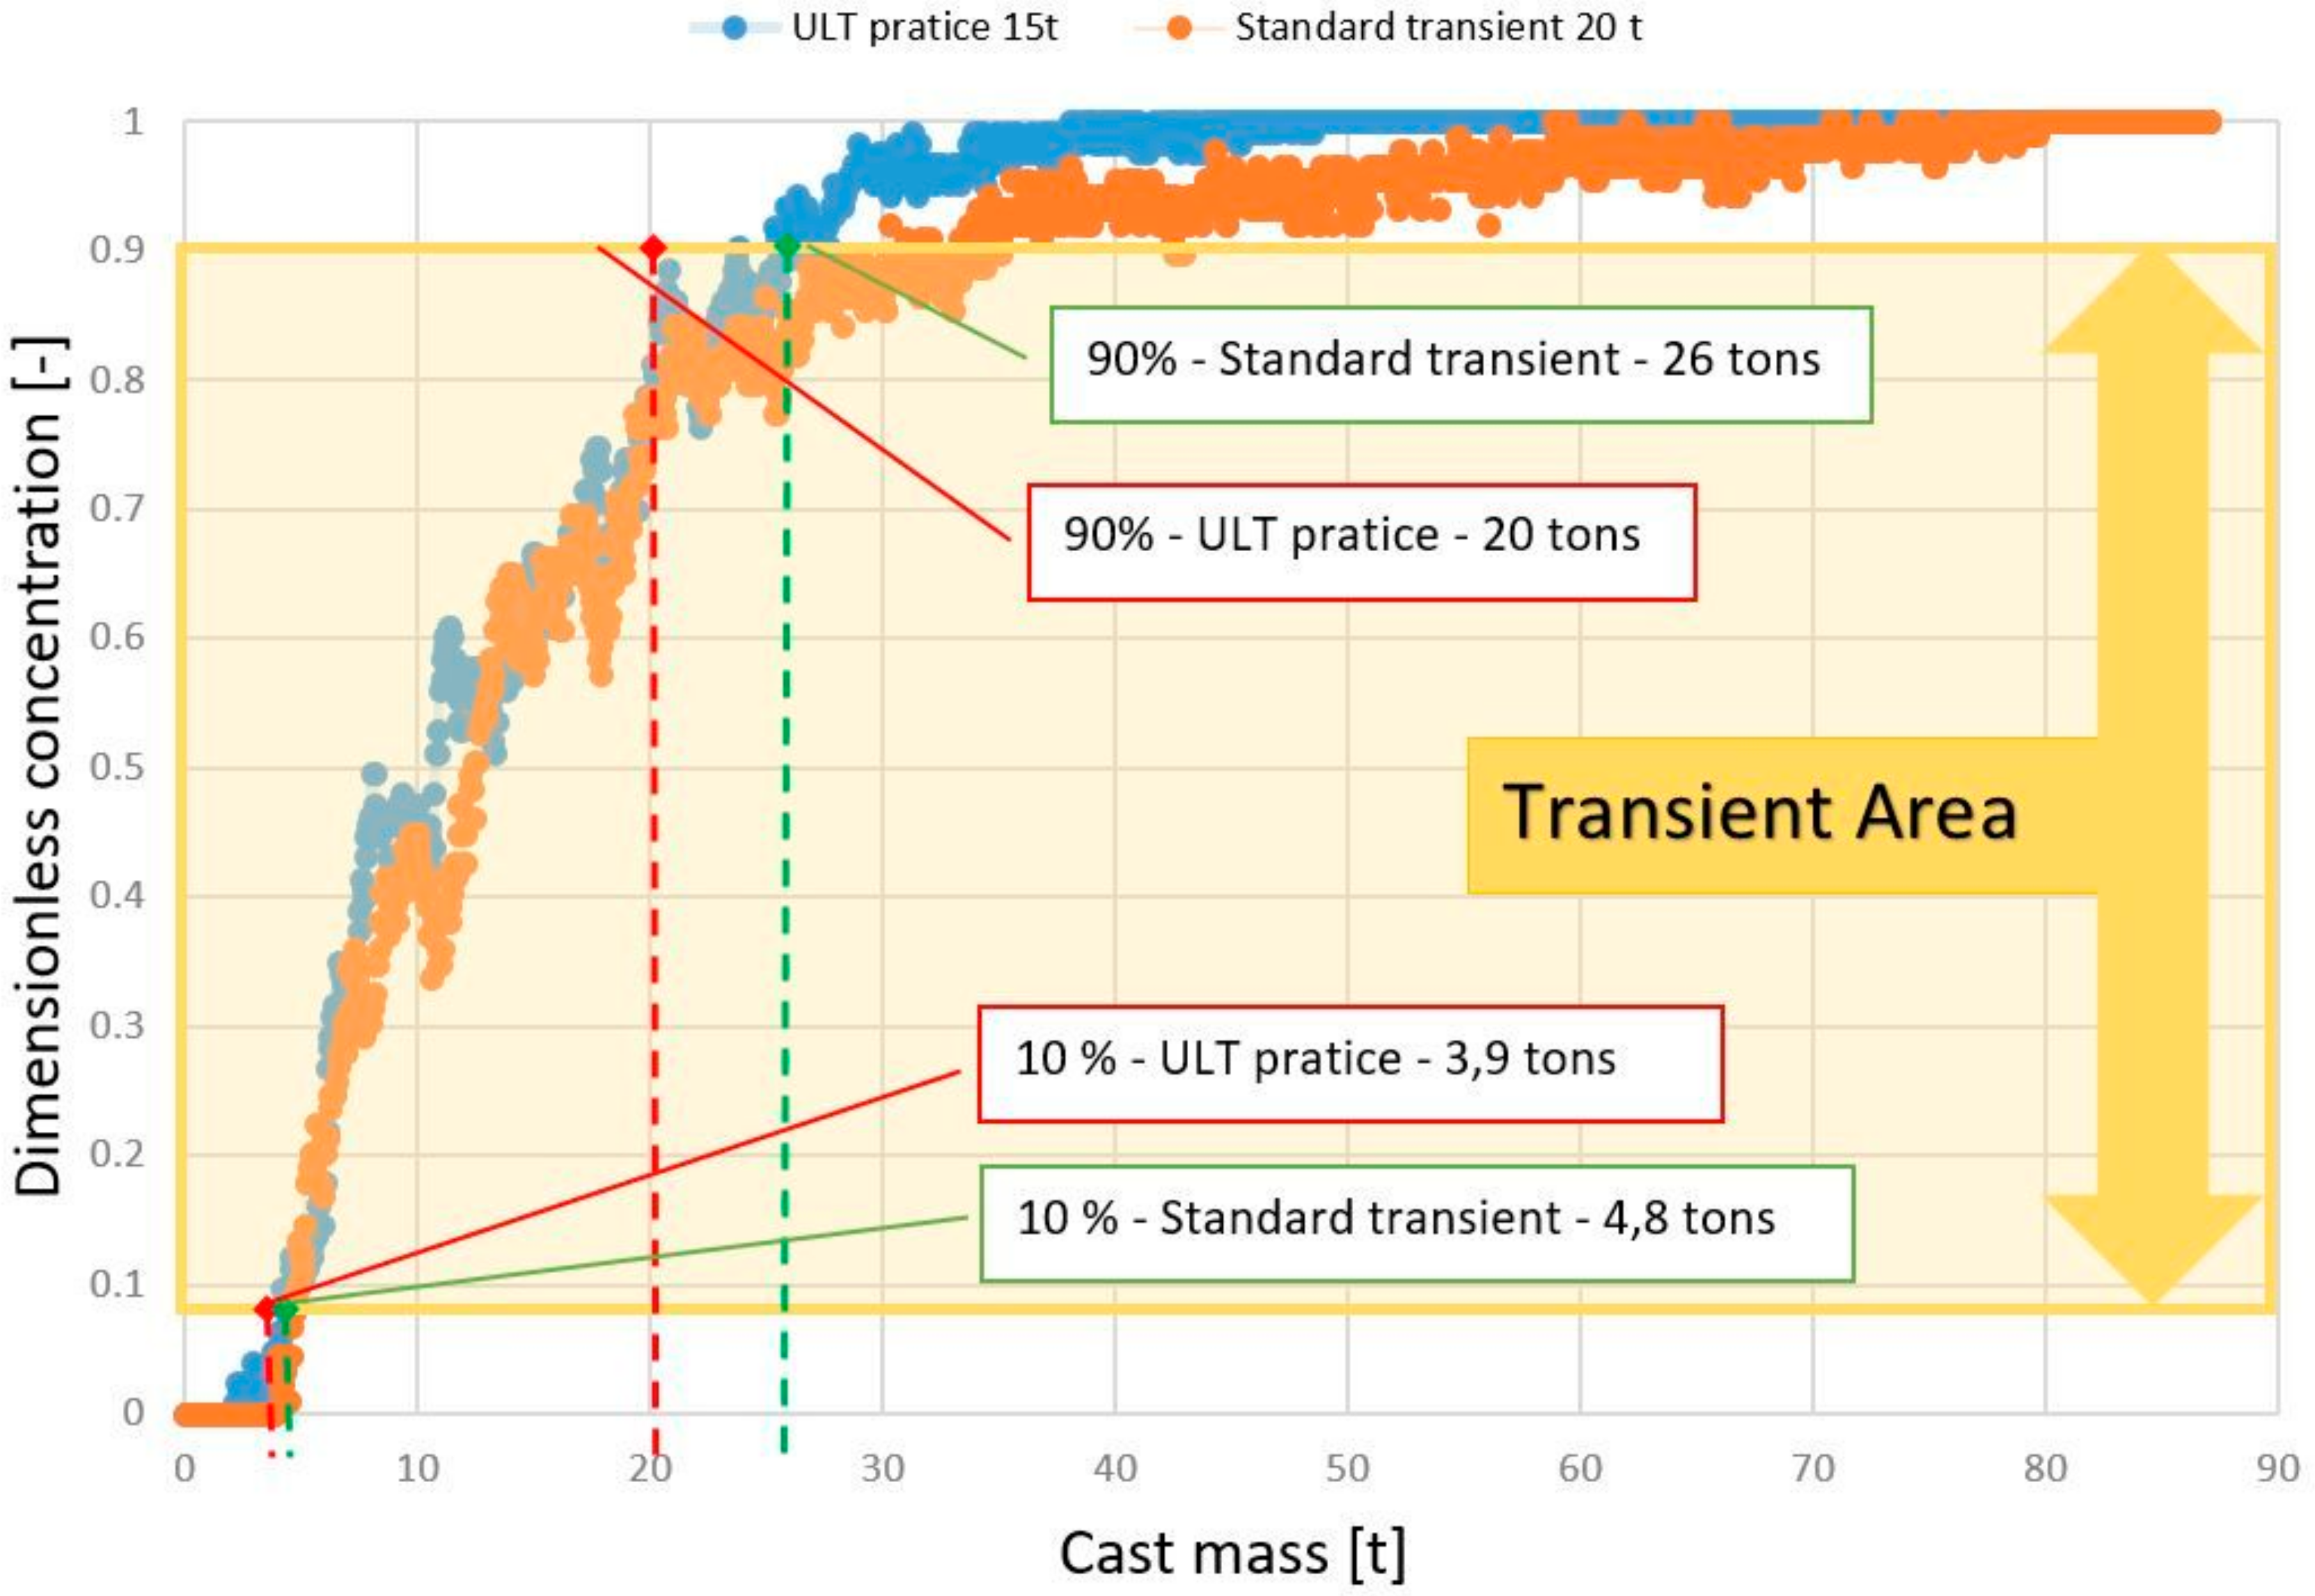
Using this physical model, our tests confirmed that, by means of the ULT practice, it is possible to shorten the length of the transition zone (Figure 4).
According to [6], we can consider the examined tundish with a width-to-length ratio of 0.16 to be a narrow tundish. Consequently, the walls of the narrow tundish are assumed to have a significant effect on the flow of liquid steel, which is revealed in the F-curves in Figure 4 by an uneven course of change in tracer concentration when the steel is reflected from these walls [16,17,18].
An in-depth analysis of the effect of the ULT practice on steel cleanliness was performed by means of operating tests. Samples of the steel from the mold were taken at specified time intervals during the Intermix transition. To compare the results, each transition was separately mapped in more detail for standard transient casting and using the ULT practice.
An important step, apart from the preparation of the operating tests themselves, was also the choice of the most appropriate method for evaluating the results obtained, regarding the change in chemical composition in the transient area of the slab for the given conditions. This choice was based on our previous knowledge and experience in this area of research, and consequently, the methodology of determining the dependence of the change in the so-called normalized composition by considering the mass of the cast steel in each mold from the moment the ladle was opened with a different steel grade was used [12,13].
The main advantage of this methodology is the ability to compare results from several realized transitions on the same basis, regardless of the variations in steel grade or casting conditions. The term “normalization of chemical composition of the sample” (NC) can be defined as the conversion of the chemical composition (percentage content) of the transition elements to be monitored, based on the melting analysis of the first and second melt, as well as the content of the individual samples taken during the given transition. Using the simple calculation in Equation (2), the percentage content of any chemical element with any value is transformed into the same interval of values from 0 to 1.
N C = ( %   o f   e l e m e n t   i n   t r a n s i e n t   s a m p l e %   o f   t h a t   e l e m e n t   i n   f i r s t   m e l t ) ( %   o f   t h e   e l e m e n t   i n   s e c o n d   m e l t %   o f   t h e   e l e m e n t   i n   f i r s t   m e l t )  
In order to study the effect of the joining conditions of different melts during the Intermix, a detailed, fully automatic analysis of the metallurgical cleanliness was carried out from the collected steel samples after their chemical analysis. For this purpose, one of the most modern AZtecFeature (Oxford Instruments, Abingdon, UK) tools was used, which is part of a VEGA3 scanning electron microscope from TESCAN ORSAY HOLDING a.s. (TESCAN ORSAY HOLDING, Brno, Czech Republic). The microscope itself is based on a hot cathode for use in both high and low vacuums. The microscope is equipped with an Oxford Instruments X-Max® 80 EDS analyzer (Oxford Instruments, Abingdon, UK), which is fully controlled by the latest AZtec software (Oxford Instruments, Abingdon, UK), also from Oxford Instruments. This tool makes it possible to determine the type, size, distribution, and shape, as well as the chemical composition, of individual types of non-metal inclusions in the analyzed samples, enabling their direct categorization into individual groups, as well as the export of the obtained information into standard available programs and formats for further processing.
Operational testing was carried out on the joining of selected A and B steel grades. Their basic chemical compositions are given in Table 2. The main monitored transition elements for this joining were silicon and aluminum.

3. Results

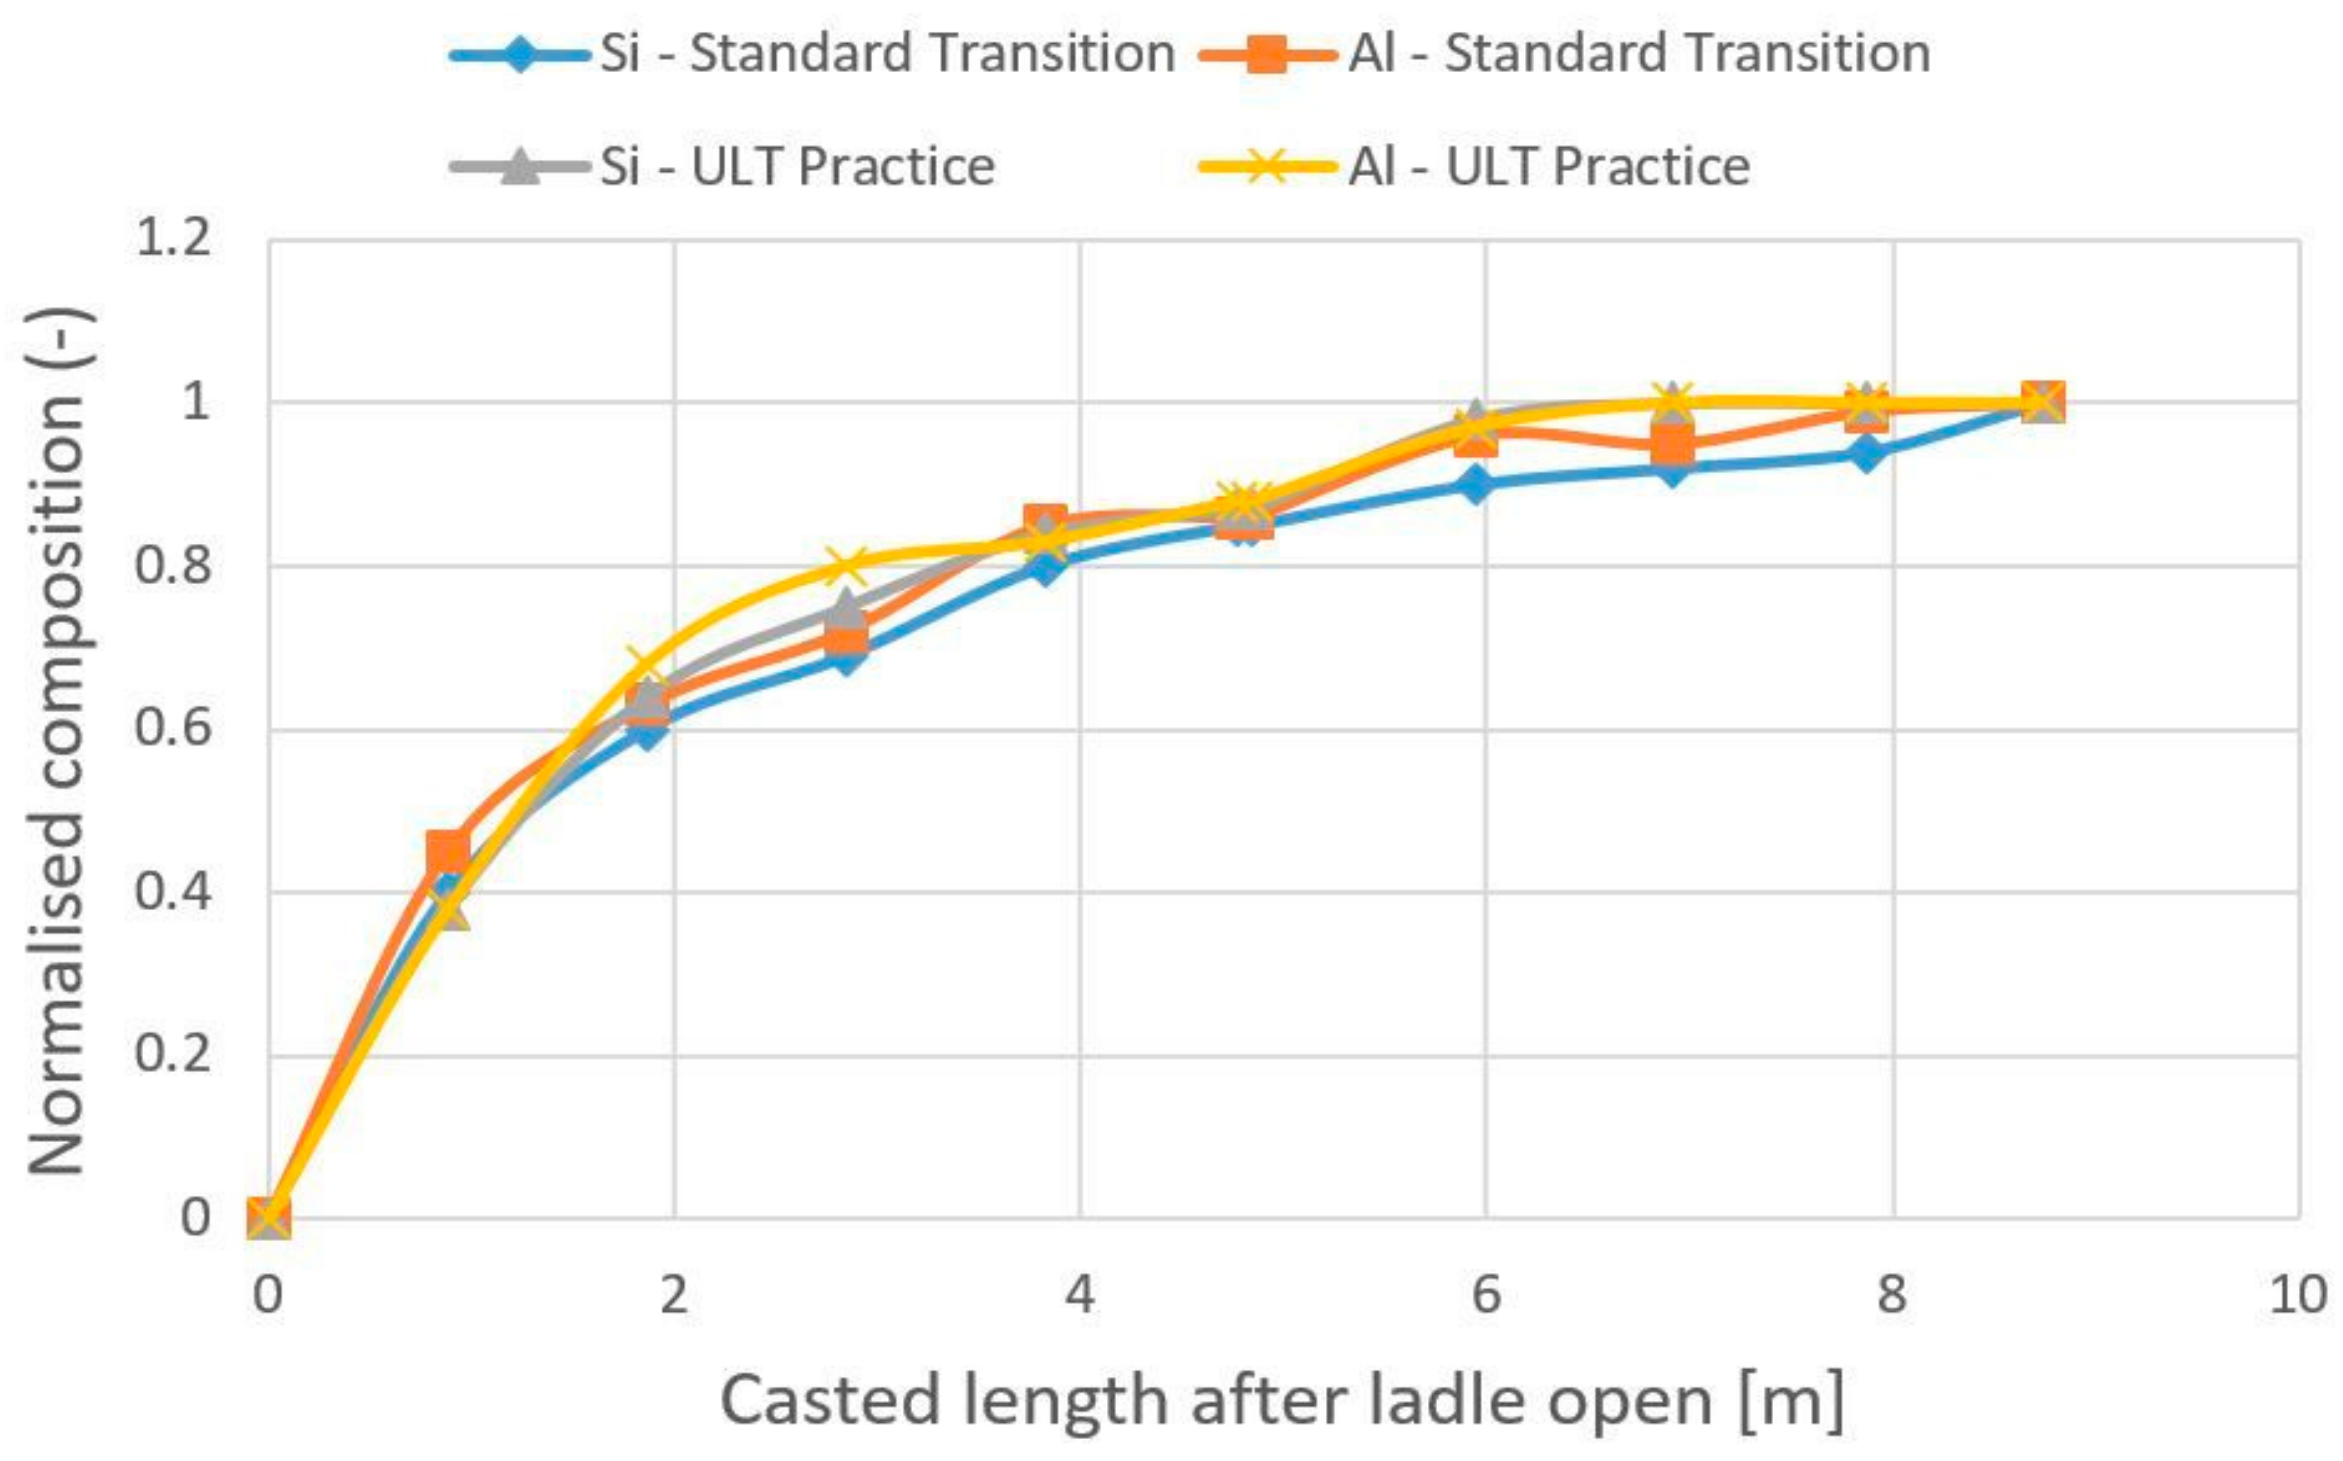
The results of the research in terms of Intermix evaluation are presented graphically in Figure 5, which presents a direct comparison of the standard transient conditions in the tundish at 20 tons, as well as with the new alternative tested, with an initial steel level of 15 tons in the tundish, i.e., ULT.
On the basis of a more detailed assessment of the progress of these transition curves, it can be concluded that the ULT practice produced a more rapid change in the chemical composition within the transition zone, especially after casting approximately six tons of steel from the tundish on a given strand. In this ULT practice, from the point of view of chemical composition, the transition zone was intensified and accelerated, and thus, the overall period of the Intermix was shortened.
The trends in chemical composition changes with the number of tons of cast steel, comparing the two procedures with different initial steel levels in the tundish, are presented in detail in Table 3 and Table 4. Each line in this table represents the moment of sampling of the steel from the mold during the particular type of transition. Samples were taken approximately from every two meters of cast slab. From the time data (in seconds) between sampling, the corresponding amount of steel cast (from the moment of opening of the second ladle) was calculated. Subsequently, the corresponding chemical composition and the calculated values of the change in the normalized composition were ascribed to the individual samples.
Due to this being a standard Intermix evaluation methodology [12,13,14,15], the limit of the standardized composition of the main transition element is generally considered to be 0.9 at the end of the transition zone under the stricter assessment criterion (10/90). The area for achieving this limit value is shown in Table 3 and Table 4, and for the standard practice in samples 5 and 6, and for the ULT practice in samples 4 and 5.
It is clear from these detailed areas that, in the standard procedure, the value of the normalized composition of the main transition element was 0.904% Si for the volume of cast steel at 25.49 tons, while the ULT procedure already achieved 0.913% Si with the volume of cast steel at 19.95 tons.
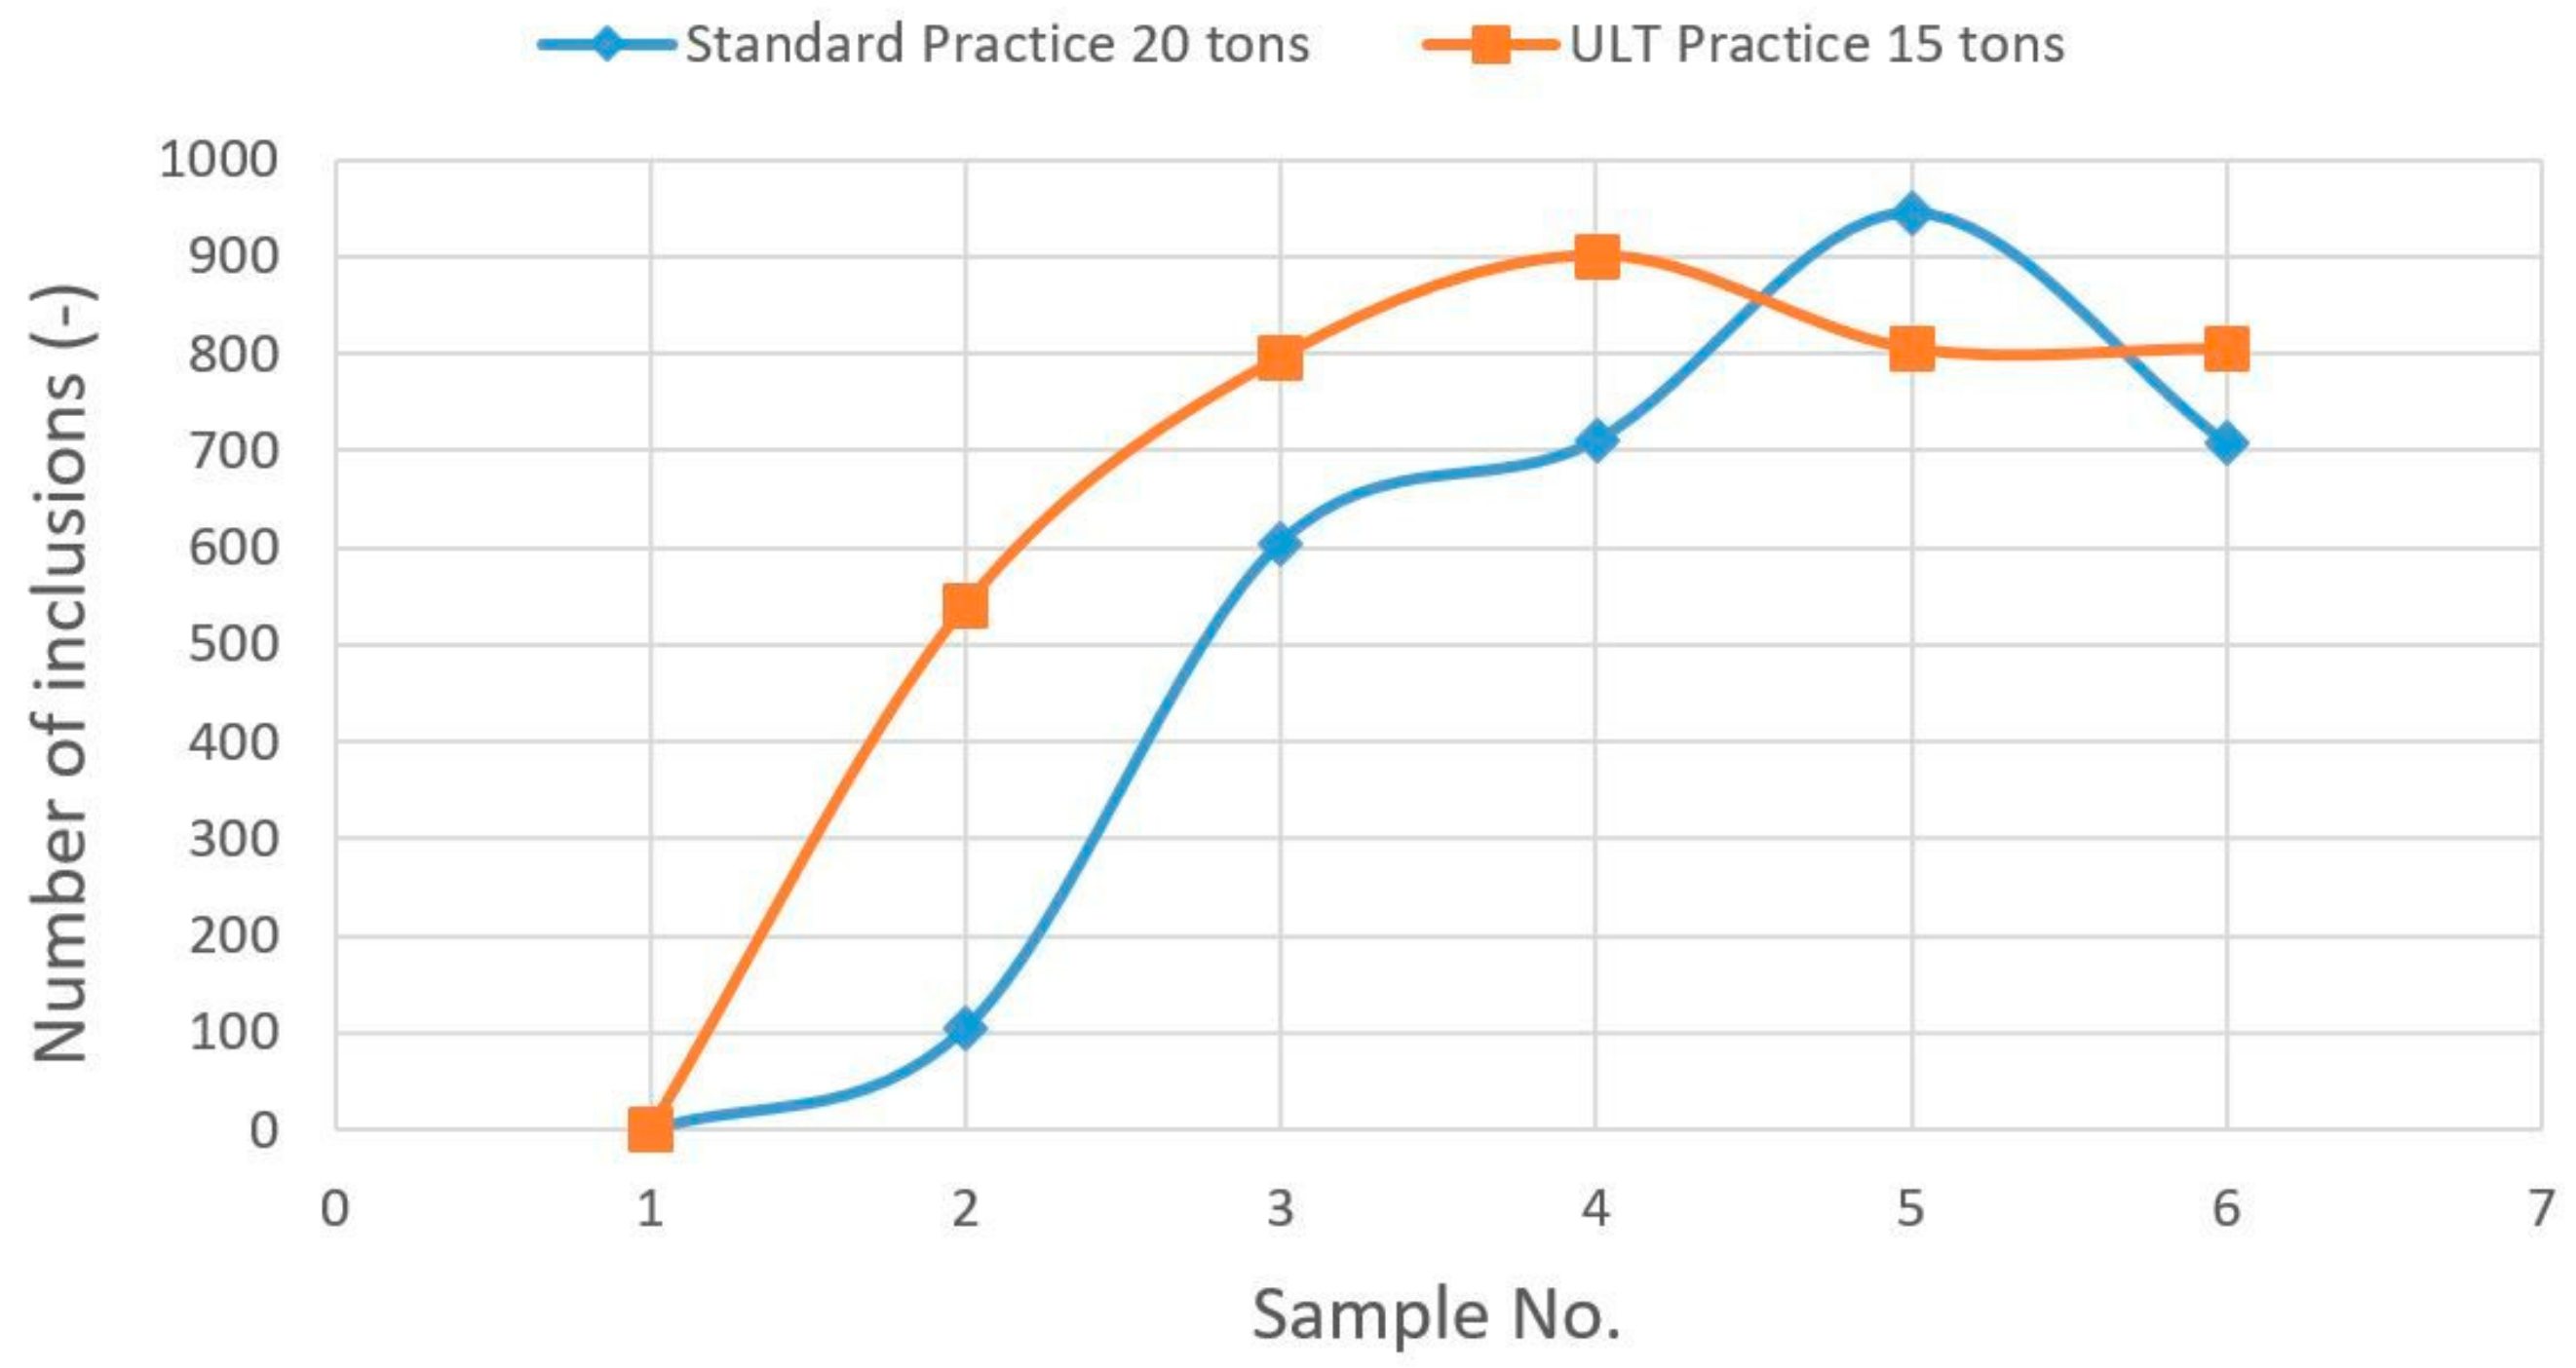
Despite the fact that the qualitative results of the processed slabs from the ULT practice testing did not confirm any possible negative trend or problems with their processing, detailed analysis of the standard of steel cleanliness was also performed on the taken samples. As can be seen from the results of this analysis presented in Figure 6 and Figure 7, in this context, the most highly represented non-metallic inclusions (Si–O and Al–Ca–O complex inclusions) were classified and evaluated in more detail. The analyzed area in each sample was 100 mm2. In our assessment of the achieved level of steel cleanliness, the first samples (No. 1) were taken at the moment of opening of the second ladle within the given transition, while subsequent samples were taken after casting approximately 2 m of slab. As in the case of the overall Intermix range evaluation, the two procedures (standard and ULT) were compared.

4. Discussion

Based on these results from our detailed analysis of steel cleanliness, it can be stated that the significantly different trends within the monitored categories of non-metal inclusions were due to the specific chemical concept and the process of production of specific steel grades.
The most important result of this research is the finding that increased inclusion content was recorded using the ULT practice compared to the standard transition process. Under the given casting conditions, the most significant decrease in steel cleanliness was recorded in the first four to five samples taken and analyzed (roughly equivalent to the first 6–8 m cast per strand from the moment of opening of the second ladle). Thus, the significantly affected section of slab (from the point of view of steel cleanliness) corresponded, in fact, to the range of the first transition slab cast on the strand within the given joining, which, in any case, in view of the significant differences in its chemical composition over its length, is generally regarded as problematic in terms of quality. Thus, it can be concluded that the steel cleanliness outside the transition zone was not affected by use of the ULT practice.

5. Conclusions

Based on our research results, it can be concluded that the ultra-low tundish practice produces savings in terms of shorter transition zones, thereby increasing steel yields in the continuous-casting process. Under the given conditions, the ULT practice enabled a 20% shortening of the transition zone. The area of higher inclusion concentration during the ULT practice was located in the transition part of the slab, and therefore, had no negative effect on the final quality of the cast steel.

Authors Contributions

B.B. performed the physical simulations, wrote the majority of the manuscript, and arranged the funding; M.M. carried out the experiments in the steel plant, performed the analyses of slab samples, evaluated the influence of ULT practice on steel cleanliness, and wrote the corresponding part of the manuscript; P.D. evaluated the results of the physical simulations; D.B. designed the experiments performed the water model of CCM; P.F. provided the graphical evaluation of the experiments; and A.P. revised the original manuscript.

Funding

This research was funded by VEGA MŠ SR a SAV grant number 1/0868/17.

Conflicts of Interest

The authors declare no conflicts of interest.

References

  1. Cho, M.J.; Kim, I.C. Simple Tundish Mixing Model of Continuous Casting during a Grade Transition. ISIJ Int. 2006, 46, 1416–1420. [Google Scholar] [CrossRef]
  2. Alizdeh, M.; Edris, H.; Pishevar, A.R. Behavior of Mixed Grade during the Grade Transition for Different Conditions in the Slab Continuous Casting. ISIJ Int. 2008, 48, 28–37. [Google Scholar] [CrossRef]
  3. Braga, B.M.; Tavares, R. Additional Information on “Simple Tundish Mixing Model of Continuous Casting during a Grade Transition” by Cho and Kim. ISIJ Int. 2018, 58, 1178–1180. [Google Scholar] [CrossRef]
  4. Huang, X.; Thomas, B.G. Modeling of Steel Grade Transition in Continuous Slab Casting Process. Metall. Mater. Trans. B 1993, 24, 379–393. [Google Scholar] [CrossRef]
  5. Wang, Y.; Zhang, L. Transient Fluid Flow Phenomena During Continuous Casting: Part II—Cast Speed Change, Temperature Fluctuation and Steel Grades Mixing. ISIJ Int. 2010, 50, 1783–1791. [Google Scholar] [CrossRef]
  6. Wang, Y.; Wen, X.; Qi, X.; Tang, X. Design of Bottom Height and Flow Control Device of Tundish for Slab Continuous Caster. J. Iron Steel Res. 2006, 13, 274–278. [Google Scholar]
  7. Morávka, J.; Mrajca, V.; Pindor, J. Possible ways of processing results of transition phenomena occuring in the tundish using approximation methods and their implementaion in field practice. In Proceedings of the 1st International Conference STEELSIM, Brno, Czech Republic, 25–27 October 2005. [Google Scholar]
  8. Mazumdar, K.D. Transient, Multiphase Simulation of Grade Intermixing in a Tundish under Constant Casting Rate and Validation Against Physical Modeling. JOM 2018, 70, 2139–2147. [Google Scholar] [CrossRef]
  9. Yeh, J.-L.; Hwang, W.-S.; Chou, C.-L. The Development of a Mathematical Model to Predict Composition Distribution in Casting Slab and Intermix Slab Length during Ladle Changeover Period and Its Verification by Physical Model. ISIJ Int. 1993, 33, 588–594. [Google Scholar] [CrossRef]
  10. Michalek, K. Využití Fyzikálního a Numerického Modelování pro Optimalizaci Metalurgických Procesů (Utilization of Physical and Numerical Simulation for Optimization of Metallurgical Processes); VŠB—Technical University of Ostrava: Ostrava, Czech Republic, 2001; ISBN 80-7078-861-5. (In Czech) [Google Scholar]
  11. Michalek, K.; Sawová, M.; Střasák, P. Modelling of transition phenomena in tundish during grade change of CC-Steel. In Proceedings of the 1st International Conference STEELSIM, Brno, Czech Republic, 25–27 October 2005. [Google Scholar]
  12. Buľko, B.; Kijac, J. Optimization of Tundish Equipment. Acta Metall. Slovaca 2010, 16, 76–83. [Google Scholar]
  13. Pieprzyca, J.; Merder, T.; Jowsa, J. Method for determining the time constants characterizing the intensity of steel mixing in continuous casting tundish. Arch. Metall. Mater. 2015, 60, 245–249. [Google Scholar] [CrossRef]
  14. Michalek, K.; Gryc, K.; Tkadlečková, M.; Bocek, D. Model study of tundish steel intermixing and operational verification. Arch. Metall. Mater. 2012, 57, 291–296. [Google Scholar] [CrossRef] [Green Version]
  15. Jha, P.K.; Kant, S.; Kumar, P.; Kumar, A. Time Zone Analysis of F-Curve for Intermixing during Ladle Change-Over; The Minerals, Metals, & Materials Society: Orlando, FL, USA, 2012. [Google Scholar] [CrossRef]
  16. Väyrynen, P.J.; Vapalahti, S.K.; Louhenkilpi, S. On Validation of Mathematical Fluid Flow Models for Simulation of Tundish Water Models and Industrial Examples. In Proceedings of the 2008 AISTech, Pittsburgh, PA, USA, 5–8 May 2008; Volume 2, pp. 41–50. [Google Scholar]
  17. Braun, A.; Pfeifer, H. Investigations of Non-isothermal Flow Conditions in a Two Strand Tundish Water Model using DPIV and PLIF-technique. In Proceedings of the SteelSim 2007—2nd International Conference of Simulation and Modeling of Metallurgical Processes in Steelmaking, Seggauberg, Austria, 12–14 September 2007; pp. 141–146. [Google Scholar]
  18. Singh, S.; Koria, S.C. Model Study of the Dynamics of Flow of Steel Melt in the Tundish. ISIJ Int. 1993, 33, 1228–1237. [Google Scholar] [CrossRef]
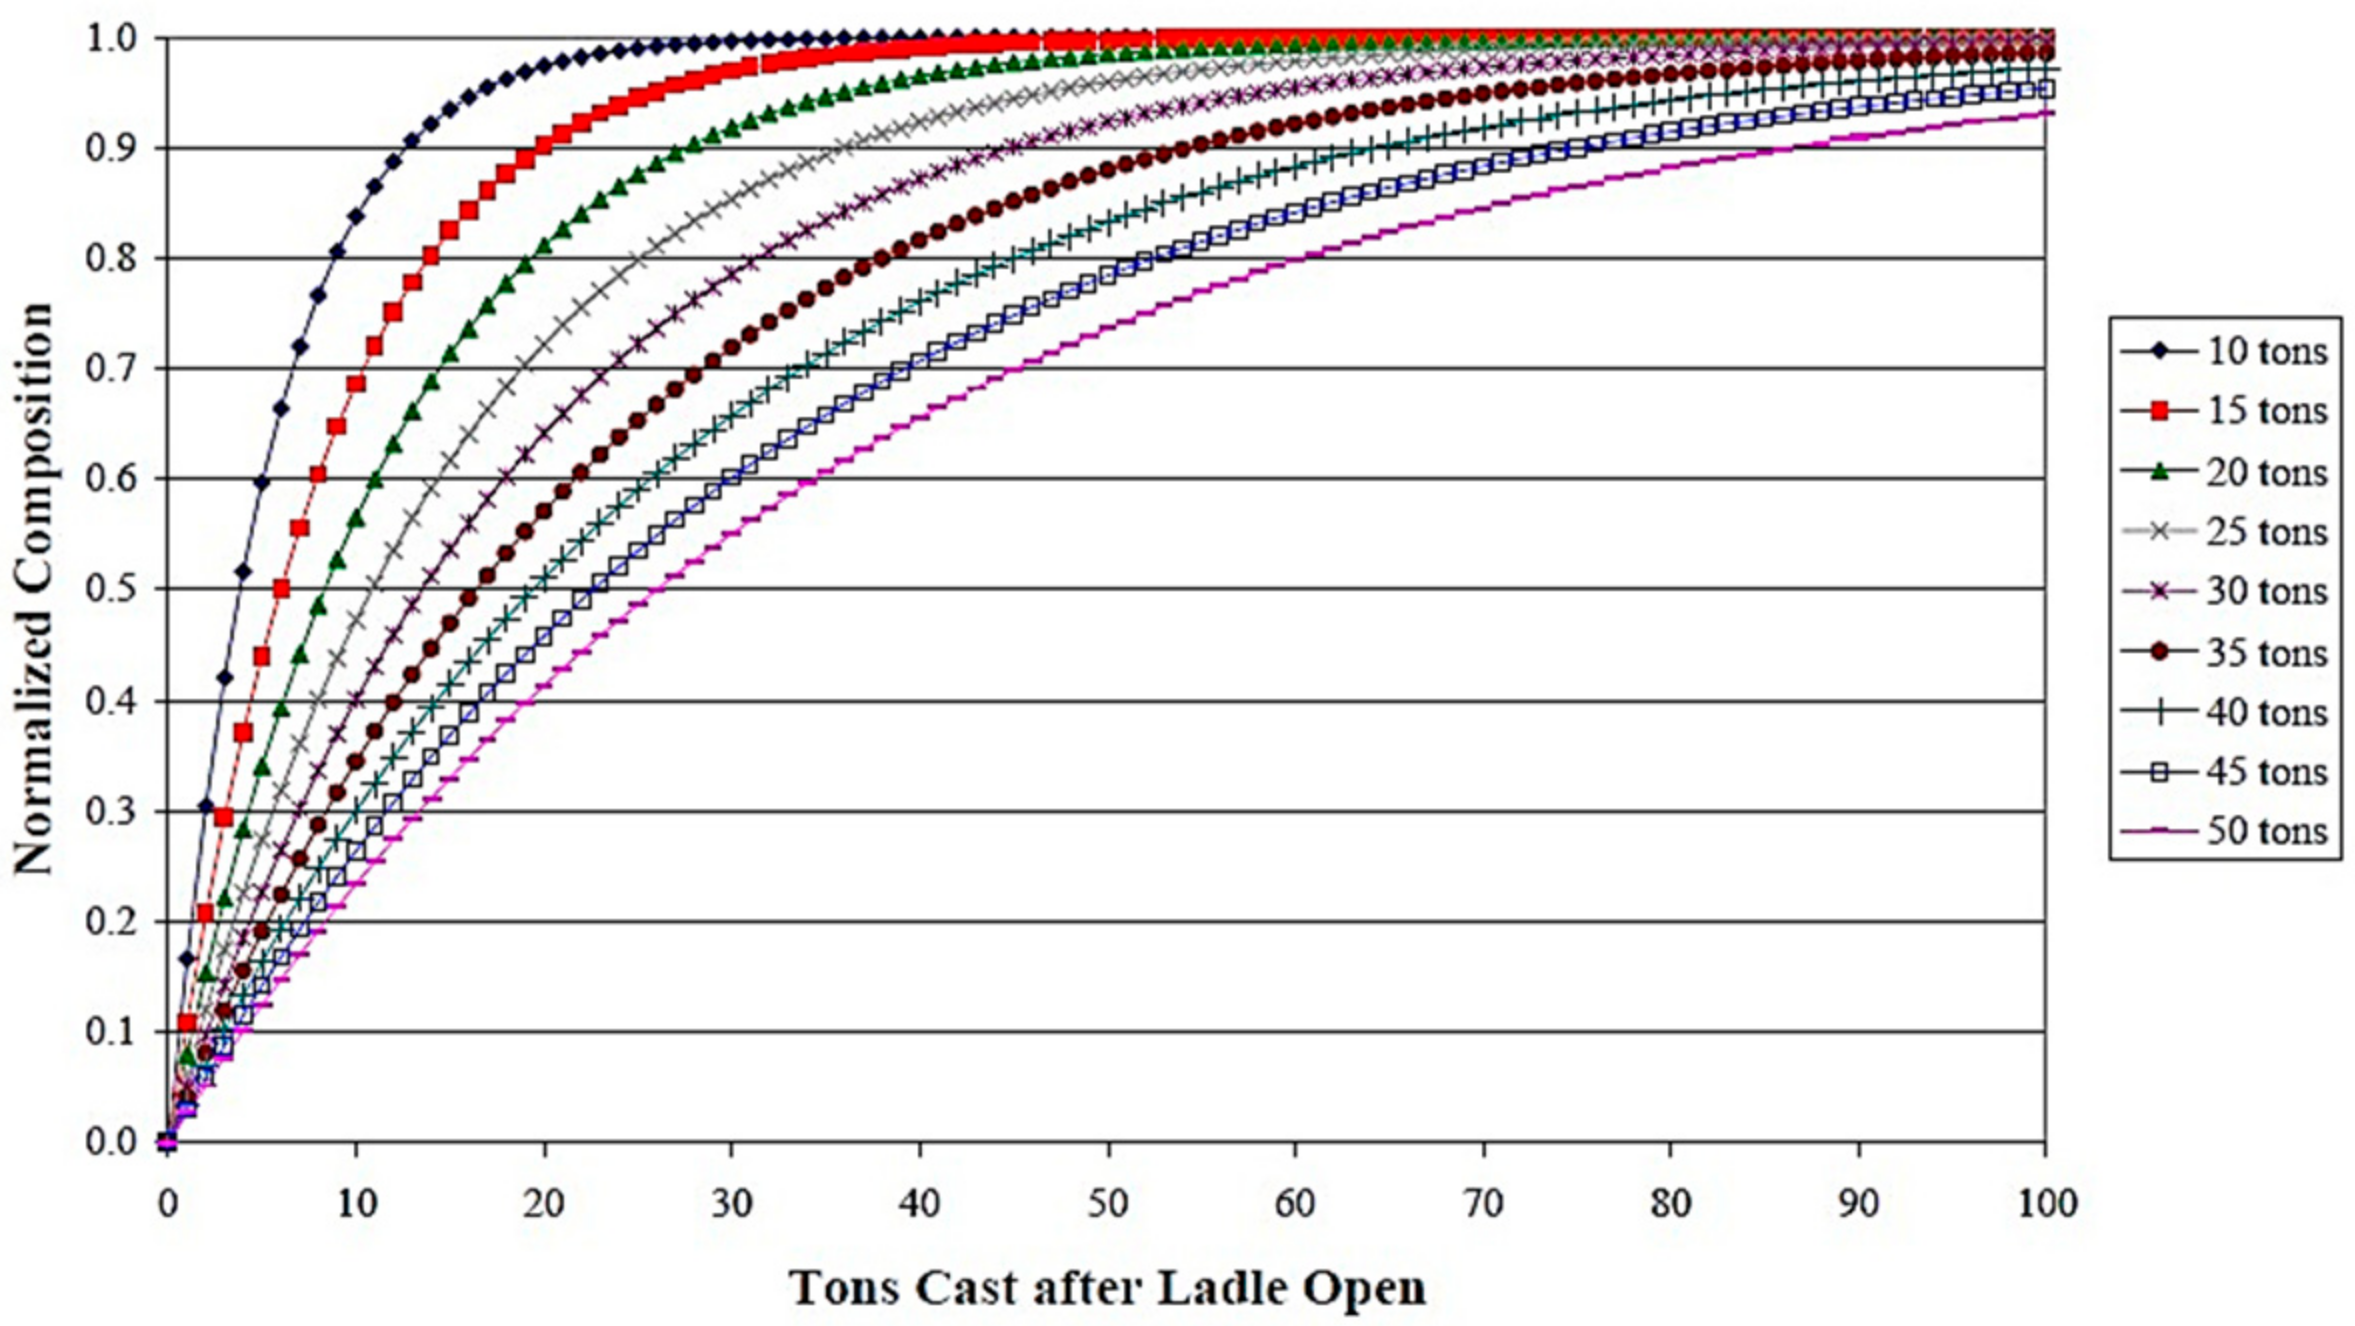
Figure 1. Basic nature of the influence of tested ultra-low tundish (ULT) practice on the Intermix (numerical simulation).
Metals 08 00852 g001
Figure 2. Water model of continuous-casting machine (scale 1:3) at the Faculty of Materials, Metallurgy, and Recycling, Technical University of Košice.
Metals 08 00852 g002
Figure 3. Dimensions of the used model of the tundish equipped with a standard impact pad.
Metals 08 00852 g003
Figure 4. F-curves for standard transition and for ULT practice (physical simulation).
Metals 08 00852 g004
Figure 5. Comparison of transition curves for standard transition and ULT practice.
Metals 08 00852 g005
Figure 6. Comparison of the course of total Si–O inclusions in the different A and B grade joining conditions (standard vs. ULT practice).
Metals 08 00852 g006
Figure 7. Comparison of the course of total Al–Ca–O inclusions in the different A and B grade joining conditions (standard vs. ULT practice).
Metals 08 00852 g007
Table 1. Parameters for the physical simulations. ULT—ultra-low tundish.
Mold Width (mm)Casting Speed (m·min−1)Theoretical Hourly Production of CCM (tons·h−1)Tundish Width-to-Length RatioOperating Level of Water in Tundish (mm)Initial Level of Water in Tundish for Simulation of 20-Ton Standard TransitionInitial Level of Water in Tundish for Simulation of 15-Ton ULT Practice
12501257.40.16420200160
Table 2. Basic chemical composition of steel grades A and B.
SampleC (%)Mn (%)Si (%)P (%)S (%)Al (%)N (%)
Steel grade AMax. 0.01050.295–0.4050.895–1.0540.08–0.1Max. 0.010.095–0.165Max. 0.007
Steel grade B0.003–0.01050.146–0.3050.595–0.7050.1–0.13Max. 0.009Max. 0.005Max. 0.005
Table 3. Detailed course of the change in normalized composition for steel grades A and B (20 tons).
Standard Practice of Joining Steel Grades A and B (20 tons)
No. of SampleCast Mass during Intermix (tons)Si NormalizedAl Normalized
13.780.4300.450
28.50.6040.634
312.580.6830.733
416.650.7950.847
520.730.8500.885
625.490.9040.962
729.530.9150.962
833.690.9250.992
937.7311
Table 4. Detailed course of the change in normalized composition for steel grades A and B (15 tons).
ULT Practice of Joining Steel Grades A and B (15 tons)
No. of SampleCast Mass during Intermix (tons)Si NormalizedAl Normalized
13.450.3720.372
28.150.6610.669
312.440.7750.804
416.270.8460.831
519.950.9130.908
623.440.9660.953
727.7611
831.5911
935.4711