Behaviour of Steel Grade S275JR Columns under the Influence of High-Temperature Creep


1
Faculty of Civil Engineering, Architecture and Geodesy, University of Split, Matice Hrvatske 15, 21000 Split, Croatia
2
Department of Civil and Structural Engineering, University of Sheffield, Sir Frederick Mappin Building, Mappin Street, Sheffield S1 3JD, UK
*
Author to whom correspondence should be addressed.
Metals 2018, 8(11), 874; https://doi.org/10.3390/met8110874
Submission received: 11 October 2018
/
Revised: 19 October 2018
/
Accepted: 23 October 2018
/
Published: 25 October 2018
Abstract
:This paper presents a test study focused on determining the influence of high-temperature creep on the buckling of grade S275JR columns. Both capacity and stationary-creep column tests were performed within the study. The results obtained demonstrate that high-temperature creep influences a column’s load-bearing capacity, even at 400 °C if the column’s load ratio is above 87%. The reduction of load capacity due to creep was determined experimentally up to 600 °C, for which the failure due to creep occurred at load ratios above 57% of the capacity at 600 °C. The failure times for all the column creep tests occurred within 240 min of loading at constant temperature. Numerical modelling of the creep tests, including their constant-temperature capacity, was performed with the help of the research software Vulcan, by explicitly including a previously developed creep model for grade S275JR steel in the total strain formulation.
1. Introduction
1.1. Motivation
The influence of creep strain on the load capacity of fire-affected steel structures is a topic that has started to receive attention from scientists and researchers in the last decade. One of the major reasons for the lack of previous research effort in this area is the fact that the creep strain itself has been long considered as irrelevant to the response of steel structures exposed to high temperature. This opinion was also based on observations made from previous structural fire tests, of which the majority [1,2] used very rapid heating curves, inducing high-level heating rates in the tested members. In such tests, failure of the member usually occurs more or less directly at a critical temperature, with very little time being available for development of significant creep strain during the test. In particular, the steel member is at temperatures above 400 °C, which is generally considered to be the threshold beyond which significant creep strain starts to evolve. Another major reason for the lack of research effort has been the availability in design codes for application in structural engineering of a modified high-temperature stress–strain model for steel which implicitly includes creep strain. The most commonly used implicit model is included in the Eurocodes [3,4] for fire resistant design of steel structures.
The current application of natural and travelling fire concepts into performance-based structural fire analysis are contexts in which steel structures can be exposed to low heating rates (generally below 20 °C/min), which can prolong their exposure to temperatures above 400 °C. This may also occur if a structure is exposed to long-lived slow-burning or under-ventilated fires, or if it is insulated with fire-protection material. In both cases, a structural element is exposed to lower heating rates due either to low incident heat flux or to low thermal conduction through fire protection. These fire scenarios represent cases in which creep development can become an important factor in the structural response because of the existence of an additional strain component, which, over time periods typical of building fires, influences the fire resistance of the structure.
The lack of detailed experimental data on the creep behaviour of contemporary European structural steel grades and the general concentration on time-independent structural analysis at elevated temperatures which derives from the use of implicit-creep material models, was the main motivation for the development of a sequence of collaborative research studies [5,6] between Universities of Split and Sheffield. Column behaviour (buckling) under conditions that facilitate creep is potentially much more significant to structural robustness in fire than the additional deflection of beams under these conditions. The steel grade chosen for the studies is S275JR, since this is widely used in the construction industry across Europe.
1.2. Previous Numerical and Test Studies
Most previous research on the influence of high-temperature creep on steel structures has been conducted on single-span steel beams, either with simple support [7,8,9] or with axial restraint [10,11]. The influence of creep, in the case of beams with axial restraint, is generally observed as a drop-off of the internal axial force in the beam due to restraint to thermal expansion. In the early stages of fire exposure, while this axial compression force is increasing, beam deflections are more pronounced than in comparable simply supported beams. However, at higher-temperature stages, increasing rates of creep strain, together with the basic weakening of the material, tend to reduce the axial force, thus accelerating the beam’s progression towards “catenary” action. In this final stage, the beam has almost no bending stiffness [10], and acts essentially in tension. The influence of creep on beams with no axial restraint is observed simply through an additional rate of increase of transverse deflection. In both cases, creep strains tend to result in reductions of fire resistance.
Most of the research regarding the influence of creep on the buckling response of columns has been published in the form of numerical studies combined with either explicit creep modelling [12,13] or a reduced tangent-modulus model [14]. The main conclusion from these studies was that creep influences the critical temperatures of columns beyond 400 °C, when they can be significantly reduced due to the inclusion of an explicit creep component.
A literature survey on previously conducted column fire tests revealed that relatively few experiments have been performed with fire temperature-time curves which are capable of inducing significant creep strain development. The majority of published results [15,16,17,18] of fire tests on steel columns have been based on tests using the ISO834, constant-temperature or linear heating curves to heat the members. An exception was a study conducted by Li et al. [19], which utilized a natural fire curve as a representative fire action that can be considered to include the influence of creep on the overall column behaviour. As mentioned previously, a lack of column fire tests that predominantly focus on the influence of creep represents the main motivation for conducting the presented study.
2. Experimental Study
2.1. Test Setup and Methodology
The test study was conducted at the University of Split. The column specimen (HEB140), the test frame, equipment and measuring points for temperature are shown in Figure 1 and Figure 2. The slenderness of all the steel columns was approximately 81. The heating equipment (Miller, Appleton, WI, USA) used in the tests was based on direct heating of a tubular steel jacket of 406 mm diameter and 12 mm wall thickness by radio-frequency induction heating. This type of induction heater produces a high-frequency electric field, which heats ferromagnetic metals located within the field. This field is generated around induction cables which are marked on Figure 1. The cables heat the steel jacket, at heating rates ranging between 2 °C and 10 °C/min. The heating rate of the jacket can be adjusted by changing the power output of the induction heater, which can be increased up to 35 kW. The jacket heats the steel HEB140 column which is placed inside it, predominantly by radiative heat flux, with some convective heat flux coming from the hot air moving within the jacket. With the help of the induction-heated jacket, it is possible to achieve a uniform heating profile in the column cross-section, since the radiative heat source surrounds the specimen. Uniform heating of the column inside the jacket can be observed from the selected temperature measurements, which are presented in Figure 3. The induction-based heating rate of the jacket is controlled by a thermocouple which is connected to its inner surface. With this type of heating arrangement, a very uniform target temperature field was achieved at temperature measurement points 3–10, while the temperatures at points 1–2 and 11–13 remained 50–200 °C lower than the target temperature, depending on the level of this target temperature. The difference between the temperature profiles over the column length is present when the target temperature is increased to a higher level, especially at points 1–2 and 11–13 (column ends). At the end parts of the column, in comparison to the mid-part of the column, the temperature difference over the column length is higher. This difference can be attributed to a weaker electric field at column ends, which is more pronounced with the increase of the target temperature. The column specimens were aligned horizontally, and loading in the horizontal and vertical directions was achieved using a horizontal ram with maximum capacity 1500 kN and a vertical ram with maximum capacity 300 kN. Column displacements were measured by four LVDTs (shown in Figure 2). LVDT 1 was used to measure the horizontal (axial) displacement of the column, LVDT 2 the column’s end-rotation, LVDT 3 the vertical (transverse) displacement of the column, with LVDT 4 is as a check-measurement of this vertical displacement. The column is transversely (vertically) loaded about its weak axis with a low force, as an imperfection in its corresponding global buckling mode. For a pin-ended column, this imperfection reduces the effect of friction at the 60 mm diameter steel pins which are used as simply supported ends of the column. A lubricated thin steel plate surrounding the pin’s surface provides additional lubricated contact area, and reduces the inevitable friction in this area.
Two types of high-temperature column tests were performed: constant-temperature capacity and creep tests. A total of 17 column specimens were tested. Table 1 summarizes the test parameters for the constant-temperature capacity tests. The three column tests were conducted at ambient temperature. In Test 3, no lubrication was applied to the pins, and this therefore clearly illustrates the effect of reducing friction in Tests 1 and 2.
2.2. Constant-Temperature Capacity Tests
These tests were performed to determine the column’s axial load capacity at a target temperature, with a constant transverse force. The column is initially heated to the target temperature, loaded with the transverse vertical force, and subsequently loaded at a loading-rate of approximately 2 kN/s with axial compression until column failure occurs. Figure 4 presents the results of the column capacity tests at 400 °C, 500 °C and 600 °C, as a plot of midspan displacement against applied axial force. At 500 °C and 600 °C, two column tests for each temperature level were conducted at different vertical forces. A plot of simulation results obtained with numerical model Vulcan is also presented where Eurocode 3 stress-strain models with 1 and 2% yield strain was used as representative for the material’s stress-related strain. The Eurocode 3 stress–strain model with 1% yield strain represents a model without the implicit creep content while the Eurocode 3 stress–strain model includes implicit creep strain. More discussion on the selected material model is given in Section 3.2.
2.3. Constant-Temperature Creep Tests
Constant-temperature creep tests were performed by firstly heating the column to a prescribed temperature level, loading the column with constant transverse force, and subsequently adding a constant axial force which represents a certain fraction (load ratio) of the axial load capacity at the given column temperature. After the addition of axial load, the constant temperature and axial load were maintained until the end of the test, which is defined by column failure due to the evolving creep strain. The target temperatures for both capacity and creep tests were chosen as 400 °C, 500 °C and 600 °C. As in the capacity tests, the initial axial loading-rate was approximately 2 kN/s until the load level was reached. A summary of the creep test-parameters is presented in Table 2.
The consistent failure criteria in the performed capacity and creep tests is based on the point when the axial compressive force reaches its maximum and reduces up to 10% after column buckling is initiated.
3. Modelling of the Fire Tests
3.1. The Numerical Model
Numerical modelling of the capacity- and creep-tests was performed to thoroughly understand the effect of creep on the reduction of columns’ axial capacity. The data applied to this modelling originate from previously-conducted testing [5] on steel coupons cut from the columns’ flanges, from which material properties such as yield strength and modulus of elasticity at temperature levels up to 600 °C were determined. An analytical explicit creep model, valid for the temperature range 400–600 °C, was also derived within this study. Modelling of the column behaviour at high temperature was performed using the academic research version of software Vulcan [20]. Vulcan is capable of geometric and materially nonlinear analyses of composite structures under stationary and transient heating scenarios. The model used 26 three-node line elements with segmentation of the I-section as a 13 × 11 matrix, as shown in Figure 5a. Temperature measurements recorded during the creep tests were directly input to the column model. Based on the temperature measurements from the tests, each of the three-node line elements was assigned with a time-dependent temperature value for upper flange, web and lower flange. The FE mesh was arranged in a way that the cross-sections, in which the temperatures are measured, represent either the start or end node of the line element. The line elements which are located between the cross-sections in which the temperatures are measured were assigned to temperature values which are based on the interpolation of temperature values between the measurement sections.
The failure criterion in the performed numerical analysis is based on failure of convergence in the performed quasi-static analysis which is part of the Vulcan software. Therefore, the last stable equilibrium point in a numerical simulation represents the last converged thermo-mechanical equilibrium position.
3.2. Stress-Related and Creep Strain Model
The stress-related strain model used for modelling is based on a modification of the Eurocode 3 material model [21], which excludes implicit-creep content. This type of model is referred to as a creep-free model.
This type of creep-free model was compared with experimental stress–strain curves from the preliminary study [5] and was found to be in good agreement with the experimental values. The creep-free Eurocode 3 (EC3) model is based on a modification of the yield strain value to 1%. The basic equations for the creep-free model are identical to the Eurocode 3 model:
Parameters a2, b2 and c are defined as:
in which and (the value used to exclude implicit creep). The parameters , , , respectively, represent the proportional limit, yield strength and modulus of elasticity at temperature θ. The experimental values for modulus of elasticity and yield strength at 1% strain are used, together with the creep-free model for stress-related strain. The reduction factors for yield strength and modulus are presented in Figure 5b and a plot of the stress-related strain curves are presented in Figure 5c. Values for and at normal temperature used in the study are 287.5 and 204.7 MPa, respectively. A previously developed analytical creep model is used in the numerical study, based on the following expression:
in which εel is the elastic strain, εcr is the creep strain (%), t is time (min) and . The coefficients a, b, e and f are stress- and temperature-dependent. The coefficient values can be found in the study [5]. The elastic strain is removed from the creep model when it is integrated in the total strain component. The resultant strain components in a general structural fire analysis can be expressed [22] as:
where is the resultant strain, is the temperature-dependent thermal strain and is the stress-related strain, which is a function of the applied stress σ and temperature T. The strain is the stress-, temperature- and time-dependent creep strain, which is considered explicitly in this study with the help of creep model defined by Equation (5).
3.3. The Friction Model
The influence of friction due to the applied test arrangement is relatively hard to remove completely. Studies by Tan et al. [15] and Huang and Tan [16] also pointed to a similar problem, in which the friction effect had to be taken into account in modelling. The modelling approach by Huang and Tan was to define rotational spring elements at the supports to simulate friction in the pins. The friction in the pins is modelled using this approach in the study; an additional rotational spring of constant stiffness was used at each support.
This approach for modelling friction is presented in Figure 5a, together with the overall column model. The stiffness values of the spring are temperature-dependent, and a suitable calibration of the FEM model was conducted based on the capacity tests performed at the prescribed target temperatures. The calibrated spring stiffness at each target temperature is then used for simulation of the creep tests. The performance of the Vulcan model (the numerical model) and the column tests at ambient temperature are presented in Figure 6. It can be seen that the Vulcan predictions of vertical deflection follow the deformation trend of the column which is influenced by the friction at end supports. The influence of the support friction on the columns’ axial load capacity, taken into account using the rotational springs, can also be observed. Furthermore, a third test was conducted at ambient temperature without using the applied lubrication strategy, in order to assess its performance. Since the experimental buckling force obtained by this dry-friction column experiment is substantially higher than the value obtained from regular lubricated test, the results of the dry-friction test are not considered as relevant for comparison in Figure 6.
3.4. Comparison of the Results
Table 3 presents a comparison between the experimental results of axial capacity tests and the predictions of the Vulcan model. In this table, numerical values of spring stiffness are given, depending on the value of vertical force used in the test at any particular temperature level. Figure 7 presents a comparison between the creep test results and the Vulcan predictions of vertical displacement. The mid-span displacement range at the beginning of the creep tests varied between 5 and 25 mm, depending on the target temperature and the vertical force value. To standardise the presentation, deflections are plotted in Figure 7 as increments from these initial values. Three column tests were conducted at different stress levels at each target temperature (400 °C, 500 °C and 600 °C) to explore the influence of load level on the columns’ creep resistance. The failure times of the columns due to creep are presented in Table 2 together with the predictions of the Vulcan model. Figure 8 presents a photograph of the tested specimens and Figure 9a,c shows the accuracy of the predicted axial load capacity (capacity tests) and the column failure time (creep tests) with respect to a ±10% error margin.
Nine columns have a symmetrical buckling mode while eight of them buckled with a slightly unsymmetrical shape. This possibly occurred because the vertical ram is not directly positioned at midspan. All the columns buckled about the minor (“weak”) axis of the section. Figure 9b presents a comparison between the critical axial loads obtained by column creep tests and the model prediction by using the EC3 stress–strain model with 2% yield strain. Table 4 presents the reduction factors for yield strength and modulus of elasticity used in the numerical study. As shown in Figure 9b,c, the relative accuracy of the explicit creep model analysis in comparison to “implicit creep” EC3 model analysis is considered slightly better since the discrepancies in case of explicit creep analysis occur only in one case of column failure at longer exposure to high temperature (233.4 min).
4. Discussion of Results
4.1. Accuracy of the Column Model
According to the results presented in Figure 9a, the prediction error for most of the axial capacity tests is either within the ±10% error margin or on the safe side, which shows that the proposed column model with rotational spring support can be considered as adequate for modelling the friction effect on the column response. Two points in Figure 9a fall out of +10% error margin, with three being on the boundary. Figure 9c further shows that the column model is adequate for analysis of the creep behaviour of columns. This statement is based on the fact that the explicit creep model provides predictions of the column failure time either within the ±10% error margin or on the safe-side of the plot. Only one out of nine conducted tests was predicted to fail on the unsafe side, outside the −10% error margin.
A slight discrepancy can be seen when modelling creep tests which take longer times to column failure. This discrepancy may be attributed to the more pronounced frictional effects which increase their importance during longer testing. Results presented in Figure 9b indicate that the implicit creep model proposed in Eurocode 3 provides good approximation of the column’s critical load at 400 °C and only partially at 500 °C. At 600 °C, it can be seen that the model predictions tend to give lower displacement in comparison to the −10% error margin, indicating a trend that the implicit creep model cannot fully approximate creep developing at that temperature level. This justifies the need to conduct explicit creep analysis for steel columns at temperatures higher than 500 °C, since the implicit creep model cannot provide the information on the failure time of a column. Furthermore, it is necessary to further explore the temperature region beyond 500 °C by analysing other steel grades to get a more reliable insight into the problem.
The comparisons presented in Figure 4 for column capacity tests indicate that the implicit creep model from Eurocode 3 provides conservative predictions of the buckling force in the case when larger vertical force is applied. However, for capacity tests where smaller amount of vertical force is applied, a minimal difference between the simulation results using EC3 stress–strain model with 2% yield strain and the EC3 model with 1% yield strain is observed. Simulations shown in Figure 4 were conducted using Equations (1)–(4) with a variation of yield strain which was taken as 1% and 2%. The reason for doing this is because the principal author’s previous research included an investigation of the implicit creep content of Eurocode 3 material model. The reason a yield strain of 1% is considered as relevant is because, with the change of this factor, the implicit creep content is generally eliminated from the Eurocode 3 material model [21].
Therefore, it using the explicit creep model for modelling the creep influence is required, then it is necessary to have a “creep-free” material model instead of the implicit creep model (which exists if 2% yield strain is used). Using the implicit creep model in combination with an explicit creep model effectively doubles the influence of creep on the numerical analysis. The procedure for implicit creep removal and the development of “creep-free” model is presented in reference [23].
4.2. The Influence of Load Ratio
Figure 7 shows that at 400 °C creep causes column failure up to a load ratio of about 87% of the column’s axial load capacity. As expected, at higher temperature levels, the threshold load ratio for failure due to creep is lower. At 500 °C, the lowest load ratio is 63% and, at 600 °C, it is 57%. It is seen that columns in the higher range of load levels are susceptible to the effects of creep, even at 400 °C. Furthermore, it is also seen from the results presented in Figure 7 and Table 2 that columns have very low short-term creep resistance within the entire temperature test-range of 400–600 °C for axial loads higher than approximately 90% of the column’s axial load capacity. Low short-term creep resistance above the mentioned load ratio might indicate a higher probability of failure due to creep for columns that are predominately loaded by compressive force. Comparing the load ratios in the creep tests, on the basis of strengths from the coupon test study [5] (0.7–0.9 f0.2,θ at 400 °C, 0.45–0.8 f0.2,θ at 500 °C and 0.25–0.75 f0.2,θ at 600 °C) with the load ratios in the column tests, it can be seen that these range correspond. This indicates that there is a correlation between the effects of the two load ratios in terms of the influence of creep at both the coupon and column level.
4.3. Failure Times of Columns
The results of the experimental study show that the failure time of a column generally occurs within the 4 h time interval which covers almost all practical fire resistance periods for structures. During any realistic fire exposure, it is highly improbable that a column will experience very prolonged exposure to constant temperature. However, exposure to constant temperature for shorter periods is not uncommon. This can occur in fire-protected steel members or in unprotected steel members after the onset of cooling phase. By analysing the test results (Table 2), the potential threat of column failure due to creep as a result of short-term constant temperature exposure can be expected to start at approximately 90% of the column’s axial load capacity within the temperature range of 400–600 °C, as pointed out in Section 4.2.
4.4. The Influence of Support Friction
The results presented in Table 3 indicate that the effect of friction becomes more pronounced with increase of temperature. This is evident in the results of both the capacity and creep tests. This pronounced effect can be explained by the inevitable loss of column stiffness at higher temperatures, which increases the amount of friction at the supports relative to the critical axial forces. This is also evident from the spring stiffness values applied in the numerical study. As previously mentioned in Section 2.1, the friction that is present during the capacity and creep tests was reduced by lubricating the pins and by inserting a thin steel plate between the sliding surfaces of the joints to increase their lubricated surface area.
4.5. Applied Material Models
A positive attribute of the numerical study presented is that all of the relevant material models were experimentally determined in a previous research study [5]. These studies included tests for yield strength, modulus of elasticity, stress-strain curves and creep characteristics within the temperature range 400–600 °C. The results of the numerical study presented in Figure 7 indicate that the previously developed creep model for grade S275JR is sufficiently accurate to model the structural effects caused by the columns’ creep behaviour within this temperature range. The data given here (the finite element mesh, segmentation size, force values and the mechanical response) are sufficient for modelling column behaviour in terms of the commonly published results—either midspan or axial displacement—which were directly measured in the tests. The material and creep models are also published in full in the cited references.
5. Conclusions
Within the presented study, 17 column tests were conducted. This includes measurement of displacements with several LVDTs and numerous thermocouples. The data for each of these tests are massive and the authors used the most representative results for presentation in this paper. These include either axial or vertical displacement of the column for each test, including the appropriate temperature fields. The whole creep-test procedure used in the research is summarized in a short film available at the project webpage [24]. The reference contains a presentation on the equipment and the column failure mode. From the results presented on the column testing and numerical studies performed, the following conclusions can be suggested:
- High-temperature creep can induce column failure at temperatures from 400 °C at high load levels (87% and above).
- The short-term creep resistance of S275JR columns can be considered as low at load levels above 90% of their axial load capacity within the temperature region 400–600 °C.
- The effect of support friction on the column response during creep tests cannot be neglected, and needs to be taken into account in numerical analysis.
- The previously developed analytical creep model used in the numerical study has proven sufficiently accurate to model creep behaviour in high-temperature column tests.
Author Contributions
Data curation, N.T. and V.D.; Investigation, N.T.; Methodology, N.T., I.B. and I.W.B.; Project administration, N.T. and I.B.; Software, N.T. and I.W.B.; Supervision, I.B.; Writing—original draft, N.T. and I.W.B.; and Writing—review and editing, N.T. and I.W.B.
Funding
This research is funded by Croatian Science Foundation.
Acknowledgments
This work was fully supported by Croatian Science Foundation under the project Influence of creep strain on the load capacity of steel and aluminium columns exposed to fire (UIP-2014-09-5711). Any opinions, findings, and conclusions or recommendations expressed in this material are those of the authors and do not necessarily reflect the views of Croatian Science Foundation.
Conflicts of Interest
The authors declare no conflict of interest.
Nomenclature
| fy,20 | yield strength at normal temperature |
| fy,θ | yield strength at temperature θ |
| f0.2,θ | stress at 0.2% strain at temperature θ |
| Ey,20 | modulus of elasticity at normal temperature |
| Ey,θ | modulus of elasticity at temperature θ |
| kE,θ | reduction factor for modulus of elasticity at temperature θ |
| ky,θ | reduction factor for yield strength at temperature θ |
References
- ASTM Standard E119-05: ASTM, Standard Methods of Fire Tests of Building Construction and Materials; American Society for Testing and Materials: West Conshohocken, PA, USA, 2005.
- ISO 834: Fire Resistance Tests—Elements of Building Construction; International Organization for Standardization: Geneva, Switzerland, 1975.
- EN 1993-1-2:2005: Eurocode 3—Design of Steel Structures—Part 1-2: General Rules—Structural Fire Design; European Committee for Standardization: Brussels, Belgium, 2005.
- Wainman, D.E.; Kirby, B.R. Compendium of UK Standard Fire Test Data: Unprotected Structural Steel—1; Report RS/RSC/S10328/1/87/B; British Steel Corporation: London, UK, 1988; p. 88. [Google Scholar]
- Torić, N.; Brnić, J.; Boko, I.; Brčić, M.; Burgess, I.W.; Uzelac Glavinić, I. Development of a high temperature material model for grade S275JR steel. J. Constr. Steel Res. 2017, 137, 161–168. [Google Scholar] [CrossRef]
- Torić, N.; Brnić, J.; Boko, I.; Brčić, M.; Burgess, I.W.; Uzelac Glavinić, I. Experimental analysis of the behaviour of aluminium alloy EN6082 AW T6 at high temperature. Metals 2017, 7, 126. [Google Scholar] [CrossRef]
- Boko, I.; Torić, N.; Peroš, B. Structural fire design parameters and procedures—Analysis of the potential of eurocode 3. Materialwiss. Werkstofftech. 2012, 43, 1036–1052. [Google Scholar] [CrossRef]
- Torić, N.; Harapin, A.; Boko, I. Experimental verification of a newly developed implicit creep model for steel structures exposed to fire. Eng. Struct. 2013, 57, 116–124. [Google Scholar] [CrossRef]
- Torić, N.; Harapin, A.; Boko, I. Modelling of the influence of creep strains on the fire response of stationary heated steel members. J. Struct. Fire Eng. 2015, 6, 155–176. [Google Scholar] [CrossRef]
- Kodur, V.K.R.; Dwaikat, M.M.S. Effect of high temperature creep on the fire response of restrained steel beams. Mater. Struct. 2010, 43, 1327–1341. [Google Scholar] [CrossRef]
- Li, G.-Q.; Guo, S.-X. Experiment on restrained steel beams subjected to heating and cooling. J. Constr. Steel Res. 2008, 64, 268–274. [Google Scholar] [CrossRef]
- Huang, Z.-F.; Tan, K.-H.; Ting, S.-K. Heating rate and boundary restraint effects on fire resistance of steel columns with creep. Eng. Struct. 2006, 28, 805–817. [Google Scholar] [CrossRef]
- Li, G.-Q.; Zhang, C. Creep effect on buckling of axially restrained steel columns in real fires. J. Constr. Steel Res. 2012, 71, 182–188. [Google Scholar] [CrossRef]
- Morovat, M.A.; Engelhardt, M.D.; Helwig, T.A.; Taleff, E.M. High-temperature creep buckling phenomenon of steel columns subjected to fire. J. Constr. Steel Res. 2014, 5, 189–202. [Google Scholar] [CrossRef]
- Tan, K.-H.; Toh, W.-S.; Huang, Z.-F.; Phng, G.-H. Structural responses of restrained steel columns at elevated temperatures part 1: Experiments. Eng. Struct. 2007, 29, 1641–1652. [Google Scholar] [CrossRef]
- Huang, Z.-F.; Tan, K.-H. Structural response of restrained steel columns at elevated temperatures part 2: FE simulation with focus on experimental secondary effects. Eng. Struct. 2007, 29, 2036–2047. [Google Scholar] [CrossRef]
- Moura Correia, A.J.P.; Rodrigues, J.P.C. Fire resistance of steel columns with restrained thermal elongation. Fire Saf. J. 2012, 50, 1–11. [Google Scholar] [CrossRef]
- Yang, K.-C.; Hsu, R. Structural behavior of centrally loaded steel columns at elevated temperature. J. Constr. Steel Res. 2009, 65, 2062–2068. [Google Scholar] [CrossRef]
- Li, G.-Q.; Wang, P.; Wang, Y. Behaviour and design of restrained steel column in fire, part1: Fire test. J. Constr. Steel Res. 2010, 66, 1138–1147. [Google Scholar] [CrossRef]
- Cai, J.; Burgess, I.W.; Plank, R.J. A generalised steel/reinforced concrete beam-column element model for fire conditions. Eng. Struct. 2003, 25, 817–833. [Google Scholar] [CrossRef]
- Torić, N.; Sun, R.R.; Burgess, I.W. Creep-free fire analysis of steel structures with Eurocode 3 material model. J. Struct. Fire Eng. 2016, 7, 234–248. [Google Scholar] [CrossRef] [Green Version]
- Anderberg, Y. Modelling steel behaviour. Fire Saf. J. 1988, 13, 17–26. [Google Scholar] [CrossRef] [Green Version]
- Torić, N.; Sun, R.-R.; Burgess, I.W. Development of a creep-free stress-strain law for fire analysis of steel structures. Fire Mater. 2016, 40, 896–912. [Google Scholar] [CrossRef] [Green Version]
- Influence of Creep Strain on the Load Capacity of Steel and Aluminium Columns Exposed to Fire. Croatian Science Foundation Installation Research Project UIP-2014-09-5711. Available online: https://metalcreepsite.wordpress.com/ (accessed on 10 October 2018).
Figure 1.
Test setup and the column specimen: (a) column specimen, HEB140; and (b) test equipment.
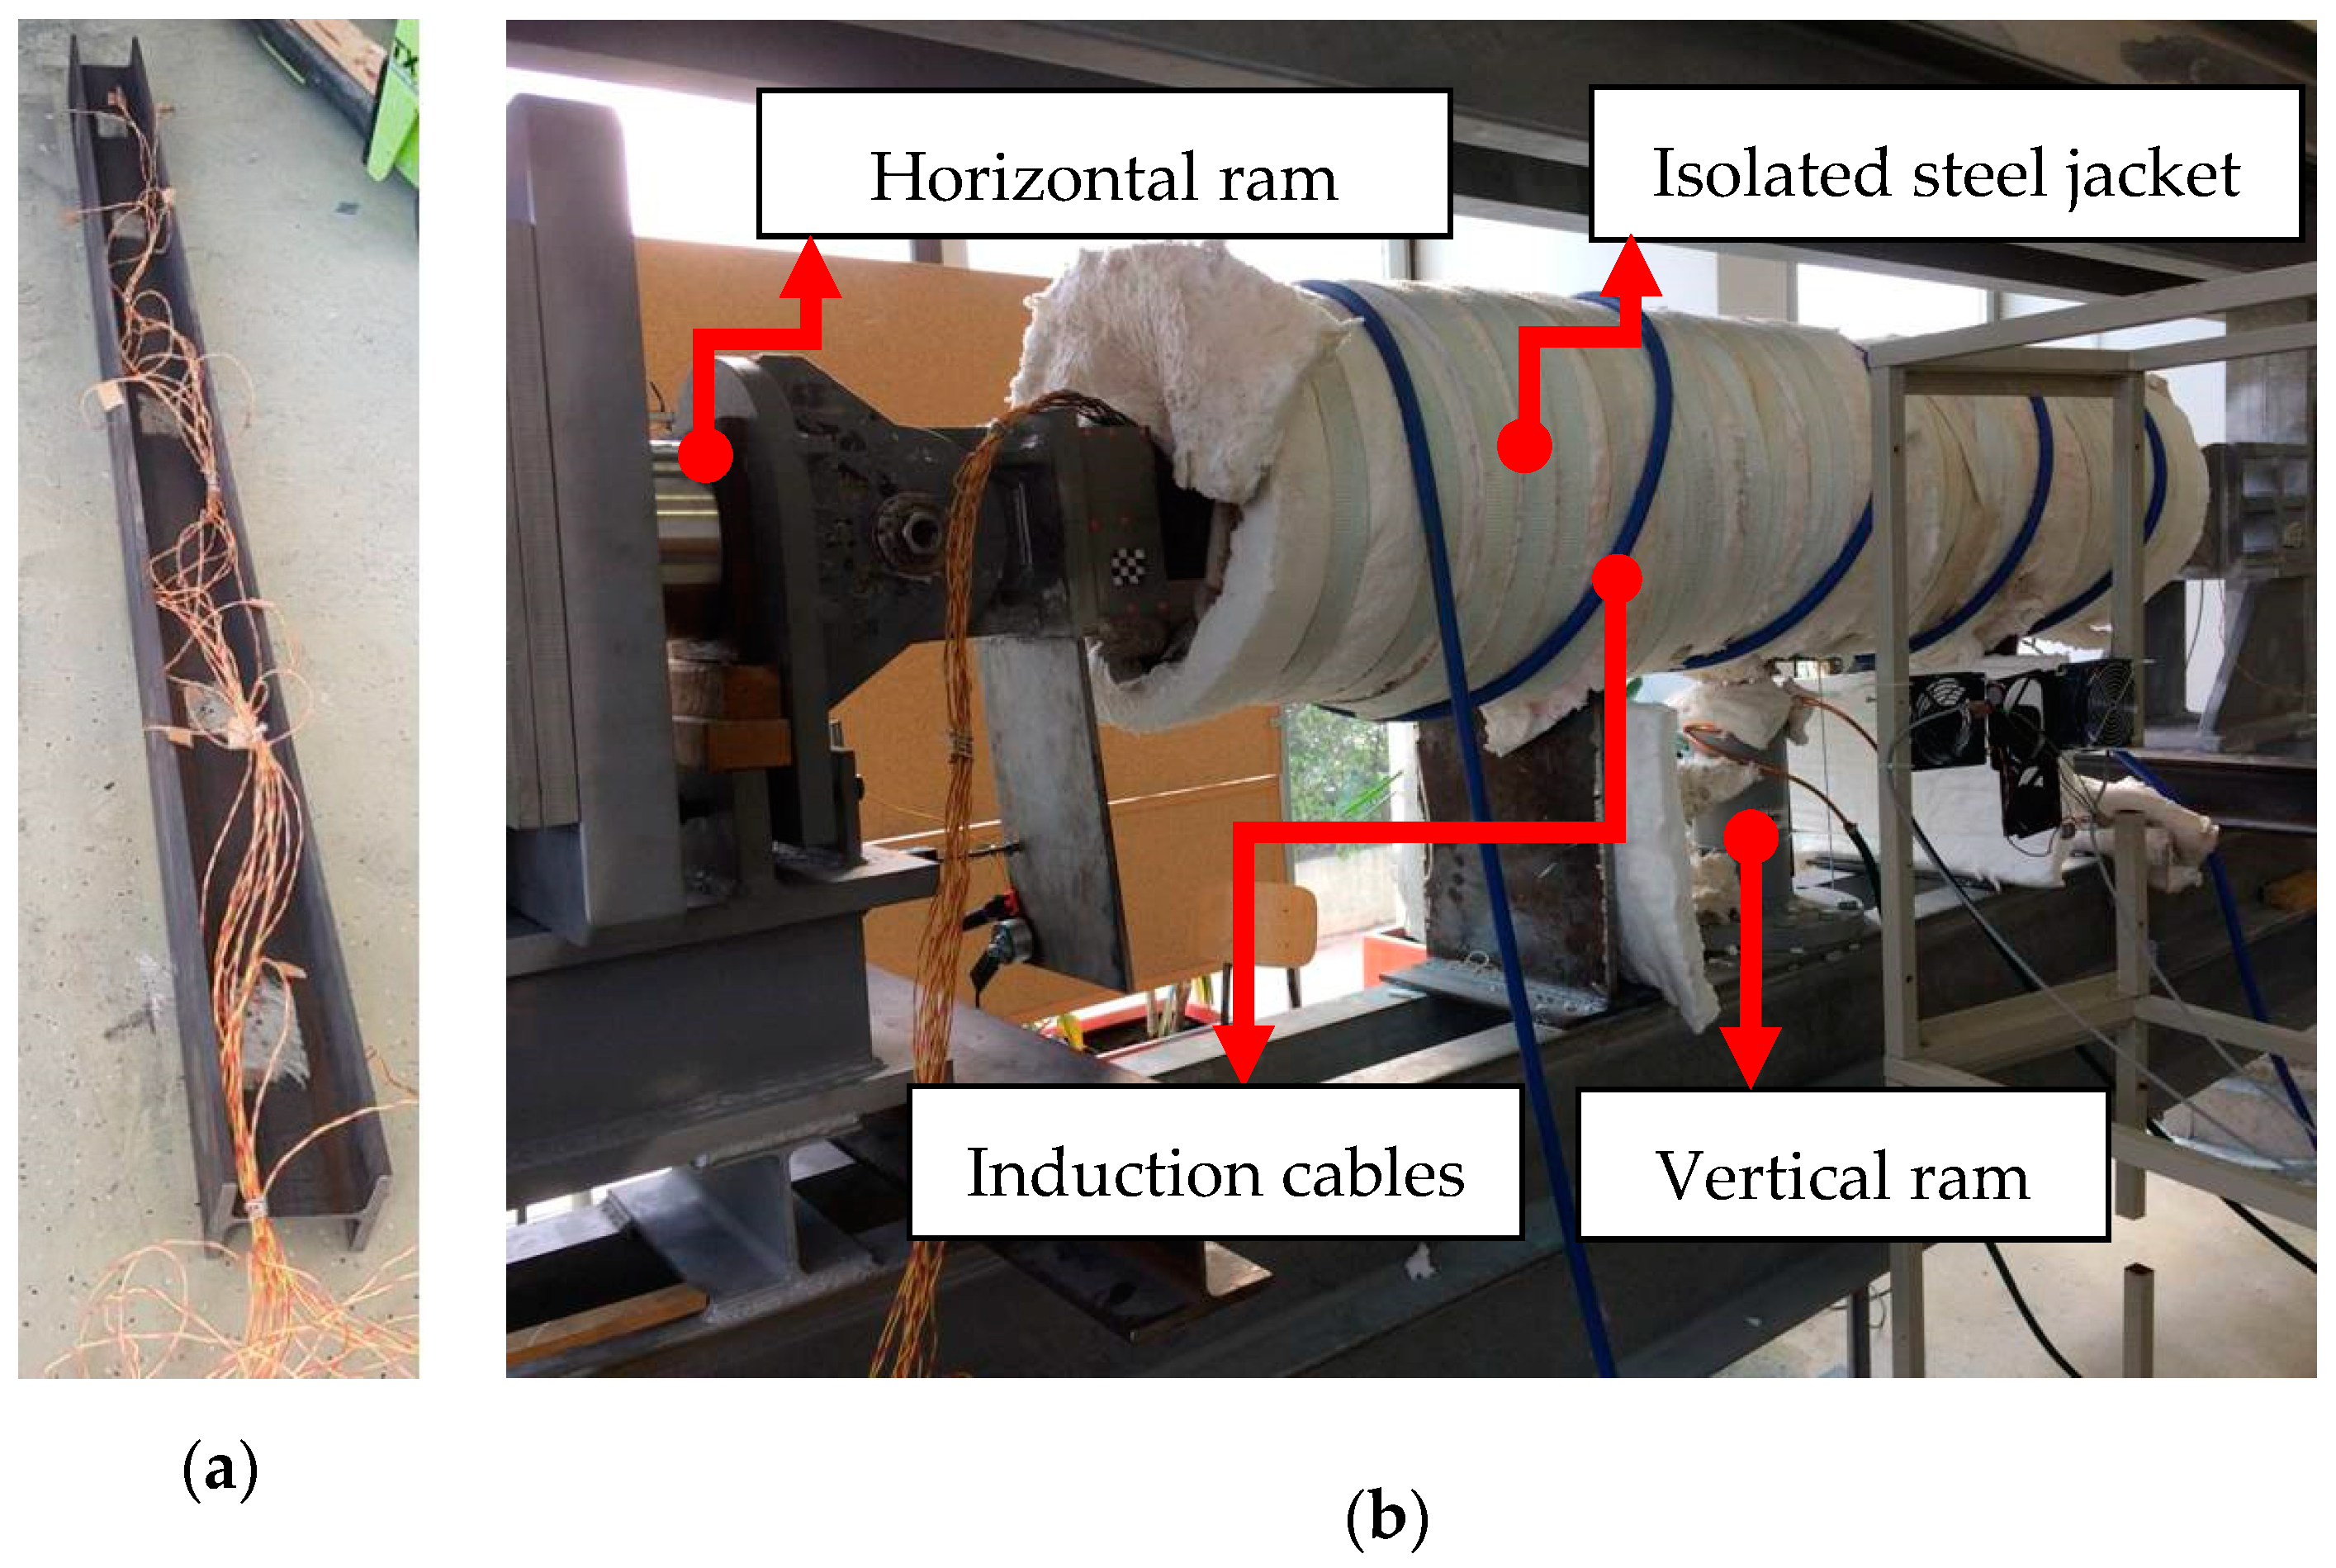
Figure 2.
(a) Test frame schematics (units in mm); (b) measuring point for temperature (units in mm).
Figure 2.
(a) Test frame schematics (units in mm); (b) measuring point for temperature (units in mm).

Figure 3.
Temperature measurements at various points on the column specimen at: (a) 400 °C; (b) 500 °C; and (c) 600 °C.
Figure 3.
Temperature measurements at various points on the column specimen at: (a) 400 °C; (b) 500 °C; and (c) 600 °C.


Figure 4.
Results of column capacity tests and comparison with the Vulcan model: (a) 400 °C; (b) 500 °C; and (c) 600 °C.
Figure 4.
Results of column capacity tests and comparison with the Vulcan model: (a) 400 °C; (b) 500 °C; and (c) 600 °C.

Figure 5.
Column model and the selected material models: (a) column model and FE mesh; (b) reduction factors for yield strength and modulus, grade S275JR [19]; and (c) stress–strain model, grade S275JR [19].


Figure 6.
Modelling results for the capacity tests at 20 °C.

Figure 7.
Results of creep tests and comparison with the Vulcan model: (a) 400 °C; (b) 500 °C; and (c) 600 °C.
Figure 7.
Results of creep tests and comparison with the Vulcan model: (a) 400 °C; (b) 500 °C; and (c) 600 °C.


Figure 8.
Post-test column specimens.

Figure 9.
Accuracy of the numerical study: (a) capacity tests: comparison with creep-free EC3 model analysis; (b) creep tests: comparison with EC3 “implicit creep” model analysis; and (c) creep tests: comparison with explicit creep model analysis.
Figure 9.
Accuracy of the numerical study: (a) capacity tests: comparison with creep-free EC3 model analysis; (b) creep tests: comparison with EC3 “implicit creep” model analysis; and (c) creep tests: comparison with explicit creep model analysis.


Table 1.
Summary of test results for column capacity tests.
| Testing Method | Steady-State | |||||
|---|---|---|---|---|---|---|
| Load Type | Bending + Axial Compression | |||||
| Target Temperature (°C) | 20 | 400 | 500 | 600 | ||
| Max. force (kN) | Test 1 | Axial | 478.0 | 560.0 | 530.0 | 376.0 |
| Mean vert. | 46.0 | 37.0 | 30.0 | 16.0 | ||
| Dev.int. | ±0.5 | ±0.8 | ±1.0 | ±0.6 | ||
| Test 2 | Axial | 505.0 | - | 409.0 | 226.0 | |
| Mean vert. | 46.0 | - | 46.0 | 24.0 | ||
| Dev.int. | ±0.7 | - | ±0.6 | ±0.8 | ||
| Test 3 | Axial | 878.0 | - | - | - | |
| Mean vert. | 50.0 | - | - | - | ||
| Dev.int. | ±0.8 | - | - | - | ||
Table 2.
Summary of test results for column creep tests.
| Testing Method | Steady-State | ||||
|---|---|---|---|---|---|
| Load Type | Bending + Axial Compression | ||||
| Target Temperature (°C) | 400 | 500 | 600 | ||
| Max. force (kN) | Test 1 | H (mean/dev.) | 488.0/±7.5 | 335.0/±9.7 | 214.0/±8.1 |
| V (mean/dev.) | 37.0/±0.4 | 30.0/±0.5 | 16.0/±0.6 | ||
| Load ratio (%) | 87 | 63 | 57 | ||
| Failure time (min) | 37.8 | 233.4 | 212.2 | ||
| Model pred. (min) | 32.1 | 187.1 | 243.1 | ||
| Test 2 | H (mean/dev.) | 518.0/±11.3 | 450.0/±8.7 | 274.0/±9.2 | |
| V (mean/dev.) | 37.0/±0.3 | 30.0/±0.9 | 16.0/±0.7 | ||
| Load ratio (%) | 93 | 85 | 73 | ||
| Failure time (min) | 7.5 | 95.8 | 159.9 | ||
| Model pred. (min) | 6.6 | 86.1 | 136.2 | ||
| Test 3 | H (mean/dev.) | 535.0/±4.5 | 486.0/±7.1 | 305.0/±8.8 | |
| V (mean/dev.) | 37.0/±1.2 | 30.0/±0.9 | 16.0/±0.6 | ||
| Load ratio (%) | 96 | 92 | 81 | ||
| Failure time (min) | 6.1 | 5.7 | 25.6 | ||
| Model pred. (min) | 6.0 | 3.5 | 27.1 | ||
Table 3.
Comparison between the test results of capacity tests with the numerical model.
| Test Results/Vulcan Analysis | |||||
|---|---|---|---|---|---|
| Temperature (°C) | 20 | 400 | 500 | 600 | |
| Test 1 | Axial Resistance (kN) | 478.0/495.0 | 560.0/560.0 | 530.0/470.0 | 370.0/310.0 |
| Spring stiffness (Nmm/rad) | 4.00E + 06 | 7.50E + 07 | 1.00E + 10 | 1.00E + 10 | |
| Test 2 | Axial Resistance (kN) | 505.0/495.0 | - | 409.0/370.0 | 226.0/205.0 |
| Spring stiffness (Nmm/rad) | 4.00E + 06 | - | 1.00E + 10 | 1.00E + 10 | |
| Test 3 | Axial Resistance (kN) | 878.0/800.0 | - | - | - |
| Spring stiffness (Nmm/rad) | 1.00E + 10 | - | - | - | |
Table 4.
Reduction factors for yield strength and modulus of elasticity.
| Temperature (°C) | Reduction Factors | |
|---|---|---|
| fy,θ/fy,20 − 1% | Ey,θ/Ey,20 | |
| 100 | 1.0 | 1.0 |
| 200 | 1.0 | 0.94 |
| 300 | 1.0 | 0.84 |
| 400 | 0.98 | 0.81 |
| 500 | 0.69 | 0.70 |
| 600 | 0.36 | 0.64 |
© 2018 by the authors. Licensee MDPI, Basel, Switzerland. This article is an open access article distributed under the terms and conditions of the Creative Commons Attribution (CC BY) license (http://creativecommons.org/licenses/by/4.0/).
Share and Cite
MDPI and ACS Style
Torić, N.; Boko, I.; Divić, V.; Burgess, I.W. Behaviour of Steel Grade S275JR Columns under the Influence of High-Temperature Creep. Metals 2018, 8, 874. https://doi.org/10.3390/met8110874
AMA Style
Torić N, Boko I, Divić V, Burgess IW. Behaviour of Steel Grade S275JR Columns under the Influence of High-Temperature Creep. Metals. 2018; 8(11):874. https://doi.org/10.3390/met8110874
Chicago/Turabian StyleTorić, Neno, Ivica Boko, Vladimir Divić, and Ian W. Burgess. 2018. "Behaviour of Steel Grade S275JR Columns under the Influence of High-Temperature Creep" Metals 8, no. 11: 874. https://doi.org/10.3390/met8110874
Note that from the first issue of 2016, this journal uses article numbers instead of page numbers. See further details here.