Finite Element Simulation of High-Speed Blow Forming of an Automotive Component


1
Department of Mechanical Engineering, École de technologie supérieure (ETS), Montreal, QC, H3C 1K3, Canada
2
Verbom Inc., 5066 Route 222, C. P. 3240, Valcourt, QC, J0E 2L0, Canada
*
Authors to whom correspondence should be addressed.
Metals 2018, 8(11), 901; https://doi.org/10.3390/met8110901
Submission received: 17 October 2018
/
Revised: 30 October 2018
/
Accepted: 1 November 2018
/
Published: 3 November 2018
(This article belongs to the Special Issue Superplasticity and Superplastic Forming)
Abstract
:High-speed blow forming (HSBF) is a new technology for producing components with complex geometries made of high strength aluminum alloy sheets. HSBF is considered a hybrid-superplastic forming method, which combines crash forming and gas blow forming. Due to its novelty, optimization of the deformation process parameters is essential. In this study, using the finite element (FE) code ABAQUS, thinning of an aluminum component produced by HSBF under different strain rates was investigated. The impact of element size, variation of friction coefficient, and material constitutive model on thinning predictions were determined and quantified. The performance of the FE simulations was validated through forming of industrial size parts with a complex geometry for the three investigated strain rates. The results indicated that the predictions are sensitive to the element size and the coefficient of friction. Remarkably, compared to a conventional power law model, the variable m-value viscoplastic (VmV) model could precisely predict the thickness variation of the industrial size component.
1. Introduction
Superplastic forming (SPF) has been successfully applied for manufacturing complex geometry components in the aerospace and automotive sectors [1,2,3]. SPF is commonly identified by extreme elongation of materials under low strain rate (<0.001 s−1) and elevated temperatures (>0.5 melting point) [4]. In this method, usually, fine grain sheet metal is gradually pushed toward a single die to form the final shape by applying a gas pressure. However, SPF suffers from low production rates which is a constraint for the application of this technology to the automotive industry. In recent years, extensive efforts have been devoted to developing alternative techniques where higher strain rates, and hence higher production rates, could be employed. Quick superplastic forming (QPF) [5] and hybrid SPF [6,7], i.e., a combination of mechanical deformation and SPF, are two examples of rapid superplastic forming technics. QPF has been applied for the manufacturing of automotive components made of aluminum alloys at strain rates up to 0.1 s−1 [8]. Similarities and differences between SPF and QPF have been discussed in the literature [9]. The main difference between the two processes is attributed to the governing deformation mechanisms, i.e., grain boundary sliding (GBS), solute drag creep (SDC), and dislocation creep (DC). These mechanisms are usually differentiated by the range of strain rate sensitivities (i.e., m-value). For instance, for Al-Mg alloys m is about 0.5 and 0.3 for GBS and SDC, respectively, corresponding to SPF and QPF conditions [9].
The high-speed blow forming (HSBF) process [10] is also a recently introduced hybrid SPF process that can allow increasing the rate of forming up to 30 times compared with conventional SPF [11]. As shown in Figure 1, the HSBF process is generally performed in four steps. First, sheet metal is placed on a lower die to reach the target temperature. Next, the upper die moves down to crash form and then clamp the blank. Finally, gas blow forming is carried out.
As discussed by Sorgente et al. [12], finite element (FE) simulations have been mainly used in SPF applications for process-optimization purposes. The main objective is usually to control the process parameters (e.g., gas pressure) in order to avoid excessive thinning of the deformed parts. However, most of the pressure-time profile schemes for gas bulge forming of Al-Mg alloys have been developed for laboratory-scale simple geometry (hemispheric) parts [13,14,15]. This could not fit the QPF/HSBF requirements in practice since the geometry of the real parts is commonly complex and consequently the strain rate non-uniformly varies within a part.
In addition, a robust FE simulation tool needs an accurate material constitutive model as well as boundary conditions (e.g., friction coefficient). Due to its simplicity, power law constitutive equations have been frequently used for FE simulation of the SPF/QPF process (for example see [16]). However, the power law might not precisely predict the hardening, softening, and damage behavior of superplastic materials. Thus, more advanced visco-plastic constitutive models (e.g., [17,18]) are essential to capture flow and damage behaviors of superplastic metals over a wide range of strain rates. Although some of these models describe the deformation mechanisms of the material during SPF/QPF process, they usually require a tedious experimentation procedure for identifying their parameters. Few reports are available on their application to actual industrial size components. For example, the microstructure-based overstress model [17] is commonly reported for simple geometries and small size components in laboratory scales. In addition, the strain rate sensitivity of the superplastic metals has been usually considered by a constant number, m-value, in the models. However, it is well-accepted that m-value is not constant and varies with strain rate and plastic strain [19,20].
Recently, a new visco-plastic constitutive model based on variable m-value (named hereafter VmV model) has been introduced by the authors [18]. The main elements of the VmV model are expressed as:
where σ and εp are equivalent stress and plastic strain, respectively. fa represents the evolution of the damage (i.e., cavities) by plastic deformation and is a function of cavitation parameters (f0 and φ). Here, f0 denotes the initial volume fraction of the cavities and φ represents the rate of cavity growth. In this model, g(εp) and h(εp) are strain functions defined by six constants (i.e., g1, g2, h1, h2, h3, and h4). m0 and m1 are the model’s constants.
The VmV model’s constants could be determined from three stress-strain curves at different strain rates. Moreover, in this model the effective stress is, explicitly, described by plastic strain and strain rate [18], which facilitates the implementation of the VmV model in FE codes. Thus, this model could be potentially attractive for modelling the SPF/HSBF parts in industrial scales. Yet, the performance of the model for predicting formability of real parts has not been investigated. In the present study, the VmV model will be applied to simulate the HSBF process of a large size component with complex geometry. On the basis of simulation results, a series of parts were produced and examined for validation purposes.
2. FE Simulation Procedure
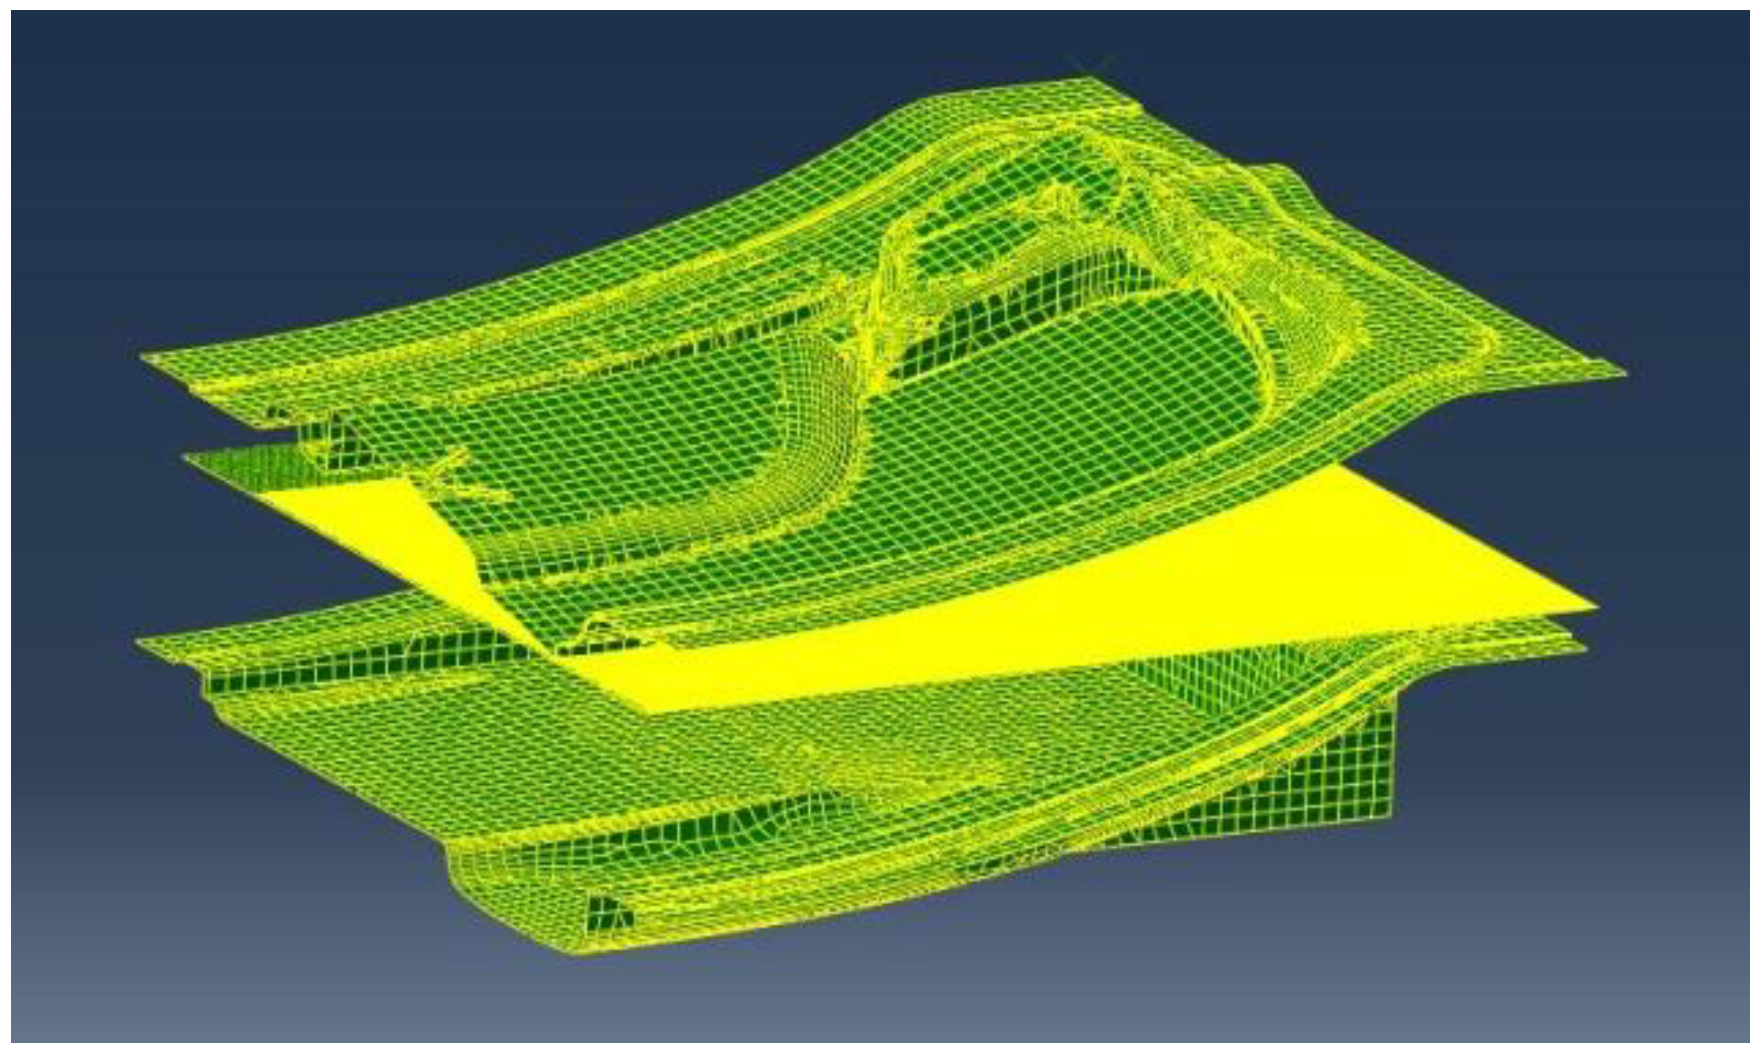
Commercial FE software, AbaqusTMversion 6.13-1 (Dassault Systèmes Simulia Corp., Providence, RI, USA), was used with the explicit method for simulating the HSBF process of an automotive body component. Due to the complex geometry, 3D CAD models of the upper and lower dies were first discretized using Altair HyperMesh™ and then imported into the AbaqusTM solver. Because of symmetry, only half of the blank was modeled to save calculation time and it was meshed using S4R elements (see Figure 2). Initially, four different element sizes, 2.25 × 2.5 mm2, 1.5 × 1.5 mm2, 1.0 × 1.0 mm2, and 0.5 × 0.5 mm2, were considered.
The FE model was defined in two steps, i.e., crash forming and blow forming, corresponding to the HSBF process. In the first step, the blank was placed on the lower die and then the upper die was moved down with a velocity of 2.9 mm/s to pre-form the blank. In the next step, a gas pressure was applied on the surface of the blank to obtain the final shape. As shown in Figure 3, three gas pressure profiles were considered in this study. While the maximum gas pressure is identical for the three curves, the forming times (i.e., strain rates) are different.
The variable m-value visco-plastic (VmV) model described above was used as the material constitutive model in FE simulations. The model parameters for the studied material, summarized in Table 1, were identified from a set of uniaxial tensile tests [21]. An isothermal condition was assumed in the FE simulation corresponding to the experimental setup. The constitutive model was implemented as a user hardening subroutine (VUHARD) in AbaqusTM.
The impact of friction coefficient was taken into account via surface-based contact properties in ABAQUS. A penalty method was used with a constant friction coefficient through the entire tools/blank surfaces. Five sets of simulations were carried out for each test condition (gas pressure profile) in which five different friction coefficient values, ranging from 0.1 to 0.3, were assigned in the models.
3. Experiments
In order to validate the FE simulation results, the HSBF of an automotive component was performed using a hydraulic press at Verbom Inc. (see Figure 4). Al-Mg alloy sheets with initial dimensions of 2000 × 1600 × 1.1 mm3 were used in the experiments. To minimize the friction between the tools and the part, the surfaces of the blanks were lubricated before each test.
The heating elements located in the lower and upper dies could provide sufficient power for heating up the tools. The temperature was kept constant in the range of 440 to 460 °C in this study, the heating process was controlled by a controller system, and the temperature of the tools was monitored using several thermocouples located near the surface of the upper and lower dies.
The tests were repeated three times corresponding to the 3 gas pressure profiles (see Figure 2). After the tests, the deformed parts were removed from the press to analyze thickness variation near the critical zones, as shown in Figure 5. To this end, 8 points were selected (see Figure 5) for measuring the thickness.
4. Results and Discussion
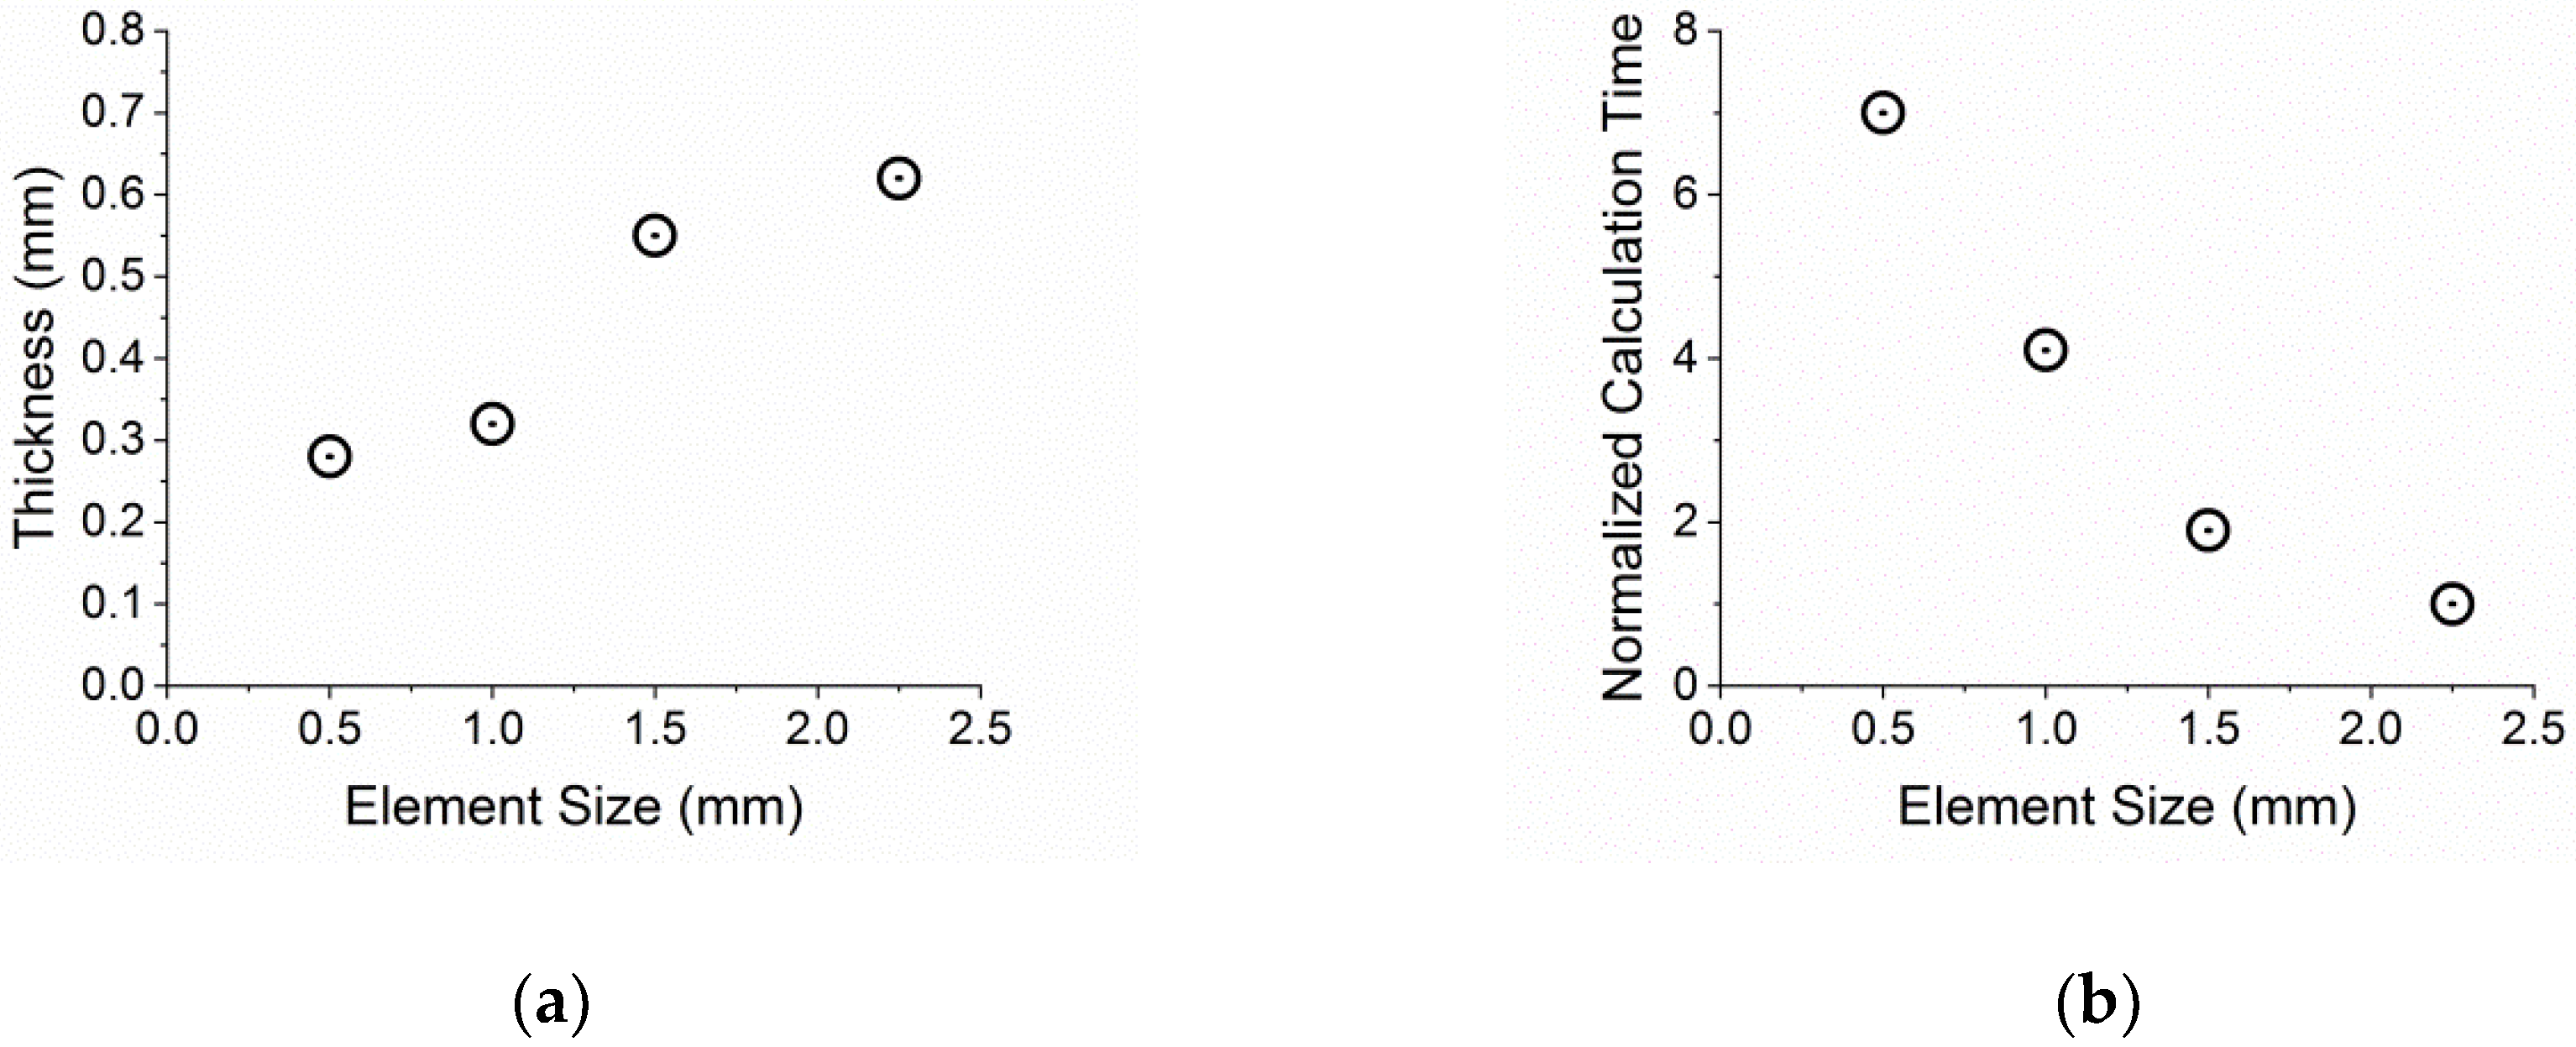
In Figure 6 the dependency of numerical simulation results on element size and the normalized calculation time are presented. The element size significantly affects the amount of thinning where about 55% difference between the predicted thicknesses is observed for the coarsest and finest meshes. Nevertheless, as shown in Figure 6b, by reducing the element size, the calculation time increased noticeably. In order to save calculation costs and, yet, have a reliable thickness prediction, the subsequent FE simulations were carried out with an element size of 1 × 1 mm2.
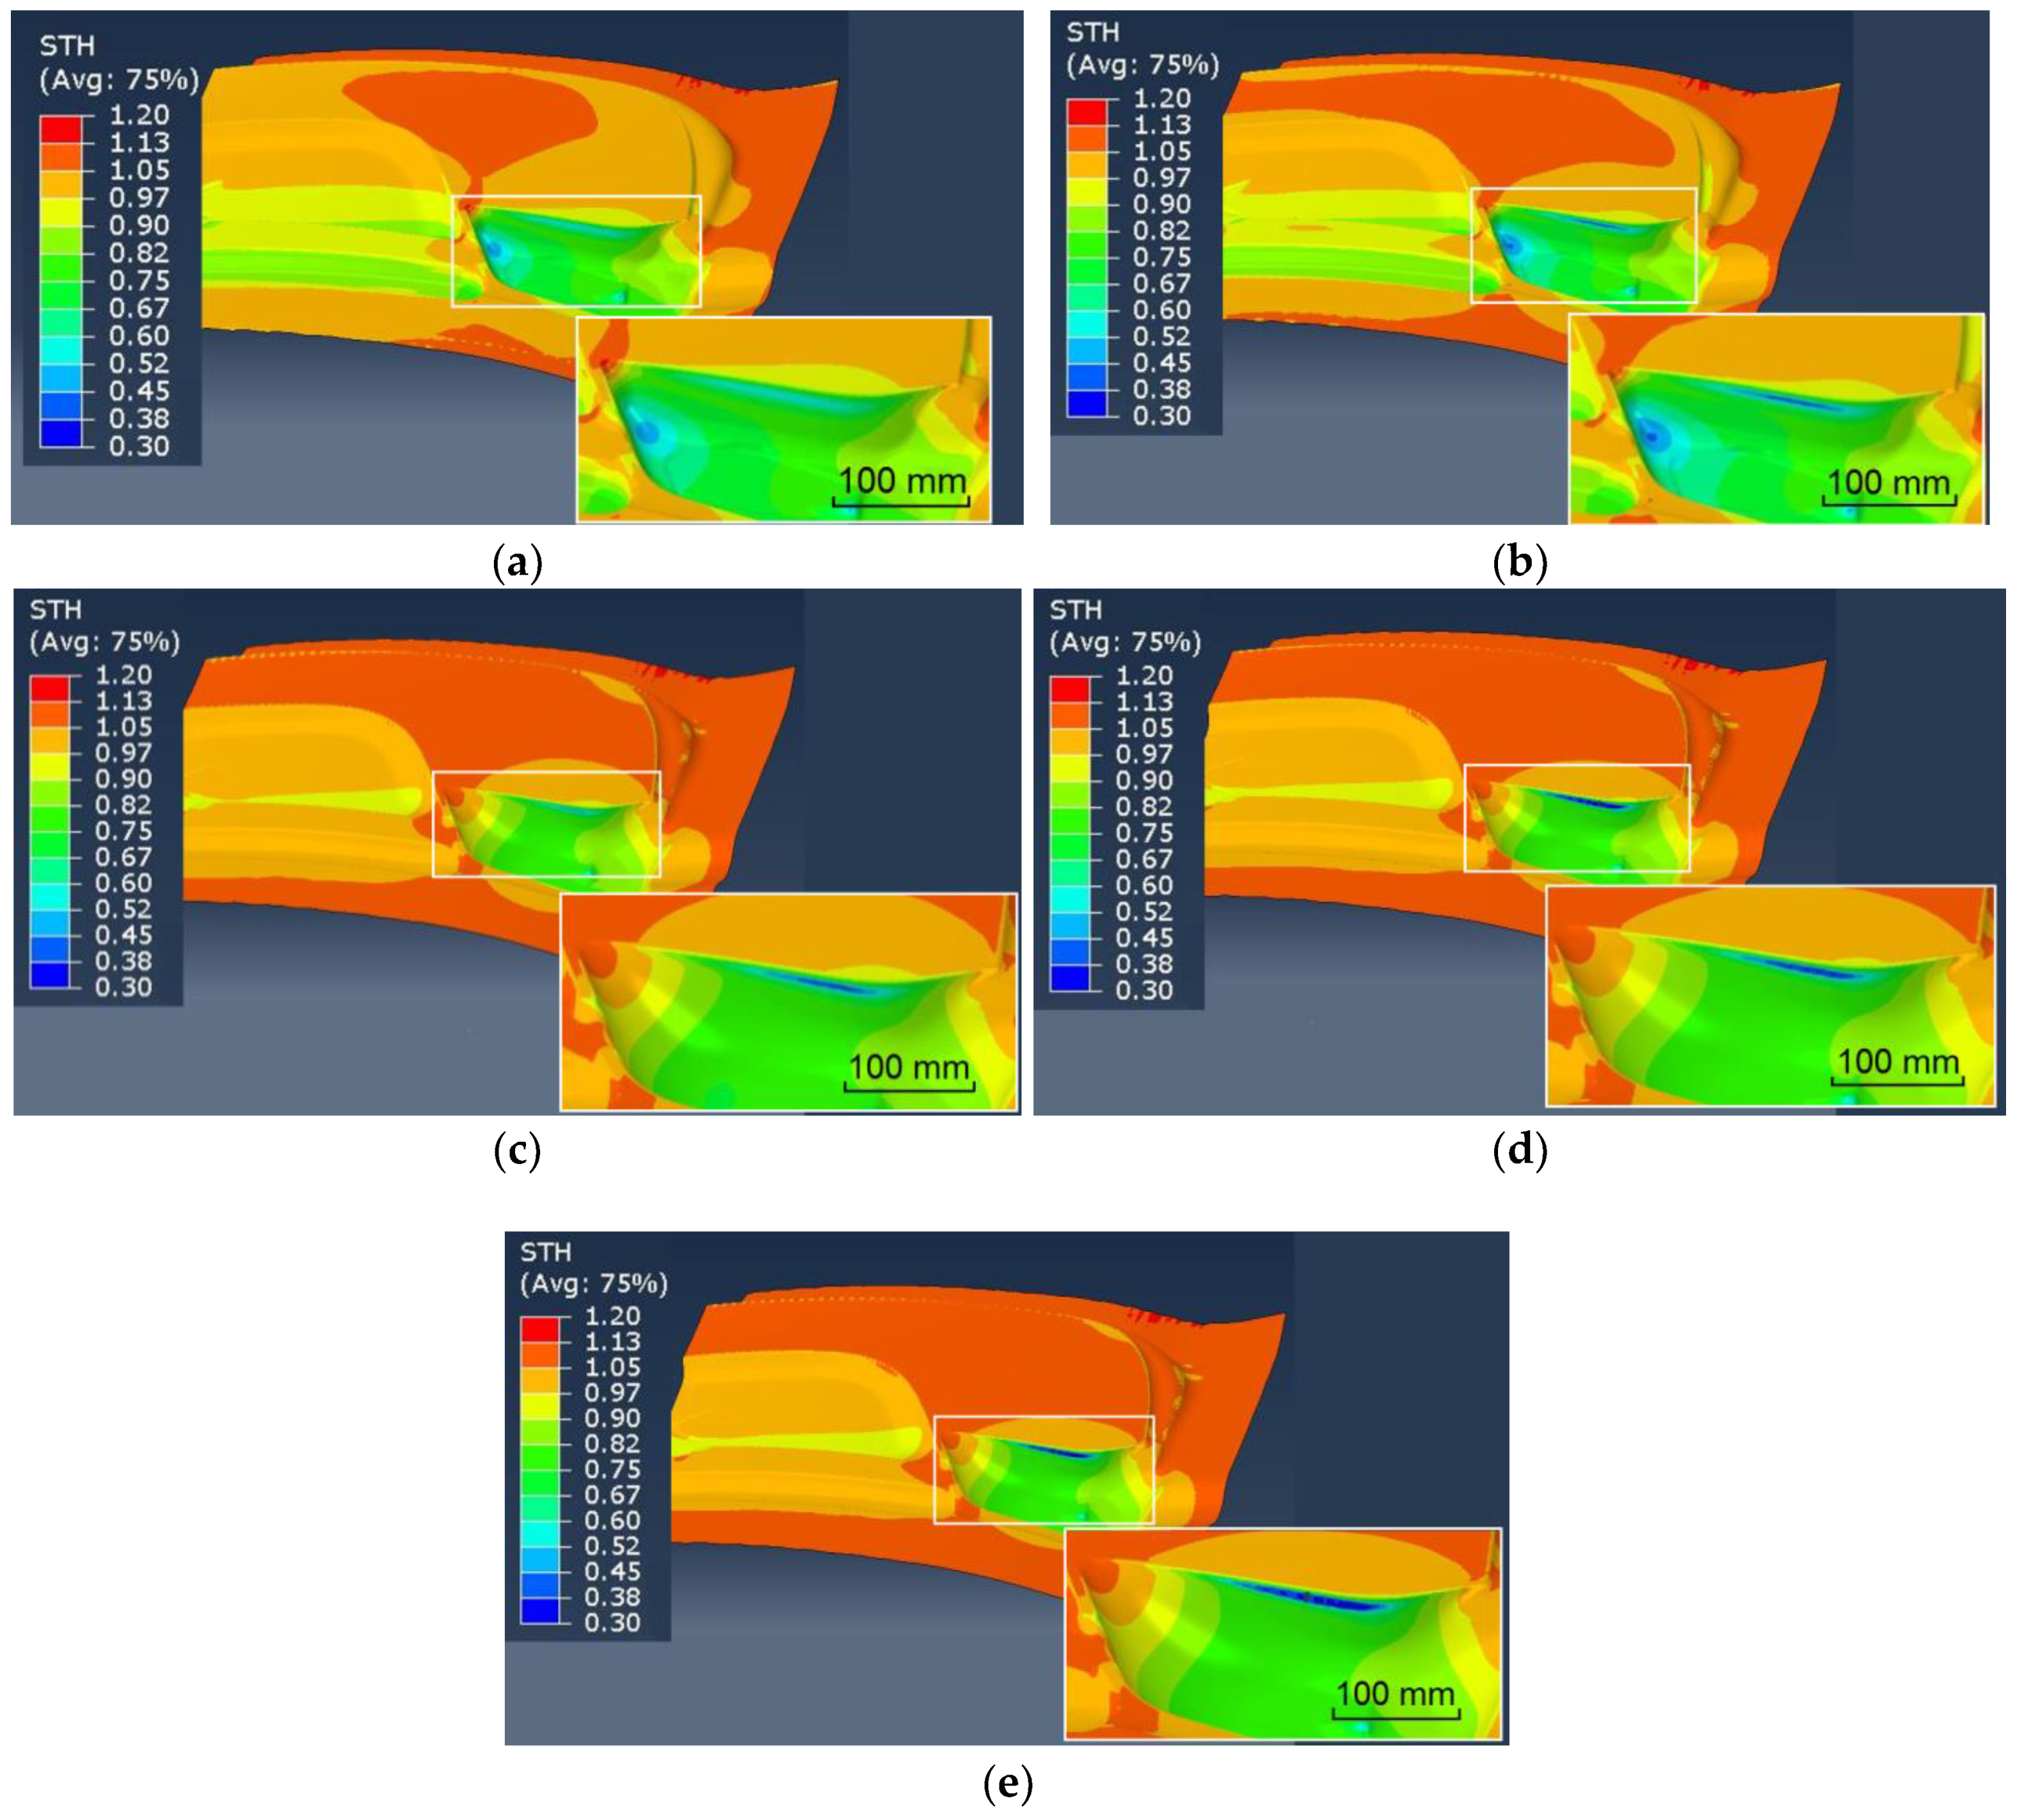
Figure 7, Figure 8 and Figure 9 show variation of thickness with increasing friction coefficient for different gas pressure profiles (i.e., forming time). It could be observed from these figures that the friction coefficient has a significant impact on thickness variation. For all the three gas pressure profiles, increasing friction coefficient from 0.1 to 0.3 increases the thinning of the part in the critical area. However, when the friction coefficient is above 0.2, the thickness variations within the critical region are almost identical for simulation results corresponding to friction coefficient of 0.25 and 0.3, indicating that in this range the impact of friction coefficient on the thinning is minimal.
Moreover, at the same friction coefficient level (for instance, Figure 7e, Figure 8e, and Figure 9e) it could be noticed that thinning becomes more severe when the blow forming period is shorter. This result could be attributed to the effect of strain rate as shown in Figure 10a–c. In this figure, in the same forming frame, the highest strain rate is observed when the blow forming period decreases from 120 s to 80 s. In particular, as shown in Figure 10d, for a selected element located in the critical zone, the plastic strain rate fluctuates during the blow forming period. For the gas pressure profiles #2 and #3, the strain rate reaches maximum values of 0.07 s−1 and 0.04 s−1, respectively. In contrast, for profile #1, where the blow forming time is the shortest, the strain rate reaches up to 0.5 s−1.
The thickness data corresponding to the eight measuring points (#1 to #8 in Figure 5) were analyzed and results are presented in Figure 11. A good agreement between simulation predictions and experimental data could be observed, in particular when the friction coefficient is over 0.2. It is worth mentioning that, among the three deformed parts, a split was only observed in the critical region of the part deformed with the shortest cycle (gas profile #1).
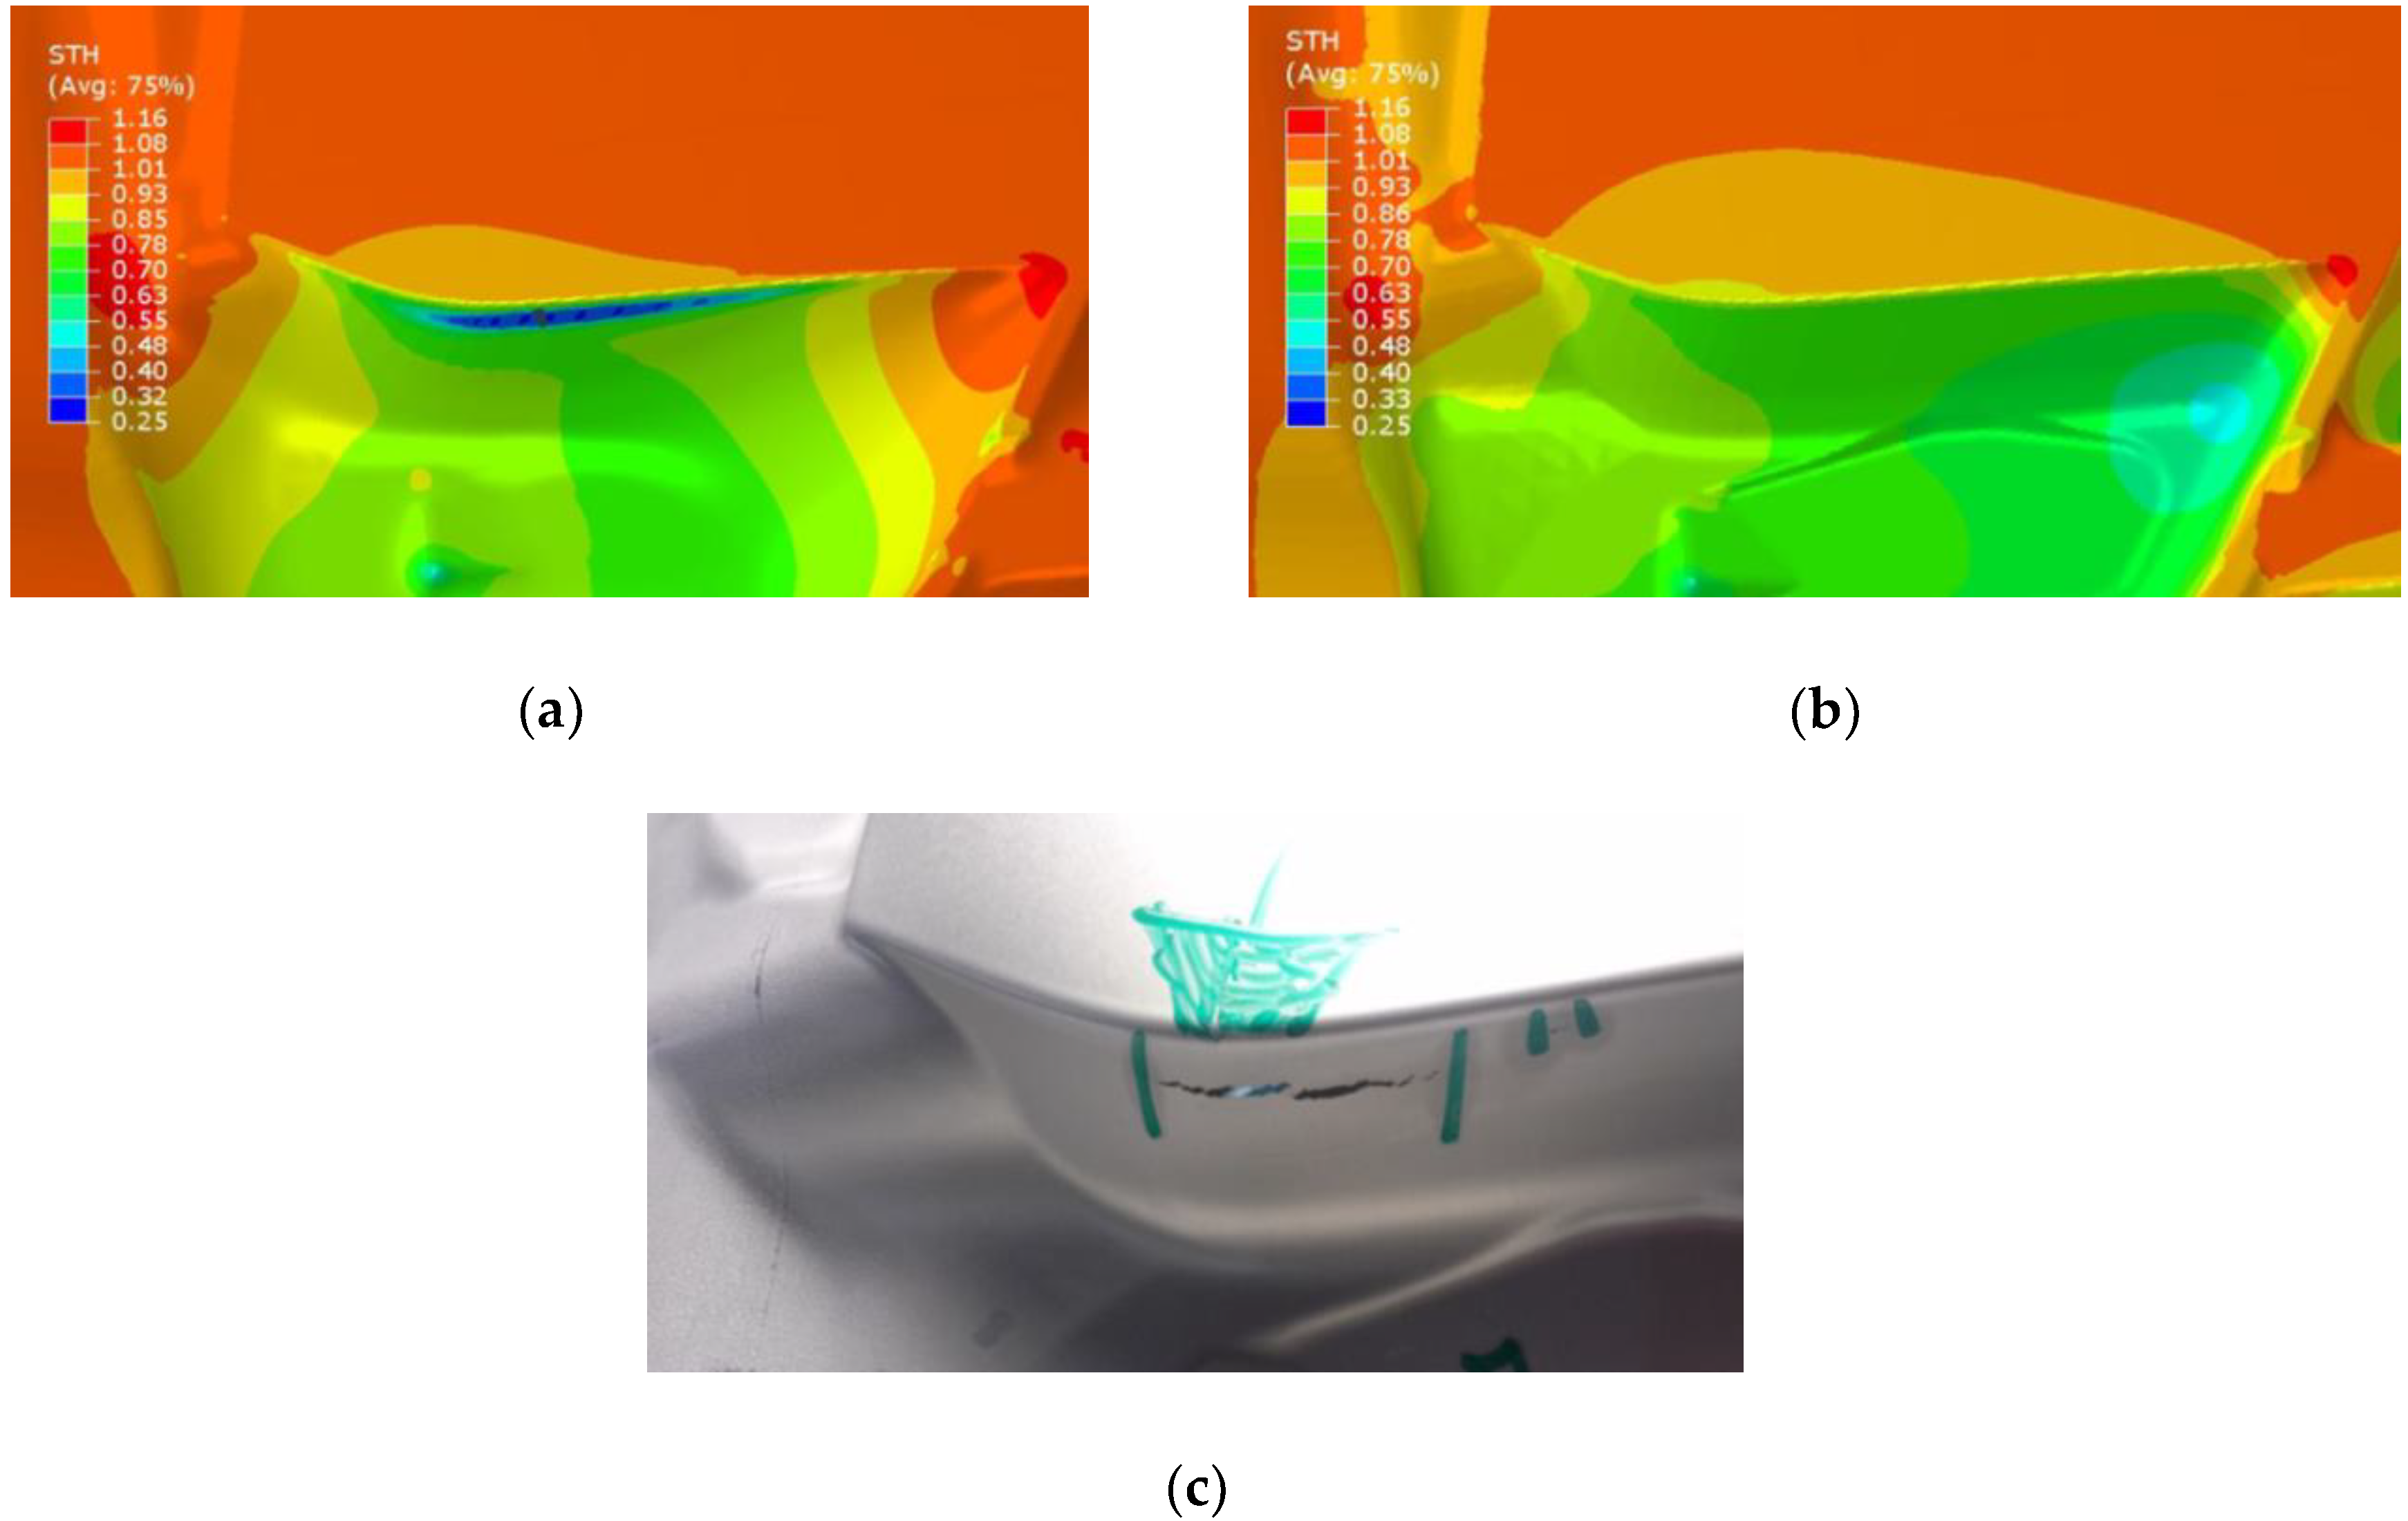
In order to justify the effectiveness of the VmV model in predicting the thinning of the part, in a new set of simulations, a power law (Equation (5)) was considered as the material constitutive model. In this case, gas profile #1 (forming period of 80 s) was considered and the remaining simulation parameters (e.g., element size and friction coefficient) were kept consistent with the former simulations. The power law constants (i.e., n, m, and K) were identified from a previous report [21] and are equal to 0.07, 0.42, and 179.2, respectively.
In Figure 12 the observed crack is compared with the two FE simulation predictions. It is clear that the material model has a major impact on the predictions. The thinning is underestimated when the power law was considered in the simulation while the VmV model gives a more realistic prediction. In this figure, the main features of the crack, i.e., location and size, as observed in the experiments, were well-predicted only when the VmV model was considered as the material constitutive model.
5. Conclusions
High-speed blow forming of an AA5083 component at 450 °C was simulated with three different pressure profiles, representing various strain rates. The VmV material constitutive model was implemented in the commercial FE code ABAQUS. The following conclusions can be drawn from the present study:
- (1)
- Good agreement was obtained between the numerical simulations using a variable m-value model and the experimental results.
- (2)
- An excessive thinning and fracture occurred when the forming cycle time was reduced from 120 s to 80 s, which was predicted by the VmV model but not by the power law.
- (3)
- It was shown that both the element size and friction coefficient had significant impacts on the predictions of the thinning. By reducing the element size, the thinning increases while the calculation cost also increases drastically. By increasing the friction coefficient, the amount of thinning was increased, significantly. The best agreement between the experimental observations and the FE simulation predictions was achieved when the friction coefficient was over 0.2.
Author Contributions
Conceptualization, O.M., M.J. and N.B.; Methodology, O.M.; Software, O.M.; Validation, O.M., M.J. and N.B.; Formal Analysis, O.M.; Investigation, O.M., M.J. and N.B; Resources, M.J. and N.B; Data Curation, O.M. and M.J.; Writing—Original Draft Preparation, O.M.; Writing—Review and Editing, O.M., M.J. and N.B.; Visualization, O.M.; Supervision, M.J.; Project Administration, M.J. and N.B.; Funding Acquisition, M.J. and N.B.
Funding
This research was funded by the Natural Sciences and Engineering Research Council of Canada (NSERC), grant number 487153.
Acknowledgments
The financial support by Natural Sciences and Engineering Research Council of Canada (NSERC) and the support from Innovation en Énergie Électrique (INOVÉE) and Aluminium Association of Canada (AAC) are acknowledged by the authors.
Conflicts of Interest
The funders had no role in the design of the study; in the collection, analyses, or interpretation of data; in the writing of the manuscript, or in the decision to publish the results.
References
- Hefti, L.D. Commercial airplane applications of superplastically formed AA5083 aluminum sheet. J. Mater. Eng. Perf. 2007, 16, 136–141. [Google Scholar] [CrossRef]
- Barnes, A.J. Industrial applications of superplastic forming: trends and prospects. Mater. Sci. Forum 2001, 357, 3–16. [Google Scholar] [CrossRef]
- Friedman, P.A.; Luckey, S.G. On the expanded usage of superplastic forming of aluminium sheet for automotive applications. Mater. Sci. Forum 2004, 447, 199–204. [Google Scholar] [CrossRef]
- Sherby, O.D.; Wadsworth, J. Superplasticity—recent advances and future directions. Prog. Mater. Sci. 1989, 33, 169–221. [Google Scholar] [CrossRef]
- Krajewski, P.E.; Schroth, J.G. Overview of quick plastic forming technology. Mater. Sci. Forum 2007, 551, 3–12. [Google Scholar] [CrossRef]
- Liu, J.; Tan, M.J.; Jarfors, A.E.; Fong, K.S.; Castagne, S. Superplastic-like forming of non-superplastic AA5083 combined with mechanical pre-forming. Int. J. Adv. Manuf Technol. 2011, 52, 123–129. [Google Scholar] [CrossRef]
- Luo, Y.; Luckey, S.G.; Friedman, P.A.; Peng, Y. Development of an advanced superplastic forming process utilizing a mechanical pre-forming operation. Int. J. Mach. Tools Manuf. 2008, 48, 1509–1518. [Google Scholar] [CrossRef]
- Schroth, J.G.; Brueggeman, H.M.; Grewal, N.P. Quick plastically formed aluminum doors: design and performance. J. Mater. Eng. Perf. 2007, 16, 339–348. [Google Scholar] [CrossRef]
- Boissiere, R.; Terzi, S.; Blandin, J.J.; Salvo, L. Quick-plastic forming: Similarities and differences with super-plastic forming. In Proceedings of the 6th EUROSPF Conference, Carcassonne, France, 3–5 September 2008. [Google Scholar]
- Prasannavenkatesan, R.; Parker, M.; Laplante, Y.; Bombardier, N.; Rush, B.; Shi, L.I. High speed blow forming processes. U.S. Patent Application No. 14/865,625, 30 March 2017. [Google Scholar]
- Verbom Inc. Available online: https://www.verbom.com/en/aluminium-spf/#5000-alloys-spf (accessed on 1 October 2018).
- Sorgente, D.; Tricarico, L. The role of the numerical simulation in superplastic forming process analysis and optimization. Key Eng. Mater. 2010, 433, 225–234. [Google Scholar] [CrossRef]
- Fereshteh-Saniee, F.; Fakhar, N.; Asgari, M.; Mahmudi, R. A new experimental-numerical approach for studying the effects of gas pressure profile on superplastic forming characteristics of Al-Mg5. 6 alloy. Int. J. Adv. Manuf. Technol. 2017, 91, 1771–1780. [Google Scholar] [CrossRef]
- Nazzal, M.A. Stability analysis and finite element simulations of superplastic forming in the presence of hydrostatic pressure. AIP Conf. Proceed. 2018, 1957, 050006. [Google Scholar] [CrossRef]
- Sorgente, D.; Tricarico, L. Characterization of a superplastic aluminium alloy ALNOVI-U through free inflation tests and inverse analysis. Int. J. Mater. Form. 2014, 7, 179–187. [Google Scholar] [CrossRef]
- Giuliano, G. Multiphase Gas Blow Forming of AA2017. J. Test. Eval. 2019, 47. [Google Scholar] [CrossRef]
- Khraisheh, M.; Zbib, H.; Hamilton, C.; Bayoumi, A. Constitutive modeling of superplastic deformation. Part I: Theory and experiments. Int. J. Plast. 1997, 13, 143–164. [Google Scholar] [CrossRef]
- Majidi, O.; Jahazi, M.; Bombardier, N. A Viscoplastic Model Based on a Variable Strain Rate Sensitivity Index for Superplastic Sheet Metals. Int. J. Mater. Form. 2018, 1–10. [Google Scholar] [CrossRef]
- Ridley, N. Metals for superplastic forming. In Superplastic Forming of Advanced Metallic Materials: Methods and Applications; Giuliano, G., Ed.; Woodhead Publishing: Cambridge, UK, 2011; pp. 3–33. ISBN 978-1-84569-753-2. [Google Scholar]
- Majidi, O.; Jahazi, M.; Bombardier, N.; Samuel, E. Variation of strain rate sensitivity index of a superplastic aluminum alloy in different testing methods. AIP Conf. Proceed. 2017, 1896, 020022. [Google Scholar] [CrossRef]
- Majidi, O.; Jahazi, M.; Bombardier, N. Characterization of mechanical properties and formability of a superplastic Al-Mg alloy. J. Phys. Conf. Series 2018, 1063, 012165. [Google Scholar] [CrossRef]
Figure 1.
The schematic of a high-speed blow forming (HSBF) process: (a) pre-heating the blank on the lower die; (b) crash forming; (c) clamping the blank; (d) gas blow forming.
Figure 1.
The schematic of a high-speed blow forming (HSBF) process: (a) pre-heating the blank on the lower die; (b) crash forming; (c) clamping the blank; (d) gas blow forming.

Figure 2.
The finite element (FE) simulation parts.

Figure 3.
The gas pressure-time curves.
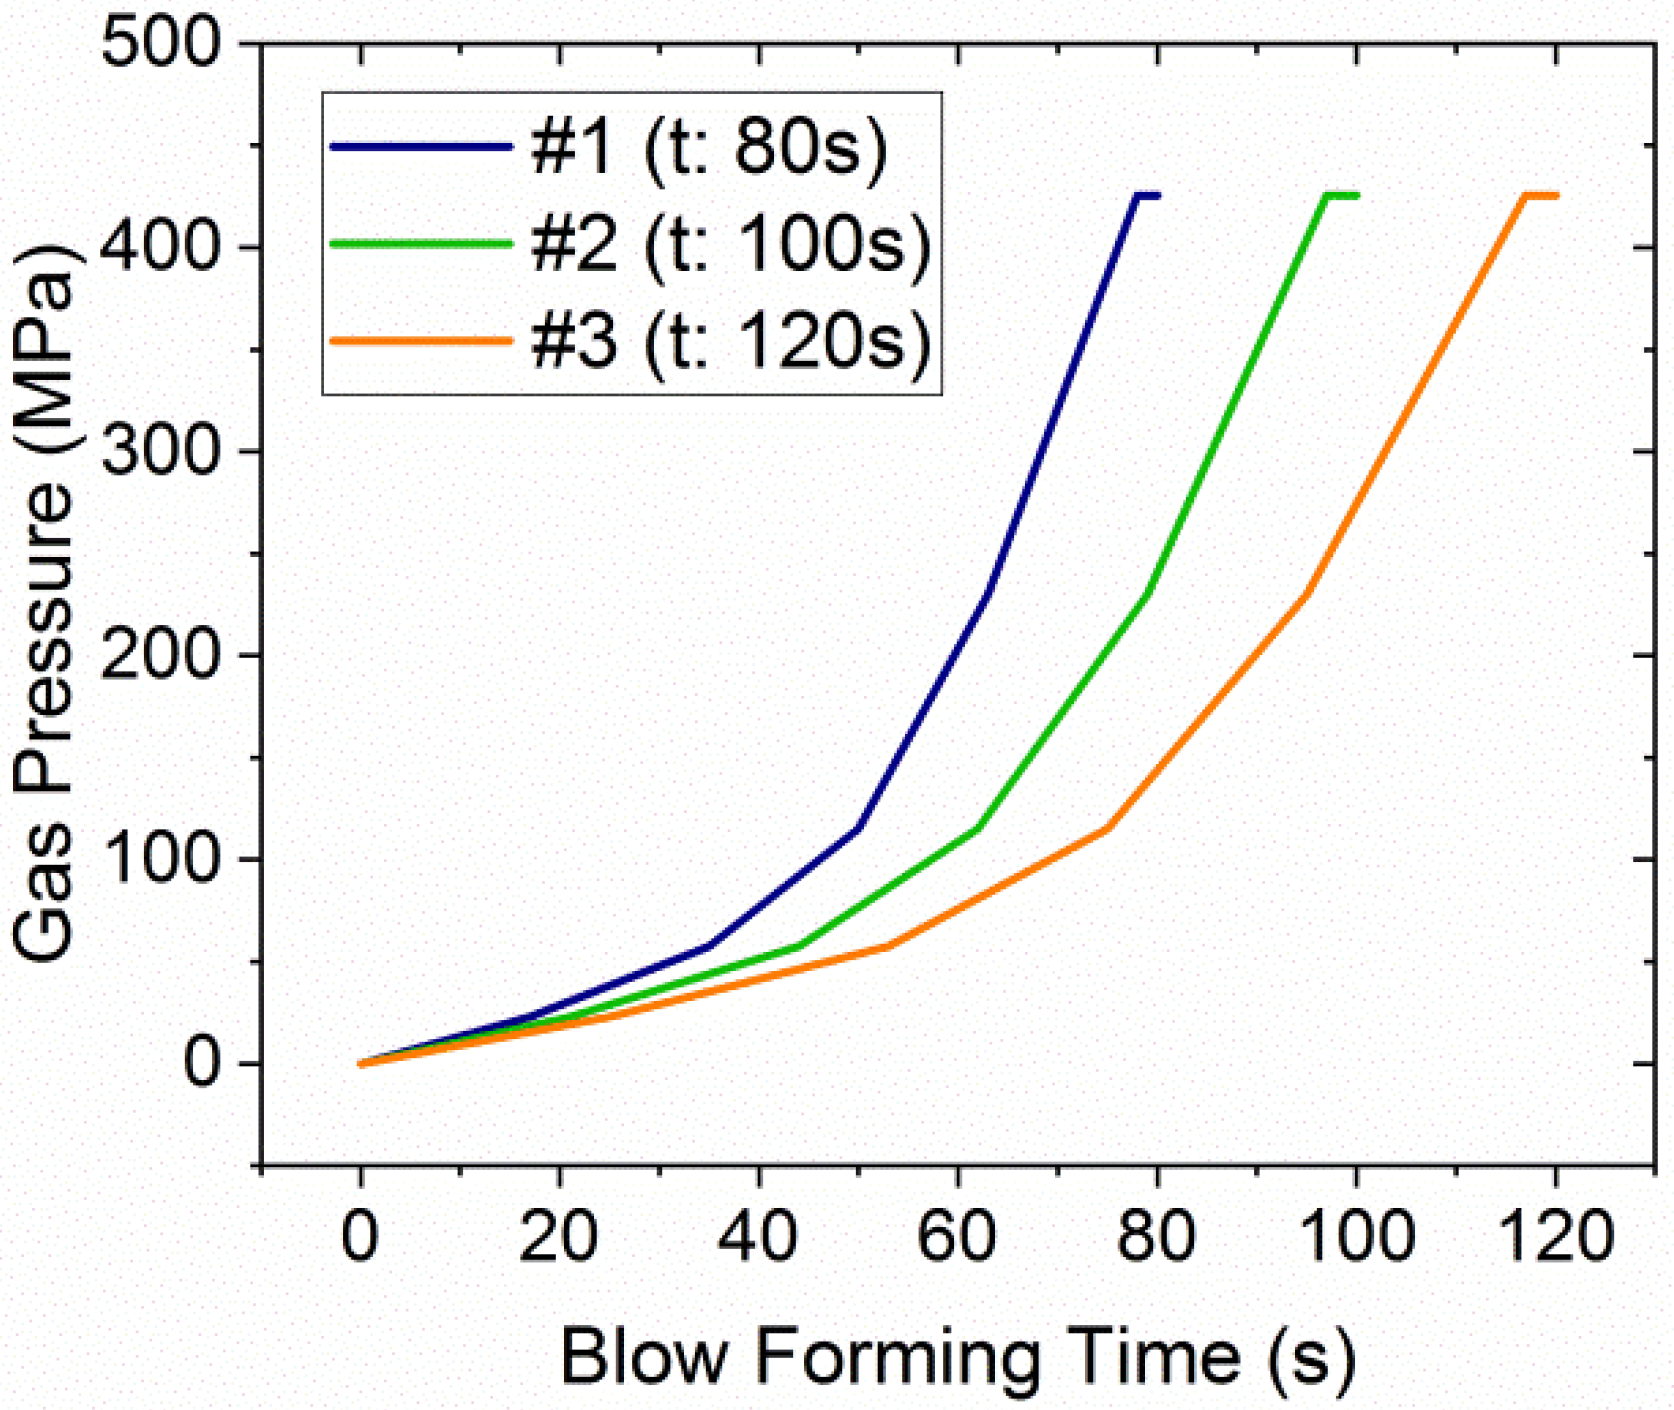
Figure 4.
The hydraulic press used for the HSBF process.

Figure 5.
The deformed part and the 8 measuring points on the critical region.
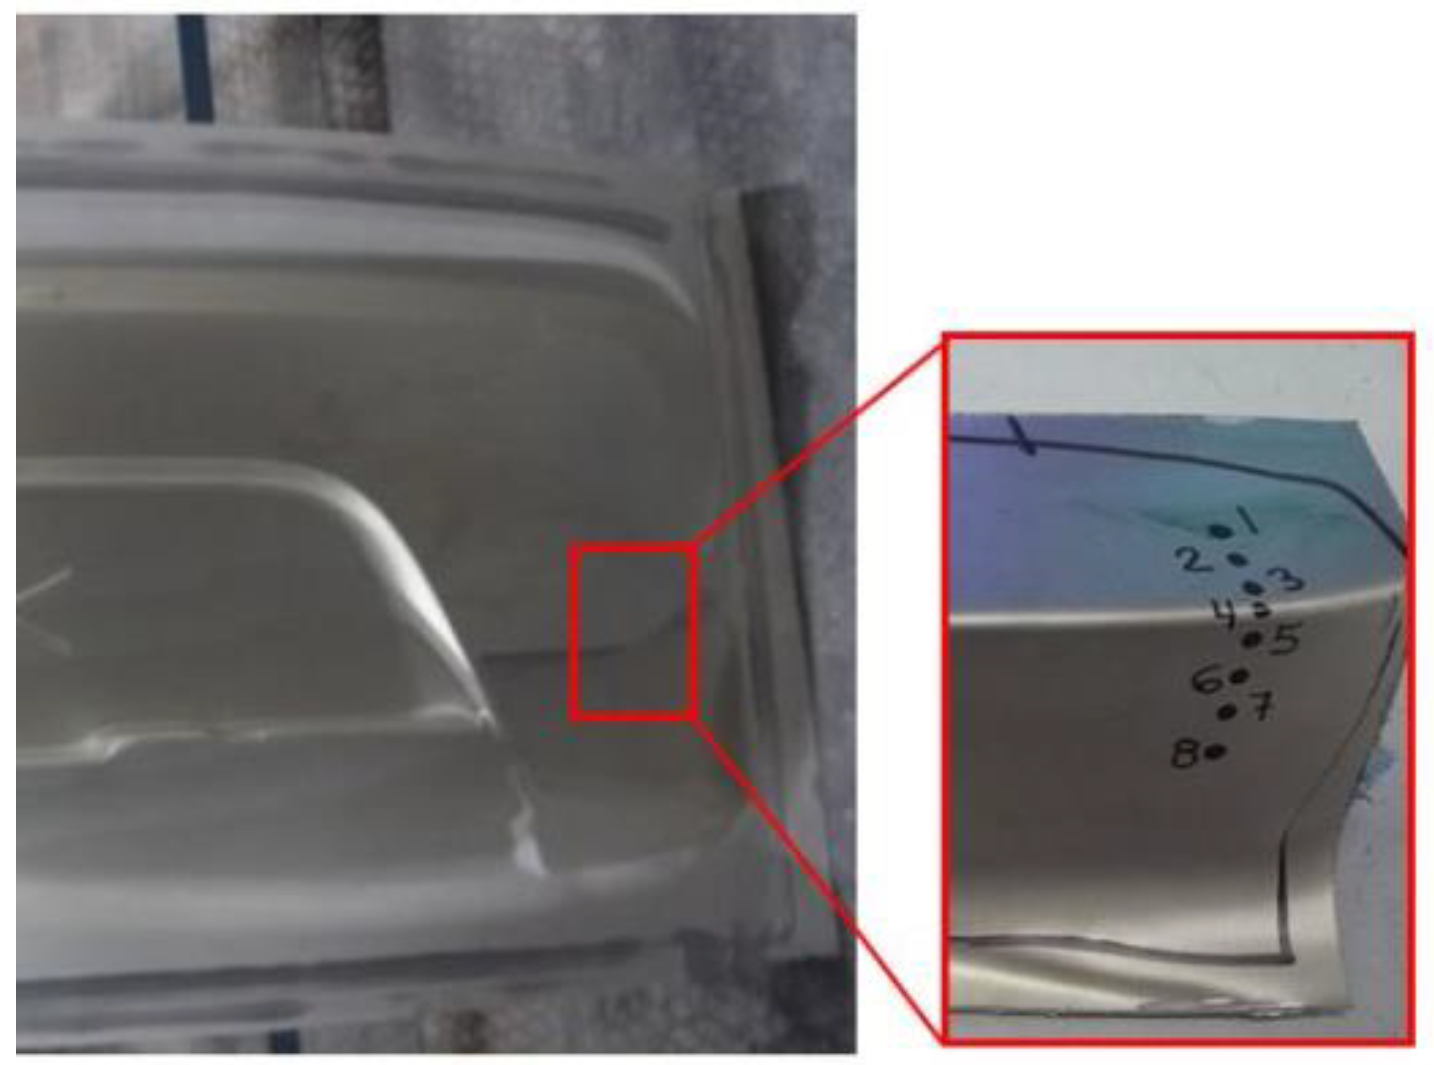
Figure 6.
The impact of element size on (a) minimum thickness; (b) calculation time.

Figure 7.
Predicted thickness variation within the part deformed with gas profile #1 (t: 80 s) assuming friction coefficient of: (a) 0.1; (b) 0.15; (c) 0.2; (d) 0.25; and (e) 0.3.
Figure 7.
Predicted thickness variation within the part deformed with gas profile #1 (t: 80 s) assuming friction coefficient of: (a) 0.1; (b) 0.15; (c) 0.2; (d) 0.25; and (e) 0.3.

Figure 8.
Predicted thickness variation within the part deformed with gas profile #2 (t: 100 s) assuming friction coefficient of: (a) 0.1; (b) 0.15; (c) 0.2; (d) 0.25; and (e) 0.3.
Figure 8.
Predicted thickness variation within the part deformed with gas profile #2 (t: 100 s) assuming friction coefficient of: (a) 0.1; (b) 0.15; (c) 0.2; (d) 0.25; and (e) 0.3.

Figure 9.
Predicted thickness variation within the part deformed with gas profile #3 (t: 120 s) assuming friction coefficient of: (a) 0.1; (b) 0.15; (c) 0.2; (d) 0.25; and (e) 0.3.
Figure 9.
Predicted thickness variation within the part deformed with gas profile #3 (t: 120 s) assuming friction coefficient of: (a) 0.1; (b) 0.15; (c) 0.2; (d) 0.25; and (e) 0.3.
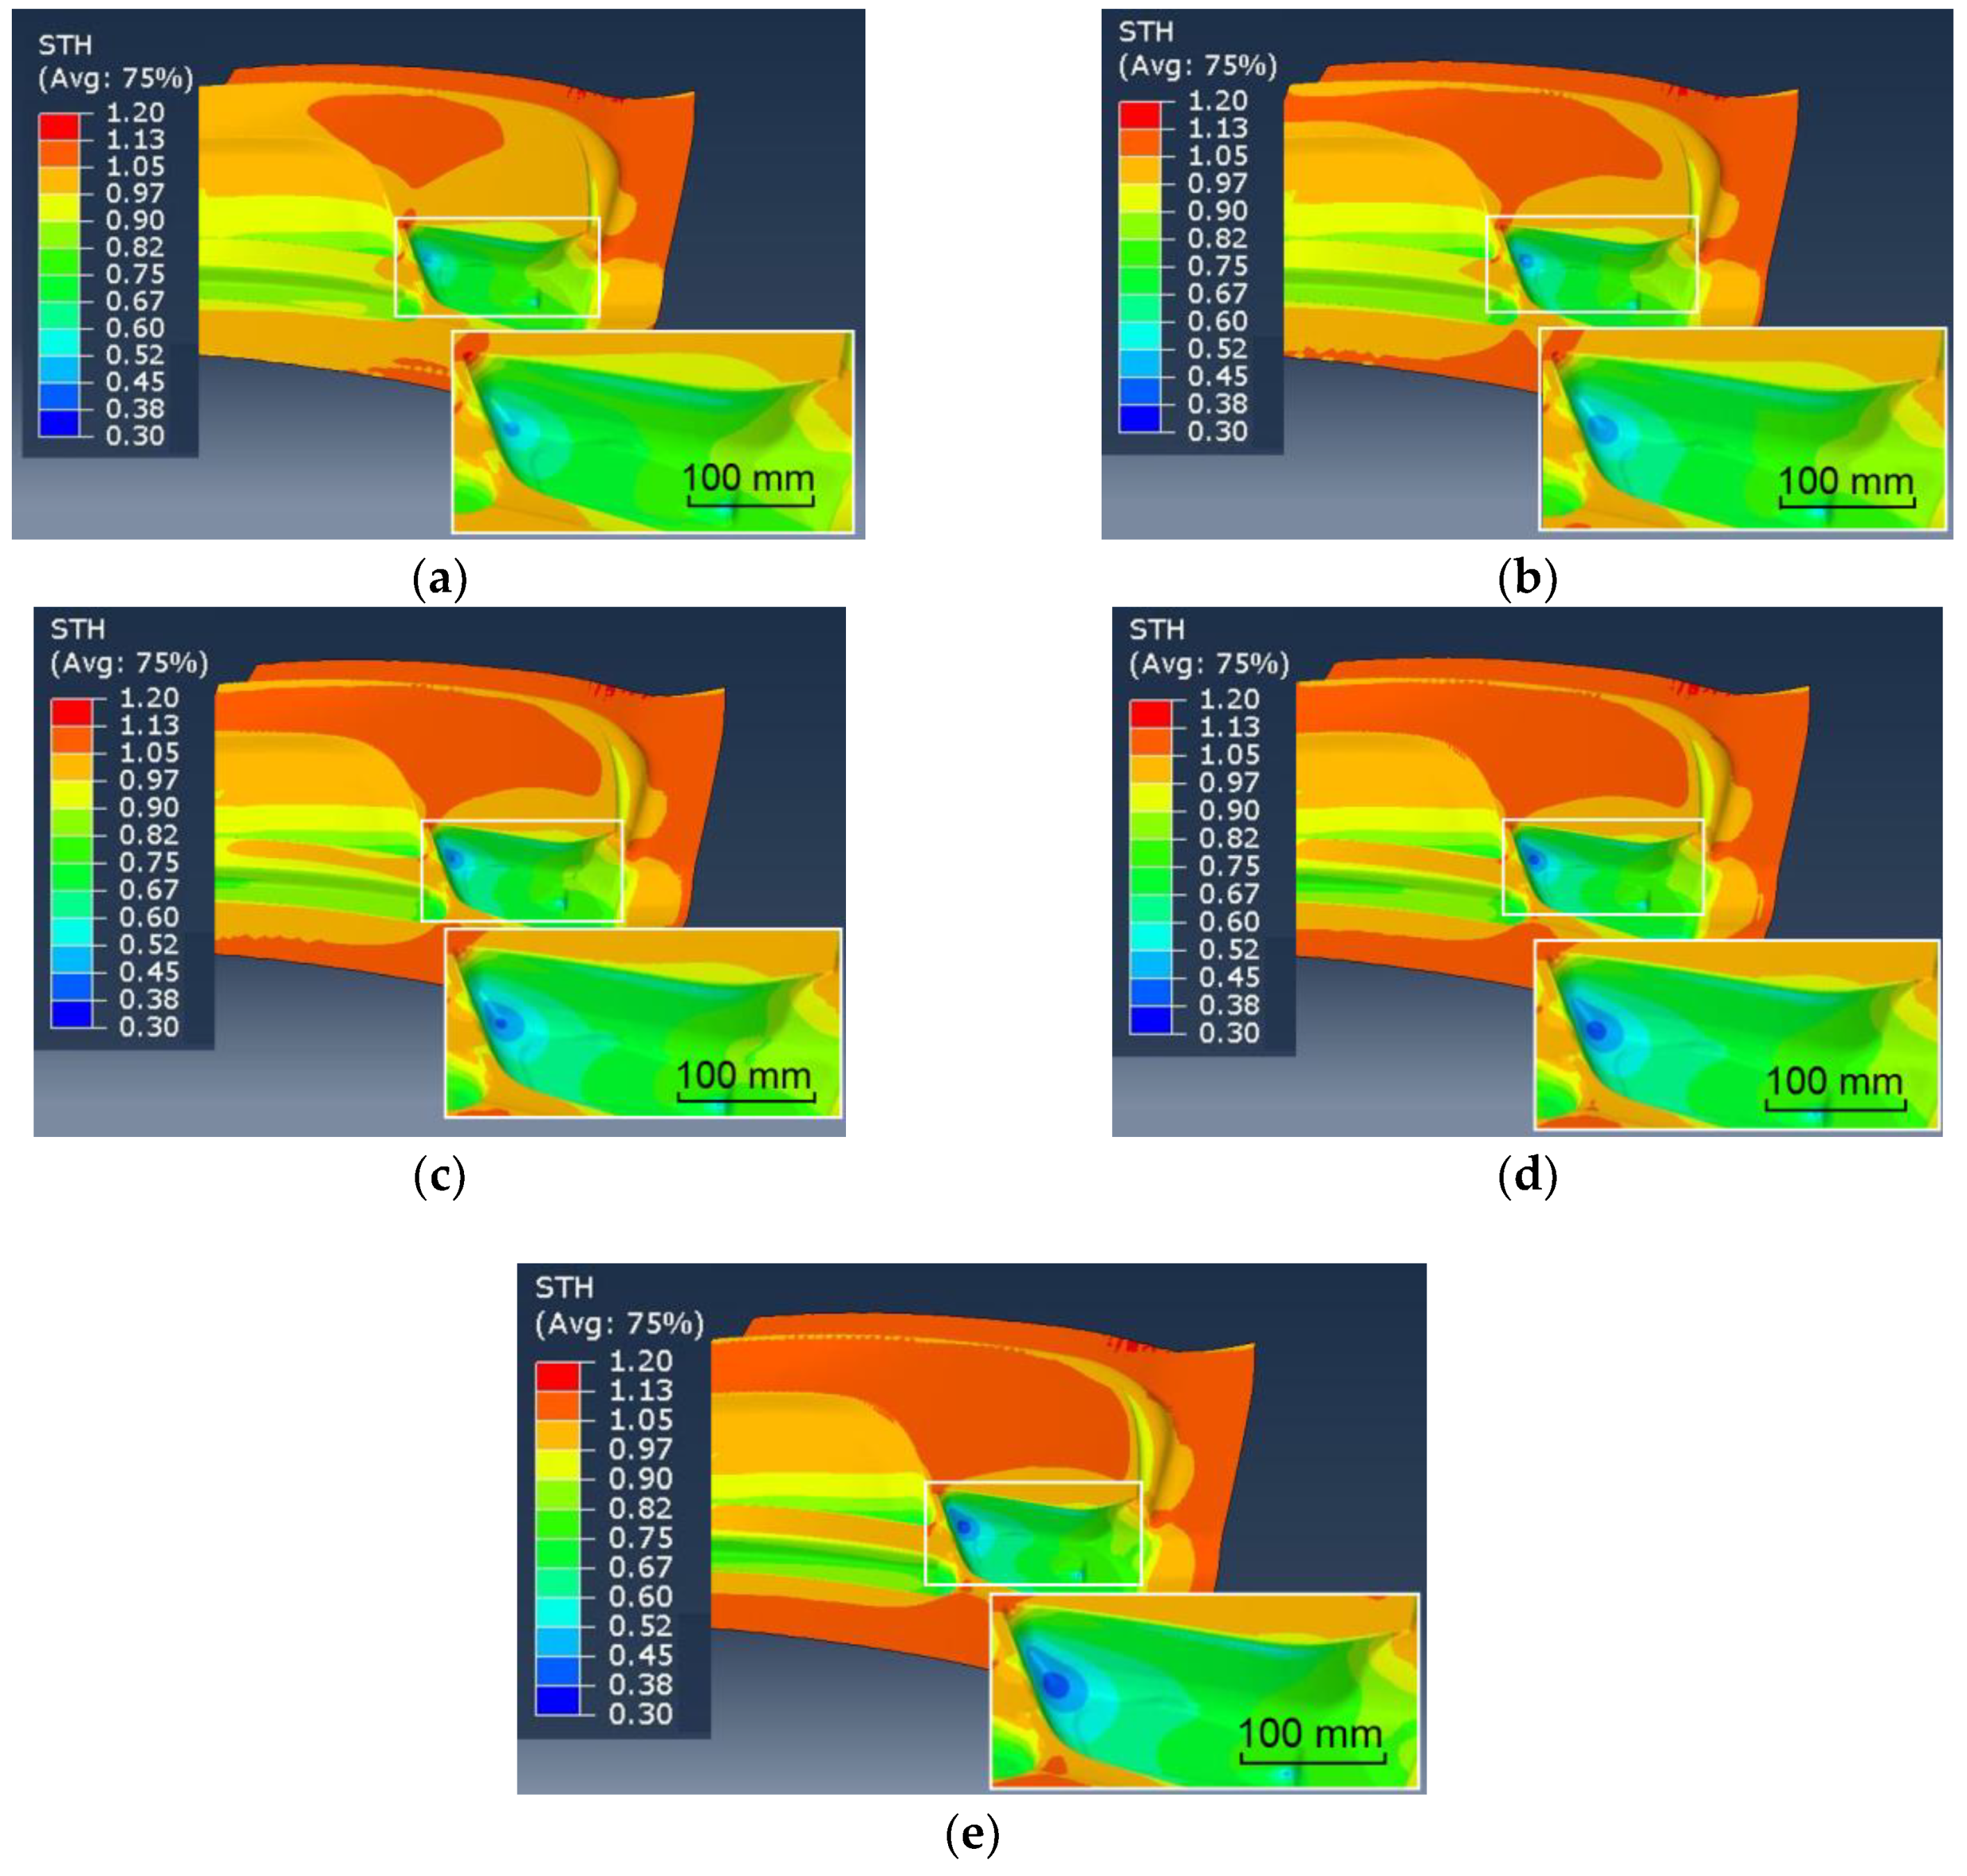
Figure 10.
Predicted strain rate variation within the part at blowing time of 46 s for: (a) gas profile #1 (t = 80 s); (b) gas profile #2 (t = 100 s); (c) gas profile #3 (t = 120 s). (d) Evolution of strain rate during blow forming for a selected node.
Figure 10.
Predicted strain rate variation within the part at blowing time of 46 s for: (a) gas profile #1 (t = 80 s); (b) gas profile #2 (t = 100 s); (c) gas profile #3 (t = 120 s). (d) Evolution of strain rate during blow forming for a selected node.
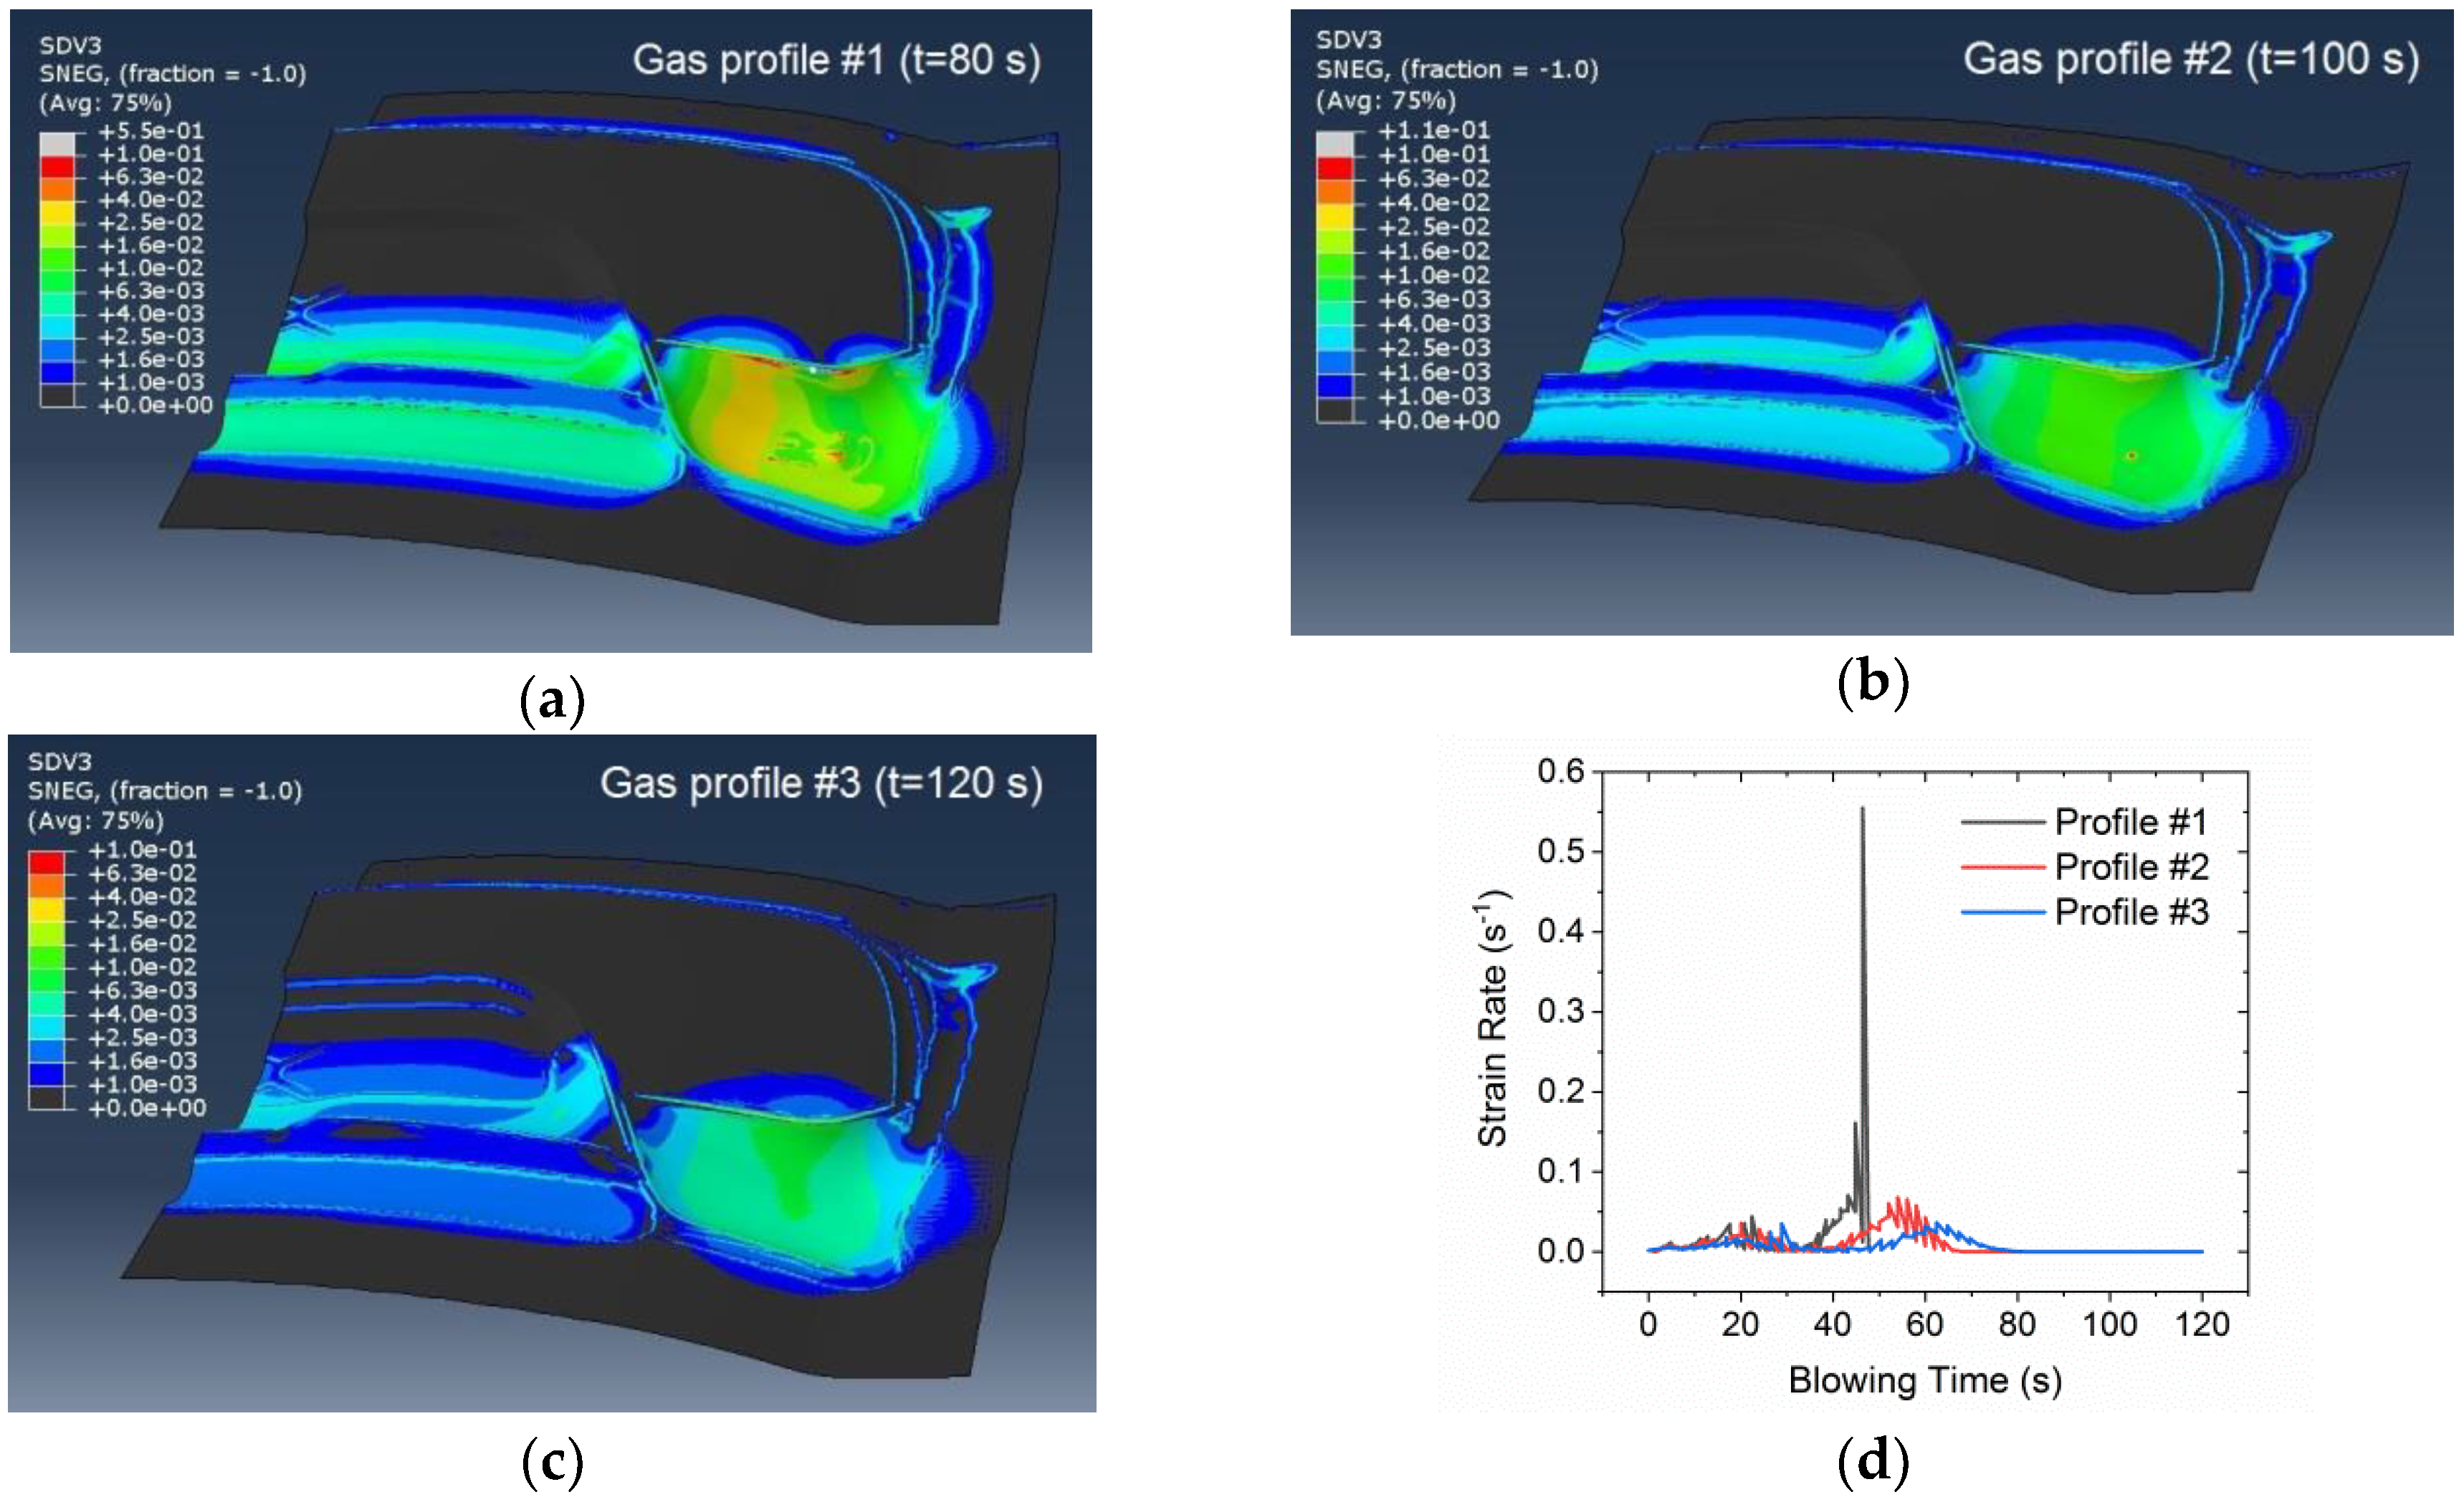
Figure 11.
Thickness variation along the eight measuring points for; (a) gas pressure profile #1 (t = 80 s); (b) gas pressure profile #2 (t = 100 s); and (c) gas pressure profile #3 (t = 120 s).
Figure 11.
Thickness variation along the eight measuring points for; (a) gas pressure profile #1 (t = 80 s); (b) gas pressure profile #2 (t = 100 s); and (c) gas pressure profile #3 (t = 120 s).

Figure 12.
The part deformed with gas profile #1 (t: 80 s): (a) FE prediction using VmV model; (b) FE prediction using power law; and (c) the observed crack.
Figure 12.
The part deformed with gas profile #1 (t: 80 s): (a) FE prediction using VmV model; (b) FE prediction using power law; and (c) the observed crack.


Table 1.
The VmV model constants for AA5083.
| m0 | m1 | g1 | g2 | h1 | h2 | h3 | h4 | f0 | φ |
|---|---|---|---|---|---|---|---|---|---|
| −0.667 | 3.97 | −0.074 | 0.043 | 0.59 | 0.71 | −0.44 | 0.28 | 0.0008 | 3.7 |
© 2018 by the authors. Licensee MDPI, Basel, Switzerland. This article is an open access article distributed under the terms and conditions of the Creative Commons Attribution (CC BY) license (http://creativecommons.org/licenses/by/4.0/).
Share and Cite
MDPI and ACS Style
Majidi, O.; Jahazi, M.; Bombardier, N. Finite Element Simulation of High-Speed Blow Forming of an Automotive Component. Metals 2018, 8, 901. https://doi.org/10.3390/met8110901
AMA Style
Majidi O, Jahazi M, Bombardier N. Finite Element Simulation of High-Speed Blow Forming of an Automotive Component. Metals. 2018; 8(11):901. https://doi.org/10.3390/met8110901
Chicago/Turabian StyleMajidi, Omid, Mohammad Jahazi, and Nicolas Bombardier. 2018. "Finite Element Simulation of High-Speed Blow Forming of an Automotive Component" Metals 8, no. 11: 901. https://doi.org/10.3390/met8110901
Note that from the first issue of 2016, this journal uses article numbers instead of page numbers. See further details here.