Article

Initial Stages of AZ31B Magnesium Alloy Degradation in Ringer’s Solution: Interpretation of EIS, Mass Loss, Hydrogen Evolution Data and Scanning Electron Microscopy Observations

by
Lucien Veleva
1,
Mareny Guadalupe Fernández-Olaya
1 and
Sebastián Feliu, Jr.
2,*
1
Applied Physics Department, Center for Investigation and Advanced Study (CINVESTAV-IPN), Unidad Merida, 97310 Merida, Mexico
2
Centro Nacional de Investigaciones Metalúrgicas CSIC, 28040 Madrid, Spain
*
Author to whom correspondence should be addressed.
Metals 2018, 8(11), 933; https://doi.org/10.3390/met8110933
Submission received: 14 October 2018 / Revised: 2 November 2018 / Accepted: 9 November 2018 / Published: 12 November 2018
(This article belongs to the Special Issue Corrosion and Protection of Metals)

Abstract

:
The initial stages of corrosion of AZ31B magnesium alloy, immersed in Ringer’s solution at 37 °C body temperature for four days, have been evaluated by independent gravimetric and chemical methods and through electrochemical impedance spectroscopy (EIS) measurements. The corrosion current densities estimated by hydrogen evolution are in good agreement with the time-integrated reciprocal charge transfer resistance values estimated by EIS. The change in the inductive behavior has been correlated with difference in the chemical composition of corrosion layers. At the shorter immersion of 2 days, EDS analysis of cross section of the uniform corrosion layer detected Cl and Al elements, perhaps as formed aluminum oxychlorides salts.

1. Introduction

Magnesium (Mg) alloys are being suggested as biodegradable implant materials for clinical applications [1,2,3,4,5], because Mg is non-toxic, biocompatible and beneficial for bone growth and metabolic processes in the human body [6,7,8,9]. As a consequence, these alloys are widely used as materials for biomedical applications [10,11,12,13,14]. Among the AZ series, AZ31 (Mg-3%Al-1%Zn) is considered to be suitable as biodegradable material for biomedical applications, having several advantages including: reduced aluminum content, microstructure refinement, low fatigue, corrosion resistance similar to other Mg alloys [7,15,16,17,18], not harmful to tissue [19,20] and promoter of new bone cell formation [7,16]. Cathodically active intermetallic Al-Mn particles located within the grains of α-Mg matrix are the main second phase constituents of AZ31B microstructure, such as Al8Mn5, ε-AlMn, Al11Mn4 and β-Mn(Al) [21,22,23,24,25]. The corrosion mechanism directly depends on their distribution and the solution composition [26,27,28,29,30,31,32]. As test media in this work was selected Ringer’s solution, which is an isotonic (physiological) aqueous solution of NaCl with additional compounds, as found in human body fluids (blood serum).
Magnesium is highly active, presenting rapid and continuing dissolution in aqueous solutions. During its degradation hydrogen gas is produced, which is a problem for cardiovascular stents, or for temporary orthopedic implants and could cause a complete failure of the medical device before the bone is healed. Assessing the corrosion rate of Mg-based implant is a critical issue and different alternative techniques could be used, in order to prevent some method limitations [33,34,35,36]. Besides, Mg corrosion process near the surface-electrolyte is very dynamic, which is altered with time and therefore, the instantaneous test results and those of long-term methods do not conform well [37].
Widely used technique for corrosion tests in simulated body fluids (SBF) is electrochemical impedance spectroscopy (EIS), for in vitro investigation of the corrosion behavior of metals and alloys [3,4,38,39,40]. The properties of the electrode surface are not altered after an EIS measurement, since only a small amplitude (~10 mV) AC signal is applied. The high accuracy and reproducibility of the results are well-known advantages of this technique, applied in many material systems and applications [41,42,43,44]. The nondestructive character of the impedance technique allows derivation of in situ changes in Mg-based implant material degradation, which in clinical applications is a rather long-term dynamic process [3,4,38]. Some research effort has been focused on the relationship between EIS parameters and independently-measured corrosion rate data, such as average of corrosion mass loss [34,45,46,47,48,49], solution analysis by atomic absorption spectroscopy [50], or hydrogen gas volume evolution [34,36,46,47,48,51]. Good agreement between corrosion rates of bulk magnesium and several alloys calculated from charge transfer resistance values, Rt, obtained from impedance diagrams and atomic absorption or gravimetric measurements have been observed by Makar and Kruger [45] and Pebere et al. [50]. Recently, King et al. [34] and Bland et al. [46,47] have obtained excellent correlation between the values of the corrosion rate determined by weight loss, hydrogen gas collection and EIS measurements, extrapolating the inductive loop of the impedance diagrams to zero frequency, defined as the polarization resistance (Rp), rather than Rt. Most of the studies are conducted at the room temperature, using rather simple electrolytes, for example, NaCl, Na2B4O7 and Na2CO3, Na2SO4, ammonium/carbonate solutions. Likewise, there is a lack of similar investigations on the use of EIS as a method to determine corrosion rates of Mg-based materials for clinical implants, exposed to simulated body fluids at a body temperature of 37 °C. Xin et al. [52] have reported degradation rates of Mg immersed in SBF having different concentrations of HCO3 and correlated the EIS data with hydrogen evolution values. Recently, Liu et al. [49] have established a good agreement between EIS-estimated Rt values, hydrogen evolution measurements and mass loss, performed on a Mg-1Ca alloy exposed to SBF solution.
In the low frequency (LF) region, the impedance diagrams of Mg usually are characterized by a well-marked inductive loop [34,53], while the high frequency loop is considered to be a consequence of the formed corrosion film and its influence on the charge transfer process [54]. The inductive behavior could be associated with the occurrence of pitting corrosion, accompanied by the absorption of Mg(OH)+ads or Mg(OH)2 species [50,54], or because of accelerated anodic dissolution [34]. The inductive loop could disappear when corrosion protective layer is formed on the surface [55,56]. However, the effect of the precise chemical species, which are responsible for the characteristic inductive loop, is still unclear [34] and its interpretation remains controversial [51].
The aim of this study is to follow the evolution of AZ31B magnesium alloy surface activity during the initial stages of corrosion in Ringer’s solution, maintained at a body temperature of 37 °C. One goal is to explore the EIS capabilities for reliable corrosion rate determination. A key objective is to determine which resistance, as obtained from the impedance diagrams, has a stronger correlation with the calculated corrosion rate, based on volume of hydrogen evolution. In this investigation, the EIS technique is used in combination with the SEM-EDS analysis applied on the cross-sections of the test samples, in order to provide information on the grown corrosion films on AZ31B and establish a relationship between their EIS-inductive behavior in artificial physiological environment.

2. Materials and Methods

2.1. Sample Preparation

The composition of the rolled AZ31B Mg-alloy sheet (Magnesium Elektron Ltd., Manchester, UK) is given in Table 1. Square coupon specimens of dimensions 20 × 20 × 3 mm3 and 50 × 50 × 3 mm3 were used. Before tests all samples were abraded with 2000 grit SiC paper and mirror polished with 1-μm diamond paste, using ethanol as lubricant, then they were sonicated in ethanol and dried in warm air flow.

2.2. Immersion Test

The isotonic Ringer’ solution is a physiological solution, which is an aqueous solution of NaCl with additional compounds, as constituents of the human body fluids (blood serum). It was prepared as described elsewhere [57] with deionized water (18.2 MΩ·cm) and analytical grade reagents (NaCl, KCl, CaCl2) supplied from Sigma-Aldrich, St. Louis, MO, USA. During the test the temperature of the solution was kept stable thermostatically at 37 °C ± 1 °C, the body temperature, using a Digital Circulating Water Bath (Ultrasons Medi-II, J.P. Selecta).

2.3. Microstructure Characterization

Frontal and cross-sectional SEM (Jeol JSM 6500F, Jeol Ltd., Tokyo, Japan) and optical microscopy (Olympus BX-51, Olympus, Tokyo, Japan) images of AZ31B surface were used to characterize the morphological and microstructural changes occurring during the corrosion process.
The corrosion product’s elemental composition was characterized through SEM-EDS (EDS, Oxford instrument, Oxford, Oxfordshire, UK) and the phase composition by low-angle X-ray diffraction instrument (XRD, Bruker AXS D8 diffractometer, Bruker AXS, Karlsruhe, Germany) with CuKα radiation.

2.4. Hydrogen Evolution Measurement

Immediately after immersion of the AZ31B samples in the Ringer’s solution, hydrogen gas evolution is observed (Equation (1)), produced by magnesium corrosion [1,2,26]:
Mg + 2 H 2 O Mg ( OH ) 2 + H 2
Hydrogen collection was performed by placing the entire specimen surface (10.4 cm2) into the Ringer’s solution under an inverted burette system [58]. The height of the solution level in the burette was recorded.
The relationship between the measured volume of hydrogen gas (VH, mL) and the corrosion current density ( i H 2 , mA cm−2), is determined via a combination of Faraday’s and ideal gas laws:
i H 2 = 0.091   V H A · t
where A is the surface area (cm2) and t is the time (days) of exposure.

2.5. Electrochemical Measurements

Electrochemical impedance (EIS) measurements were carried out using a potentiostat with a frequency response analyzer (Autolab PGSTAT30, Metrohm, Herisau, Switzerland). The three electrode cell consisted of AZ31B working electrode (9 cm2 of area), Pt spiral auxiliary electrode and saturated Ag/AgCl (sat. KCl) reference electrode. In order to establish a relatively stable open circuit potential (OCP), the electrochemical measurements were performed after 30 min of immersion of the AZ31B in the Ringer’s solution. The tests were carried out varying the exposure time of AZ31B from 1 h to 4 days. The EIS measurements were conducted at OCP (open circuit potential) conditions, applying 10 mV sinusoidal signal amplitude with frequencies ranging from 100 kHz to 1 mHz. The EIS data were numerically fitted with equivalent circuits using Zview software (3.0a Scribner Associates, Inc., Southern Pines, NC, USA).
The corrosion layers of the EIS tested samples were removed after a 10 min cleaning procedure with a solution of 10 g/L AgNO3 (Sigma-Aldrich, St. Louis, MO, USA) and 200 g/L CrO3 (Sigma-Aldrich, St. Louis, MO, USA), at room temperature (21–22 °C), rinsed with distilled water and ethanol, then dried in warm air flow before determining the weight loss. All tests and measurements reported in this study were triplicated to ensure repeatability.

3. Results

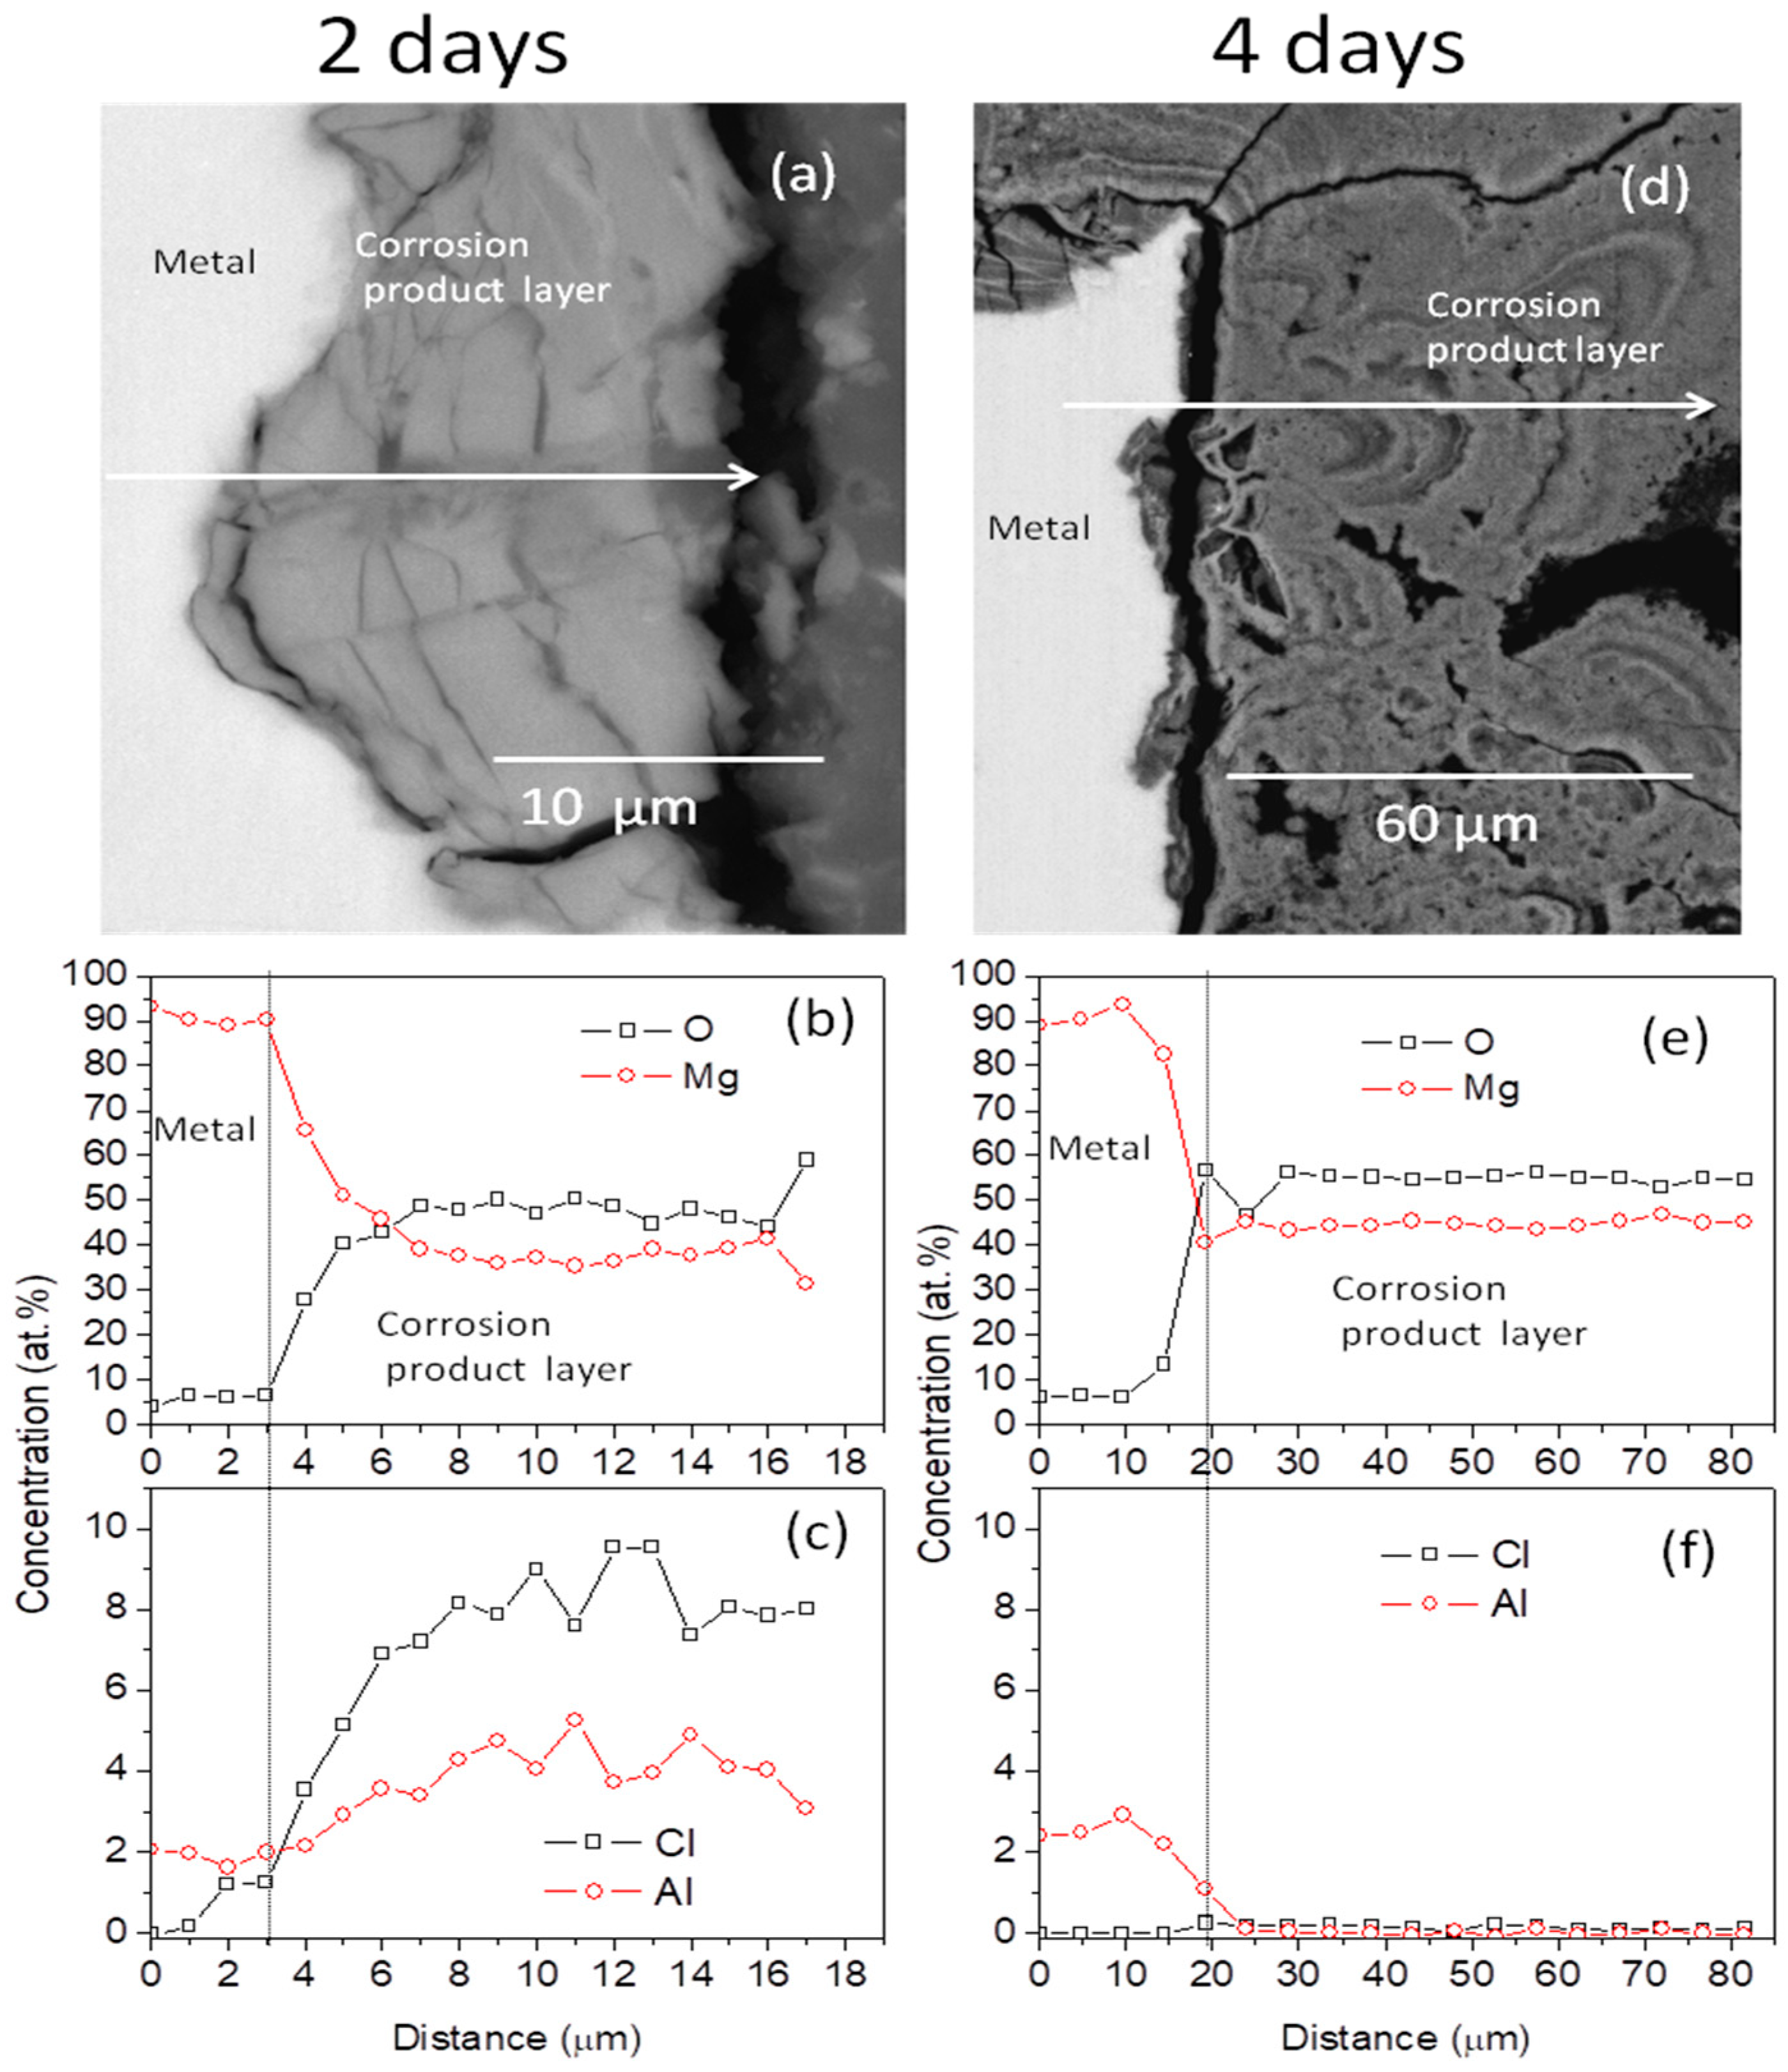
3.1. Surface Morphology and Cross-Sectional Analysis of Corrosion Layers

The morphologies of AZ31B surfaces, after immersion in Ringer’s solutions at 37 °C for different times, are shown in Figure 1. After 2 days of immersion, a thick layer of corrosion completely covered the AZ31B alloy surface (Figure 1a). The surface morphology after 4 days immersion shows severe pitting corrosion, which could reach a diameter of ~200 µm (white arrows in Figure 1b). The cross sectional morphology images (BSE) of the corrosion layers formed after 2 and 4 days of immersion (Figure 2a,d) and their EDS quantitative analysis are compared in Figure 2b,c and Figure 2e,f, respectively. The EDS reveals that at 2 days (Figure 2b) the corrosion layer is mostly composed of Mg and O. An enrichment in Al and high Cl contents are also detected (Figure 2c). Average atomic composition obtained by EDS and the respective standard deviations from twenty positions across the corrosion layer are shown in Table 2. Within the limits of the EDS analysis, the atomic ratio between Cl and Al is approximately 2.0 ± 0.4, an evidence for possible formation of Al(OH)Cl2 and Al(OH)2Cl aluminum oxychlorides, as previously suggested by Wang et al. [59]. In contrast, no significant amount of Cl was detected in the uniform corrosion layer formed after 4 days of immersion (Figure 2d,f and Table 2), where only Mg and O were observed (Figure 2e).

3.2. XRD Analysis of Corrosion Layers

The XRD spectra (Figure 3) of AZ31B surfaces, after their exposure in the Ringer’s solution for varying immersion periods, indicated that brucite Mg(OH)2 is the primary phase of the corrosion layer. In contrast with the EDS data, no diffraction peaks associated with Al-oxychlorides were registered, suggesting that these compounds appear in an amorphous form [60], or are below the detection limit for second phases using XRD technique (>5% usually).

3.3. Hydrogen Evolution Measurement
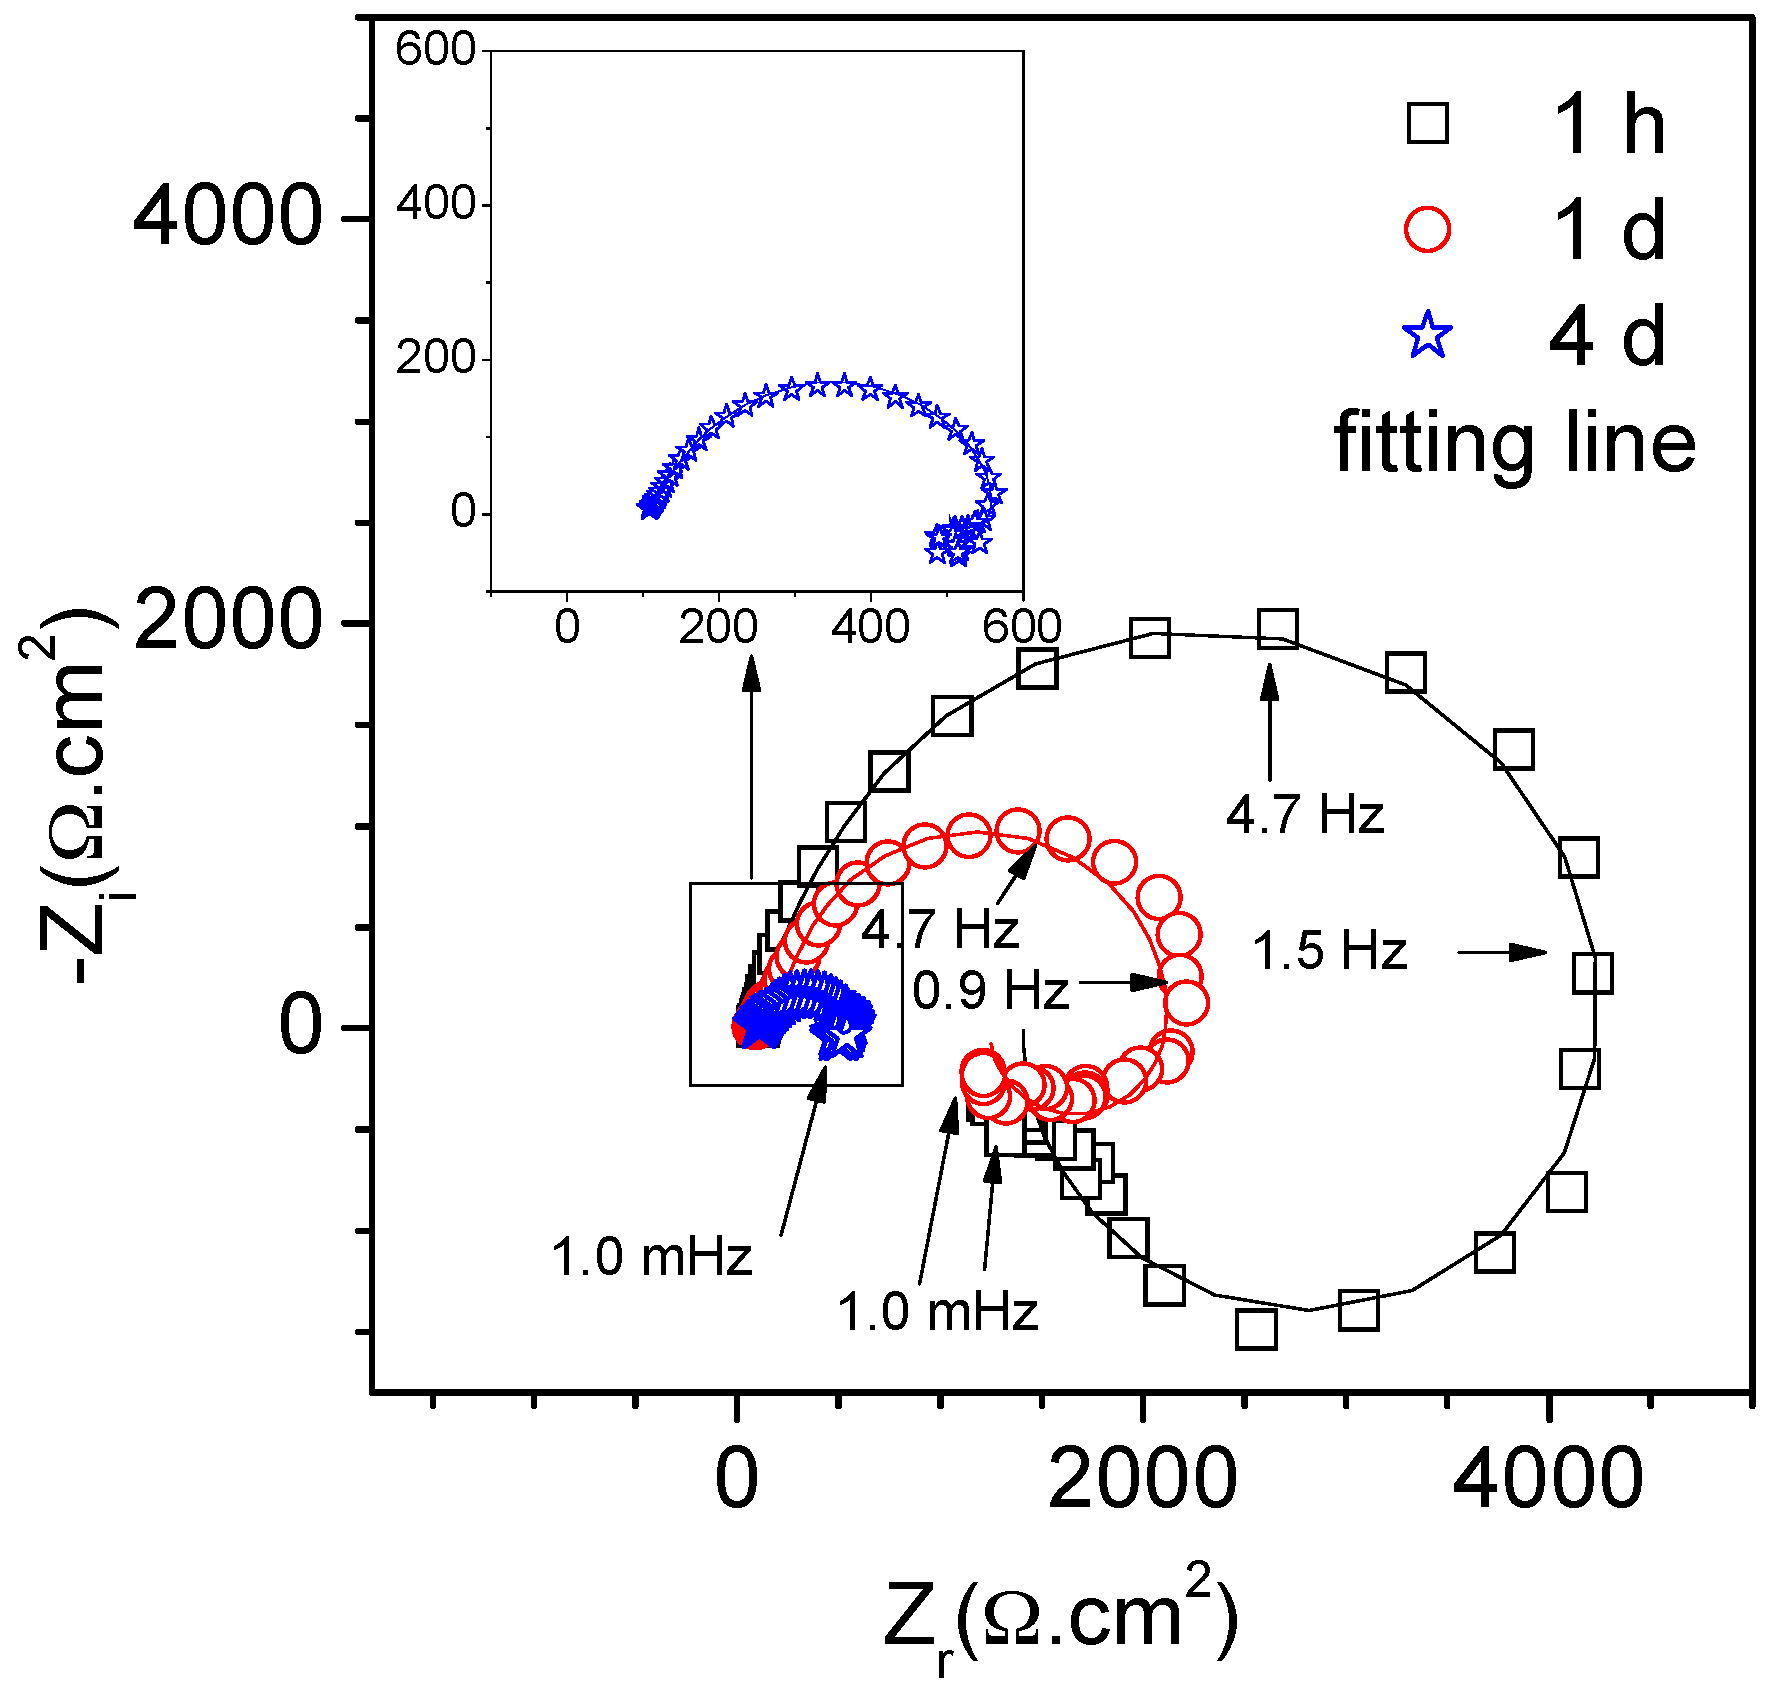
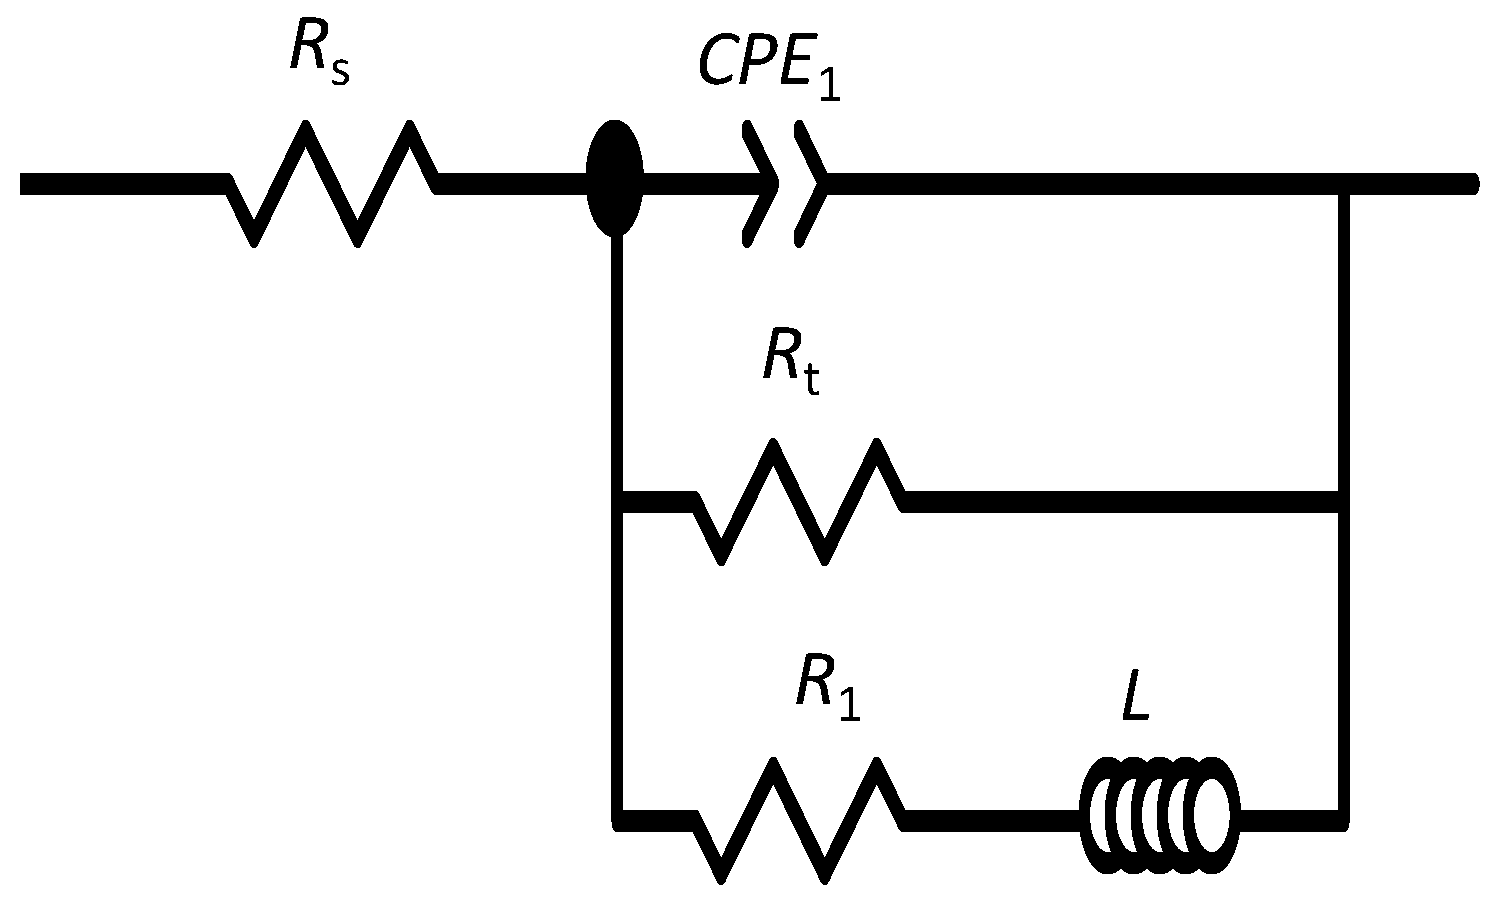
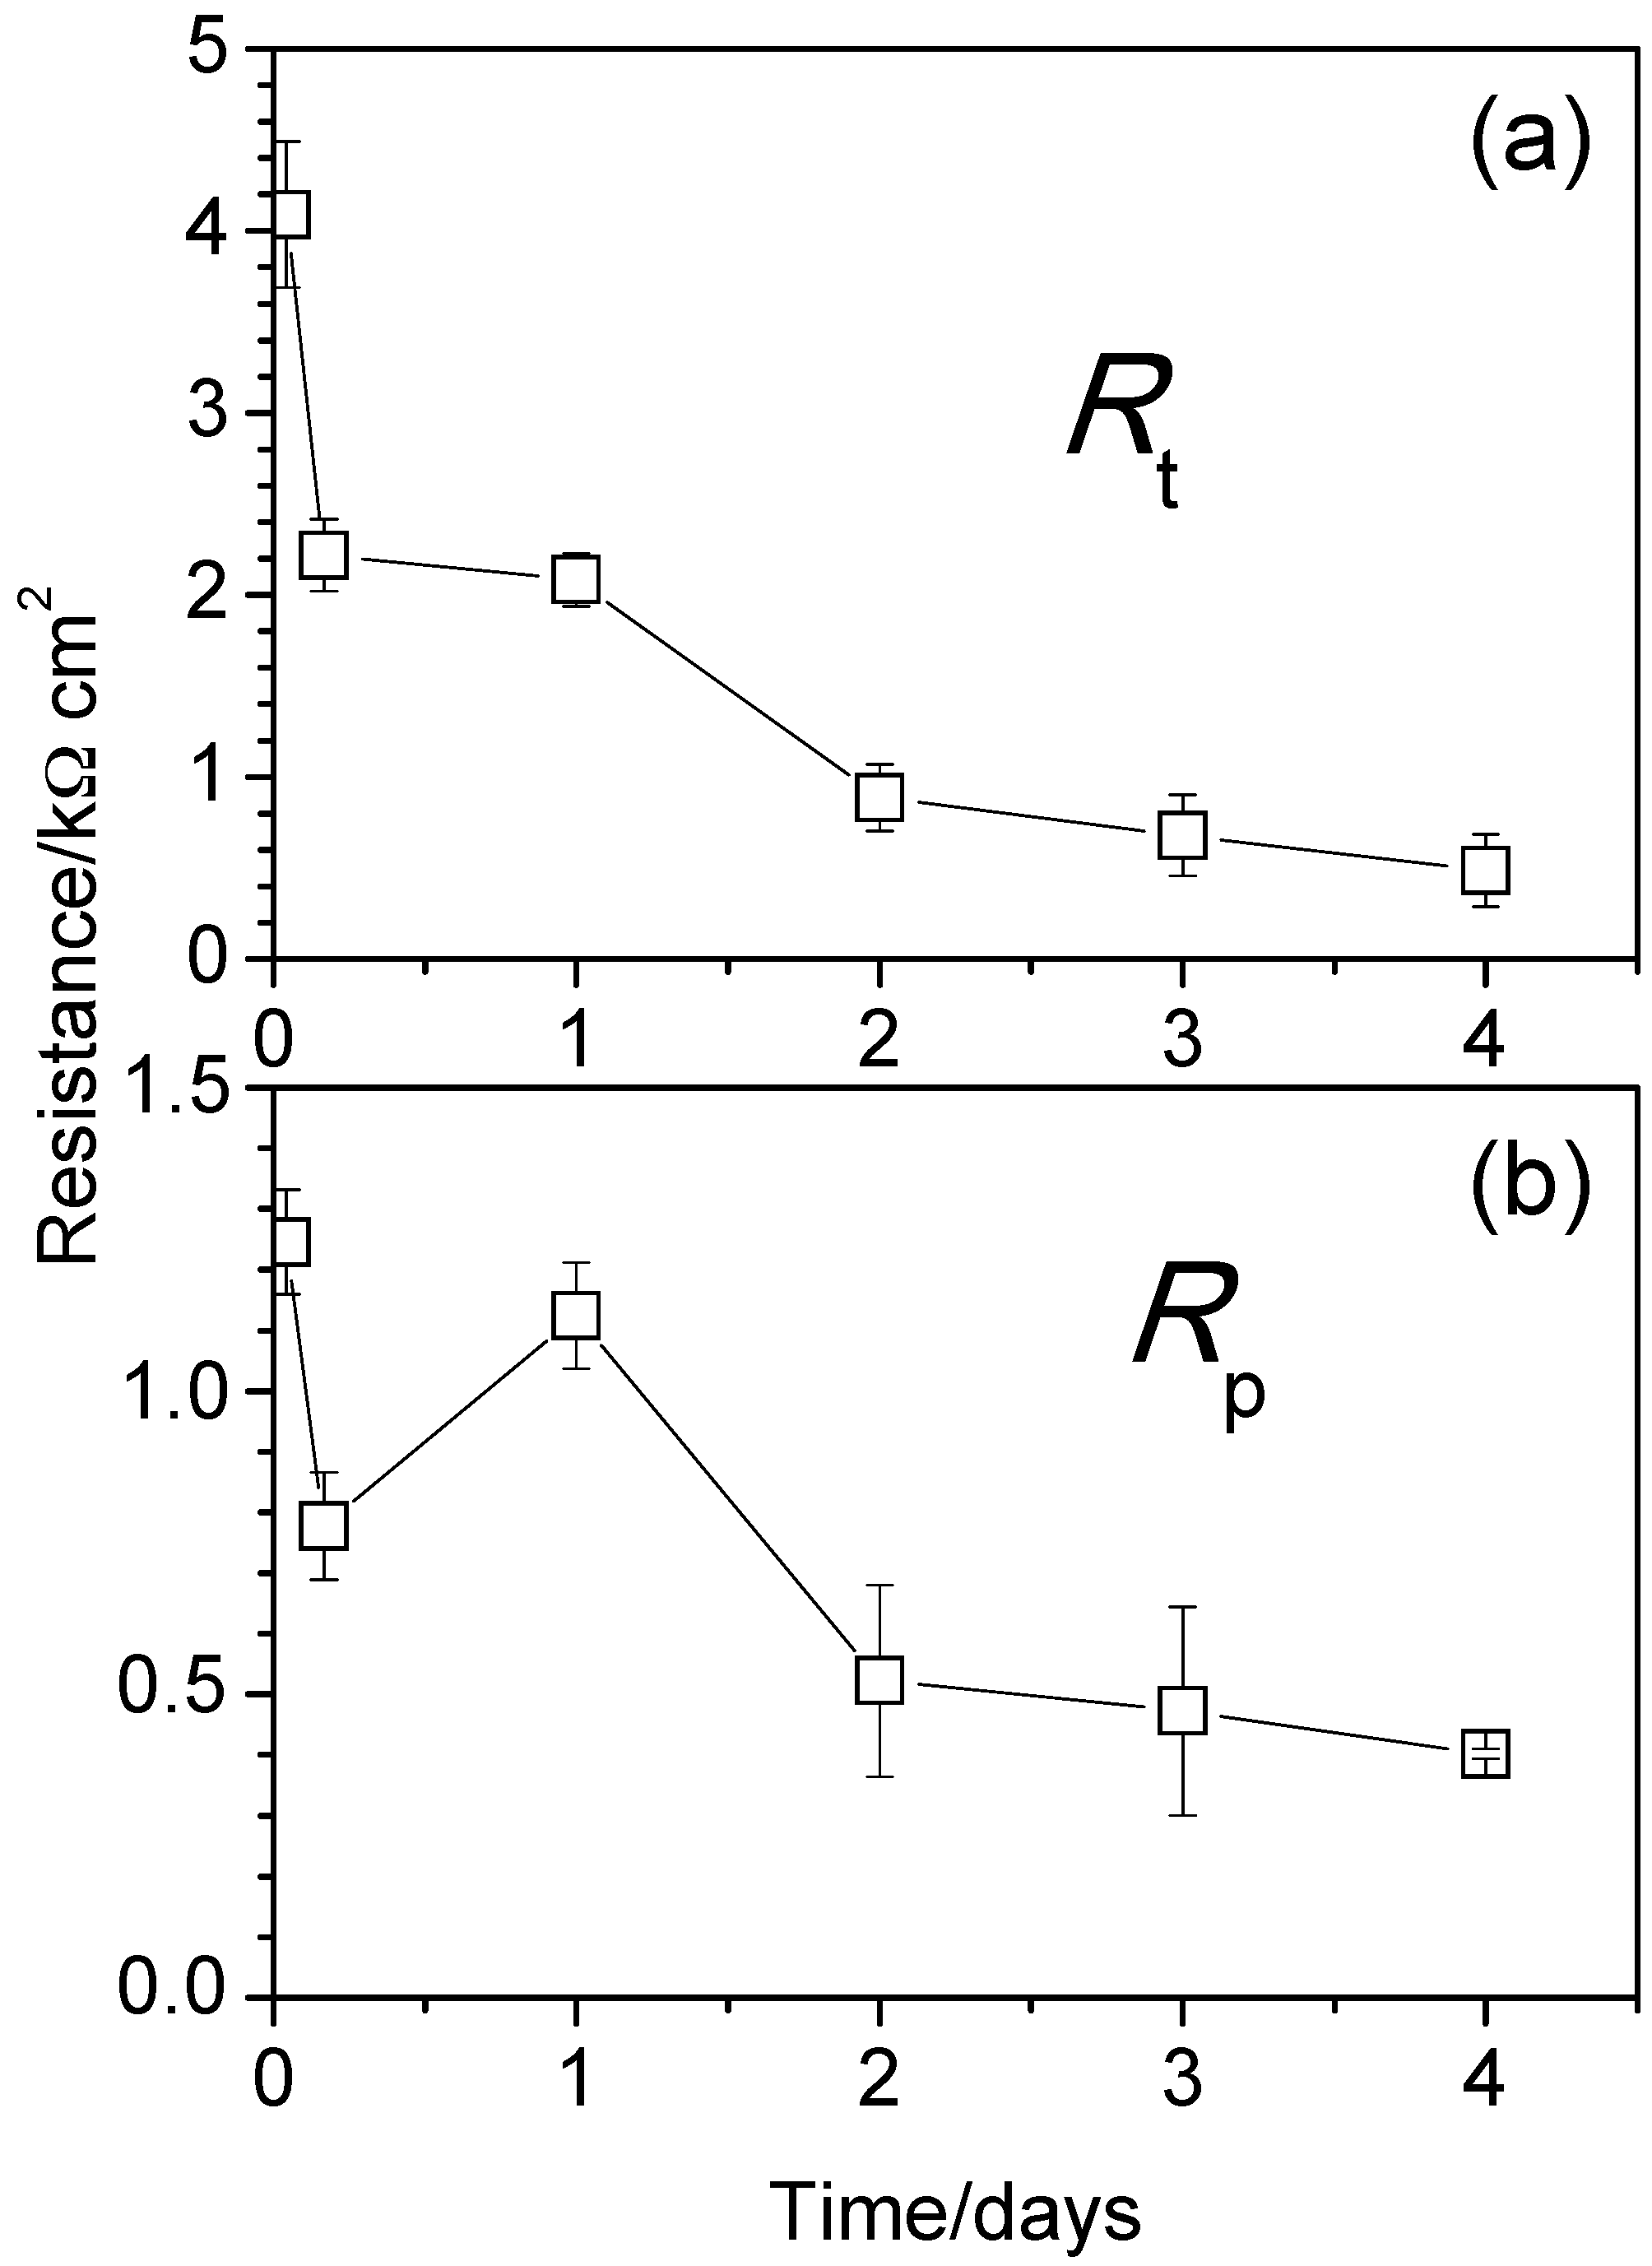
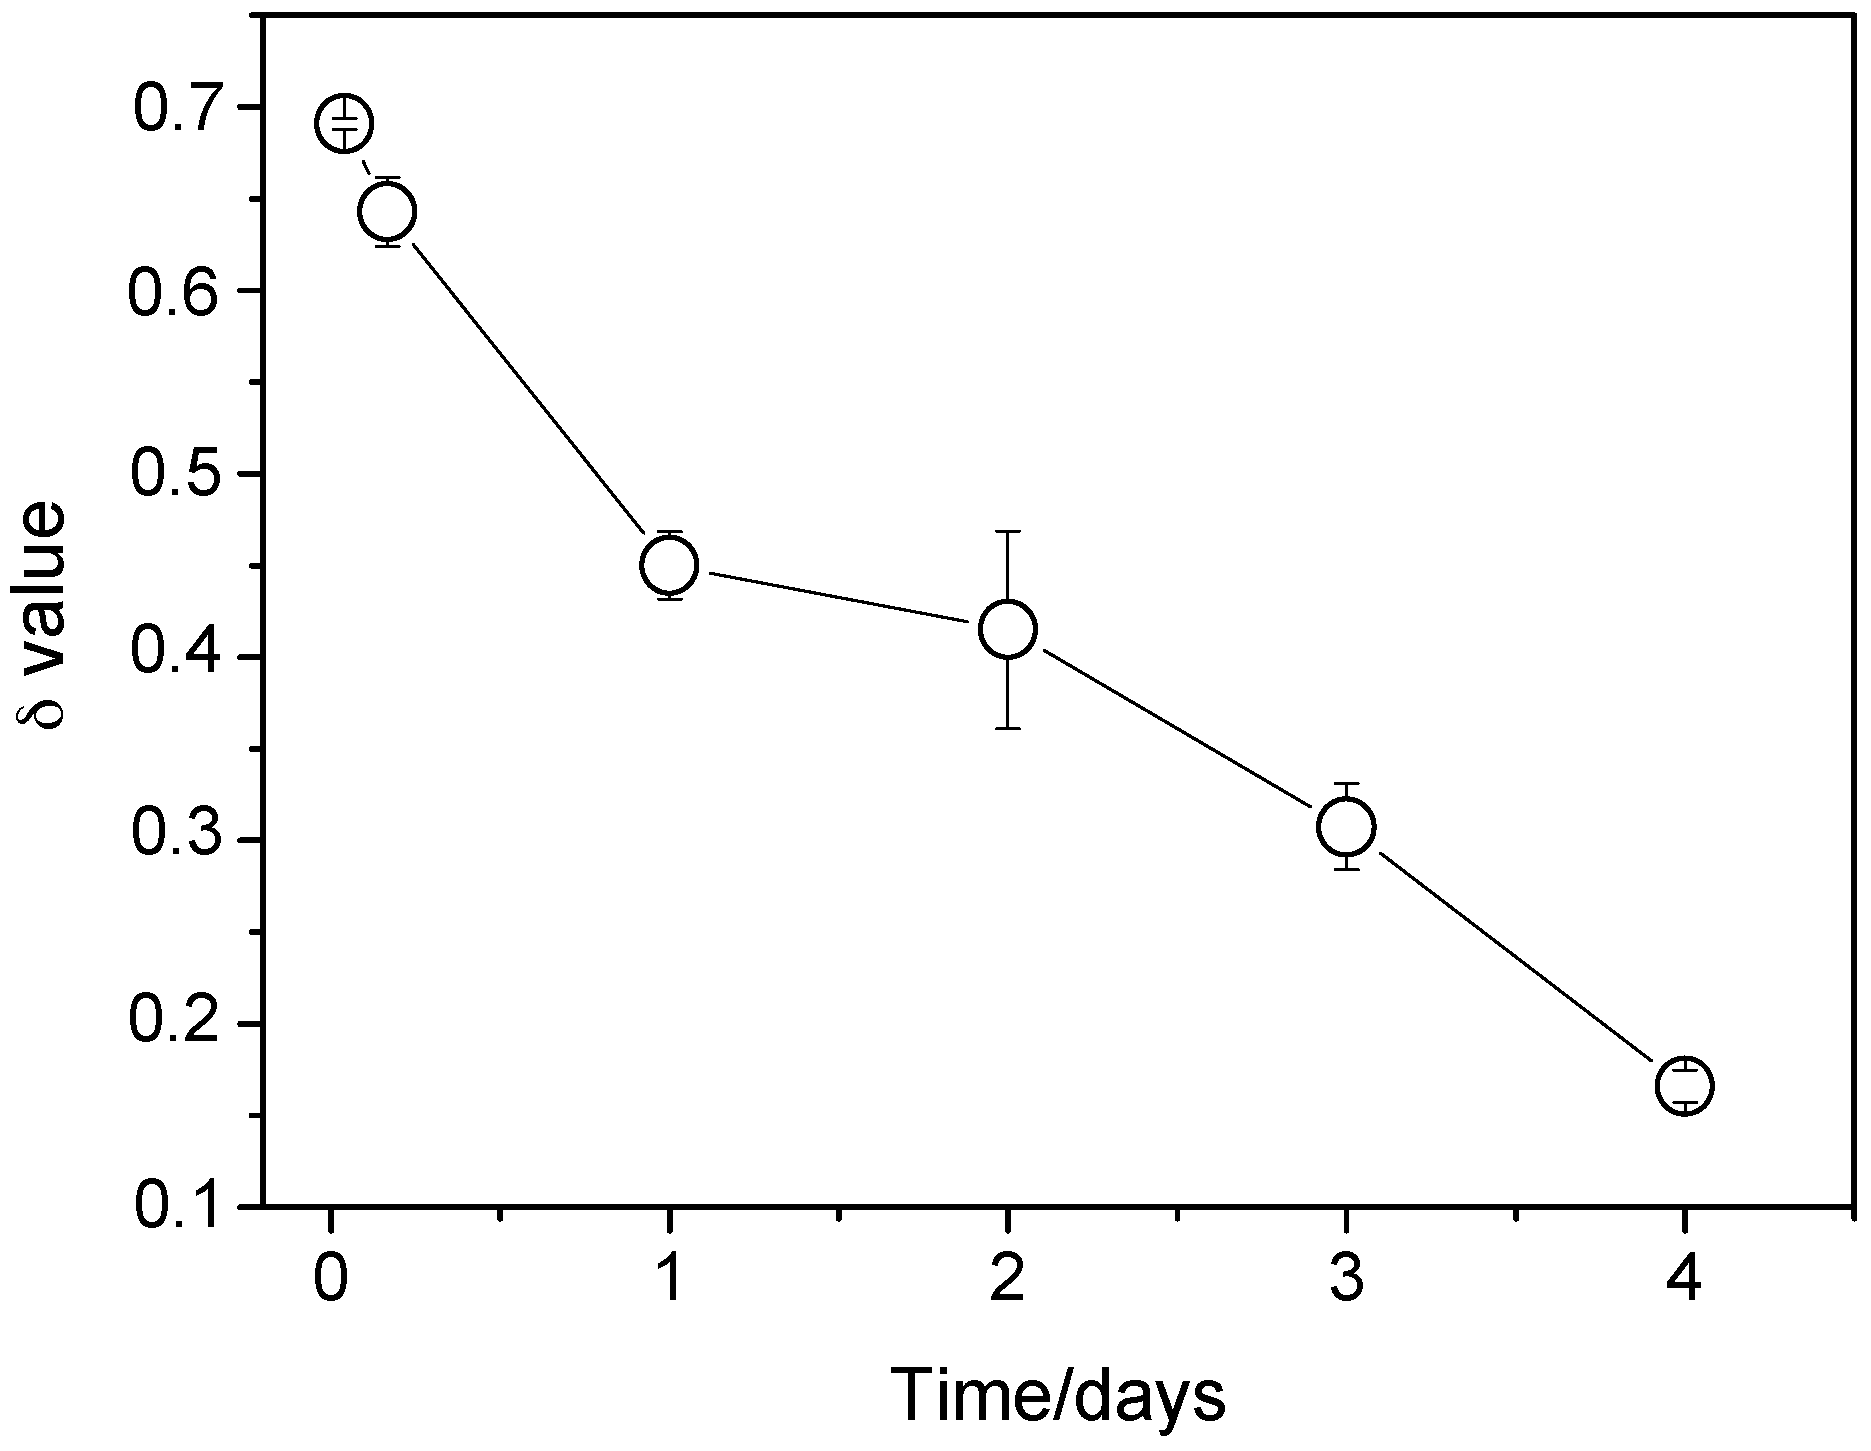
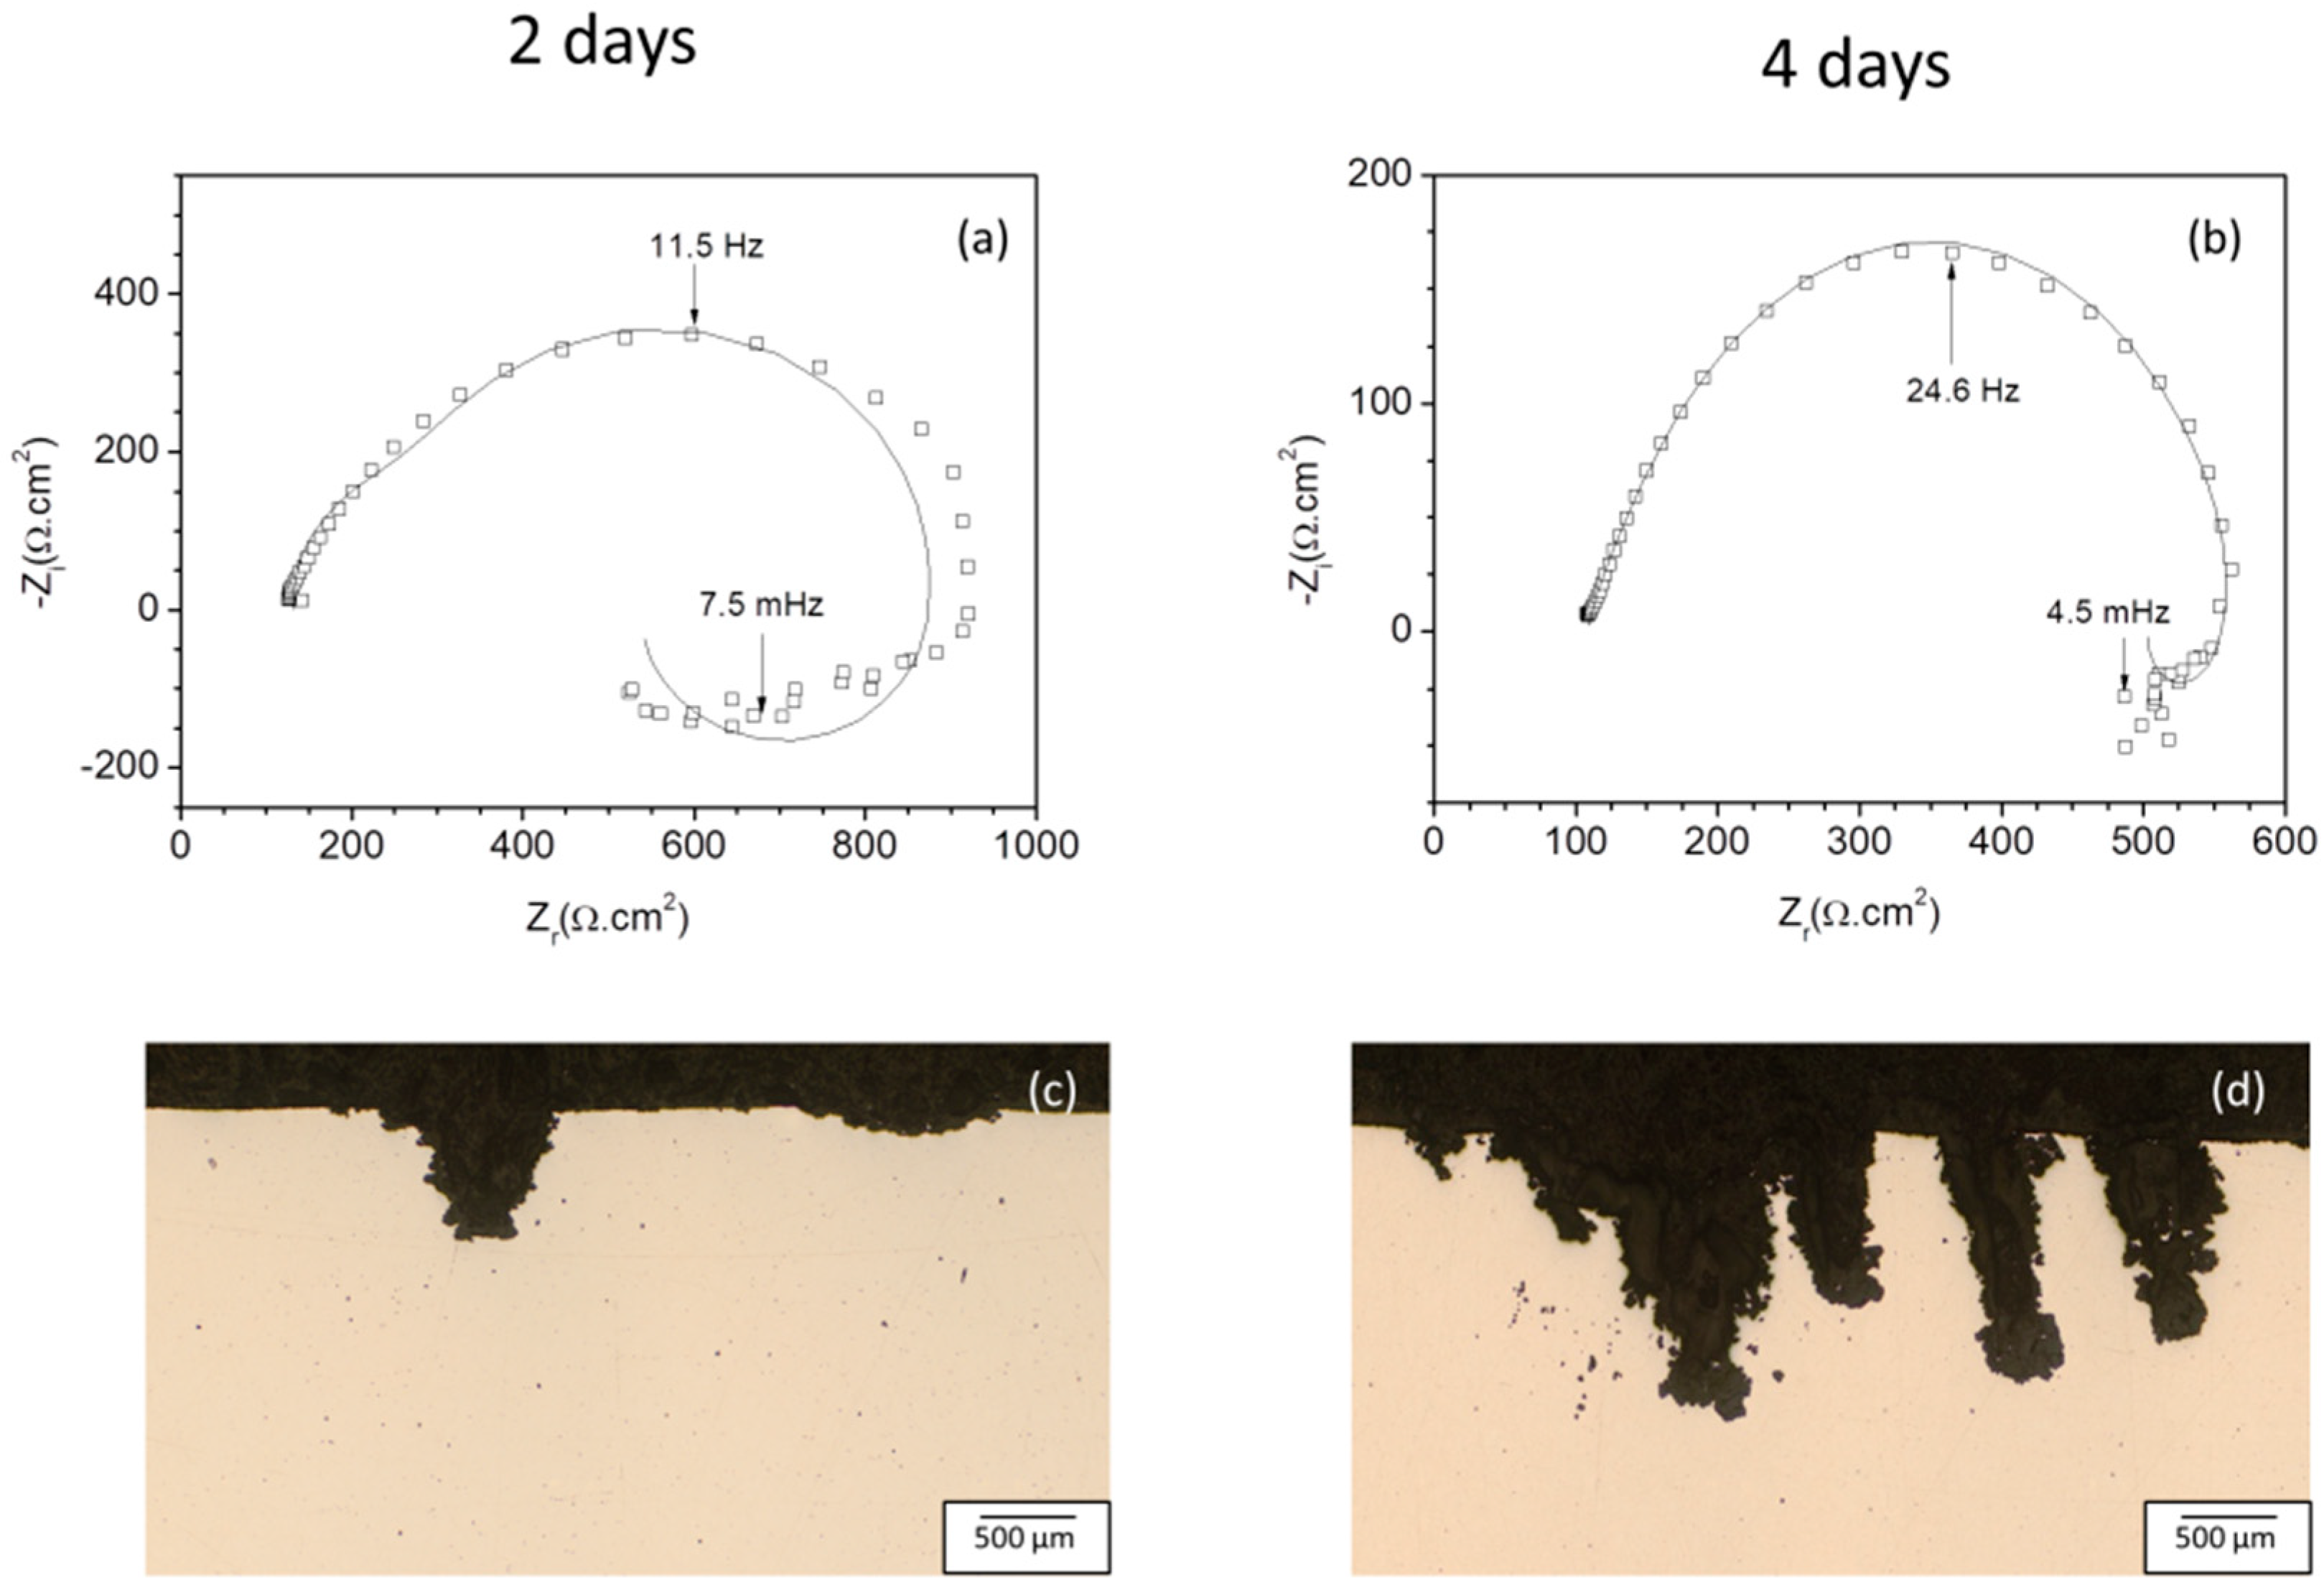
The volume of hydrogen gas (Figure 4) for the AZ31B samples immersed in Ringer’s solution for up to 4 days slowly increased during the first 24 h. After three days of immersion, the volume of hydrogen evolution increased markedly, indicating the formation of non-protective corrosion layer [61].

3.4. EIS Diagrams

Nyquist diagrams of AZ31B samples immersed in the Ringer’s solution (37 °C) display one semi-circle (Figure 5). The diameter decreases with time and at lower frequencies an inductive loop is visible, which decreases at the end of the experiment (enlarged impedance spectra in the top-left corner of Figure 5). The electrical equivalent circuit (EEC), used to fit the EIS diagrams is shown in Figure 6. Because of the depressed Nyquist diagram in the center (Figure 5), a constant phase element (CPE1) was introduced instead of the capacitor, as a characteristic of the electrical double layer in addition to the solution resistance (Rs) and the charge transfer resistance (Rt). An inductor (L) and a resistance (R1) have also been included to represent the inductive response appearing at the low frequency [38,62]. By using this EEC, a good fit is obtained with an average value of χ2 around 10−3.
The polarization resistance (Rp) values, corresponding to the equivalent circuit (Figure 6), were calculated using the following equation [34,46,47]:
1 R p = 1 R t + 1 R 1
Table 3 shows the results of the fitting of the electrochemical parameters with respect to the considered equivalent circuit. After the first hour of immersion, the values of the modulus of CPE1 (Q1) increased (Table 3), consistent with the changes occurring on the metal surface with the advance of the corrosion process. The exponent of the constant phase element (n1) decreased with immersion time (Table 3), being 0.78 after four days, significantly lower than 1, suggesting a behavior far from ideal, because of more pronounced heterogeneity and growth of large pits on AZ31B surface, as shown in Figure 1b. Besides, after the first hour of immersion of AZ31B, the Rt value was twice lower (Table 3), indicating decreased protective ability of the formed corrosion layer and as a consequence of the activation of the cathodic process [47]. No significant difference was observed in R1 values during the test period.
Figure 7 presents the time evolution of the Rt and Rp values extracted from the numerical fitting. Since the first day (24 h) the change in the Rp value (Figure 7b) generally followed the variation in the Rt value (Figure 7a).
Similar to other electrochemical methods, the value of the EIS-estimated resistance (R) is converted into a value of corrosion current density (jcorr), using the Stern-Geary equation [63]:
j c o r r = B / R
where B is the Stern Geary coefficient, a function of the anodic and cathodic Tafel slopes (βa and βc) [43,44]. Because there is no reasonable linear regions in the anodic branches of Mg and its alloys, the accuracy of the value of B obtained from the polarization curves is questionable [44,48,64]. The aforementioned problem made it necessary to use apparent Stern Geary coefficients B′ estimated from the calibration relationship between EIS and hydrogen evolution or mass loss measurements [48,49,51,65].
It has been demonstrated that the anodic charge obtained from the integration of the jcorr values, as found from the EIS measurements varying immersion periods (Equation (5)), is similar to the consumed anodic charge Q a W L found on the mass loss [34,46,47]:
Q a W L = j W L · t = j c o r r · d t = B R · d t
where jWL is the corrosion current found on the mass loss measurement. Assuming a constant value (with time > 3 days) of the ‘apparent’ Stern–Geary coefficient (B′) for a given metal/environment system [66], it follows:
B = Q a W L ( 1 R ) · d t
Table 4 lists the B′ values, empirically calculated from a comparison between the EIS data (Rt and Rp resistances) and mass loss measurement ( Q a W L ) of AZ31 tested samples after removal of the corrosion products.
The change in the corrosion current density (Equation (4)) as a function of the immersion period of AZ31B in Ringer’s solution (at 37 °C) is shown in Figure 8. For the current calculation the ‘apparent’ Stern–Geary coefficients B′ and EIS-estimated Rt and Rp values (Table 4) were used, as well the hydrogen evolution measurements (Figure 4). It can be seen that there is a good agreement between the corrosion current densities from EIS-estimated Rt values and hydrogen measurements, however, an overestimation of the corrosion current density was observed when considering EIS-estimated Rp values.
Similar to our previous studies [48,67], the contribution of the inductive response (difference between Rp and Rt [34]) has been quantified by using the ratio δ, obtained from the diameters of the inductive loop RtRp and the overall capacitive loop Rt. The evolution of the δ values with increasing immersion time is displayed in Figure 9. During the first hours the δ values are 0.5–0.7 but after four days they decrease significantly to approximately 0.1–0.2.
To illustrate the relationship between the localized pitting corrosion of AZ31B and the inductive behavior, Figure 10 presents a comparison between the EIS spectra after two (Figure 10a) and four (Figure 10b) days of immersion in the Ringer’s solution (37 °C) and the optical cross-sectional images of the tested samples (Figure 10c,d). It can be observed that the inductive loop size is independent of the severity of the pitting corrosion damage.

4. Discussion

4.1. Changes in the Chemistry of the Uniform Corrosion Layer Formed on AZ31B Mg-Alloy Surface in Ringer’s Solution and Correlation with EIS Results

Because of the high chloride concentration of Ringer’s solution (about 0.15 M), the formed insoluble magnesium hydroxide (Equation (1)) on the AZ31B Mg-alloy surface is transformed to a highly soluble MgCl2 (Equation (7)), which is a source of released magnesium ions (Equation (8)) and an increase of the local pH [3,38]:
Mg ( OH ) 2 + 2 Cl MgCl 2 + 2 OH
MgCl 2 Mg 2 + + 2 Cl
Instead of MgCl2, the results of this study may be suggestive for chloride association with aluminum, as evidenced by the EDS analysis of the corrosion layer (Figure 2c and Table 2). EDS results of Beldjoudi et al. [68] have shown that the corrosion products of AZ91 alloy exposed to 5% NaCl (saturated with Mg(OH)2), were enriched with Al but no Cl was detected. To our knowledge, there are no studies, which have established the presence of significant amounts of aluminum oxychlorides salts in the uniform corrosion layers formed on the magnesium-aluminum alloy surfaces, after being exposed to simulated physiological solutions. However, reported results for Al immersed in 1 M NaCl at pH = 11 suggest that because the concentration of Cl ions within the pits is much higher than that of OH ions, it may be expected that the hydrolyzed aluminum cations would complex with the chloride ions to form basic salts [69]. The low pH maintained inside the pit was also considered to be a consequence of the presence of aluminum salts in the interior of pit [70]. Although the reasons are still unclear, the accumulation of metal chloride at the metal interface should be considered as a promoter of the oxide film rupture and nucleation-propagation of growing pits [71]. Besides, the thickening of the formed corrosion layer could bring to the rupture in the surface layer (unfavorable Pilling Bedwoth ratio < 1).Thus, one could speculate that the formation of corrosion products with poorer protection properties and the increase in the tendency for pitting (Figure 10c,d) are promoted by the significant content of Cl in the form of aluminum oxychlorides salts, observed across the uniform corrosion layer grown on AZ31B after 2 days immersion in the Ringer’s solution (37 °C). For longer exposure times (4 days) the Cl disappears from the uniform corrosion layer. As the local pH value becomes quite alkaline, due to the creation of OH ions (Equation (7)), this fact may contribute to the increase of dissolution rate of the aluminum oxychlorides present in the uniform corrosion layers at the beginning of immersion test.
The shrinking of the EIS inductive loop with immersion time (Figure 5 and Figure 9) could be considered to be a consequence of the important decrease in the aluminum salts content observed in the uniform corrosion layer commented previously. Reports concerning the aluminum corrosion suggest that EIS diagrams present the appearance of low frequency pseudo-inductive loop when Cl ions are chemisorbed on aluminum-oxide surface and oxide-chloride complex [72], or aluminum salt film [73] is formed.

4.2. Correlation between Corrosion Current Densities Estimated by EIS and Hydrogen Evolution Volume

In our work integration over the exposure period was applied to correlate corrosion current values, estimated by EIS, hydrogen collected gas and gravimetric measurements. It should be noted that the corrosion current densities determined from parameter Rt quantitatively agree with the corrosion current densities calculated using independent hydrogen evolution measurement, over the whole duration of the measurement (Figure 8). Our suggestion is that R should be closely related only to the activation (charge-transfer) controlled cathodic process of hydrogen evolution, which occurs at the interface metal-electrolyte, in the absence of such control in the anodic process. With this assumption, Rt could be inserted in the Stern-Geary equation to estimate the corrosion current densities. If the parameter Rp and value of B′ = 204 mV are used (Table 4), the estimated corrosion current yielded 20–50% greater values than those based on the hydrogen evolution volumes during the first two days of AZ31B immersion in the Ringer’s solution at 37 °C (Figure 8). By prolonging immersion time, a significant decrease occurs in the differences between the corrosion current values derived from EIS-estimated Rp measurements and those derived from the hydrogen evolution. The reason is that Rp characterizes the overall corrosion process (cathodic and anodic, besides the surface changes), having a meaning more complex than that of the Rt values. We hypothesize that Rp may be composed of other resistances (in addition to Rt), such as diffusion of the reacting species, including passivation, adsorption and salt film Ohmic resistance. The electrochemical overestimation of the corrosion current, using the EIS-Rp values, may be assigned to a possible superposition, due to the initial formation of a salt film on the uniform corrosion layer and its subsequent dissolution during immersion of AZ31B in the Ringer’s solution.
With regard to the ‘apparent’ Stern–Geary coefficients B′, based on EIS-estimated Rt or Rp values (Table 4), the recent work reported by Curioni et al. [49,51] could serve as a reference, despite the use of the reciprocal Rt values. In our study, the estimated B′ is ∼317 mV for the AZ31B magnesium alloy exposed to the Ringer’s solution (at 37 °C), when the time-integrated reciprocal Rt resistance values were used. When AZ31B was exposed to 0.6 M NaCl (at 21 °C), the value was ~97 mV [48]. This difference should be attributed to the variance in the chemical composition of both tested solutions: The Ringer’s solution contains four times lower chloride concentration (0.15 M NaCl and with additional compounds) and the experiments were performed at higher temperature (37 °C). The nature of the metal or alloys and the specific corrosive environment could influence the value of B [66], which correlates to the Rp and the instantaneous corrosion rate. The results of our study suggest that the chloride concentration in the test solution is a critical factor for the Stern–Geary coefficient B′.

5. Conclusions

(1) The use of mass loss data and time-integrated reciprocal values of the charge transfer resistance Rt estimated by the EIS diagrams, allows to follow the variation in the corrosion current densities of AZ31B Mg-alloy as a function of the immersion time up to four days in Ringer’s solution (at 37 °C), similar to those measured by an independent chemical (I.e., non-electrochemical) method of hydrogen evolution.
(2) The value of the ‘apparent’ Stern–Geary coefficients B′ (≈ 300 mV) was empirically obtained.
(3) The marked decrease in the EIS inductive loop, with increased immersion time in the Ringer’s solution, tends to reflect the dissolution of aluminum chloride salt, which is probably formed across the uniform corrosion layer during the initial stages, as suggested by the EDS analysis.
(4) The formation and dissolution of metallic salt, as a part of the corrosion layer formed on AZ31 in the Ringer’s solution at 37 °C, seems to be responsible for the decrease in the accuracy of the corrosion current densities derived from EIS estimated Rp.

Author Contributions

M.G.F. performed the preparation of samples and their corrosion tests. L.V. and S.F. discussed the results and wrote the manuscript with contributions from all authors. L.V. and S.F. conceived and supervised the project. All correspondence should be addressed to S.F.

Funding

This research was funded by the Mexican National Council for Science and Technology (CONACYT) and the Spanish Ministry of Economy and Competitiveness (project MAT2015-65445-C2-1-R) for their financial support. Mareny Fernández-Olaya is grateful to CONACYT for her scholarship as an M.Sci. student at CINVESTAV-IPN and for the research stay at CENIM/CSIC (the National Centre for Metallurgical Research of Madrid, Spain).

Conflicts of Interest

The authors declare no conflict of interest.

References

  1. Song, G.; Song, S. A possible biodegradable magnesium implant material. Adv. Eng. Mater. 2007, 9, 298–302. [Google Scholar] [CrossRef]
  2. Witte, F.; Hort, N.; Vogt, C.; Cohen, S.; Kainer, K.U.; Willumeit, R.; Feyerabend, F. Degradable biomaterials based on magnesium corrosion. Curr. Opin. Solid State Mater. Sci. 2008, 2, 63–72. [Google Scholar] [CrossRef]
  3. Ascencio, M.; Pekguleryuz, M.; Omanovic, S. An investigation of the corrosion mechanisms of WE43 Mg alloy in a modified simulated body fluid solution: The influence of immersion time. Corros. Sci. 2014, 87, 489–503. [Google Scholar] [CrossRef]
  4. Ascencio, M.; Pekguleryuz, M.; Omanovic, S. An investigation of the corrosion mechanisms of WE43 Mg alloy in a modified simulated body fluid solution: The effect of electrolyte renewal. Corros. Sci. 2015, 91, 297–310. [Google Scholar] [CrossRef]
  5. Mao, L.; Shen, L.; Chen, J.H.; Zhang, X.B.; Kwak, M.; Wu, Y.; Fan, R.; Zhang, L.; Pei, J.; Yuan, G.Y.; et al. A promising biodegradable magnesium alloy suitable for clinical vascular stent application. Sci. Rep. 2017, 7, 46343. [Google Scholar] [CrossRef] [PubMed] [Green Version]
  6. Seiler, H.G.; Sigel, H.; Sigel, A. Handbook on Toxicity of Inorganic Compounds; Marcel Dekker Inc.: New York, NY, USA, 1988. [Google Scholar]
  7. Witte, F.; Kaese, V.; Haferkamp, H.; Switzer, E.; Meyer-Lindenberg, A.; Wirth, C.J.; Windhagen, H. In vivo corrosion of four magnesium alloys and the associated bone response. Biomaterials 2005, 26, 3557–3563. [Google Scholar] [CrossRef] [PubMed]
  8. Zhang, E.; Xu, L.P.; Yang, K. Formation by ion plating of Ti-coating on pure Mg for biomedical applications. Scr. Mater. 2005, 53, 523–527. [Google Scholar] [CrossRef]
  9. Xiong, H.Q.; Liang, Z.F.; Wang, Z.F.; Qin, C.L.; Zhao, W.M.; Yu, H. Mechanical properties and degradation behavior of Mg(100-7x)Zn6xYx(x = 0.2, 0.4, 0.6, 0.8) alloys. Metals 2018, 8, 261. [Google Scholar] [CrossRef]
  10. Staiger, M.P.; Pietak, A.M.; Huadmai, J.; Dias, G. Magnesium and its alloys as orthopedic biomaterials: A review. Biomaterials 2006, 27, 1728–1734. [Google Scholar] [CrossRef] [PubMed]
  11. Witte, F.; Fischer, J.; Nellesen, J.; Crostack, H.-A.; Kaese, V.; Pisch, A.; Beckmann, F.; Windhagen, H. In vitro and in vivo corrosion measurements of magnesium alloys. Biomaterials 2006, 27, 1013–1018. [Google Scholar] [CrossRef] [PubMed]
  12. Keim, S.; Brunner, J.G.; Fabry, B.; Virtanen, S. Control of magnesium corrosion and biocompatibility with biomimetic coatings. J. Biomed. Mater. Res. B 2011, 96, 84–90. [Google Scholar] [CrossRef] [PubMed]
  13. Waizy, H.; Seitz, J.M.; Reifenrath, J.; Weizbauer, A.; Bach, F.W.; Meyer-Lindenberg, A.; Denkena, B.; Windhagen, H. Biodegradable magnesium implants for orthopedic applications. J. Mater. Sci. 2013, 48, 39–50. [Google Scholar] [CrossRef]
  14. Hiromoto, S.; Inoue, M.; Taguchi, T.; Yamane, M.; Ohtsu, N. In vitro and in vivo biocompatibility and corrosion behavior of a bioabsorbable magnesium alloy coated with octacalcium phosphate and hydroxyapatite. Acta Biomater. 2015, 11, 520–530. [Google Scholar] [CrossRef] [PubMed]
  15. Gray-Munro, J.E.; Seguin, C.; Strong, M. Influence of surface modification on the in vitro corrosion rate of magnesium alloy AZ31. J. Biomed. Mater. Res. A 2009, 91, 221–230. [Google Scholar] [CrossRef] [PubMed]
  16. Duygulu, O.; Kaya, R.A.; Oktay, G.; Kaya, A.A. Investigation on the potential of Magnesium alloy AZ31 as a bone implant. Mater. Sci. Forum 2007, 546, 421–424. [Google Scholar] [CrossRef]
  17. Zhang, L.; Zhang, J.; Chen, C.F.; Gu, Y. Advances in microarc oxidation coated AZ31 Mg alloys for biomedical applications. Corros. Sci. 2015, 91, 7–28. [Google Scholar] [CrossRef]
  18. Srinivasan, A.; Shin, K.S.; Rajendran, N. Influence of bicarbonate concentration on the conversion layer formation onto AZ31 magnesium alloy and its electrochemical corrosion behavior in simulated body fluid. RSC Adv. 2016, 6, 49910–49922. [Google Scholar] [CrossRef]
  19. Witte, F.; Abeln, I.; Switzer, E.; Kaese, V.; Meyer-Lindenberg, A.; Windhagen, H. Evaluation of the skin sensitizing potential of biodegradable magnesium alloys. J. Biomed. Mater. Res. A 2008, 86, 1041–1047. [Google Scholar] [CrossRef] [PubMed]
  20. Xue, D.C.; Yun, Y.H.; Tan, Z.Q.; Dong, Z.Y.; Schulz, M.J. In Vivo and in vitro degradation behavior of Magnesium alloys as biomaterials. J. Mater. Sci. Technol. 2012, 28, 261–267. [Google Scholar] [CrossRef]
  21. Wei, L.Y.; Westengen, H.; Aune, T.K.; Albright, D. Characterisation of manganese-containing intermetallic particles and corrosion behavior of die cast Mg-Al-based alloys. In Magnesium Technology 2000; Kaplan, H.L., Hryn, J.N., Eds.; The Minerals, Metals and Materials Society (TMS): Nashville, TN, USA, 2000; pp. 153–160. [Google Scholar]
  22. Cao, P.; StJohn, D.H.; Qian, M. The effect of manganese on the grain size of commercial AZ31 alloy. Mater. Sci. Forum 2005, 488, 139–142. [Google Scholar] [CrossRef]
  23. Cheng, Y.L.; Qin, T.W.; Wang, H.M.; Zhang, Z. Comparison of corrosion behaviors of AZ31, AZ91, AM60 and ZK60 magnesium alloys. Trans. Nonferr. Met. Soc. China 2009, 19, 517–524. [Google Scholar] [CrossRef]
  24. Liu, F.; Song, Y.; Shan, D.; Han, E. Corrosion behavior of AZ31 magnesium alloy in simulated acid rain solution. Trans. Nonferr. Met. Soc. China 2010, 20, 638–642. [Google Scholar] [CrossRef]
  25. Pawar, S.; Zhou, X.; Thompson, G.E.; Scamans, G.; Fan, Z. The role of intermetallics on the corrosion initiation of twin roll cast AZ31 Mg alloy. J. Electrochem. Soc. 2015, 162, C442–C448. [Google Scholar] [CrossRef]
  26. Song, G.; Atrens, A. Understanding magnesium corrosion—A framework for improved alloy performance. Adv. Eng. Mater. 2003, 5, 837–858. [Google Scholar] [CrossRef]
  27. Eliezer, D.; Uzan, P.; Aghion, E. Effect of second phases on the corrosion behavior of magnesium alloys. Mater. Sci. Forum 2003, 419, 857–866. [Google Scholar] [CrossRef]
  28. Zeng, R.-C.; Zhang, J.; Huang, W.-J.; Dietzel, W.; Kainer, K.; Blawert, C.; Wei, K. Review of studies on corrosion of magnesium alloys. Trans. Nonferr. Met. Soc. China 2006, 16, s763–s771. [Google Scholar] [CrossRef]
  29. Xin, Y.; Hu, T.; Chu, P.K. In vitro studies of biomedical magnesium alloys in a simulated physiological environment: A review. Acta Biomater. 2011, 7, 1452–1459. [Google Scholar] [CrossRef] [PubMed]
  30. Mena-Morcillo, E.; Veleva, L.; Wipf, D.O. In situ investigation of the initial stages of AZ91D Magnesium alloy biodegradation in simulated body fluid. Int. J. Electrochem. Sci. 2018, 13, 5141–5150. [Google Scholar] [CrossRef]
  31. Mena-Morcillo, E.; Veleva, L.; Wipf, D.O. Multi-scale monitoring the first stages of electrochemical behavior of AZ31B magnesium alloy in simulated body fluid. J. Electrochem. Soc. 2018, 165, C749–C755. [Google Scholar] [CrossRef]
  32. Saikrishna, N.; Reddy, G.P.K.; Munirathinam, B.; Sunil, B.R. Influence of bimodal grain size distribution on the corrosion behavior of friction stir processed biodegradable AZ31 magnesium alloy. J. Magn. Alloys 2016, 4, 68–76. [Google Scholar] [CrossRef]
  33. Kirkland, N.T.; Birbilis, N.; Staiger, M. Assessing the corrosion of biodegradable magnesium implants: A critical review of current methodologies and their limitations. Acta Biomater. 2012, 8, 925–936. [Google Scholar] [CrossRef] [PubMed]
  34. King, A.D.; Birbilis, N.; Scully, J.R. Accurate electrochemical measurement of magnesium corrosion rates; a combined impedance, mass-loss and hydrogen collection study. Electrochim. Acta 2014, 121, 394–406. [Google Scholar] [CrossRef]
  35. Tkacz, J.; Minda, J.; Fintová, S.; Wasserbauer, J. Comparison of electrochemical methods for the evaluation of cast AZ91 Magnesium alloy. Materials 2016, 9, 925. [Google Scholar] [CrossRef] [PubMed]
  36. Yang, Y.; Scenini, F.; Curioni, M. A study on magnesium corrosion by real-time imaging and electrochemical methods: Relationship between local processes and hydrogen evolution. Electrochim. Acta 2016, 198, 174–184. [Google Scholar] [CrossRef]
  37. Cao, F.; Shi, Z.; Hofstetter, J.; Uggowitzed, P.J.; Song, G.; Liu, M.; Atrens, A. Corrosion of ultra-high-purity Mg in 3.5% NaCl solution saturated with Mg(OH)2. Corros. Sci. 2013, 75, 78–99. [Google Scholar] [CrossRef]
  38. Jamesh, M.; Kumar, S.; Sankara Narayanan, T.S.N. Corrosion behavior of commercially pure Mg and ZM21 Mg alloy in Ringer’s solution—Long term evaluation by EIS. Corros. Sci. 2011, 53, 645–654. [Google Scholar] [CrossRef]
  39. Jamesh, M.I.; Wu, G.S.; Zhao, Y.; McKenzie, D.R.; Bilek, M.M.M.; Chu, P.K. Effects of zirconium and oxygen plasma ion implantation on the corrosion behavior of ZK60 Mg alloy in simulated body fluids. Corros. Sci. 2014, 82, 7–26. [Google Scholar] [CrossRef]
  40. Tkacz, J.; Sloukova, K.; Minda, J.; Drabikova, J.; Fintova, S.; Dolezal, P.; Wasserbauer, J. Influence of the composition of the Hank’s balanced salt solution on the corrosion behavior of AZ31 and AZ61 magnesium alloys. Metals 2017, 7, 465. [Google Scholar] [CrossRef]
  41. Lorenz, W.J.; Mansfeld, F. Determination of corrosion rates by electrochemical DC and AC methods. Corros. Sci. 1981, 21, 647–672. [Google Scholar] [CrossRef]
  42. Song, G.; Shi, Z. Corrosion mechanism and evaluation of anodized magnesium alloys. Corros. Sci. 2014, 85, 126–140. [Google Scholar] [CrossRef] [Green Version]
  43. Feliu, S., Jr.; Galván, J.C.; Pardo, A.; Merino, M.C. Estimation of the corrosion rate in circumstances of difficult implementation of the common methods for electrochemical measurements. In Applied Electrochemistry (Chemistry Research and Applications) 2009; Singh, V.G., Ed.; Nova Science Publishers, Inc.: Hauppauge, NY, USA, 2009; pp. 387–403. [Google Scholar]
  44. Feliu, S., Jr.; Garcia-Galvan, F.R.; Llorente, I.; Diaz, L.; Simancas, J. Influence of hydrogen bubbles adhering to the exposed surface on the corrosion rate of magnesium alloys AZ31 and AZ61 in sodium chloride solution. Mater. Corros. 2017, 68, 651–663. [Google Scholar] [CrossRef]
  45. Makar, G.L.; Kruger, J. Corrosion studies of rapidly solidified Magnesium alloys. J. Electrochem. Soc. 1990, 137, 414–421. [Google Scholar] [CrossRef]
  46. Bland, L.G.; King, A.D.; Birbilis, N.; Scully, J.R. Assessing the corrosion of commercially pure magnesium and commercial AZ31B by electrochemical impedance, mass-loss, hydrogen collection and inductively coupled plasma optical emission spectrometry solution analysis. Corrosion 2015, 71, 128–145. [Google Scholar] [CrossRef]
  47. Bland, L.G.; Scully, L.C.; Scully, J.R. Assessing the corrosion of multi-phase Mg-Al alloys with high Al content by electrochemical impedance, mass loss, hydrogen collection and inductively coupled plasma optical emission spectrometry solution analysis. Corrosion 2017, 73, 526–543. [Google Scholar] [CrossRef]
  48. Delgado, M.C.; Garcia-Galvan, F.R.; Barranco, V.; Feliu, S., Jr. A measuring approach to assess the corrosion rate of magnesium alloys using electrochemical impedance measurements. In Magnesium Alloys; Aliofkhazraei, M., Ed.; Intech: Rijeka, Croatia, 2017; pp. 129–159. [Google Scholar]
  49. Liu, Y.X.; Curioni, M.; Liu, Z. Correlation between electrochemical impedance measurements and corrosion rates of Mg-1Ca alloy in simulated body fluid. Electrochim. Acta 2018, 264, 101–108. [Google Scholar] [CrossRef]
  50. Pebere, N.; Riera, C.; Dabosi, F. Investigation of magnesium corrosion in aerated sodium-sulfate solution by electrochemical impedance spectroscopy. Electrochim. Acta 1990, 35, 555–561. [Google Scholar] [CrossRef]
  51. Curioni, M.; Scenini, F.; Monetta, T.; Bellucci, F. Correlation between electrochemical impedance measurements and corrosion rate of magnesium investigated by real-time hydrogen measurement and optical imaging. Electrochim. Acta 2015, 166, 372–384. [Google Scholar] [CrossRef] [Green Version]
  52. Xin, Y.; Hu, T.; Chu, P.K. Degradation behavior of pure magnesium in simulated body fluids with different concentrations of HCO3. Corros. Sci. 2011, 53, 1522–1528. [Google Scholar] [CrossRef]
  53. Mathieu, S.; Rapin, C.; Hazan, J.; Steinmetz, P. Corrosion behavior of high pressure die-cast and semi-solid cast AZ91D alloys. Corros. Sci. 2002, 44, 2737–2756. [Google Scholar] [CrossRef]
  54. Baril, G.; Blanc, C.; Keddam, M.; Pebere, N. Local electrochemical impedance spectroscopy applied to the corrosion behavior of an AZ91 magnesium alloy. J. Electrochem. Soc. 2003, 150, B488–B493. [Google Scholar] [CrossRef]
  55. Baril, G.; Blanc, C.; Pebere, N. AC impedance spectroscopy in characterizing time-dependent corrosion of AZ91 and AM50 magnesium alloys—Characterization with respect to their microstructures. J. Electrochem. Soc. 2001, 148, B489–B496. [Google Scholar] [CrossRef]
  56. Xin, Y.; Huo, K.; Tao, H.; Tang, G.; Chu, P.K. Influence of aggressive ions on the degradation behavior of biomedical magnesium alloy in physiological environment. Acta Biomater. 2008, 4, 2008–2015. [Google Scholar] [CrossRef] [PubMed]
  57. ISO 16428, Implants for Surgery—Test Solutions and Environmental Conditions for Static and Dynamic Corrosion Tests on Implantable Materials and Medical Devices. 2005. Available online: https://www.iso.org/standard/30280.html (accessed on 9 November 2018).
  58. Song, G.; Atrens, A.; Stjohn, D. An hydrogen evolution method for the estimation of the corrosion rate of Magnesium alloys. In Essential Readings in Magnesium Technology; Suveen, N.M., Alan, A.L., Neale, N.R., Eric, A.N., Wim, H.S., Eds.; John Wiley & Sons, Inc.: Hoboken, NJ, USA, 2014; pp. 565–572. [Google Scholar]
  59. Wang, B.; Zhang, L.W.; Su, Y.; Xiao, Y.; Liu, J. Corrosion behavior of 5A05 aluminum alloy in NaCl solution. Acta Metall. Sin. (Engl. Lett.) 2013, 26, 581–587. [Google Scholar] [CrossRef]
  60. Lucuta, P.G.; Halliday, J.D.; Christian, B. Phase evolution in Al2O3 fibre prepared from an oxychloride precursor. J. Mater. Sci. 1992, 27, 6053–6061. [Google Scholar] [CrossRef]
  61. Zhang, J.; Yang, D.H.; Ou, X.B. Microstructures and properties of aluminum film and its effect on corrosion resistance of AZ31B substrate. Trans. Nonferr. Metals Soc. China 2008, 18, s312–s317. [Google Scholar] [CrossRef]
  62. Li, Z.C.; Song, G.L.; Song, S.Z. Effect of bicarbonate on biodegradation behavior of pure magnesium in a simulated body fluid. Electrochim. Acta 2014, 115, 56–65. [Google Scholar] [CrossRef]
  63. Stern, M.; Geary, A.L. Electrochemical polarization-1. A theoretical analysis of the shape of polarization curves. J. Electrochem. Soc. 1957, 104, 56–63. [Google Scholar] [CrossRef]
  64. McCafferty, E. Validation of corrosion rates measured by the Tafel extrapolation method. Corros. Sci. 2005, 47, 3202–3215. [Google Scholar] [CrossRef]
  65. Feliu, S., Jr.; Maffiotte, C.; Samaniego, A.; Galván, J.C.; Barranco, V. Effect of the chemistry and structure of the native oxide surface film on the corrosion properties of commercial AZ31 and AZ61 alloys. Appl. Surf. Sci. 2011, 257, 8558–8568. [Google Scholar] [CrossRef] [Green Version]
  66. Hsieh, M.K.; Dzombak, D.A.; Vidie, R.D. Bridging gravimetric and electrochemical approaches to determine the corrosion rate of metals and metal alloys in cooling systems: Bench scale evaluation method. Ind. Eng. Chem. Res. 2010, 49, 9117–9123. [Google Scholar] [CrossRef]
  67. Feliu, S., Jr.; Maffiotte, C.; Samaniego, A.; Galvan, J.C.; Barranco, V. Effect of naturally formed oxide films and other variables in the early stages of Mg-alloy corrosion in NaCl solution. Electrochim. Acta 2011, 56, 4454–4565. [Google Scholar] [CrossRef]
  68. Beldjoudi, T.; Fiaud, C.; Robbiola, L. Influence of homogenization and artificial aging heat-treatments on corrosion behavior of Mg–Al alloys. Corrosion 1993, 49, 738–745. [Google Scholar] [CrossRef]
  69. Wong, K.P.; Alkire, R.C. Local chemistry and growth of single corrosion pits in aluminum. J. Electrochem. Soc. 1990, 137, 3010–3015. [Google Scholar] [CrossRef]
  70. Silva, F.S.D.; Bedoya, J.; Dosta, S.; Cinca, N.; Cano, I.G.; Guilemany, J.M.; Benedetti, A.V. Corrosion characteristics of cold gas spray coatings of reinforced aluminum deposited onto carbon steel. Corros. Sci. 2017, 114, 57–71. [Google Scholar] [CrossRef]
  71. Burstein, G.T.; Liu, C.; Souto, R.M. The effect of temperature on the nucleation of corrosion pits on titanium in Ringer’s physiological solution. Biomaterials 2005, 26, 245–256. [Google Scholar] [CrossRef] [PubMed]
  72. Garrigues, L.; Pebere, N.; Dabosi, F. An investigation of the corrosion inhibition of pure aluminum in neutral and acidic chloride solutions. Electrochim. Acta 1996, 41, 1209–1215. [Google Scholar] [CrossRef]
  73. Lee, E.J.; Pyun, S.I. The effect of oxide chemistry on the passivity of aluminum surfaces. Corros. Sci. 1995, 37, 157–168. [Google Scholar] [CrossRef]
Figure 1. (a) BSE images showing AZ31B surface after immersion in Ringer’s solution (37 °C) for 2 days; (b) 4 days.
Metals 08 00933 g001
Figure 2. (a,d) BSE images and (b,c,e,f) EDS quantitative analysis of the cross-section of the uniform corrosion layer formed on AZ3B1 surface after immersion in Ringer’s solution (37 °C) for (ac) 2 days and (df) 4 days.
Metals 08 00933 g002
Figure 3. Low-angle XRD spectra of AZ31B surface after immersion in Ringer’s solution (37 °C) for 2 and 4 days.
Metals 08 00933 g003
Figure 4. Volume of hydrogen evolution from AZ31B after immersion in Ringer’s solution (37 °C) for 4 days.
Metals 08 00933 g004
Figure 5. Examples of Nyquist diagrams with respective fitting line for AZ31B samples after 1 h, 1 and 4 days of immersion at open circuit potential in Ringer’s solution (37 °C).
Metals 08 00933 g005
Figure 6. The equivalent circuit used for fitting experimental EIS spectra of AZ31B immersed in Ringer’s solution (37 °C).
Metals 08 00933 g006
Figure 7. Variations in the resistances obtained from fitting of the EIS spectra of AZ31B, as a function of immersion time in Ringer’s solution (37 °C). Scatter bands are the standard deviation of 3 measurements.
Metals 08 00933 g007
Figure 8. Variation in corrosion current density (mA cm−2) as a function of immersion time, obtained from EIS and hydrogen evolution measurements during immersion of AZ31B alloy in the Ringer’s solution for 4 days (37 °C).
Metals 08 00933 g008
Figure 9. Evolution of the δ values with immersion time of AZ31B in Ringer’s solution (37 °C). Scatter bands are the standard deviation of 3 measurements.
Metals 08 00933 g009
Figure 10. Comparison between electrochemical impedance spectra obtained from AZ31B exposed in Ringer’s solution (37 °C) for 2 and 4 days (a,b) and optical cross-sectional images of samples tested under similar conditions (c,d).
Metals 08 00933 g010
Table 1. Chemical composition of AZ31B magnesium alloy (X-ray fluorescence analysis).
ElementMgAlZnMn
Wt%95.83.01.00.2
Table 2. Atomic composition (EDS) of the cross-section of uniform corrosion layer formed on AZ31B surface after immersion in Ringer’s solution (37 °C) for 2 and 4 days. Average values from 20 spectra.
Exposure Time (days)O (at%)Mg (at%)Al (at%)Cl (at%)Zn (at%)Cl/Al at.ratio
245 ± 643 ± 83.5 ± 17.0 ± 21.5 ± 0.52.0 ± 0.4
455 ± 145 ± 10.0 ± 0.10.1 ± 0.10.1 ± 0.10.0 ± 0.1
Table 3. Fitting parameters obtained from the EIS measurements of AZ31 immersed in Ringer’s solution (37 °C) up to 4 days.
Immersion TimeRS
(KΩ·cm2)
Q1
(sn/Ω·cm2)
n1Rt
(KΩ·cm2)
R1
(KΩ·cm2)
L
(H·cm2)
Rp
(KΩ·cm2)
1h0.19.1 × 10−60.924.31.93.01.3
1d0.12.2 × 10−50.872.22.64.21.2
4d0.13.8 × 10−50.780.52.20.50.4
Table 4. ‘Apparent’ Stern–Geary coefficient values B′, calculated from EIS-estimated Rt or Rp values for AZ31B magnesium alloy immersed in Ringer’s solution (37 °C) up to 4 days and anodic charge Q a W L determined by mass loss of the EIS tested sample.
Exposure Time (days)Mass Loss (mg·cm−2·day) Q a W L   ( mA · cm 2 · day ) ( 1 R t )   d t   ( Ω 1 · cm 2 · day ) B′ Estimated Using Rt Values (mV) ( 1 R p )   d t   ( Ω 1 · cm 2 · day ) B′ Estimated Using Rp Values (mV)
43.41.243.92 × 10−33176.07 × 10−3204

