Substitution Versus Full-Heusler Segregation in TiCoSb


1
Institute of Chemical Sciences and Centre for Advanced Energy Storage and Recovery, School of Engineering and Physical Sciences, Heriot-Watt University, Edinburgh EH14 4AS, UK
2
Institute of Petroleum Engineering, School of Energy, Geoscience, Infrastructure and Society, Heriot-Watt University, Edinburgh EH14 4AS, UK
*
Author to whom correspondence should be addressed.
Metals 2018, 8(11), 935; https://doi.org/10.3390/met8110935
Submission received: 18 October 2018
/
Revised: 6 November 2018
/
Accepted: 8 November 2018
/
Published: 12 November 2018
(This article belongs to the Special Issue Heusler Compounds)
Abstract
:Half-Heuslers (HHs) are promising thermoelectric materials with great compositional flexibility. Here, we extend work on the p-type doping of TiCoSb using abundant elements. Ti0.7V0.3Co0.85Fe0.15Sb0.7Sn0.3 samples with nominal 17.85 p-type electron count were investigated. Samples prepared using powder metallurgy have negative Seebeck values, S ≤ −120 µV K−1, while arc-melted compositions are compensated semiconductors with S = −45 to +30 µV K−1. The difference in thermoelectric response is caused by variations in the degree of segregation of V(Co0.6Fe0.4)2Sn full-Heusler and Sn phases, which selectively absorb V, Fe, and Sn. The segregated microstructure leads to reduced lattice thermal conductivities, κlat = 4.5−7 W m−1 K−1 near room temperature. The largest power factor, S2/ρ = 0.4 mW m−1 K−2 and ZT = 0.06, is observed for the n-type samples at 800 K. This works extends knowledge regarding suitable p-type dopants for TiCoSb.
1. Introduction
Thermoelectric waste heat recovery is a promising technology that may help reduce reliance on fossil fuels and mitigate the impacts of climate change. The large-scale application of thermoelectric generators is limited by the availability of cost-effective n- and p-type materials. In this regard, half-Heuslers (HHs) are promising as they combine good performance, use of abundant elements, good mechanical properties, and thermal stability [1,2]. The efficiency of a thermoelectric material is given by its figure of merit, ZT = (S2/ρκ)T, where S is the Seebeck coefficient, ρ is the electrical resistivity, κ is the sum of the lattice (κlat) and electronic (κel) thermal conductivities, and T is the absolute temperature [3]. In general, HHs are characterised by large power factors (S2/ρ), which enables large amounts of power to be extracted from the generators, but are limited by relatively large κ values, which reduces the overall device efficiency [1,2]. The current best materials are based on XNiSn (n-type) [4,5,6,7], XCoSb (p-type) [8,9] (X = Ti, Zr, Hf), and X′FeSb (p-type) [10,11,12] (X′ = V, Nb, Ta), while Nb0.8–0.9CoSb alloys have recently emerged as promising new n-type compositions [13,14].
The XYZ HH crystal structure consists of a face centred cubic lattice of main group atoms (Z), with the more electropositive (X) metal occupying all octahedral sites, and the late transition metal (Y) on half the tetrahedral sites [15]. Complete filling of the vacant tetrahedral sites leads to the formation of a full-Heusler (FH) structure. The space group symmetry of the HH structure is cubic F-43m and increases to Fm-3m for the FH structure.
The aim of this work was to develop a good p-type thermoelectric material based on TiCoSb that avoids the use of expensive Zr and Hf. Compared to TiNiSn (see e.g., [16,17,18,19,20,21,22,23,24,25]), TiCoSb has attracted far less interest and does not support the presence of interstitial Co for samples prepared using powder routes [26]. Previous work from our group showed that co-substitution with V and Sn improved the high-temperature stability of TiCoSb [26]. However, these Ti1-xVxCoSb1-xSnx samples maintained an 18-valence electron count and were n-type conductors. Here, we report on our investigation of the Ti0.7V0.3Co0.85Fe0.15Sb0.7Sn0.3 samples, where Fe is substituted on the Co-site to obtain a p-type 17.85 valence electron count. Samples were prepared using both powder metallurgy and arc-melting routes. In both cases, segregation of a FH phase rich in V, Fe, and Sn occurs, which absorbs the V, Fe, and Sn substituents. This leads to compensated semiconducting behaviour for the samples prepared using arc melting, while the degree of segregation of V is lower for the samples prepared from powder metallurgy. Hence, leading to clear n-type behaviour. We note that all three elements of V, Fe, and Sn have good individual solubility in TiCoSb [27,28,29], while V and Sn can be co-substituted up to ~40% [26]. This work raises the important question if it is the energy penalty associated with p-type substitutions (as suggested by theory [30,31]) or the stability of the FH that drives the poor uptake of V, Fe, and Sn in TiCoSb.
2. Experiment
Polycrystalline Ti0.7V0.3Co0.85Fe0.15Sb0.7Sn0.3 samples were prepared on a 2.5-gram scale via powder metallurgy and arc melting. A summary of the prepared samples is given in Table 1 and Table 2. Starting materials were metal powders of Ti (325 mesh, 99.99%), V (325 mesh, 99.5%), Co (1.6 micron, 99.8%), Fe (<10 micron, 99.5%), Sb (powdered shots, 99.99%), and Sn (100 mesh, 99.85%). All were purchased from Alfa Aesar (Alfa Aesar, Heysham, UK). Appropriate amounts of the constituent elements were mixed using an agate mortar and pestle, and cold pressed into pellets. For the powder route, these were wrapped in Ta foil and sintered in vacuum sealed quartz tubes at 850 °C for 24 h. Samples were then reground, re-pressed, and sintered for an additional 7 days at 850 °C. Subsequent consolidation through hot pressing was performed at 850 °C for 20 min under 80 MPa. To check reproducibility, one repeat sample was prepared using an identical procedure. These samples are labelled SSR-R1, R2 throughout the manuscript. In the case of the arc-melted samples, two different synthesis routes were used. The samples labelled (AM) R1-R3 were prepared by direct arc melting of all elements, while for sample R4, the transition metals were melted first, and the main group elements were added in a subsequent arc-melting step. The samples were melted and turned over at least twice. Following the arc melting, samples R1, R2, and R4 were sintered for 7 days at 850 °C without intermediate homogenisation, while sample R3 was ground using a pestle and mortar, cold pressed and sintered at 850 °C for 24 h, then homogenised and sintered at 850 °C for a further 7 days. As a final step, the arc-melted samples were powdered using mortar and pestle and hot pressed at 850 °C and 80 MPa for 20 min.
Laboratory X-ray powder diffraction (XRD) patterns were collected using a D8 Advance diffractometer (Bruker, Billerica, MA, USA) using monochromatic Cu Kα1 radiation for a period of 8 h. Rietveld analysis of the powder diffraction data was carried out using the GSAS and EXPGUI programmes [32,33]. The microstructure and homogeneity of the hot-pressed samples were examined using a Quanta 650 FEG Scanning Electron Microscope (FEI, Eindhoven, The Netherlands). Quantitative analysis of selected areas was performed using the AZtec Large Area Maps software (v. 3.3, Oxford Instruments, Abingdon, Oxford, UK). Prior to SEM-EDX analysis, samples were polished to 0.5 µm roughness with Al2O3 polishing paper.
For electrical property measurements, bars were cut from the middle of the hot-pressed disks using a low speed diamond saw. The Seebeck coefficient and electrical resistivity were measured simultaneously using a Linseis LSR-3 instrument (Linseis, Selb, Germany). The thermal diffusivity (α) was measured using a Linseis LFA 1000 Laser Flash instrument (Linseis, Selb, Germany). The densities (d) of the samples was calculated from the mass and dimensions of the hot-pressed pellets. The thermal conductivity, κ = αCd, was calculated using the experimental α and d values and heat capacity data (C) from the literature [34]. A porosity correction of κ/κdense = 1 − (4/3)ϕ; ϕ = (100 − %density)/100 was applied. The lattice thermal conductivity was calculated using κlat = κ − LT/ρ; where the Lorenz number, L, was estimated using the procedure outlined in Ref. [35].
3. Results
3.1. X-ray Powder Diffraction
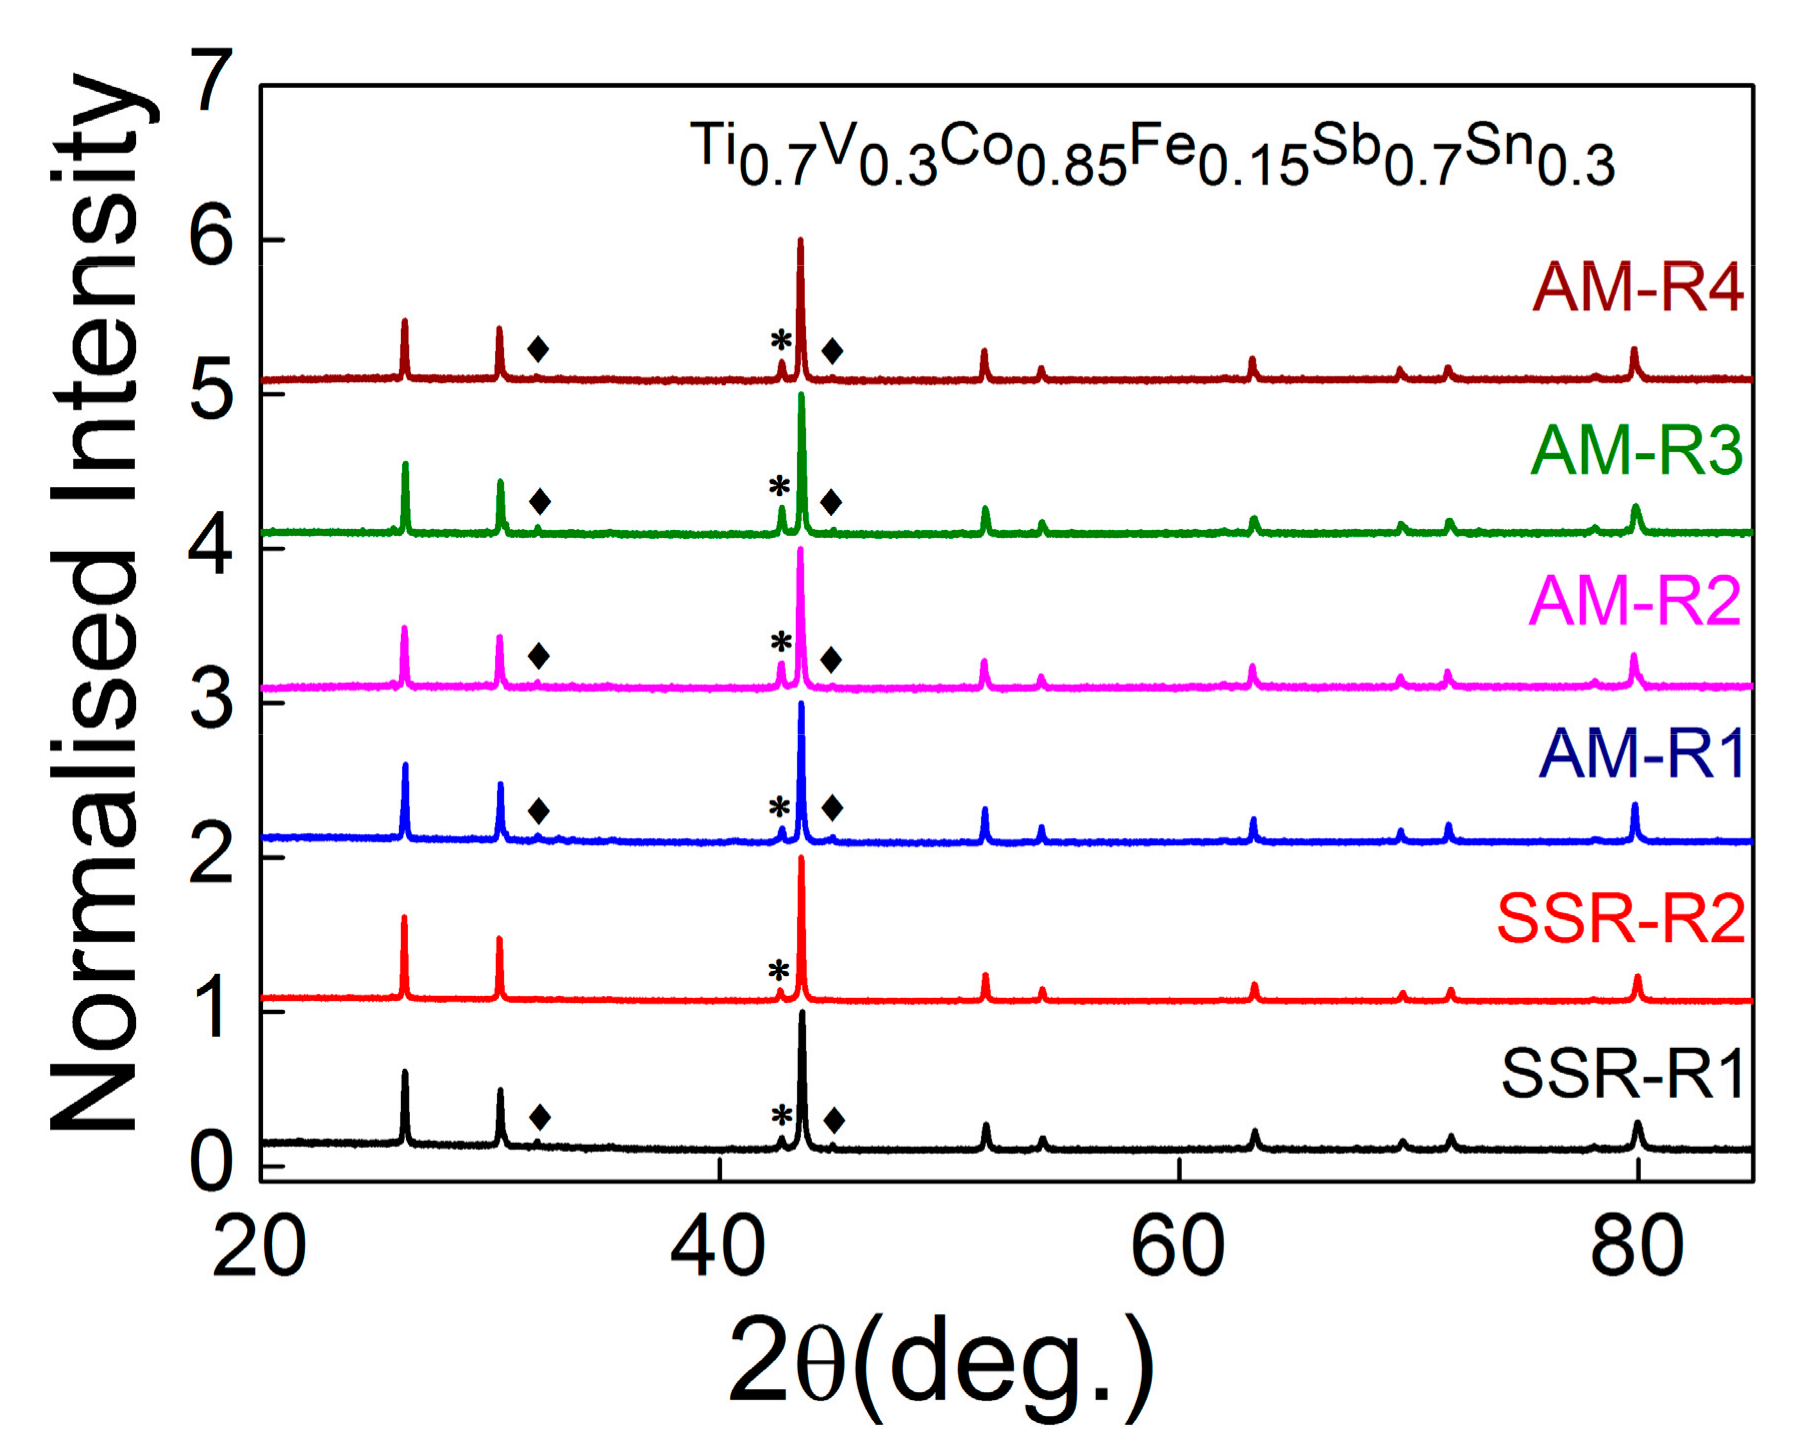
The XRD patterns for all prepared samples are shown in Figure 1. Samples prepared using the powder route are labelled SSR, while the arc-melted samples are labelled AM. Inspection of the diffraction patterns reveals a main HH phase with varying amounts of FH and elemental Sn secondary phases. Rietveld analysis was used to obtain the HH lattice parameter and weight fractions of the three phases apparent from XRD. These are summarized in Table 1 and Table 2. There is no significant difference in the lattice parameter of the SSR samples with near identical a = 5.871(1) Å. The lattice parameters for the AM samples (R1-4) are somewhat larger with a = 5.883(2) Å, suggesting a different chemical composition. The fitted amounts of FH phase are 7–8% for the SSR samples and increases to 10–12% for the AM samples. The amount of Sn is also found to have increased for the AM samples, from 0.2–1 wt% to 3–4 wt%. The overall conclusion is therefore that the AM samples are more segregated. The sample densities after hot pressing are 7.0(1) g cm−3 for all samples (91–95% of theoretical), independent on SSR or AM route, and are therefore largely controlled by the hot-pressing procedure.
3.2. Scanning Electron Microscopy
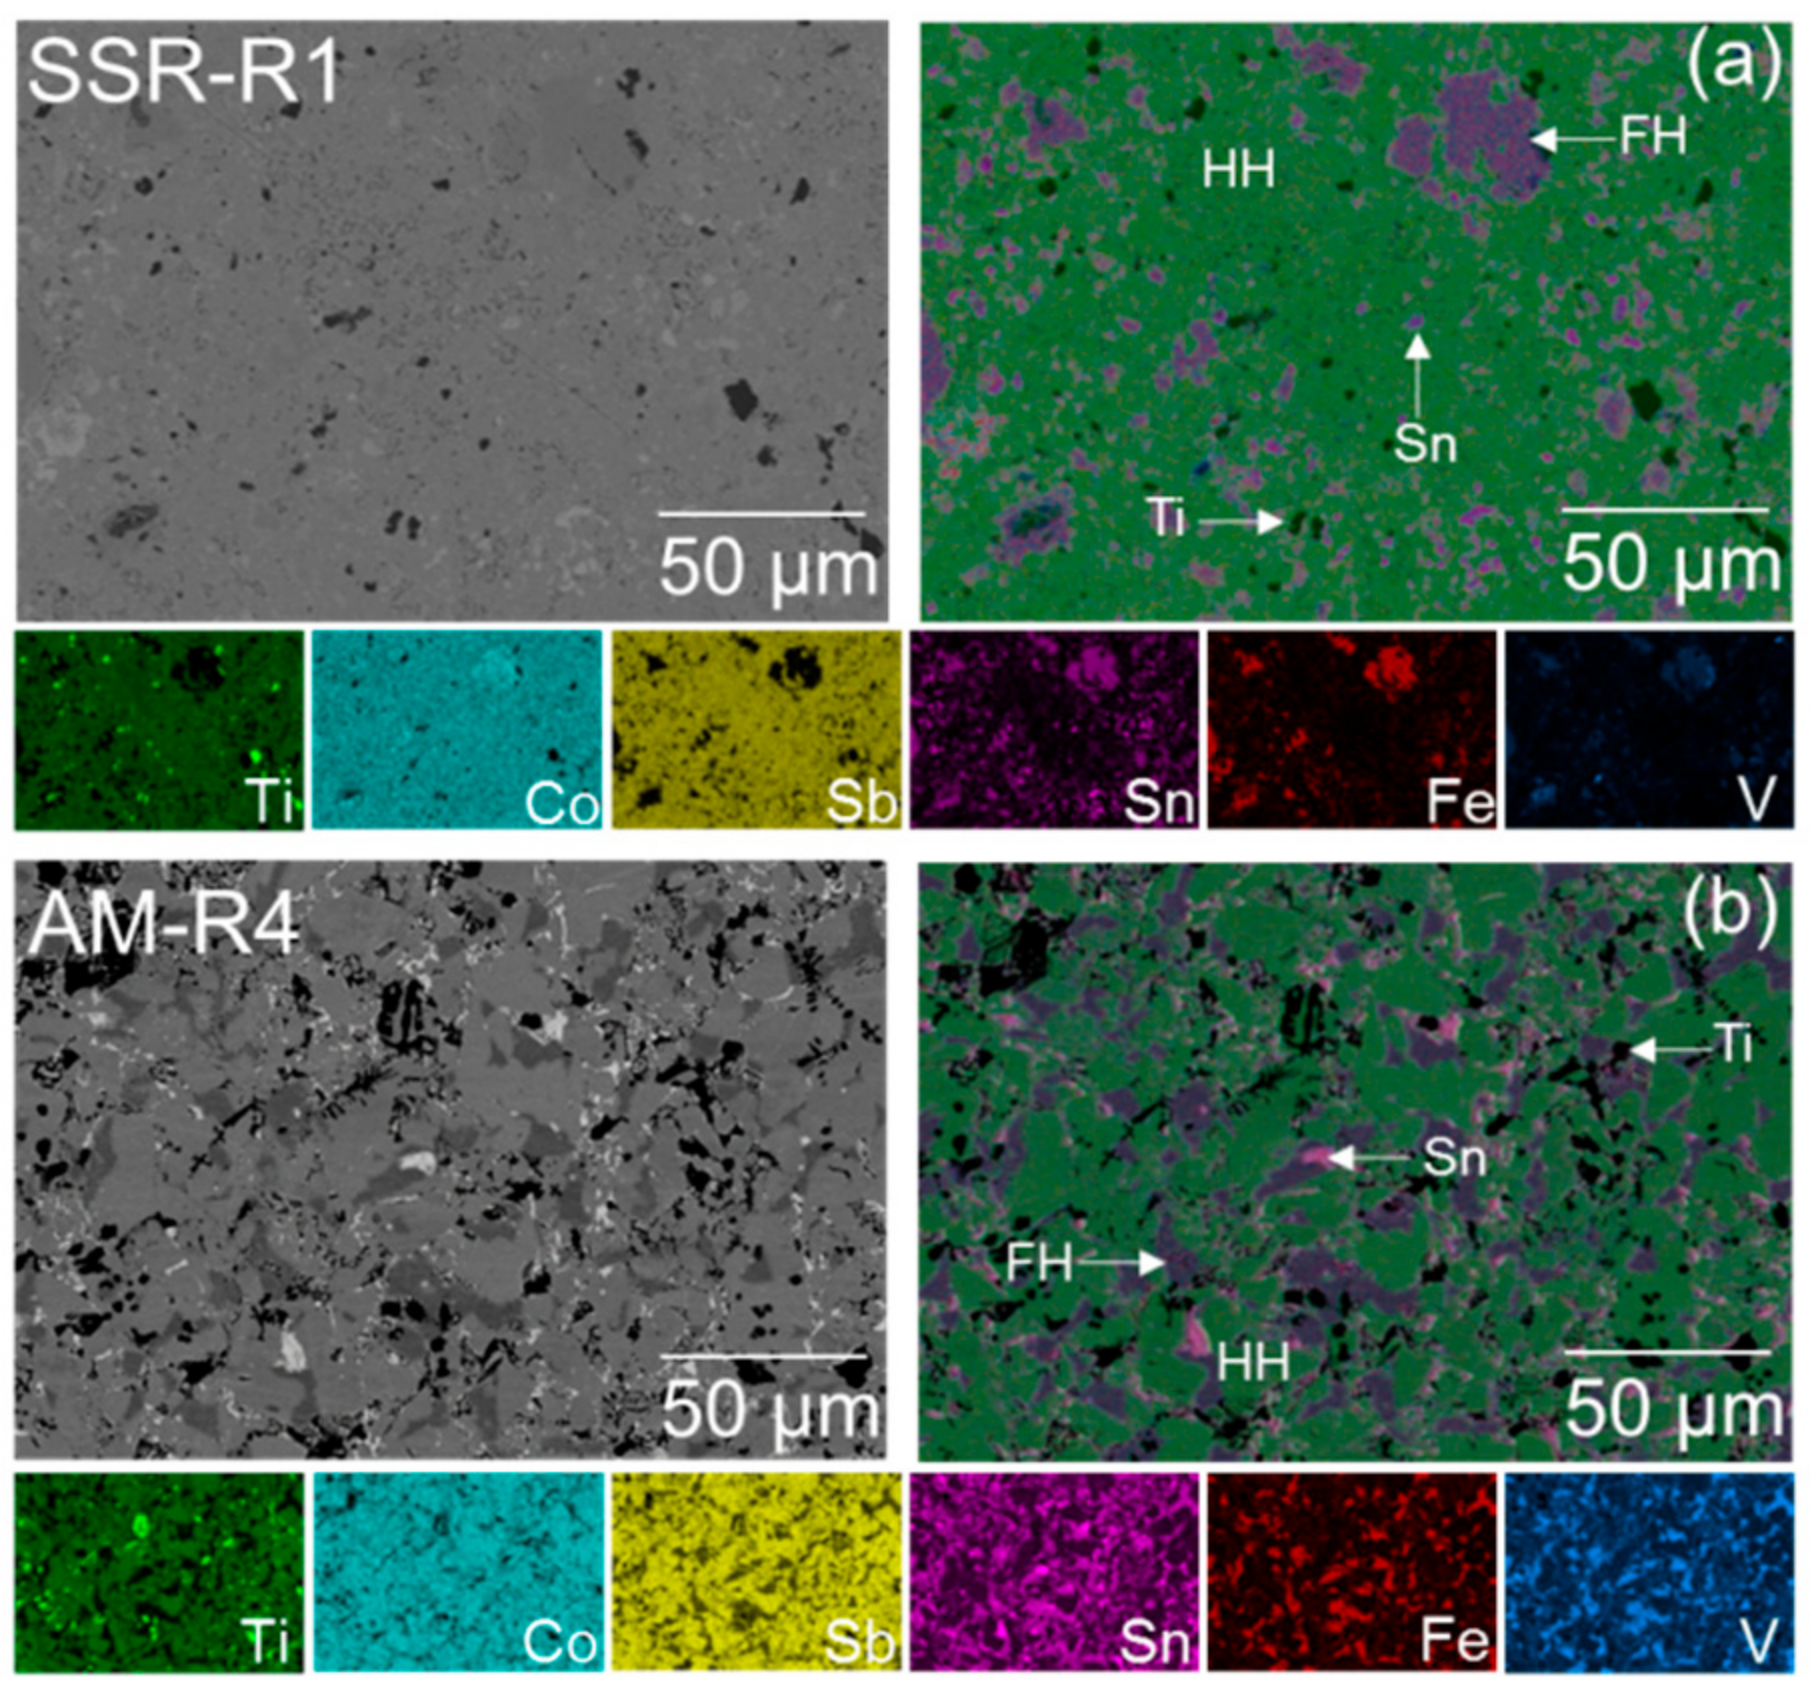
Backscattered electron (BSE) images (~150 × 200 µm2) and elemental maps for selected SSR (R1) and AM (R4) samples are shown in Figure 2.
Brighter areas in the BSE images correspond to regions of a higher average atomic number (Z), while darker areas have a lower average Z. Significant contrast variations are observed in the BSE images, signalling the presence of multiple phases, in agreement with the XRD results. The variations in chemical composition are also evident in the composite and individual EDX elemental maps. There are, however, some clear differences between the SSR and AM samples. The BSE image for the AM sample appears less homogeneous, indicative of a clearer phase segregation, which is in keeping with the XRD results. However, despite the more homogenous appearance of the BSE image for the SSR sample, the elemental maps clearly demonstrate the presence of FH and Sn phases. The FH phases in the SSR sample (purple in the composite maps) have a range of sizes from 1–10 s micron, while elemental Sn (pink) is typically located in smaller areas. There is no obvious correlation between the position of the FH and Sn phases in the SSR samples. By contrast, in the AM sample, the FH and Sn phases tend to appear in close proximity. In addition, the FH regions are more uniformly distributed, while for the SSR sample, fewer, but larger area, FH regions were observed. There are therefore significant differences in microstructure for samples prepared via SSR and AM. Both SSR and AM samples surprisingly also contain some unreacted elemental Ti, as previously observed for TiNiSn [36]. It seems unlikely that this is due to slow reaction kinetics in the case of the AM samples and is more likely to be a consequence of the thermodynamics of this system. The EDX composition of the FH phase is similar in both SSR [V(Co0.64(1)Fe0.36(1))2Sn] and AM [V(Co0.59(1)Fe0.41(1))2Sn] samples, where an average of at least six equivalent regions across the ingot was used in each case. The HH phase makes up most of the samples. The EDX elemental compositions is found to be Ti0.73(3)V0.27(3)Co0.90(2)Fe0.10(2)Sb0.88(1)Sn0.12(1) for the SSR sample, which therefore has a reduced Fe and Sn content compared to nominal. The composition for the AM sample is: Ti0.92(3)V0.08(3)CoSb0.88(1)Sn0.12(1); i.e., without any Fe on the Co site, a comparable Sn content to the SSR sample and a far lower V content. The approximate valence electron counts for these HH phases are 18.1(8) (SSR) and 18.0(3) (AM), which is at the boundary between n- and p-type conduction. From this analysis, the FH phase forms a sink for the V, Fe, and Sn substituents. The arc melting facilitates a more complete segregation of V and Fe, while the Sn content in the SSR and AM samples is similar. The lower-temperature reaction route enables the SSR sample to retain a larger amount of V, while both Fe and Sn are reduced. The net impact is that most of the electron doping (through V) is maintained, but the compensating p-type doping is reduced. For the AM samples, the V content is much lower and approximately compensated by the p-type carriers from Sn, which is consistent with the observed thermoelectric properties.
3.3. Electrical Properties
The temperature dependences of the electrical resistivity (ρ), Seebeck coefficient (S), and power factor (S2/ρ) for the SSR and AM samples are given in Figure 3. The SSR samples are n-type with S300K = −60 µV·K−1 and S300K = −85 µV·K−1 (Figure 3b). S increases to −120 µV·K−1 at 800 K for both samples. ρ300K = 3–4 mΩ cm and initially increases linearly and then saturates (Figure 3a) with a small residual resistivity of ρ823K/ρ323K = 1.1–1.5, typical of degenerate doping. The resulting S2/ρ are 0.3–0.4 mW·m−1·K−2 at 800 K.
The AM samples have much smaller magnitudes of S and R1, R2 and R4 show n- to p-type transitions upon heating. All samples show a change in behaviour at 500–550 K, which corresponds closely to the melting point of elemental Sn (Figure 3e). For some samples, this leads to an S-wave S(T) shape, for others, the change appears as an inflection point. The magnitude of S remains small with values between −45 and + 30 μV·K−1 in the 300–773 K interval. ρ300 K = 2–4.5 mΩ cm is comparable to the SSR samples (Figure 3d). Due to the low S, the S2/ρ for these samples remains small <0.1 mW·m−1·K−2. The variations in S(T) and ρ(T) between AM samples are likely caused by small changes in HH composition, but do not track back to any clearly observable trend from XRD or SEM. The AM samples are balanced at the boundary between n- and p-type conduction, which is in keeping with the experimental HH composition, where the n-type doping due to V is compensated by Sn with no Fe present.
3.4. Thermal Conductivity and Figure of Merit
The temperature dependence of the total (κ) and lattice (κlat) thermal conductivities and the figures of merit for the SSR and AM samples are shown in Figure 4. κ(T) is dominated by κlat and both show a ~1/T temperature dependence. The magnitude of κlat, 323 K varies between 5–7 W·m−1·K−1 for the AM samples, while the SSR sample has slightly lower κlat, 323 K = 4.5 W·m−1·K−1. The large reduction compared to TiCoSb with κlat = 18 W·m−1·K−1 at room temperature [37] is striking and must be related to microstructure effects. Phonon point-defect scattering can strongly reduce κlat, but this relies on mass differences and lattice strain caused by alloying [38]. The current substituents (V, Fe, and Sn) have similar masses and sizes to Ti, Co, and Sb. Even discounting their limited solubility, it is therefore difficult to see how the large κlat reduction can be explained by enhanced point-defect phonon scattering. Elemental Sn is a metallic conductor with a large κ and FH phases tend to be metallic with large κ values. The slightly larger κlat values for the AM samples are therefore consistent with the larger fractions of FH and Sn for those samples, but their presence cannot explain the overall low observed values. Similar strongly reduced κlat were observed in work on arc-melted Ti0.9A0.1CoSb (A = Sc, V) samples and were attributed to interface effects [31]. The highest figure of merit, ZT = 0.06, is observed for the SSR sample that showed clear n-type behaviour. The small S2/ρ < 0.1 mW·m−1·K−2 for the AM samples, limits ZT < 0.01.
4. Discussion
The aim of this work was to obtain a p-type TiCoSb-based HH alloy containing only abundant elements. Following on from previous work on the n-type Ti1-xVxCoSb1-xSnx HH alloys, Fe was substituted on the Co site to change the valence electron count to 17.85. Despite the good solubility of the individual elements and V and Sn in equimolar ratios, segregation of a competing V(Co0.6Fe0.4)2Sn FH phase was observed in XRD and SEM. Samples prepared via arc melting showed a more complete segregation, leading to a complete absence of Fe, and ~0.1 V and ~0.1 Sn substitution in TiCoSb. The non-melt, powder route afforded more substitution with ~0.3 V, ~0.1 Fe, and ~0.1 Sn contained in the HH phase. From simple electron counting arguments, the AM samples are therefore expected to be near compensated, while the SSR samples should be n-type conductors. This is consistent with the experimental observations. Our work does not provide any evidence for the presence of competing HH phases. Calculations suggest miscibility gaps occur for substitutions on the X-site, leading to segregation into two HH phases [30,31]. This segregation is driven by destabilisation of the semiconducting electronic structure by changing the electron count. However, for the present samples, TiCoSb appears to avoid this destabilisation by instead segregating a V(Co0.6Fe0.4)2Sn FH phase. Alternatively, the FH phase is the more stable phase, causing the HH phase to adjust its composition based on elements available. For the AM samples, this would occur by the FH crystallising first and leaving a melt with reduced V, Fe, and Sn content, leading to the formation of a HH poor in these elements. For the SSR samples, a similar product is found: A HH with reduced Fe and Sn content, but, interestingly, a near nominal amount of V. The ability to achieve a higher amount of V substitution must be a consequence of a different reaction pathway compared to the samples prepared via the melt. The observation of elemental Sn in the final product suggests that the ~0.1 Sn substitution onto the Sb-site that is found for both AM and SSR samples is an upper limit that is controlled by thermodynamics.
The microstructure of the AM samples reflects the higher stability of the FH phase. Upon cooling the FH crystallises first, followed by the HH and finally elemental Sn. This leads to the observed homogeneous microstructure of FH “islands”, surrounded by HH and Sn phases. By contrast, the SSR route does not proceed via the melt and a less uniform distribution of FH phases is observed, with a few larger areas and many rather small FH and Sn domains. Nevertheless, the composition of the FH and HH phases did not show much spatial variation, suggesting that the SSR samples have reached equilibrium under the sintering conditions. VFe2Sn and VCo2Sn are ferromagnetic metals with Curie temperatures of 200 and 70 K, respectively [39,40]. The V(Co0.6Fe04)2Sn FH phase found in this work falls in between these end-members and our samples were not obviously ferromagnetic at room temperature.
The thermoelectric properties are consistent with the non-optimal doping and multiphase nature of the samples. The largest S2/ρ = 0.4 mW·m−1·K−2 is lower than the ~2 mW·m−1·K−2 at 800 K that is possible for optimally doped p-type Fe substituted TiCoSb [29]. A final point of interest is the low κ(T), which varies between 4.5–7 W·m−1·K−1 at 300 K, and is significantly reduced compared to pristine TiCoSb. Given the absence of significant point defect phonon scattering, this is likely related to the microstructure of these samples [31], which is characterised by the presence of multiple phases. A quantitative analysis of the impact of the interfaces between these different phases is beyond the scope of this manuscript. It, is however, worth noting that the ρ(T) ~ 2–4 mΩ cm are not atypical for TiCoSb-based HHs (e.g., [26]) and this property therefore appears less affected than κ.
The results presented here demonstrate that stable FH phases can severely limit the amount of substitution in the HH phase. The most obvious way forward for further development of p-type TiCoSb-based materials is to reduce the number of substituents to two, e.g., the Ti1-xVxCoSb1-zSnz HHs with z > x. These compositions would hopefully continue to exhibit the improved high-temperature stability found previously [26]. The possible competing FH VCo2Sn does not form up to x ~ 0.4 in the 18 electron Ti1-xVxCoSb1-xSnx series [26], suggesting that adjusting the V/Sn amounts is a viable route to achieve p-type conduction. Alternatively, removal of Sn would avoid any Sn-based FH phases, which appear more common than Sb-based FH phases containing Ti, V, Co, or Fe. It would therefore be worthwhile exploring the Ti1-xVxCo1-yFeySb compositions, where y > x to achieve p-type electron counts.
To conclude, the simultaneous substitution of V, Fe, and Sn in TiCoSb is not possible for samples prepared using powder and arc-melting routes. This is due to the stability of a competing full-Heusler phase with V(Co0.6Fe04)2Sn composition. This works extends knowledge on suitable p-type dopants and stability for the half-Heusler TiCoSb.
Author Contributions
M.A. and J.-W.G.B. conceived and designed the experiments; M.A. synthesised the samples and performed the structural and thermoelectric measurements; J.B. collected the SEM data; M.A. and J.-W.G.B. analysed the data; J.-W.G.B. wrote the paper with help of M.A.
Acknowledgments
M.A. acknowledges the British Council. J.-W.G.B. acknowledges the EPSRC for funding the research into half-Heuslers under grant number EP/N01717X/1. Raw data on which this publication is based can be accessed via the Heriot-Watt University Data Repository [41].
Conflicts of Interest
The authors declare no conflict of interest. The sponsors had no role in the design of the study; in the collection, analyses, or interpretation of data; in the writing of the manuscript, and in the decision to publish the results.
References
- Bos, J.W.G.; Downie, R.A. Half-Heusler thermoelectrics: A complex class of materials. J. Phys. Condens. Matter 2014, 26, 433201. [Google Scholar] [CrossRef] [PubMed]
- Zhu, T.J.; Fu, C.G.; Xie, H.H.; Liu, Y.T.; Zhao, X.B. High Efficiency Half-Heusler Thermoelectric Materials for Energy Harvesting. Adv. Energy Mater. 2015, 5, 1500588. [Google Scholar] [CrossRef]
- Rowe, D.M. Thermoelectrics and Its Energy Harvesting; CRC Press: Boca Raton, FL, USA, 2012. [Google Scholar]
- Schwall, M.; Balke, B. Phase separation as a key to a thermoelectric high efficiency. Phys. Chem. Chem. Phys. 2013, 15, 1868–1872. [Google Scholar] [CrossRef] [PubMed]
- Chen, L.; Gao, S.; Zeng, X.; Dehkordi, A.M.; Tritt, T.M.; Poon, S.J. Uncovering high thermoelectric figure of merit in (Hf,Zr)NiSn half-Heusler alloys. Appl. Phys. Lett. 2015, 107, 041902. [Google Scholar] [CrossRef] [Green Version]
- Gurth, M.; Rogl, G.; Romaka, V.V.; Grytsiv, A.; Bauer, E.; Rogl, P. Thermoelectric high ZT half-Heusler alloys Ti1−x−yZrxHfyNiSn (0 ≤ x ≤ 1; 0 ≤ y ≤ 1). Acta Mater. 2016, 104, 210–222. [Google Scholar] [CrossRef]
- Barczak, S.A.; Halpin, J.E.; Buckman, J.; Decourt, R.; Pollet, M.; Smith, R.I.; MacLaren, D.A.; Bos, J.W.G. Grain-by-Grain Compositional Variations and Interstitial Metals-A New Route toward Achieving High Performance in Half-Heusler Thermoelectrics. ACS Appl. Mater. Interfaces 2018, 10, 4786–4793. [Google Scholar] [CrossRef] [PubMed]
- Yan, X.A.; Joshi, G.; Liu, W.S.; Lan, Y.C.; Wang, H.; Lee, S.; Simonson, J.W.; Poon, S.J.; Tritt, T.M.; Chen, G.; et al. Enhanced Thermoelectric Figure of Merit of p-Type Half-Heuslers. Nano Lett. 2011, 11, 556–560. [Google Scholar] [CrossRef] [PubMed]
- Rausch, E.; Balke, B.; Ouardi, S.; Felser, C. Enhanced thermoelectric performance in the p-type half-Heusler (Ti/Zr/Hf)CoSb0.8Sn0.2 system via phase separation. Phys. Chem. Chem. Phys. 2014, 16, 25258–25262. [Google Scholar] [CrossRef] [PubMed]
- Fu, C.G.; Bai, S.Q.; Liu, Y.T.; Tang, Y.S.; Chen, L.D.; Zhao, X.B.; Zhu, T.J. Realizing high figure of merit in heavy-band p-type half-Heusler thermoelectric materials. Nat. Commun. 2015, 6, 8144. [Google Scholar] [CrossRef] [PubMed] [Green Version]
- Fu, C.G.; Zhu, T.J.; Liu, Y.T.; Xie, H.H.; Zhao, X.B. Band engineering of high performance p-type FeNbSb based half-Heusler thermoelectric materials for figure of merit zT > 1. Energy Environ. Sci. 2015, 8, 216–220. [Google Scholar] [CrossRef]
- Hea, R.; Kraemer, D.; Mao, J.; Zeng, L.; Jie, Q.; Lan, Y.C.; Li, C.H.; Shuai, J.; Kim, H.S.; Liu, Y.; et al. Achieving high power factor and output power density in p-type half-Heuslers Nb1−xTixFeSb. Proc. Natl. Acad. Sci. USA 2016, 113, 13576–13581. [Google Scholar] [CrossRef] [PubMed]
- Xia, K.; Liu, Y.; Anand, S.; Snyder, G.J.; Xin, J.; Yu, J.; Zhao, X.; Zhu, T. Enhanced Thermoelectric Performance in 18-Electron Nb0.8CoSb Half-Heusler Compound with Intrinsic Nb Vacancies. Adv. Funct. Mater. 2018, 28, 1705845. [Google Scholar] [CrossRef]
- Ferluccio, D.A.; Smith, R.I.; Buckman, J.; Bos, J.W.G. Impact of Nb vacancies and p-type doping of the NbCoSn-NbCoSb half-Heusler thermoelectrics. Phys. Chem. Chem. Phys. 2018, 20, 3979–3987. [Google Scholar] [CrossRef] [PubMed]
- Graf, T.; Felser, C.; Parkin, S.S.P. Simple rules for the understanding of Heusler compounds. Prog. Solid State Chem. 2011, 39, 1–50. [Google Scholar] [CrossRef]
- Downie, R.A.; MacLaren, D.A.; Smith, R.I.; Bos, J.W.G. Enhanced thermoelectric performance in TiNiSn-based half-Heuslers. Chem. Commun. 2013, 49, 4184–4186. [Google Scholar] [CrossRef] [PubMed]
- Birkel, C.S.; Douglas, J.E.; Lettiere, B.R.; Seward, G.; Verma, N.; Zhang, Y.C.; Pollock, T.M.; Seshadri, R.; Stucky, G.D. Improving the thermoelectric properties of half-Heusler TiNiSn through inclusion of a second full-Heusler phase: Microwave preparation and spark plasma sintering of TiNi1+xSn. Phys. Chem. Chem. Phys. 2013, 15, 6990–6997. [Google Scholar] [CrossRef] [PubMed]
- Chai, Y.W.; Kimura, Y. Microstructure evolution of nanoprecipitates in half-Heusler TiNiSn alloys. Acta Mater. 2013, 61, 6684–6697. [Google Scholar] [CrossRef]
- Douglas, J.E.; Birkel, C.S.; Verma, N.; Miller, V.M.; Miao, M.S.; Stucky, G.D.; Pollock, T.M.; Seshadri, R. Phase stability and property evolution of biphasic Ti-Ni-Sn alloys for use in thermoelectric applications. J. Appl. Phys. 2014, 115, 043720. [Google Scholar] [CrossRef]
- Downie, R.A.; Barczak, S.A.; Smith, R.I.; Bos, J.W.G. Compositions and thermoelectric properties of XNiSn (X = Ti, Zr, Hf) half-Heusler alloys. J. Mater. Chem. C 2015, 3, 10534–10542. [Google Scholar] [CrossRef] [Green Version]
- Downie, R.A.; Smith, R.I.; MacLaren, D.A.; Bos, J.W.G. Metal Distributions, Efficient n-Type Doping, and Evidence for in-Gap States in TiNiMySn (M = Co, Ni, Cu) half-Heusler Nanocomposites. Chem. Mater. 2015, 27, 2449–2459. [Google Scholar] [CrossRef] [Green Version]
- Berche, A.; Jund, P. Fully Ab-Initio Determination of the Thermoelectric Properties of Half-Heusler NiTiSn: Crucial Role of Interstitial Ni Defects. Materials 2018, 11, 868. [Google Scholar] [CrossRef] [PubMed]
- Dow, H.S.; Kim, W.S.; Shin, W.H. Effect of C and N Addition on Thermoelectric Properties of TiNiSn Half-Heusler Compounds. Materials 2018, 11, 262. [Google Scholar] [CrossRef] [PubMed]
- Levin, E.E.; Long, F.; Douglas, J.E.; Buffon, M.L.C.; Lamontagne, L.K.; Pollock, T.M.; Seshadri, R. Enhancing Thermoelectric Properties through Control of Nickel Interstitials and Phase Separation in Heusler/Half-Heusler TiNi1.1Sn Composites. Materials 2018, 11, 903. [Google Scholar] [CrossRef] [PubMed]
- Schwall, M.; Balke, B. On the Phase Separation in n-Type Thermoelectric Half-Heusler Materials. Materials 2018, 11, 649. [Google Scholar] [CrossRef] [PubMed]
- Asaad, M.; Buckman, J.; Smith, R.I.; Bos, J.W.G. Thermoelectric properties and high-temperature stability of the Ti1−xVxCoSb1−xSnx half-Heusler alloys. RSC Adv. 2016, 6, 56511–56517. [Google Scholar] [CrossRef]
- Tareuchi, N.; Gosho, K.; Hiroi, M.; Kawakami, M. The effect of V substitution on the properties of CoTiSb. Phys. B Condens. Matter 2005, 359, 1183–1185. [Google Scholar] [CrossRef]
- Sekimoto, T.; Kurosaki, K.; Muta, H.; Yamanaka, S. Thermoelectric properties of Sn-doped TiCoSb half-Heusler compounds. J. Alloys Compd. 2006, 407, 326–329. [Google Scholar] [CrossRef]
- Wu, T.; Jiang, W.; Li, X.; Zhou, Y.; Chen, L. Thermoelectric properties of p-type Fe-doped TiCoSb half-Heusler compounds. J. Appl. Phys. 2007, 102, 103705. [Google Scholar] [CrossRef]
- Mena, J.M.; Schoberth, H.G.; Gruhn, T.; Emmerich, H. Nanophase separation in CoSb-based half-Heusler thermoelectrics: A multiscale simulation study. Phys Status Solidi A Appl. Mater. Sci. 2016, 213, 706–715. [Google Scholar] [CrossRef]
- Mena, J.M.; Rausch, E.; Ouardi, S.; Gruhn, T.; Fecher, G.H.; Schoberth, H.G.; Emmerich, H.; Felser, C. Miscibility Gap in the Phase Diagrams of Thermoelectric Half-Heusler Materials CoTi1−xYxSb (Y = Sc, V, Mn, Fe). J. Electron. Mater. 2016, 45, 1382–1388. [Google Scholar] [CrossRef]
- Larson, A.C.; von Dreele, R.B. General Structure Analysis System (GSAS); Los Alamos National Laboratory Report LAUR 86-748; Los Alamos National Laboratory: Los Alamos, NM, USA, 2000. [Google Scholar]
- Toby, B.H. EXPGUI, a graphical user interface for GSAS. J. Appl. Crystallogr. 2001, 210–213. [Google Scholar] [CrossRef]
- Skovsen, I.; Bjerg, L.; Christensen, M.; Nishibori, E.; Balke, B.; Felser, C.; Iversen, B.B. Multi-temperature synchrotron PXRD and physical properties study of half-Heusler TiCoSb. Dalton Trans. 2010, 39, 10154–10159. [Google Scholar] [CrossRef] [PubMed]
- Kim, H.-S.; Gibbs, Z.M.; Tang, Y.; Wang, H.; Snyder, G.J. Characterization of Lorenz number with Seebeck coefficient measurement. APL Mater. 2015, 3, 041506. [Google Scholar] [CrossRef]
- Barczak, S.A.; Buckman, J.; Smith, R.I.; Baker, A.R.; Don, E.; Forbes, I.; Bos, J.W.G. Impact of Interstitial Ni on the Thermoelectric Properties of the Half-Heusler TiNiSn. Materials 2018, 11, 536. [Google Scholar] [CrossRef] [PubMed]
- Zhou, M.; Chen, L.D.; Zhang, W.Q.; Feng, C.D. Disorder scattering effect on the high-temperature lattice thermal conductivity of TiCoSb-based half-Heusler compounds. J. Appl. Phys. 2005, 98, 013708. [Google Scholar] [CrossRef]
- Yang, J.; Meisner, G.P.; Chen, L. Strain field fluctuation effects on lattice thermal conductivity of ZrNiSn-based thermoelectric compounds. Appl. Phys. Lett. 2004, 85, 1140–1142. [Google Scholar] [CrossRef]
- Kübler, J.; Fecher, G.H.; Felser, C. Understanding the trend in the Curie temperatures of Co2-based Heusler compounds: Ab initio calculations. Phys. Rev. B 2007, 76, 024414. [Google Scholar] [CrossRef]
- Vanengen, P.G.; Buschow, K.H.J.; Erman, M. Magnetic-properties and magneto-optical spectroscopy of heusler alloys based on transition metals and Sn. J. Magn. Magn. Mater. 1983, 30, 374–382. [Google Scholar] [CrossRef]
- Data Underpinning. Available online: https://doi.org/10.17861/e6cdebd6-56ec-4606-881a-7eb3c4f12050 (accessed on 12 November 2018).
Figure 1.
X-ray powder diffraction patterns for the Ti0.7V0.3Co0.85Fe0.15Sb0.7Sn0.3 samples prepared using powder metallurgy (SSR) and arc melting (AM). Secondary phases are labelled as *: FH and ♦: Sn.
Figure 1.
X-ray powder diffraction patterns for the Ti0.7V0.3Co0.85Fe0.15Sb0.7Sn0.3 samples prepared using powder metallurgy (SSR) and arc melting (AM). Secondary phases are labelled as *: FH and ♦: Sn.
Figure 2.
Backscattered scanning electron microscopy images, composite and individual elemental maps for the (a) SSR-R1 and (b) AM-R4 Ti0.7V0.3Co0.85Fe0.15Sb0.7Sn0.3 samples. The compositions of the phases present are discussed in the text and are listed in Table 3.
Figure 2.
Backscattered scanning electron microscopy images, composite and individual elemental maps for the (a) SSR-R1 and (b) AM-R4 Ti0.7V0.3Co0.85Fe0.15Sb0.7Sn0.3 samples. The compositions of the phases present are discussed in the text and are listed in Table 3.
Figure 3.
Temperature dependence of the electrical resistivity (ρ), Seebeck coefficient (S), and thermoelectric power factor (S2/ρ) for (a–c) the powder route and (d–f) the arc-melted Ti0.7V0.3Co.85Fe0.15Sb0.7Sn0.3 samples.
Figure 3.
Temperature dependence of the electrical resistivity (ρ), Seebeck coefficient (S), and thermoelectric power factor (S2/ρ) for (a–c) the powder route and (d–f) the arc-melted Ti0.7V0.3Co.85Fe0.15Sb0.7Sn0.3 samples.

Figure 4.
Temperature dependence of the total thermal conductivity (κ), the lattice thermal conductivity (κlat), and the thermoelectric figure of merit (ZT) for (a–c) the powder route and (d–f) the arc-melted Ti0.7V0.3Co0.85Fe0.15Sb0.7Sn0.3 samples.
Figure 4.
Temperature dependence of the total thermal conductivity (κ), the lattice thermal conductivity (κlat), and the thermoelectric figure of merit (ZT) for (a–c) the powder route and (d–f) the arc-melted Ti0.7V0.3Co0.85Fe0.15Sb0.7Sn0.3 samples.


Table 1.
Overview of the lattice parameters (a), sample densities, 300 K electrical resistivity (ρ) and Seebeck coefficient (S), maximum power factor (S2/ρ)max, and 323 K thermal conductivity (κ) for the Ti0.7V0.3Co0.85Fe0.15Sb0.7Sn0.3 samples prepared by powder metallurgy.
Table 1.
Overview of the lattice parameters (a), sample densities, 300 K electrical resistivity (ρ) and Seebeck coefficient (S), maximum power factor (S2/ρ)max, and 323 K thermal conductivity (κ) for the Ti0.7V0.3Co0.85Fe0.15Sb0.7Sn0.3 samples prepared by powder metallurgy.
| Sample | a (Å) | Density (g·cm−3) | %Density | FH (%) | Sn (%) | ρ300k (mΩ·cm) | S300K (µV·K−1) | (S2/ρ)max (mW·m−1·K−2 ) | κ323K (W·m−1·K−1) |
|---|---|---|---|---|---|---|---|---|---|
| R1 | 5.8724(1) | 6.9(1) | 92(1) | 7.1(1) | 1.0(1) | 2.8 | −60.1 | 0.38 | - |
| R2 | 5.8711(1) | 7.1(1) | 95(1) | 8.2(3) | 0.2(1) | 4.1 | −85.3 | 0.32 | 4.6 |
Table 2.
Overview of the lattice parameters (a), sample densities, 300 K electrical resistivity (ρ) and Seebeck coefficient (S), maximum power factor (S2/ρ) max, and 323 K thermal conductivity (κ) for the Ti0.7V0.3Co0.85Fe0.15Sb0.7Sn0.3 samples prepared by arc melting.
Table 2.
Overview of the lattice parameters (a), sample densities, 300 K electrical resistivity (ρ) and Seebeck coefficient (S), maximum power factor (S2/ρ) max, and 323 K thermal conductivity (κ) for the Ti0.7V0.3Co0.85Fe0.15Sb0.7Sn0.3 samples prepared by arc melting.
| Sample | a (Å) | Density (g cm-3) | %Density | FH (%) | Sn (%) | ρ300k (mΩ·cm) | S300K (µV·K−1) | (S2/ρ)max (mW·m−1·K−2 ) | κ323K (W·m−1·K−1) |
|---|---|---|---|---|---|---|---|---|---|
| R1 | 5.8838(1) | 6.8(1) | 91(1) | 10.3(3) | 3.8(2) | 4.4 | −8.9 | 0.02 | - |
| R2 | 5.8835(1) | 7.0(1) | 93(1) | 12.8(2) | 2.7(3) | 2.7 | −21.7 | 0.02 | 5.8 |
| R3 | 5.8796(1) | 7.1(1) | 95(1) | 10.9(1) | 2.8(2) | 2.1 | −25.1 | 0.08 | 5.6 |
| R4 | 5.8838(1) | 6.8(1) | 91(1) | 10.2(2) | 2.5(2) | 3.2 | −8.3 | 0.01 | 6.9 |
Table 3.
SEM-EDX compositions for the half- and full-Heusler (HH and FH) phases present in the Ti0.7V0.3Co0.85Fe0.15Sb0.7Sn0.3 samples prepared by powder reactions (SSR) and arc melting (AM). The compositions are the average of >6 equivalent areas taken from different locations on the ingot; the standard deviations reflect the spatial variation in composition. Estimated valence electron counts (VECs) for the HH phases are given.
| Sample | SSR (R1) | AM (R4) |
|---|---|---|
| HH phase | Ti0.73(3)V0.27(3)Co0.90(2)Fe0.10(2)Sb0.88(1)Sn0.12(1) (VEC = 18.1(8)) | Ti0.92(3)V0.08(3)CoSb0.88(1)Sn0.12(1) (VEC = 18.0(3)) |
| FH phase | V(Co0.64(1)Fe0.36(1))2Sn | V(Co0.59(1)Fe0.41(1))2Sn |
© 2018 by the authors. Licensee MDPI, Basel, Switzerland. This article is an open access article distributed under the terms and conditions of the Creative Commons Attribution (CC BY) license (http://creativecommons.org/licenses/by/4.0/).
Share and Cite
MDPI and ACS Style
Asaad, M.; Buckman, J.; Bos, J.-W.G. Substitution Versus Full-Heusler Segregation in TiCoSb. Metals 2018, 8, 935. https://doi.org/10.3390/met8110935
AMA Style
Asaad M, Buckman J, Bos J-WG. Substitution Versus Full-Heusler Segregation in TiCoSb. Metals. 2018; 8(11):935. https://doi.org/10.3390/met8110935
Chicago/Turabian StyleAsaad, Maryana, Jim Buckman, and Jan-Willem G. Bos. 2018. "Substitution Versus Full-Heusler Segregation in TiCoSb" Metals 8, no. 11: 935. https://doi.org/10.3390/met8110935
Note that from the first issue of 2016, this journal uses article numbers instead of page numbers. See further details here.