Article

Effects of Heat Treatment on Morphology, Texture, and Mechanical Properties of a MnSiAl Multiphase Steel with TRIP Behavior

1
Departamento de Ingeniería Metalúrgica, Universidad de Santiago de Chile, Av. Ecuador 3735, Estación Central, Santiago 9170124, Chile
2
GMF Universidad Nacional del Comahue—CONICET, Neuquén 8300, Argentina
3
Facultad de Ingeniería Mecánica y Eléctrica, Universidad Autónoma de Nuevo León, Monterrey 66455, Mexico
4
Department of Electrical Energy, Metals, Mechanical Constructions & Systems, Ghent University, Technologiepark 903, 9052 Gent, Belgium
*
Author to whom correspondence should be addressed.
Metals 2018, 8(12), 1021; https://doi.org/10.3390/met8121021
Submission received: 3 November 2018 / Revised: 24 November 2018 / Accepted: 27 November 2018 / Published: 5 December 2018
(This article belongs to the Special Issue TRIP Steels)

Abstract

:
The effect that the microstructure exerts on the Transformation-Induced Plasticity (TRIP) phenomenon and on the mechanical properties in a multiphase steel was studied. Samples of an initially cold-rolled ferrite–pearlite steel underwent different intercritical annealing treatments at 750 °C until equal fractions of austenite/ferrite were reached; the intercritical treatment was followed by isothermal bainitic treatments before cooling the samples to room temperature. Samples in the first treatment were heated directly to the intercritical temperature, whereas other samples were heated to either 900 °C or 1100 °C to obtain a fully homogenized, single-phase austenitic microstructure before performing the intercritical treatment. The high-temperature homogenization of austenite resulted in a decrease in its stability, so a considerable austenite fraction transformed into martensite by cooling to room temperature after the bainitic heat treatment. Most of the retained austenite transformed during the tensile tests, and, consequently, the previously homogenized steels showed the highest Ultimate Tensile Strength (UTS). In turn, the steel with a ferritic–pearlitic initial microstructure exhibited higher ductility than the other steels and texture components that favor forming processes.

1. Introduction

Transformation-Induced Plasticity (TRIP)-assisted steels belong to the Advanced High-Strength Steels family, which combine high ductility and strength. The TRIP effect consists of the transformation of metastable austenite into martensite during deformation [1]. The energy absorption capacity of TRIP-assisted steels makes them attractive for the automotive industry. TRIP-assisted steels have a complex multiphase microstructure consisting mainly of ferrite, bainite, and retained austenite. Martensite and carbides may be present in some cases [2,3]. Improvements in the mechanical properties of TRIP-assisted steels are related to the chemical composition and microstructure (grain size, phase morphology, and others) and the stability of the retained austenite [4]. The stabilization of austenite at room temperature is enhanced by carbon enrichment during heat treatment [5].
There are several studies that have shown the effect that morphological aspects have on retained austenite and its stability against transformation [3,6,7,8]. Van Dijk et al. [3] noticed that the austenite volume fraction, its carbon concentration, and the grain size of the retained austenite play a crucial role in the TRIP properties as they significantly affect the mechanical stability of the retained austenite. They found that the stability of retained austenite decreases when the carbon content decreases. Other studies [6,7,8] reported that the increase of the grain size of the retained austenite decreases the austenite stability and, consequently, increases the TRIP effect. Wang et al. [7] related austenite stabilization to the extra interfacial (austenite/martensite) energy required for fine austenite grains. That is, increasing austenite grain size increases the MS temperature. Sugimoto et al. [9] studied the effects of silicon and manganese contents on the volume fraction and stability of retained austenite in carbon–manganese–silicon TRIP-assisted dual-phase steels, finding that the volume fraction of retained austenite increased with increasing silicon and manganese contents. Pereloma et al. [10] suggested that Al decreases the carbon activity coefficient in ferrite, consequently increasing the solubility of C in ferrite, and at the same time inhibits the precipitation of Fe carbides, leading to higher enrichment in carbon of retained austenite. However, Al increases the MS temperature, making the retained austenite less stable. They also found that 1.5% Mn content assures hardenability in TRIP-assisted steels.
According to De Cooman [11], some alloying elements have an important influence on the TRIP effect. Si and Al inhibit cementite formation, increasing the carbon content of retained austenite because of the extremely low solubility of Si and Al in cementite. Si significantly increases the C activity coefficient in both ferrite and austenite and reduces the solubility of C in ferrite. On the other hand, Mn stabilizes austenite; decreases the activity coefficient of C in ferrite and austenite, increasing the C solubility in ferrite and is soluble in cementite.
In a previous work on a multiphase low-alloy TRIP steel, Guzmán [12] proposed that an optimum combination of microstructure and properties can be obtained with an intercritical treatment of 10 min at 750 °C (just above A1 in Figure 1), reaching an α/γ proportion near to 1/1. Matsumara et al. [13] showed that heating just above A1 ensures a large content of retained austenite with good stability that provides for the best combination of strength and ductility.
Based on the facts that (a) the TRIP effect is significant for large austenite grain size [6,7,8]; (b) the global mechanical response of a multiphase TRIP-assisted steel is also influenced by the interaction with the other microstructural constituents; and (c) heat treatment has a strong influence on microstructural features, which has an effect on austenite stability (chemical and mechanical) and the features of other constituents, an optimum heat treatment must exist that, considering both effects, maximizes mechanical properties.
In order to avoid the influence of the chemical composition and the ferrite volume fraction, a steel with a given chemical composition was processed in three different ways to obtain three different TRIP steels, but fixing a near 1/1 proportion of austenite to ferrite during intercritical annealing. Then, the effects of the heat treatments on grain size, texture, and microstructure were studied, investigating the influence of these variables on the final microstructure and mechanical properties.

2. Materials and Methods

A steel ingot of a composition corresponding to a TRIP-assisted steel was cast at the Metallurgical Engineering Department, University of Santiago, Chile (USACH). The alloy was melted in a Power-Trank induction furnace and then sandcast in a 100 mm × 100 mm × 500 mm mold. The chemical composition obtained was 0.20%C, 1.88%Mn, 0.88%Si, and 0.13%Al (all in weight %). The ingot was homogenized and forged at 1250 °C down to 20 mm thickness. Next, it was hot rolled at 1100 °C to 4 mm thickness, and then cold rolled to 1.50 mm. After annealing, it was further cold rolled to a 0.87 mm thickness (42% cold working) strip, which was cut into three pieces that each underwent a different heat treatment cycle in order to obtain three multiphase TRIP steels with the same chemical composition but different microstructures.
As depicted in Figure 1, three different processing paths were used to obtain the 1/1 (ferrite/austenite) microstructure that would allow the TRIP effect to be sustained after austempering. These paths were obtained by either (i) heating the samples to two temperatures within the fully austenitic range, followed by an intercritical annealing treatment (IAT) to form equal fractions of ferrite and austenite, or (ii) heating directly from room temperature to the intercritical range to transform the microstructure. The intercritical temperature was obtained from a previous work [12]. All three paths were followed by an isothermal bainitic treatment (IBT), also known as “austempering”, in a salt bath and subsequent water quenching. Table 1 shows the temperatures and times employed in these heat treatments.
Figure 1 also shows the expected microstructures at each stage. After the IAT, a mixture of ferrite and austenite exists, whose morphology depends on whether it comes directly from the cold-worked ferrite–pearlite obtained after cold rolling, or from the fully homogenized austenite that comes from any of the previous austenization paths. Consequently, the former is denoted as F/P and the latter as HA followed by 900 or 1100, depending on the austenization temperature (see Table 1).

Microstructural Characterization

A LEICA metallographic microscope (Model DM LM/P, Leica Microsystems, Wetzlar, Germany), was used to characterize the microstructures. The samples were polished and then chemically etched with a solution of 3% HNO3 in ethanol (Nital, 3%) and LePera etchant (a 4% solution of picric acid in ethanol and a 1% solution of sodium metabisulfite in water, mixed in equal parts just before etching). The ferrite volume fraction was estimated from metallographic images by using the image analysis software ImageJ (version 1.5i, National Institutes of Health, Bethesda, MD, USA). The ferrite grain size was measured directly from metallographic images using the mean linear interception technique.
The prior austenite grain size, shown in Table 1, was measured by taking metallographic images after etching with a solution containing H2O 25 mL, picric acid 0.3 g, hydrochloric acid 0.3 mL, and sodium tridecylbenzene sulfonate 2.5 mL as a wetting agent.
SEM analysis using a TESCAN Vega 3 scanning electron microscope (Tescan, Brno, Czech Republic), with tungsten filament was performed at 15 kV in the backscattered electron (BSE) mode.
To measure the austenite volume fraction before and after plastic deformation, X-ray measurements were carried out in a PANALYTICAL EMPYREAN diffractometer (Malvern Panalytical Ltd., Malvern, UK), with a Co tube on samples before and after tensile testing. X-ray diffraction patterns were obtained in the 20–55° 2θ range with a step (Δθ) of 0.0065°. The ASTM E975 method was followed to determine the austenite volume fraction in the samples. The lattice parameter was estimated using {220} FCC peaks on prior tensile test samples, and the carbon content in the retained austenite was estimated using the relationship proposed by Roberts [14].
Electron backscattered diffraction (EBSD) analyses were carried out on a plane perpendicular to the transverse direction of samples by means of the EDAX-TSL® system (Ametek, Berwyn, PA, USA). An FEI XL30 ESEM microscope (TSS Microscopy, Boston, USA), with a LaB6 filament was used. The specimens were analyzed on a plane tilted 70° with respect to the incidence beam at 20 kV acceleration voltage. A step size of 170 nm was used for texture analyses, whereas for microstructure characterization, a 60 nm step size in a hexagonal scan grid was employed. EBSD data were postprocessed with OIM (Orientation Imaging Microscopy) Analysis™ software (Ametek, Berwyn, PA, USA). The postprocessing procedure included the elimination of points with low confidence indices (lower than 0.1). Grains were considered with a minimum of six pixels, while grain boundaries were defined when a rotation between pixels was greater than 15°. Austenite identification by EBSD was done directly by indexing FCC structures. Texture orientation distribution functions were calculated and represented in Bunge notation using the harmonic series expansion method and imposing orthorhombic sample symmetry, with series rank L = 16 and a Gaussian half-width of 5°.
Several authors [15,16] have suggested an EBSD-based method to identify martensite regions in EBSD scans due to their high dislocation density (108 cm−2 for undeformed ferrite, 1012 cm−2 for martensite) [16]. Martensite has a high density of defects; therefore, it must have a low average Image Quality (IQ) pattern [16]. An example of martensite identification criteria is represented in Figure 2a, which shows Grain Average Image Quality (GAIQ) distributions on BCC structures for the HA900 steel. Two sets of distributions at high and low values of GAIQ are clearly distinguished. Low GAIQ values were assigned to martensite units.
A second data cleaning procedure for austenite and martensite indexed data was carried out based on grain size distribution curves. An example of this is illustrated in Figure 2b, which shows the retained austenite grain size distribution for HA900 steel. This picture exhibits two austenite grain size distributions. Austenite with very small grain size (lower than the threshold line) was not considered for analysis. A similar procedure was carried out for austenite and martensite units for each steel.
The austenite volume fraction after austempering treatment may be computed by summation of the retained austenite and martensite volume fractions. Finally, the ratio between martensite and austenite after the IB treatment indicates the fraction of austenite transformed into martensite by cooling. Therefore, it can be considered as a chemical stability index of austenite prior to cooling from austempering treatment.
Tensile tests were performed according to ASTM E8M in a servohydraulic Tinius & Olsen universal testing machine (2000 Super L, Willow Grove, PA, USA), under displacement control at 2 mm/min. Three flat specimens of dimensions 0.87 mm × 12.5 mm were tested for each case. A Linear Variable Differential Transformer (Tinius-Olsen, Model LS-50%-1, Willow Grove, PA, USA), with 50 mm gage length was used to measure displacement. Based on tensile test data, true stress versus true strain curves were obtained for the homogeneous range.
The strain hardening exponent n was obtained from the σ = Kεn Hollomon relationship. Fitting was performed based on the true strain versus true stress curves.

3. Experimental Results

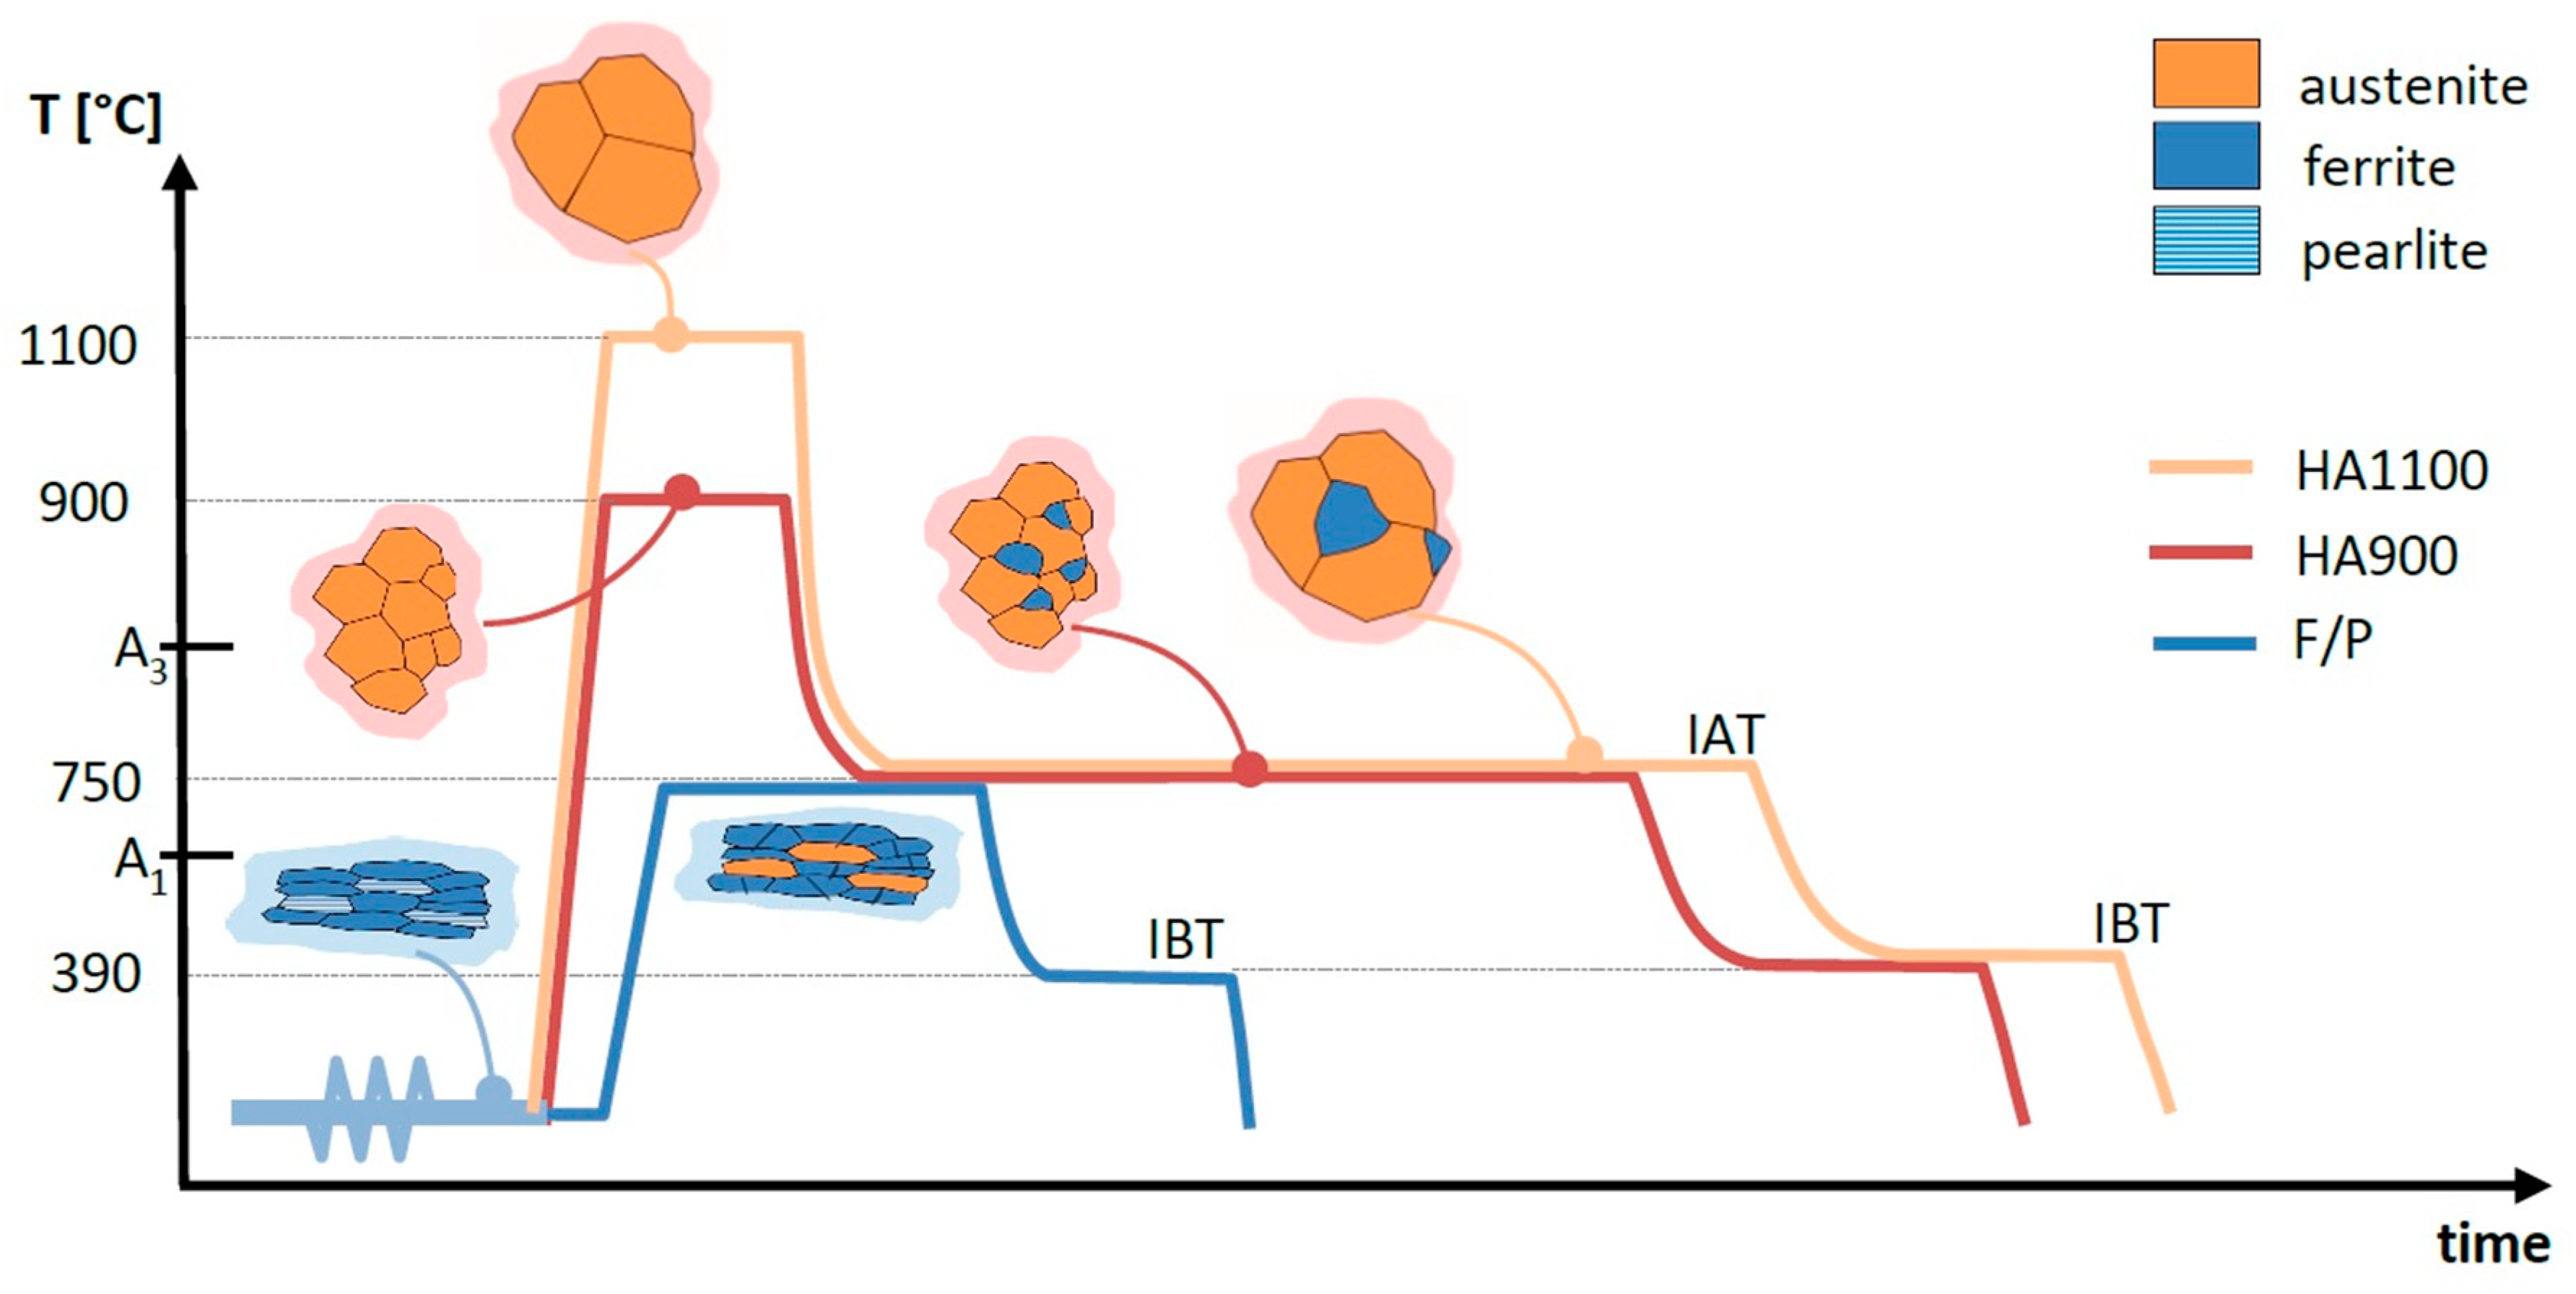
3.1. Heat Treatment Study

To achieve a 1/1 austenite/ferrite proportion in the different steels, different times at the intercritical annealing temperature were necessary. The desired proportion was achieved after only 10 min for F/P steel, while the HA900 and HA1100 steels required 90 and 135 min, respectively. According to Roberts and Mehl [17], the austenite nucleation in ferritic–pearlitic steels is carried out mainly in the ferrite-cementite interphase. Areas with high surface energy, such as grain boundaries and interphases, are favorable sites for nucleation, but a concentration gradient is also necessary. At interphases the gradients are larger and the process is faster. This explains the different times needed in the three steels during intercritical annealing: austenite nucleation was faster in the F/P steel than the ferrite nucleation in the HA steels due to the presence of interphase surfaces and higher carbon concentration gradients in the F/P steel. The ferrite formation in the HA900 steel was slightly faster than in the HA1100 steel because homogenized austenite in the former was finer than in the latter (Table 1), showing more grain boundaries and, thus, more nucleation sites.

3.2. Microstructural Characterization

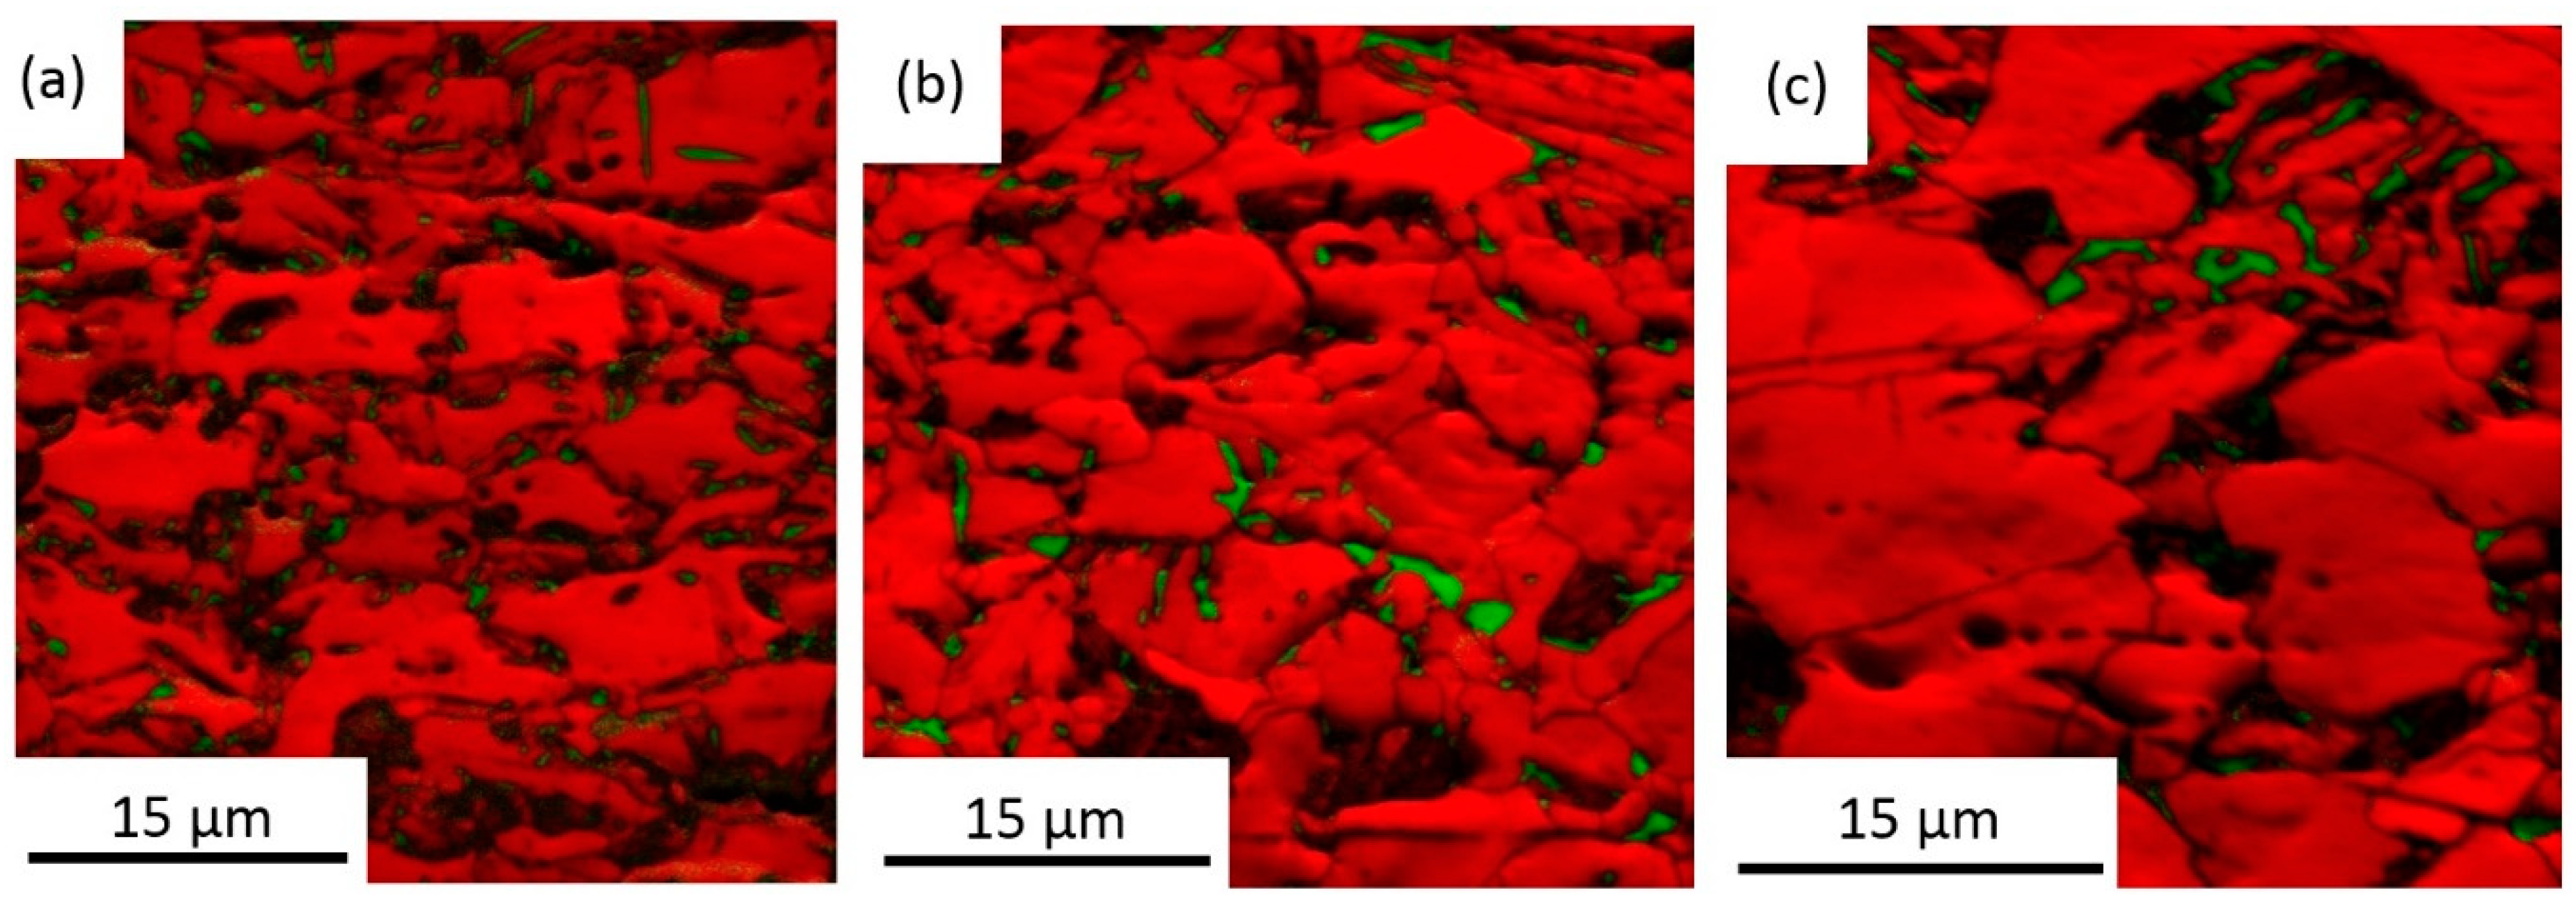
3.2.1. Characterization by Optical Microscopy, SEM, and X-Ray

Figure 3 shows the microstructures of the material before and after heat treatments. The microstructure before heat treatment is 42% cold-rolled ferrite and pearlite (Figure 3a), while the microstructures after the heat treatments of F/P, HA900, and HA1100 are shown in Figure 3b–d, respectively. LePera etching reveals ferrite in light brown and bainite in dark brown, and austenite/martensite phases appear as small white units. While the HA900 (Figure 3c) shows the finest structure, the HA1100 (Figure 3d) exhibits the coarsest. The ferritic grain diameters and ferrite volume fraction obtained by light optical microscopy are shown in Table 2. Figure 4 shows SEM micrographs where the different microstructures can be observed: austenite and/or martensite (A/M), ferrite (F), and bainite (B) that appear near or inside prior austenite blocks. This figure confirms that HA1100 steel has the coarsest microstructure, while F/P shows the finest prior austenite grain size.
Table 3 summarizes the retained austenite volume fractions obtained from X-ray analysis and also the estimated carbon content in austenite. Columns 4 and 5 display absolute and relative amounts of transformed retained austenite. The absolute amount is the transformed austenite volume fraction in the whole material and the relative amount represents the fraction of transformed austenite relative to the initial retained austenite amount. HA1100 steel exhibits the lowest amount of retained austenite.

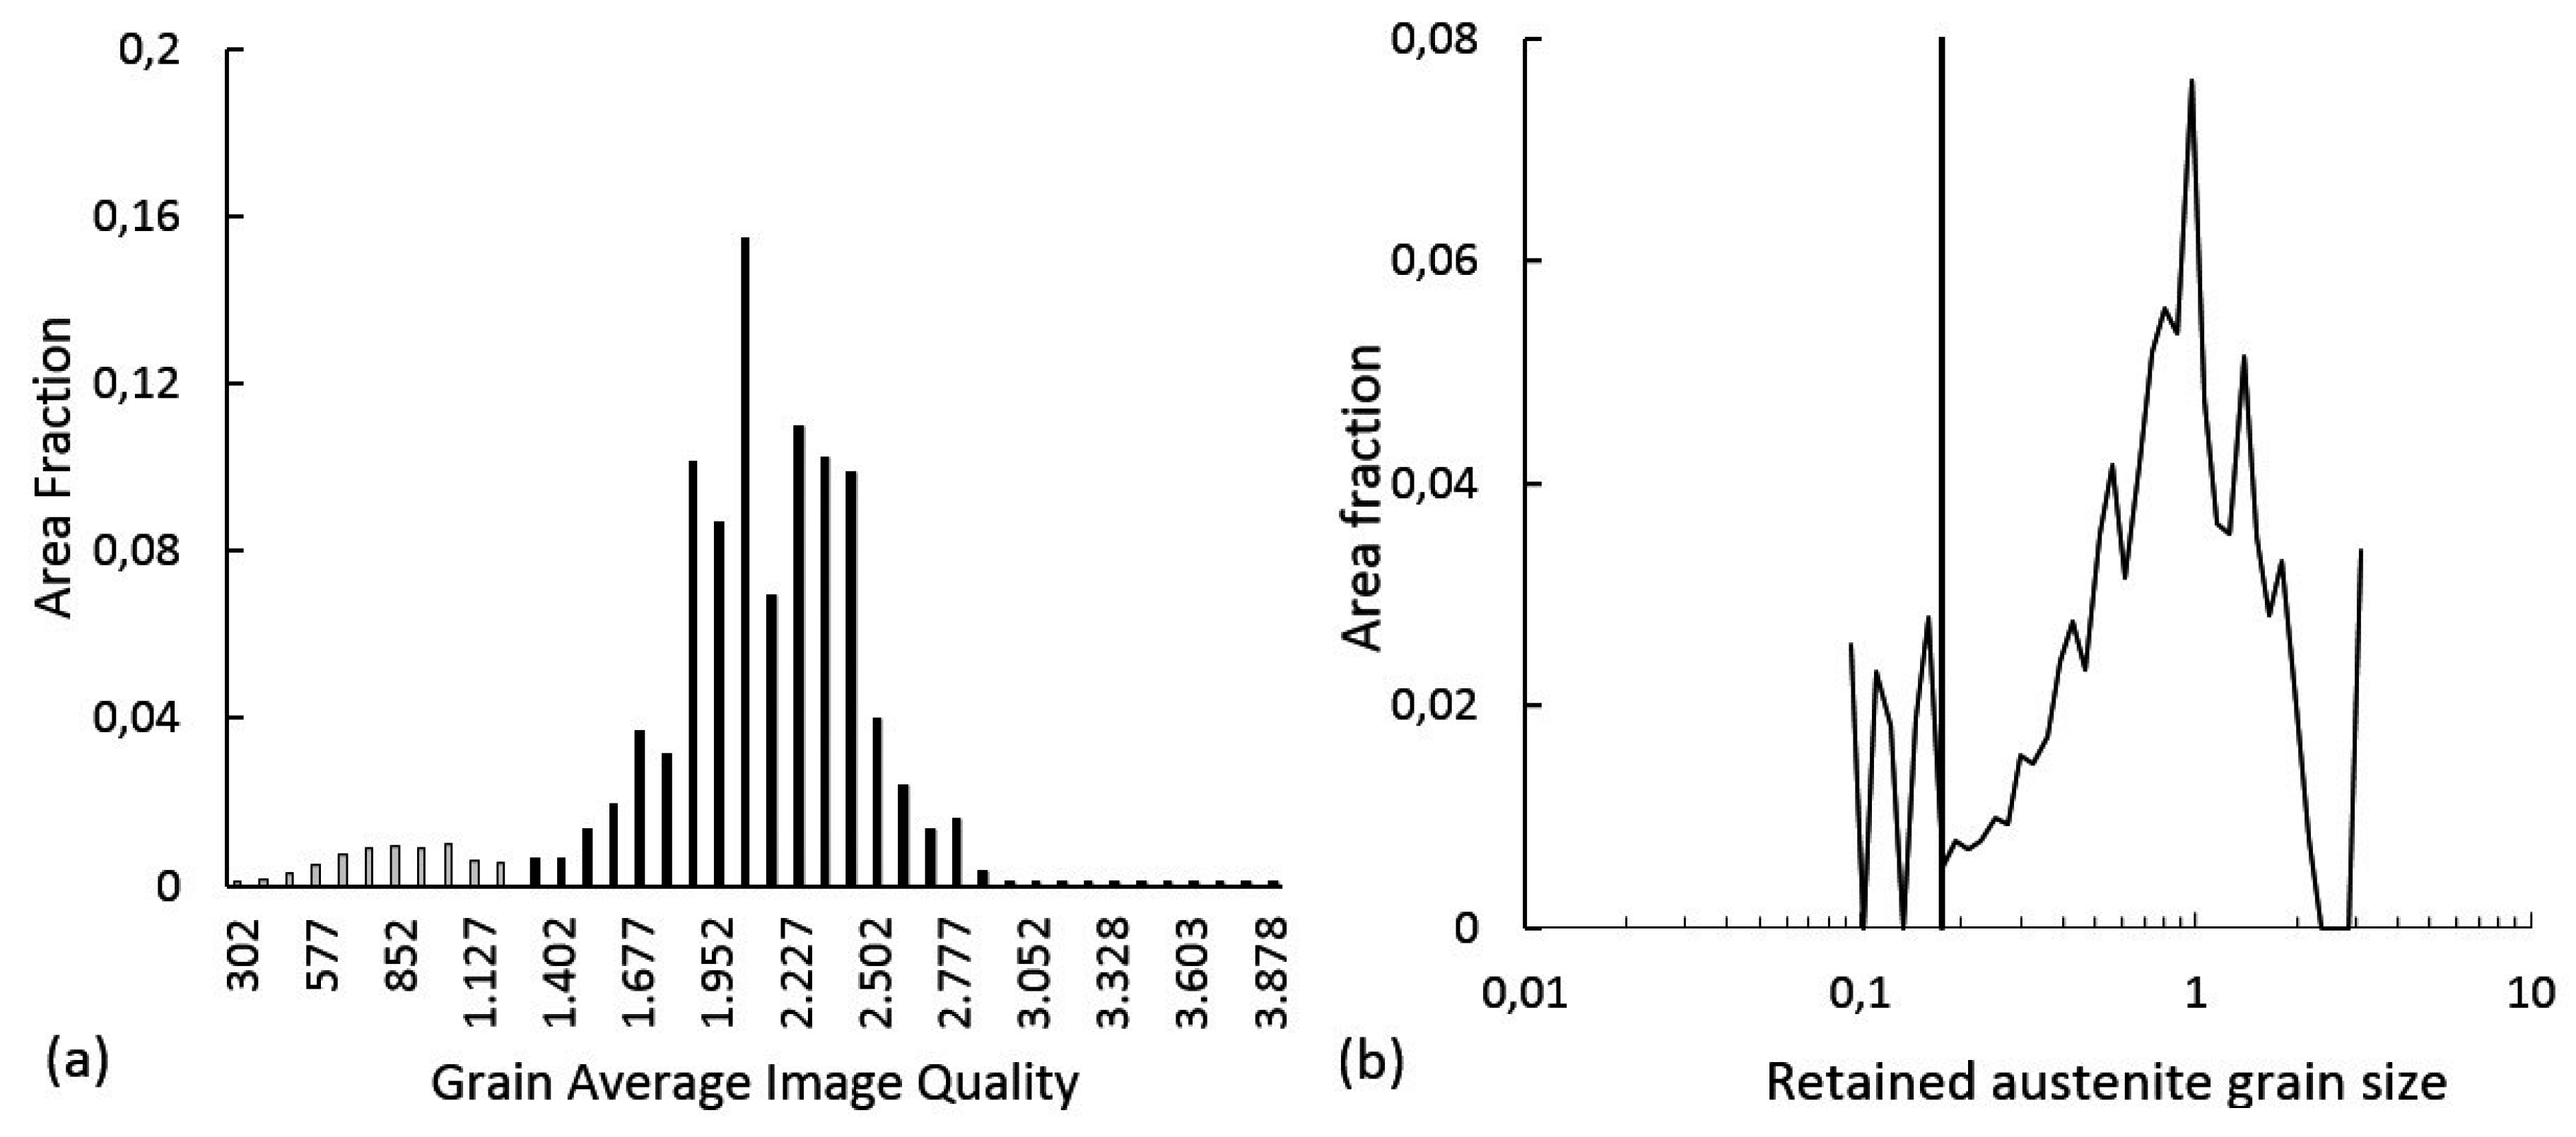
3.2.2. Retained Austenite and Martensite Characterization by EBSD

The retained austenite characteristics were also determined by EBSD. Table 4 shows selected morphological features (grain size, aspect ratio, retained austenite, and martensite fraction) and Figure 5 shows the IQ + phase map. The austenite grain size and aspect ratio are listed in Table 4 for each steel. As there are no important differences in aspect ratios, this parameter cannot be related to the variations in retained austenite stability. The F/P steel shows the smallest retained austenite grain size, while HA steels exhibit larger grain sizes but with similar values despite the different prior austenite grain sizes. A good agreement between X-ray and EBSD results is appreciated when comparing Table 3 and Table 4.

3.3. Texture Analyses

Figure 6 shows the Orientation Distribution Function (ODF) for the BCC structures (mainly ferrite and bainite) in each steel. Figure 6a shows the key for the main orientations in BCC iron. Figure 6 also shows that, in all cases, there is a maximum intensity on {554}<225> and {112}<110> and on variants near to them like {332}<113> and {111}<112> or {113}<110> and {223}<110>. It is known that {554}<225> promotes good drawing properties while {112}<110> is not good for drawing properties [18]. On the other hand, HA steels exhibited a considerably wide range of variants related to {001}<110> texture. Although the three steels exhibit α and γ fiber components, they are clearly more intense in F/P steel.
The retained austenite ODF map for F/P steel (Figure 7b) shows the maximum intensity for Brass, Goss, Copper, and Rotated Goss fiber components. Several authors [18,19] have shown that Copper texture ({112}<111>) generates {113}<110> (and near variants like {112}<110>) in BCC structures due to the Kurdjumov–Sachs (K–S) relationship, while Brass texture ({110}<112>) promotes {332}<113> (and near variants like {554}<225>). On the other hand, Goss texture ({110}<001>) generates {111}<110> and {112}<110> BCC textures. From these results, α and γ fiber textures are expected.
Some authors [18,20] have shown that the {112}<110> ferrite texture component increases significantly with cold rolling, which means that the initial material, 42% cold-rolled proeutectoid ferrite, has a strong {112}<110> texture component. Ray and Jonas [18] have also indicated that ferrite with {112}<110> texture recrystallizes into {554}<225>, which means that during intercritical annealing, ferrite F/P steel should develop a strong {554}<225> texture component. Summarizing, strong α and γ fiber BCC texture components are expected in F/P steel due to ferrite recrystallization and the austenite developed during intercritical annealing treatment at 750 °C.
For HA steels, BCC textures must be related to homogenized austenite textures at 900 and 1100 °C. Retained austenite is expected to inherit its texture from homogenized austenite. Retained austenite ODF maps for HA900 and HA1100 are shown in Figure 7c,d, respectively.
Retained austenite in HA900 steel shows maxima in Cube and Goss textures and also a wide range of variants related to the {110}<112> Brass texture. Cube texture promotes Rotated Cube texture {001}<110> [19]. Brass texture, as previously mentioned, generates {332}<113> (and near texture variants). To a lesser degree, Brass texture can also transform into Rotated Cube variants. In the current case, the main BCC texture components observed for HA900 (Figure 6c) were inherited from the Brass and Cube prior austenite texture.
Retained austenite in HA1100 exhibited a maximum close to the Cube position, and it could be related to {001}<110> texture variants observed on the HA1100 ODF map of the BCC structure (Figure 6d). Figure 7d also shows that the retained austenite exhibits variants close to the Goss and Copper texture components, which are related to α and γ fibers.
According to Ray and Jonas [18] there is an effect of temperature above A3 (and, hence, the austenite grain size) on deformation textures of ferrite: the {332}<113> component in ferrite is markedly strengthened when the initial austenite grain size is small (heated slightly above A3), while {113}<110> remains insensitive to austenitic grain size. This result is in agreement with the current research, in the sense that the {554}<225> component, which comes from {332}<113>, is strong for HA900 steel (austenized at a low temperature).
Based on a scale map of BCC structures (Figure 6), in F/P steel the maximum intensity for components related to γ fiber is 5.2 multiples of random density (mrd); in HA900 steel, it is 2.9 mrd, and in HA1100 steel, it is 2.5 mrd. For HA steels, the intensity of Rotated Cube components is higher than for F/P steel, which means that the ratio between γ fiber and Rotated Cube is higher for the latter. Due to these facts, the F/P steel is expected to have a better deep drawing behavior than the HA steels, provided that there are no other disturbing constituents in the microstructure.

3.4. Retained Austenite Stabilization

3.4.1. Mechanical Stability

Mechanical stability was evaluated by measuring the austenite volume fraction transformed into martensite due to the strain imposed by the tensile testing. These results are shown in Table 3. The F/P steel exhibited less relative transformation than the HA steels. This implies that retained austenite is more stable in F/P steel. These results, along with the austenite grain sizes shown in Table 4, are in agreement with results from other authors [6,7]: the coarser the retained austenite, the lower its stability. Both HA steels presented similar retained austenite grain size, and, in both cases, the residual austenite volume fraction after tensile testing was nearly zero. Although it is difficult to compare the mechanical stability between HA steels, the main conclusion is that the retained austenite was unstable and prone to transform into martensite during deformation.

3.4.2. Chemical Stability

The chemical stability was measured by the fraction of austenite transformed into martensite during cooling from the austempering temperature. These results are shown in Table 4. Clearly, the austenite in F/P steel is the most stable. Although HA steels exhibits a similar mechanical stability, there is an important difference in chemical stability. Due to the coarser prior austenite, the HA1100 steel presents the less stable austenite. This instability comes from the larger defect density associated to a larger grain size [8] and, therefore, a higher number of available sites for martensite nucleation.

3.5. Mechanical Properties

The tensile test results are summarized in Table 5. Figure 8 shows true stress versus true strain curves in the homogeneous deformation range. As the F/P steel austenite has the highest chemical stability, there is a low amount of austenite–martensite transformation by cooling from austempering and a lower dislocation increment in the ferrite matrix due to the Greenwood–Johnson [21] effect (dislocation increment in the ferrite matrix due to volume accommodation by austenite martensite transformation). Hence, ferrite in the F/P steel exhibits a lower hardening and a consequent larger straining capacity. In order to understand the highest elongation of the F/P steel, it must be considered that TRIP steels are constituted by ferrite, bainite, austenite, and martensite, with ferrite (a soft constituent) and bainite (hard constituent) present in similar proportions, although in larger amounts than austenite and martensite. So, ferrite is expected to be the constituent that contributes the most to the total strain. Then, as the F/P steel ferrite has the lowest hardening by austenite transformation, this steel exhibits the highest plastic deformation.
HA steels exhibit a similar UTS and elongation behavior, though with marked microstructural differences. HA1100 presents the highest yield strength (YS) and HA900 steel has the highest work hardening exponent. The highest n value for HA900 steel may be due to the greater absolute amount of retained austenite transformed into martensite by plastic strain and to its finest microstructure. The F/P steel shows the lowest UTS due to the low fraction of austenite transformed into martensite in both ways: after cooling from austempering and under plastic strain.

4. Conclusions

The novelty of this paper consists of obtaining, in a steel with the same chemical composition, similar α/γ fractions after intercritical annealing treatment from three different microstructures: ferrite/pearlite and homogenized austenite with two different prior grain sizes (10.3 µm and 18.9 µm). This allowed us to relate microstructural characteristics to austenite stability and mechanical properties. The most important findings can be summarized as follows:
  • A change from 900 to 1100 °C in the homogenization temperature of austenite does not exert an effect on the retained austenite grain size, but it does affect the prior austenite grain size and the austenite chemical stability. At a homogenization temperature of 1100 °C, the chemical stability is lower (higher MS) than after homogenization at 900 °C, and a higher amount of austenite transforms into martensite after cooling from the austempering treatment.
  • The steels homogenized at 1100 and 900 °C exhibit the highest UTS value. This is related to the austenite martensite transformation which induces an extra dislocation increment and, consequently, a high strength.
  • This extra dislocation increment also decreases the strain ability, so the homogenized steels exhibit lower elongation than the ferrite–pearlite steel.
  • The global mechanical response is also related to the surrounding phases. Thus, the steel homogenized at 900 °C exhibits the highest strain hardening index, due to its finest microstructure.
  • An austenization treatment at an elevated temperature increases the yield strength. The steel homogenized at 1100 °C exhibits the highest YS despite its coarsest microstructure.
  • A cold-rolled ferrite–pearlite initial microstructure promotes better texture components for deep drawing processes than a homogenized austenite initial microstructure. For the HA initial microstructure, a lower homogenization temperature promotes γ fiber components.

Author Contributions

Conceptualization, A.S., J.P.-I., F.C.-C. and A.M.; Data curation, A.S., N.G.-M.-d.-O., R.C. and R.P.; Formal analysis, A.S.; Funding acquisition, A.M.; Investigation, A.A., N.G.-M.-d.-O., R.C. and R.P.; Methodology, A.S., A.A. and A.M.; Project administration, A.M.; Supervision, A.M.; Writing—original draft, A.S.; Writing—review & editing, A.S., J.P.-I. and A.M.

Funding

“Proyectos Basal USA 1555—Vridei 051714MG_MOV. Universidad Santiago de Chile”, FONDECYT Grant 1170905, CONICYT-PFCHA/Doctorado Nacional/2013-21130833, and DICYT USACH.

Acknowledgments

The authors wish to thank to “Proyectos Basal USA 1555—Vridei 051714MG_MOV. Universidad Santiago de Chile”, FONDECYT Grant 1170905, CONICYT-PFCHA/Doctorado Nacional/2013-21130833, and DICYT USACH for the financial support.

Conflicts of Interest

The authors declare no conflict of interest. The funders had no role in the design of the study; in the collection, analyses, or interpretation of data; in the writing of the manuscript, and in the decision to publish the results.

References

  1. Petrov, R.; Kestens, L.; Houbaert, Y. Recrystallization of a cold rolled trip-assisted steel during reheating for intercritical annealing. ISIJ Int. 2001, 41, 883–890. [Google Scholar] [CrossRef]
  2. Jacques, P.J.; Furnémont, Q.; Lani, F.; Pardoen, T.; Delannay, F. Multiscale mechanics of TRIP-assisted multiphase steels: I. Characterization and mechanical testing. Acta Mater. 2007, 55, 3684–3693. [Google Scholar] [CrossRef]
  3. Van Dijk, N.H.; Butt, A.M.; Zhao, L.; Sietsma, J.; Offerman, S.E.; Wright, J.P.; Van der Zwaag, S. Thermal stability of retained austenite in TRIP steels studied by synchrotron X-ray diffraction during cooling. Acta Mater. 2005, 53, 5439–5447. [Google Scholar] [CrossRef]
  4. Zrník, J.; Muránsky, O.; Lukáš, P.; Nový, Z.; Sittner, P.; Horňak, P. Retained austenite stability investigation in TRIP steel using neutron diffraction. Mater. Sci. Eng. A 2006, 437, 114–119. [Google Scholar] [CrossRef]
  5. Van Der Zwaag, S.; Zhao, L.; Kruijver, S.O.; Sietsma, J. Thermal and mechanical stability of retained austenite in aluminum-containing multiphase TRIP steels. ISIJ Int. 2002, 42, 1565–1570. [Google Scholar] [CrossRef]
  6. Basuki, A.; Aernoudt, E. Influence of rolling of TRIP steel in the intercritical region on the stability of retained austenite. J. Mater. Process. Technol. 1999, 89–90, 37–43. [Google Scholar] [CrossRef]
  7. Wang, X.D.; Huang, B.X.; Rong, Y.H.; Wang, L. Microstructures and stability of retained austenite in TRIP steels. Mater. Sci. Eng. A 2006, 438–440, 300–305. [Google Scholar] [CrossRef]
  8. Chatterjee, S. Transformations in TRIP-assisted Steels: Microstructure and Properties. Ph.D. Thesis, Cambridge University, Cambridge, UK, November 2006. [Google Scholar]
  9. Sugimoto, K.; Usui, N.; Kobayashi, M.; Hashimoto, S. Effects of volume fraction and stability of retained austenite on ductility of TRIP-aided dual-phase steels. ISIJ Int. 1992, 32, 1311–1318. [Google Scholar] [CrossRef]
  10. Pereloma, E.V.; Timokhina, I.B.; Miller, M.K.; Hodgson, P.D. Three-dimensional atom probe analysis of solute distribution in thermomechanically processed TRIP steels. Acta Mater. 2007, 55, 2587–2598. [Google Scholar] [CrossRef]
  11. De Cooman, B.C. Structure–properties relationship in TRIP steels containing carbide-free bainite. Curr. Opin. Solid State Mater. Sci. 2004, 8, 285–303. [Google Scholar] [CrossRef]
  12. Guzmán, A. Obtención y estudio de las propiedades mecánicas y microestructurales de un acero con comportamiento TRIP (0,21%C, 0,82%Si, 1,87%Mn y 0,43%Al). Ph.D. Thesis, Universidad de Santiago de Chile, Santiago, Chile, May 2013. [Google Scholar]
  13. Matsumara, O.; Sakuma, Y.; Takechi, H. Enhancement of elongation by retained austenite in intercritical annealed 0.4C-1.5Si-0.8Mn steel. Trans. ISIJ 1987, 27, 570–579. [Google Scholar] [CrossRef]
  14. Roberts, C.S. Effect of carbon on the volume fractions and lattice parameters of retained austenite and martensite. JOM 1953, 197, 203–204. [Google Scholar] [CrossRef]
  15. Ryde, L. Application of EBSD to analysis of microstructures in commercial steels. Mater. Sci. Technol. 2006, 22, 1297–1306. [Google Scholar] [CrossRef]
  16. Petrov, R.; Kestens, L. Advanced high-strength steels: Electron Backscatter diffraction (EBSD). In Encyclopedia of Iron, Steel and Their Alloys; Colás, R., Totten, G.E., Eds.; CRC Press: Boca Ratón, FL, USA, 2016; pp. 46–69. [Google Scholar] [CrossRef]
  17. Roberts, G.A.; Mehl, R.F. The mechanism and the rate of formation of austenite from ferrite-cementite aggregates. Trans. ASM 1943, 31, 613–650. [Google Scholar]
  18. Ray, R.K.; Jonas, J.J. Transformation textures in steels. Int. Mater. Rev. 1990, 35, 1–36. [Google Scholar] [CrossRef]
  19. Butrón-Guillén, M.P.; Jonas, J.J.; Ray, R.K. Effect of austenite pancaking on texture formation in a plain carbon and a Nb microalloyed steel. Acta Metall. Mater. 1994, 42, 3615–3627. [Google Scholar] [CrossRef]
  20. Hutchinson, B. Deformation microstructures and textures in steels. Philos. Trans. R. Soc. A 1999, 357, 1471–1485. [Google Scholar] [CrossRef]
  21. Greenwood, G.W.; Johnson, R.H. The deformation of metals under small stresses during phase transformations. Proc. R. Soc. A 1965, 283, 403–422. [Google Scholar] [CrossRef]
Figure 1. Schematic representation of heat treatments to obtain multiphase Transformation-Induced Plasticity (TRIP)-assisted steels.
Metals 08 01021 g001
Figure 2. (a) Grain Average Image Quality (GAIQ) Distribution for HA900 steel. Light grey, low GAIQ distribution (martensite indexed). (b) Retained austenite grain size distribution for HA900. Grain sizes to the left of the bold threshold were not considerate for analysis.
Metals 08 01021 g002
Figure 3. Microstructures: (a) cold-worked ferrite and pearlite, Nital; (b) F/P, LePera; (c) HA900, LePera; (d) HA1100, LePera. (bd) show three multiphase low-alloy TRIP steel microstructures.
Metals 08 01021 g003
Figure 4. SEM micrographs of representative samples of each steel. (a) F/P, (b) HA900, (c) HA1100. A/M: Austenite/Martensite, F: Ferrite, B: Bainite.
Metals 08 01021 g004
Figure 5. IQ + phase map for each steel. From the IQ map, dark zones correspond to low IQ value; from the phase map, BCC structures (ferrite, bainite, martensite) are in red, and FCC structures (austenite) are in green. (a) F/P steel, (b) HA900 steel, (c) HA1100 steel. Step size 60 nm.
Metals 08 01021 g005
Figure 6. (a) Orientation Distribution Function (ODF) map with exact positions of important orientations for bcc structures in steel; Euler space (ϕ2 = 45°) section. (bd) Euler space sections of the ODFs of the constituents with bcc structures for F/P, HA900, and HA1100 steel, respectively, at the same intensity scale (ϕ2 = 45°). Bunge notation. Intensity in mrd (multiple of random density).
Metals 08 01021 g006
Figure 7. (a) Exact position of the most important austenite texture components on Euler space sections φ1 = (0°, 90°), ϕ = (0°, 90°), and φ2 = 45°. (bd) Retained austenite ODF maps of F/P, HA900, and HA1100, respectively. Bunge notation. Intensity in mrd.
Metals 08 01021 g007
Figure 8. True stress versus true strain curves.
Metals 08 01021 g008
Table 1. Parameters for the heat treatments and austenite grain size after austenitization.
Steel IDAust. *IAT **IBT ***PAGS ****
[°C][min][°C][min][°C][min][μm]
F/P----750103907--
HA9009001075090390710.3 ± 0.8
HA1100110010750135390718.9 ± 3.5
* Austenization. ** Intercritical Annealing Treatment. *** Isothermal Bainitic Treatment. **** Prior Austenite Grain Size (developed during the HA treatment).
Table 2. Ferrite volume fraction and grain size average.
Steel IDF/PHA900HA1100
Ferrite grain size [µm]9 ± 48 ± 311 ± 2
Vferrite [%]444546
Table 3. Retained austenite volume fraction obtained by X-ray.
Steel ID% Aust. BTT *% Aust. ATT **Transf. Aust.Transf. Aust. % ***% C Ret. Aust. ****
F/P5.72.23.5621.11
HA9005.00.54.5890.97
HA11003.70.43.3901.07
* Austenite Before Tensile Test; ** Austenite After Tensile Test; *** Transformed Austenite %; **** % Carbon in Retained Austenite
Table 4. Characteristics of retained austenite obtained by electron backscattered diffraction (EBSD).
Steel IDF/PHA900HA1100
grain size [μm]0.7 ± 0.31.0 ± 0.61.0 ± 0.5
aspect ratio2.7 ± 1.62.6 ± 1.32.9 ± 1.6
RA vol. fraction %5.95,33.5
martensite vol. fraction %2.54.14.8
aust. after IB treatment %8.49.48.3
aust. transf. to martensite by cooling from IB %30.043.657.8
Table 5. Mechanical properties (average of three tests).
Steel IDUTS [MPa]YS [MPa]Elongation [%]Hardening Index n
F/P385 ± 27732 ± 1322.7 ± 2.00.19 ± 0.00
HA900401 ± 39787 ± 2316.8 ± 0.70.22 ± 0.01
HA1100438 ± 16796 ± 816.3 ± 1.70.20 ± 0.00

