Study of the Effect of Carbon on the Contraction of Hypo-Peritectic Steels during Initial Solidification by Surface Roughness

College of Materials Science and Engineering, Chongqing University, Chongqing 400044, China
*
Author to whom correspondence should be addressed.
Metals 2018, 8(12), 982; https://doi.org/10.3390/met8120982
Submission received: 15 October 2018
/
Revised: 30 October 2018
/
Accepted: 20 November 2018
/
Published: 23 November 2018
Abstract
:In the continuous casting process, the shrinkage of the peritectic phase transition during the initial solidification process has an important influence on the surface quality of peritectic steel. The initial solidification process of 0.10C%, 0.14C%, and 0.16C% peritectic steels was observed in situ by a high temperature laser confocal microscope, and the contraction degree during initial solidification was characterized by surface roughness. The results showed that under the cooling rate of 20 °C/s, the surface roughness value Ra(δ/γ) of 0.10C% peritectic steel was 32 μm, the Ra(δ/γ) value of 0.14C% peritectic steel was 25 μm, and the Ra(δ/γ) value of 0.16C% peritectic steel was 17 μm. With increasing carbon content, the contraction degree of the δ→γ transformation decreased, and the value of the surface roughness Ra(δ/γ) declined. Therefore, surface roughness can characterize the contraction degree of the δ→γ transformation in the initial solidification process of peritectic steel under the condition of a large cooling rate.
1. Introduction
The surface quality of hypo-peritectic steel has been a long-term research topic in continuous casting technology. Early research on slabs showed that hypo-peritectic steel with a carbon content of 0.09–0.18% was prone to longitudinal cracks. To discover the reason behind the longitudinal cracks, researchers have focused their attention on the δ→γ phase transformation of these steels [1,2,3]. During the initial solidification process of hypo-peritectic steel, the inhomogeneous air gap between the shell and the wall of the mold is caused by the contraction of the δ→γ transformation, resulting in uneven heat transfer between the shell and the mold, leading to a nonuniform stress distribution inside the shell. Under the effect of thermal stress, friction force, hydrostatic pressure, etc., the weakness of the shell can easily cause the formation and development of cracks [4,5,6]. With increases in the productivity and hot-rolling rate, the surface cracks of hypo-peritectic steel slabs become stubborn defects that affect the production of continuous casting [7,8,9]. Therefore, it is of great scientific and practical significance to study the degree of shrinkage of the peritectic phase transition during the initial solidification of hypo-peritectic steel.
Matsumiya et al. [10] calculated the stress and strain of free shrinkage with different carbon content steels during the solidification process and pointed out that the tensile stress of the 0.14C% steel shell reached maximum value. Jablonka et al. [11] calculated the relationship between the carbon content and the shrinkage of the shell under different degrees of undercooling. However, there is a big gap between the mathematical model and the actual solidification process of steel. Therefore, researchers have designed a variety of high-temperature laboratory experiments, such as dipping test experiments [12], the molten steel droplet method [13,14], differential scanning calorimetry [15], and the submerged split chill tensile test method [16], to simulate the solidification process of steel in continuous casting, hoping to verify the results of the mathematical models. However, none of the abovementioned experimental methods could obtain the degree of undercooling and cooling rate during the solidification of the shell, and their results regarding the relationship between the shrinkage degree and the carbon content lacked the background condition, such as the degree of undercooling and cooling rate.
Shibata et al. [17] and Dippenaar et al. [18] simulated the solidification process of peritectic steels using high-temperature laser confocal microscopy and studied the effect of the cooling rate on the peritectic transformation. Their results indicated that the peritectic δ→γ transformation process was accompanied by the generation of surface wrinkles. When the cooling rate was 20 K/min, if the carbon content approached 0.10C%, the displacement velocity of the δ/γ boundary increased synchronously. Additionally, the interface displacement velocity was related to the shrinkage degree of the peritectic δ→γ transformation. However, the cooling rate in the above experiment was significantly lower than the maximum cooling rate in the meniscus region of continuous casting. Griesser et al. [19] suggested that as the degree of undercooling increased, the peritectic transformation process evolved from a planar to a dendrite-like transition and eventually became a massive-type transformation. When the δ→γ transformation is performed in a massive-type mode, the γ/δ interface displacement velocity cannot be measured.
Guo et al. [20] proposed the use of surface roughness Ra(δ/γ) to characterize the degree of peritectic δ→γ transformation. Under the cooling condition of 20 °C/s, the surface roughness of the steel sample changed significantly after the peritectic δ→γ transformation. The value of the surface roughness Ra(δ/γ) correlated to the shrinkage degree of peritectic δ→γ transformation. This method can characterize the shrinkage degree of the δ→γ transformation under large cooling conditions. However, this method has not been applied to study the effect of carbon content on the shrinkage degree of peritectic δ→γ transformation under large cooling conditions.
In order to study the effect of carbon content on the contraction degree of δ→γ transformation under a large cooling rate, this paper characterized the contraction degree by surface roughness. Through in situ observations of the δ→γ transformation process at 20 °C/s, we measured the surface roughness Ra(δ/γ) values of 0.10C%, 0.14C%, and 0.16C% peritectic steels using high temperature laser confocal microscopy. It is hoped that the research results can provide boundary conditions for the calculation model to measure the quantitative relationship between the contraction degree of the peritectic phase transition and the surface roughness under a large cooling rate.
2. Materials and Methods
2.1. Materials
In order to study the effect of carbon content on the degree of peritectic δ→γ transformation shrinkage under a large cooling condition, 0.10C%, 0.14C%, and 0.16C% hypo-peritectic steels were selected as the experimental steel samples. The chemical compositions of the steel samples were analyzed through optical emission spectrometry (Table 1).
2.2. Confocal Scanning Laser Microscope (CSLM)
A Yonekura VL2000DX-SVF17SP confocal scanning laser microscope (CSLM) (Lasertec, Yokohama, Japan) was used to heat and cool the steel [21]. The most important feature of the CSLM is the ability to perform in situ observations of the steel during the melting, solidification, and cooling processes. The heating furnace is the core part of the CSLM (effective heating area: 10 mm × 10 mm, heating temperature range: 50–1800 °C, maximum heating rate: 10 °C/s, maximum cooling rate: 100 °C/s), which is controlled by the temperature system and monitored in real time. Based on the above advantages, CSLM has been used by many researchers to scrutinize the solidification process of steel in situ [17,18,19,20]. A standard objective lens was used to measure the surface roughness (Ra) with the corresponding computer software (NIS-Elements C, Yokohama, Japan) to obtain the 3D image information of the samples through a CSLM.
The experimental steel slab was cut into cylindrical specimens with a diameter of 7.8 mm and a height of 2.5 mm, then sanded and polished with sandpaper. Using CSLM to simulate the solidification process of the sample, the thermal scheme of the steel sample is shown in Figure 1. The temperature of the steel sample was raised from room temperature to TL + 30 °C with a rate of 10 °C/s, which was then was held for 1 min to ensure the complete melting of the steel sample. Where TL represent the melting temperature of the steel sample. Next, a quick cooling rate of 20 °C/s was applied to cool the samples to 1200 °C. Finally, the sample was cooled to room temperature with a cooling rate of 1 °C/s. The cooling air was high purity argon (6 N) and a video was recorded at 20 frames per second during the cooling process. The heating system was turned off, and then the surface roughness of the solidified steel samples at room temperature was measured using a laser confocal microscope.
2.3. Measurement of Surface Roughness Ra(δ/γ)
Figure 2a shows the surface morphology obtained by the high temperature laser confocal microscopy experiments. Guo et al. [20] quantified the δ→γ transformation shrinkage degree using the value of the surface roughness Ra(δ/γ). When measuring the surface roughness of the steel sample, the measurement area on the sample surface was first selected. As shown in Figure 2b, the hollows were caused by the liquid-phase shrinkage of the sample during the solidification process, so measuring the surface roughness on the grains can avoid the effect of liquid shrinkage on the surface morphology of the steel sample. After completing the 3D scanning, surface roughness measurements were performed by drawing the roughness measurement line, as shown by the red line in Figure 2c. The roughness measurement program outputs the laser reflection signal at the measuring line position as roughness [22,23,24,25]. To ensure the accuracy of the data, multiple areas were selected for multipoint measurements.
In order to verify the accuracy of the surface roughness, 0.54C% high carbon steel was selected as the reference steel. There is no δ→γ transformation in 0.54C% high carbon steel, so the surface roughness can only be caused by the low temperature phase transition. Figure 3 shows the surface measurement area of the 0.54C% high carbon steel. The blue arrow shows the direction of the surface wrinkles. Guo et al. [20] made the measurement line perpendicular to the direction of the surface wrinkles, as seen a-1–a-3 in Figure 3. The results of the a-method are displayed, where the value of surface roughness Ra was 10.43 μm. However, when the surface roughness measurement line was along the direction of the wrinkles (measurement line “b”, for example), the value of the surface roughness Ra was less than 1 μm.
According to the results of Guo et al. [20], the surface roughness of peritectic steel was influenced by the δ→γ transformation in the high temperature range and the γ→α, γ→α + transformation in the low temperature range. Additionally, the δ→γ transformation surface roughness Ra(δ/γ) of peritectic steel can be calculated by Equation (1) [20]. As described earlier, when measuring the surface roughness of 0.54C% high carbon steel by the b-method, the value of the surface roughness was less than 1 μm. Therefore, the b-method could avoid the influence of low-temperature phase transformation (γ→α, γ→α + Fe3C) on surface roughness. In this paper, the surface roughness Ra(δ/γ) of peritectic steel was measured using the b-method.
3. Results and Discussion
3.1. Solidification Process of Steels during Cooling
Here, the solidification processes of three kinds of peritectic steels with different carbon content were observed using a CSLM, and the solidification processes were analyzed in combination with the evolution of the microstructure.
3.1.1. 0.10C% Hypo-Peritectic Steel
Figure 4 shows the change in the steel sample’s surface when S1 cooled from the liquid state to the solid phase. The big cooling rate during the early stage of solidification delayed the temperature of nucleation and transformation; thus, the steel sample at high temperature in the non-equilibrium state obtained a large degree of undercooling. When the temperature was lower than 1488.3 °C, the δ phase began to nucleate and grow gradually. The liquid contracted continuously due to cooling, and liquid hollows formed between the δ grains (the black region in Figure 4a,b). The solidification process in the hollows could not be observed, as the reflected light from the hollows could not be reflected back. Therefore, the exact temperature at which the liquid phase of the steel disappeared could not be determined in this experiment. As shown in Figure 4b,c, the surface of the δ grains remained smooth until the temperature decreased to 1328.5 °C, then the surface wrinkled. Shibata et al. [14] and Dippenaar et al. [18] also noticed this phenomenon when observing the δ→γ transformation process through a CSLM in situ, and Guo et al. [20] deemed the wrinkles to be the surface roughness due to the δ→γ transformation. As the transition rate was too fast, only the change in the surface roughness of the steel sample before and after the transition was observed.
The δ→γ transformation temperature of the S1 steel sample ranged from 1328.5 °C to 1303.1 °C. When the temperature was below 1303.1 °C, wrinkles were no longer added the surface of the steel sample until the temperature lowered to the range of 721–650 °C, which was when the wrinkles in the steel surface increased again. The appearance of the wrinkles in this temperature range is shown in Figure 4d, which had directionality in a small range and could hardly separate the influence of eutectoid transformation and the transformation of austenite to proeutectoid ferrite on the surface roughness. Therefore, the change of surface roughness after 721 °C was considered to be the result of the joint action of the austenite to proeutectoid ferrite transformation process and eutectoid transformation. After 650 °C, no change in the surface roughness of the steel sample was observed by the CSLM.
3.1.2. 0.14C% Hypo-Peritectic Steel
Figure 5 shows the change of surface roughness during the solidification process of S2. It can be seen that the δ-ferrite nucleated from the liquid phase at 1464.2 °C. Similar to the solidification process of S1, the liquid formed hollows due to the shrinkage. The temperature range of the δ→γ transformation of S2 was 1334–1299.7 °C. Figure 5b,c exhibits the contrast of the surface before and after the transformation, where surface wrinkles generated on the crystal surfaces. When the temperature was below 1299.7 °C, the surface of the steel sample no longer continued to grow wrinkles until the temperature dropped to the range of 720–640 °C, which was when the surface wrinkles increased again. The appearance of the wrinkles in this temperature range is shown in Figure 5d, which had directionality in a small range.
3.1.3. 0.16C% Hypo-Peritectic Steel
Figure 6 shows the solidification process of S3, where the δ-ferrite nucleated from the liquid phase at 1461.7 °C. It was observed that the peritectic transition temperature of S3 was around 1303.1–1297.7 °C. As shown in Figure 6c, the steel surface became rough after the peritectic phase transition, and the surface roughness was definitely caused by the δ→γ transformation shrinkage as surface roughness Ra(δ/γ). When the temperature dropped to the range of 713.5–642 °C, wrinkles appeared once again on the surface of S3, and these wrinkles were defined as the low temperature phase transformation surface roughness. Unlike the surface roughness Ra(δ/γ), the low temperature phase transformation surface roughness had a certain directionality in a small range.
3.2. Surface Roughness Ra(δ/γ)
During solidification process, the δ/γ phase transformation accompanied by the change of lattice structure, resulting in a difference in thermal expansion coefficient, causing stress concentration and shrinkage on the surface [26,27]. Figure 7 is the surface measurement area of S1 as observed through a CSLM, where the low temperature phase transformation surface roughness had directionality, as shown by the blue arrow in Figure 7. Liu et al. [28] suggested that the low temperature wrinkling represented the transformation of austenite to proeutectoid ferrite, where under a cooling rate of 1 °C/s, the proeutectoid ferrite first grew in the original austenite grain boundary nucleation and along the grain boundary. Therefore, the direction of the low temperature phase transformation surface roughness is dependent on the growth orientation of the proeutectoid ferrite. The two different results of the a-method and b-method are shown in Table 2. Surface roughness has a variety of parameters, and Ra is widely used as it is a representative estimate of surface roughness, it is easily calculated, the equipment for it is affordable, and it can be expressed in the overall contour deviation from the centerline [29,30]. For the a-method, the average value of Ra was 39.5 μm, and after calculation by Equation (1) [20], the value of the δ→γ transformation surface roughness Ra(δ/γ) was 29.5 μm. Furthermore, the average value of the b-method was 32 μm, which was similar to the Ra(δ/γ) value of 29.5 μm. Therefore, the surface roughness measurement line along the direction of the wrinkles avoided the influence of low-temperature phase transformation on surface roughness and measured the value of surface roughness Ra(δ/γ) directly.
where Rmax is the maximum surface roughness; Cmax is the nondimensional constant; x is the plastic strain; and dy is the grain size in the vertical direction.
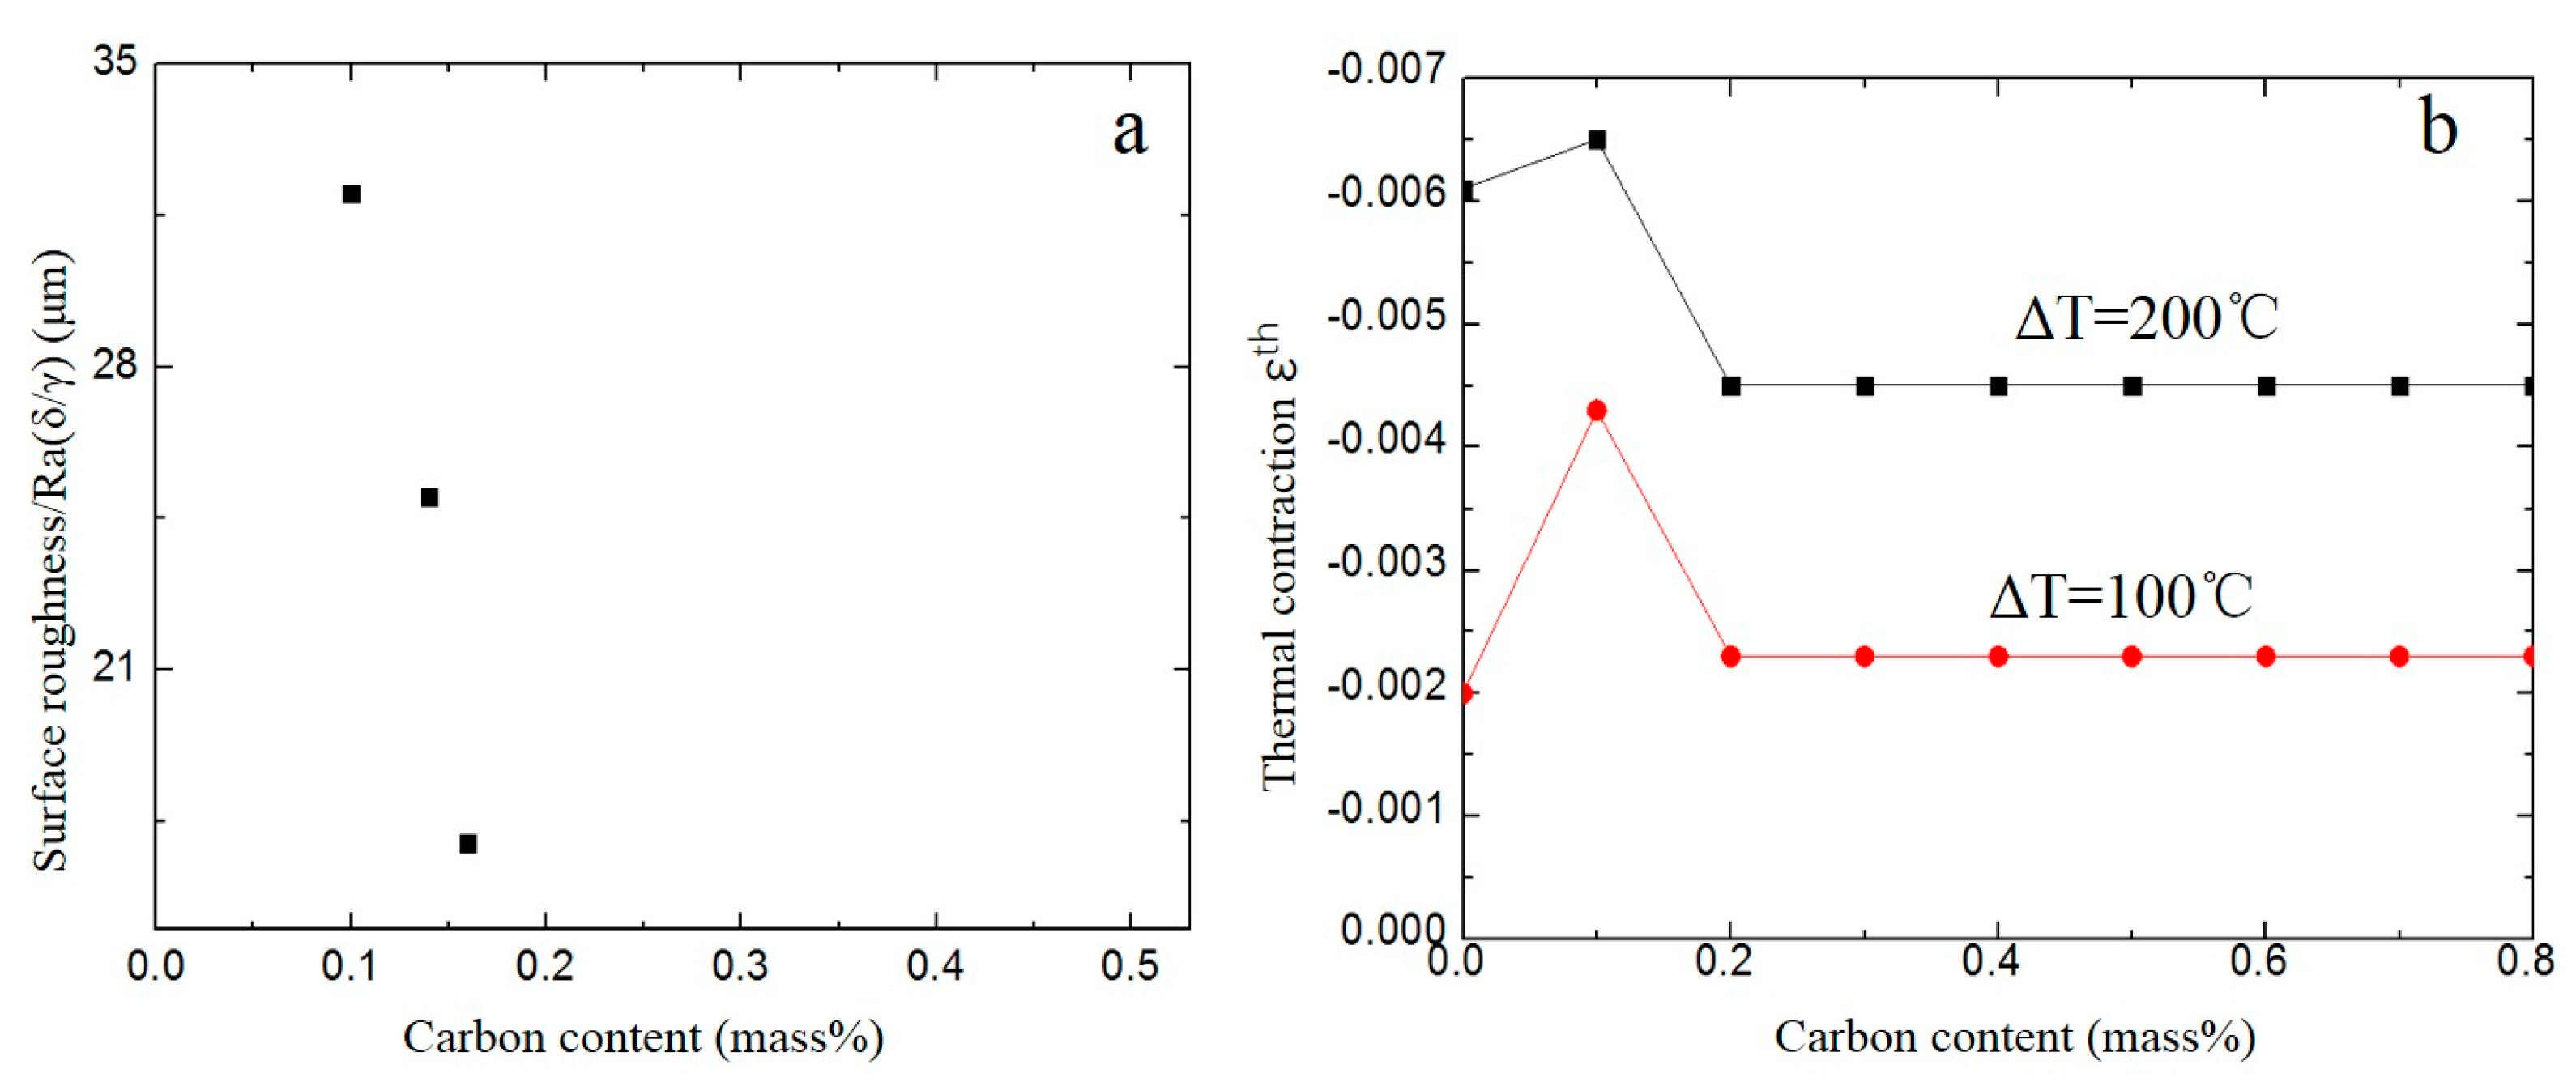
Figure 8a shows the relationship between the surface roughness value Ra(δ/γ) and the steel carbon content. Abe et al. [31] considered the surface roughness of metal to be positively proportional to the strain and proposed in Equation (2) to describe the relationships between surface roughness and strain. Therefore, the value of surface roughness Ra(δ/γ) represents the degree of peritectic transformation shrinkage. In this paper, the cooling rate of the peritectic steel during the initial solidification process was 20 °C/s, and the undercooling when the δ→γ transformation occurred was about 180 °C (ΔT = 180 °C), according to the in situ observations. The maximum Ra(δ/γ) value was found in the 0.10C% peritectic steel (Ra (δ/γ) = 32 μm), the Ra(δ/γ) value of the 0.14C% peritectic steel was 25 μm, and the Ra(δ/γ) value of the 0.16C% peritectic steel was 17 μm. Therefore, as the carbon content increased from 0.10C% to 0.16C%, the shrinkage degree of the δ→γ transformation gradually decreased. As shown in Figure 8a,b, the experimental results conformed to the calculated value of Jablonka et al. [11]. The carbon content dependence of the calculated thermal contraction was in good agreement with the measured surface roughness Ra(δ/γ). The study indicated that the transformation shrinkage degree of peritectic steel was proportional to the surface roughness of the shell under the large cooling rate, and the surface roughness could be used to characterize the degree of the peritectic δ→γ transformation shrinkage.
4. Conclusions
The solidification process of 0.10C%, 0.14C%, and 0.16C% peritectic steels was observed in situ through a CSLM, and the value of surface roughness Ra(δ/γ), which is caused by the peritectic phase transition of the steel samples, was measured. The conclusions are as follow:
1. During the solidification process of peritectic steel, the nucleation and growth of δ ferrite determines the surface morphology of the steel sample, and the surface roughness of the steel is influenced by the shrinkage of the δ→γ transformation, the austenite to proeutectoid ferrite transformation, and the behavior of the eutectoid transformation.
2. The surface roughness caused by the low temperature phase transformation had directionality in a small area. When the surface roughness measurement line was parallel to the direction of the wrinkles, the value of the low temperature phase transformation surface roughness could be avoided and the value of the surface roughness Ra(δ/γ) could be directly measured.
3. Under the cooling rate of 20 °C/s, the degree of shrinkage of the peritectic δ→γ transformation during the initial solidification determined the value of surface roughness Ra(δ/γ). The Ra(δ/γ) value of 0.10C% peritectic steel was 32 μm, the Ra(δ/γ) value of 0.14C% peritectic steel was 25 μm, and the Ra(δ/γ) value of 0.16C% peritectic steel was 17 μm. As the carbon content increased from 0.10C% to 0.16C%, the degree of peritectic δ→γ transformation shrinkage gradually decreased.
4. The values of surface roughness Ra(δ/γ) can be used to characterize the shrinkage degree of the peritectic phase transition under a large cooling rate.
Author Contributions
D.P., G.W., D.F., P.T. and J.G. conceived and designed the experiments; D.P. and D.F. performed the experiments; and D.P. wrote the paper.
Funding
This research was financially supported by the Training Program of Nation Natural Science Foundation of China—Joint Funds of Iron and Steel (No. U1760103).
Acknowledgments
The authors thank Zibing Hou for providing valuable advice about experiment, and the help of Qiang Liu for microscopy.
Conflicts of Interest
The authors declare no conflict of interest.
References
- Xia, G.; Bernhard, C.; Ilie, S.; Fuerst, C. A study about the influence of carbon content in the steel on the casting behavior. Steel Res. Int. 2011, 82, 230–236. [Google Scholar] [CrossRef]
- Andrés, C.G.; Caballero, F.G.; Capdevila, C.; Álvarez, L.F. Application of dilatometric analysis to the study of solid–solid phase transformations in steels. Mater. Charact. 2002, 48, 101–111. [Google Scholar] [CrossRef] [Green Version]
- Suzuki, M.; Yamaoka, Y. Influence of carbon content on solidifying shell growth of carbon steels at the initial stage of solidification. Mater. Trans. 2003, 44, 836–844. [Google Scholar] [CrossRef]
- Konishi, J.; Militzer, M.; Samarasekera, I. Modeling the formation of longitudinal facial cracks during continuous casting of hypoperitectic steel. Metall. Mater. Trans. B 2002, 33, 413–423. [Google Scholar] [CrossRef]
- Du, F.; Wang, X.; Yu, G.; Yan, Z.; Zhu, X.; Xu, J. Study on the non-uniform slab shrinkage of special steel during slab continuous casting. Ironmak. Steelmak. 2017, 41, 1–6. [Google Scholar] [CrossRef]
- Zhang, R.; Zhang, Z.; Shen, M. Numerical analysis of the influence of carbon content on the initial shell of continuous casting slab. Ironmak. Steelmak. 2017, 5, 1–8. [Google Scholar] [CrossRef]
- Tsal, H.T.; Yin, H.; Lowry, M. Analysis of transverse corner cracks on slabs and countermeasures. Iron Steel Technol. 2006, 7, 23–31. [Google Scholar]
- Pradhan, N.; Banerjee, N.; Reddy, B.B.; Sahay, S.K.; Viswanathan, C.S.; Bhor, P.K.; Basu, S.D.; Mazumdar, S. Control of transverse cracking in special quality slabs. Ironmak. Steelmak. 2001, 28, 305–311. [Google Scholar] [CrossRef]
- Emi, T.; Fredriksson, H. High-speed continuous casting of peritectic carbon steels. Mater. Sci. Eng. 2005, 413–414, 2–9. [Google Scholar] [CrossRef]
- Kim, K.; Yeo, T.J.; Oh, K.H.; Lee, D.N. Effect of carbon and sulfur in continuously cast strand on longitudinal surface cracks. ISIJ Int. 1996, 36, 284–289. [Google Scholar] [CrossRef]
- Jablonka, A.; Harste, K.; Schwerdtfeger, K. Thermomechanical properties of iron and iron-carbon alloys: Density and thermal contraction. Steel Res. 1991, 62, 24–33. [Google Scholar] [CrossRef]
- Mizukami, H.; Yamanaka, A.; Watanabe, T. High Temperature Deformation Behavior of Peritectic Carbon Steel during Solidification. Trans. Iron Steel Inst. Jpn. 2002, 42, 964–973. [Google Scholar] [CrossRef]
- Dong, S.X.; Niyama, E.; Anzai, K. Free deformation of initial solid shell of Fe-C alloys. ISIJ Int. 1995, 35, 730–736. [Google Scholar] [CrossRef]
- Li, Y.; Wang, J.; Zhang, J.; Cheng, C.; Zeng, Z. Deformation and structure difference of steel droplets during initial solidification. High Temp. Mater. Process. 2017, 36, 347–357. [Google Scholar] [CrossRef]
- Wielgosz, E.; Kargul, T. Differential scanning calorimetry study of peritectic steel grades. J. Therm. Anal. Calorim. 2015, 119, 1547–1553. [Google Scholar] [CrossRef]
- Bernhard, C.; Xia, G. Influence of alloying elements on the thermal contraction of peritectic steels during initial solidification. Ironmak. Steelmak. 2006, 33, 52–56. [Google Scholar] [CrossRef]
- Shibata, H.; Arai, Y.; Suzuki, M.; Emi, T. Kinetics of peritectic reaction and transformationin Fe-C alloys. Metall. Mater. Trans. B 2000, 31, 981–991. [Google Scholar] [CrossRef]
- Dippenaar, R. In-situ analysis of the peritectic phase transition-relevant to the continuous casting of steel. In Proceedings of the 5th International Congress on the Science and Technology of the Steelmaking, Dresden, Germany, 1–3 October 2012. [Google Scholar]
- Griesser, S.; Bernhard, C.; Dippenaar, R. Effect of nucleation undercooling on the kinetics and mechanism of the peritectic phase transition in steel. Acta Mater. 2014, 81, 111–120. [Google Scholar] [CrossRef]
- Guo, J.; Wen, G.; Pu, D.; Tang, P. A Novel Approach for Evaluating the Contraction of Hypo-Peritectic Steels during Initial Solidification by Surface Roughness. Materials 2018, 11, 571. [Google Scholar] [Green Version]
- Yonekura MFG. HT-CSLM, Confocal Scanning Laser Microscope. Available online: http://yonekuramfg.wixsite.com/ht-cslm/untitled-cv4z (accessed on 30 January 2018).
- Yuan, C. Numerical characterization of 3D Worn surface topography using confocal laser scanning microscopy. Lubr. Eng. 2006, 728, 33–36. [Google Scholar]
- Hanlon, D.N.; Todd, I.; Peekstok, E.; Rainforth, W.M.; van der Zwaag, S. The application of laser scanning confocal microscopy to tribological research. Wear 2001, 251, 1159–1168. [Google Scholar] [CrossRef]
- Tsutsumi, K.; Nagasaka, T.; Hino, M. Surface Roughness of Solidified Mold Flux in Continuous Casting Process. Trans. Iron Steel Inst. Jpn. 1999, 39, 1150–1159. [Google Scholar] [CrossRef]
- Dobashi, Y.; Ijiri, T.; Todo, H.; Iwasaki, K.; Okabe, M.; Nishimura, S. Measuring microstructures using confocal laser scanning microscopy for estimating surface roughness. Presented at the ACM Siggraph 2016, Anaheim, CA, USA, 24–28 July 2016; p. 28. [Google Scholar]
- Trejo, M.H.; Lopez, E.A.; Mondragon, J.J.R.; de Jesus Castro Roman, M.; Tovar, H.S. Effect of solidification path and contraction on the cracking susceptibility of carbon peritectic steels. Met. Mater. Int. 2010, 16, 731–737. [Google Scholar] [CrossRef]
- Cao, L.F.; Guang, X.; Peng, D.; Wang, G.X.; Hu, D.J. Study on thermal expansion properties of steels. J. Univ. Sci. Technol. Beijing 2014, 5, 639–643. [Google Scholar]
- Liu, J.; Wen, G.; Li, Y. Effect of γ→α Phase Transformation on Refining Austenite Grains of Microalloyed Steel in Continuous Casting by Simulation. High Temp. Mater. Process. 2016, 35, 653–659. [Google Scholar] [CrossRef]
- Park, J.Y.; Sohn, I. Evaluating the heat transfer phenomena and the interfacial thermal resistance of mold flux using a copper disc mold simulator. Int. J. Heat Mass Transf. 2017, 109, 1014–1025. [Google Scholar] [CrossRef]
- Long, X.; He, S.; Wang, Q.; Chris Pistorius, P. Structure of Solidified Films of Mold Flux for Peritectic Steel. Metall. Mater. Trans. B 2017, 48, 1652–1658. [Google Scholar] [CrossRef]
- Abe, T.; Nagaki, S.; Nishiyama, T. Inhomegeneous deformation of grains and roughening of free surface of polycrystalline iron during compressive plastic deformation. Mech. Behav. Mater. V 1988, 325–332. [Google Scholar]
Figure 1.
Thermal scheme.

Figure 2.
(a) the surface morphology of the sample; (b)the surface at high magnification; (c) the roughness measurement process diagram.
Figure 2.
(a) the surface morphology of the sample; (b)the surface at high magnification; (c) the roughness measurement process diagram.
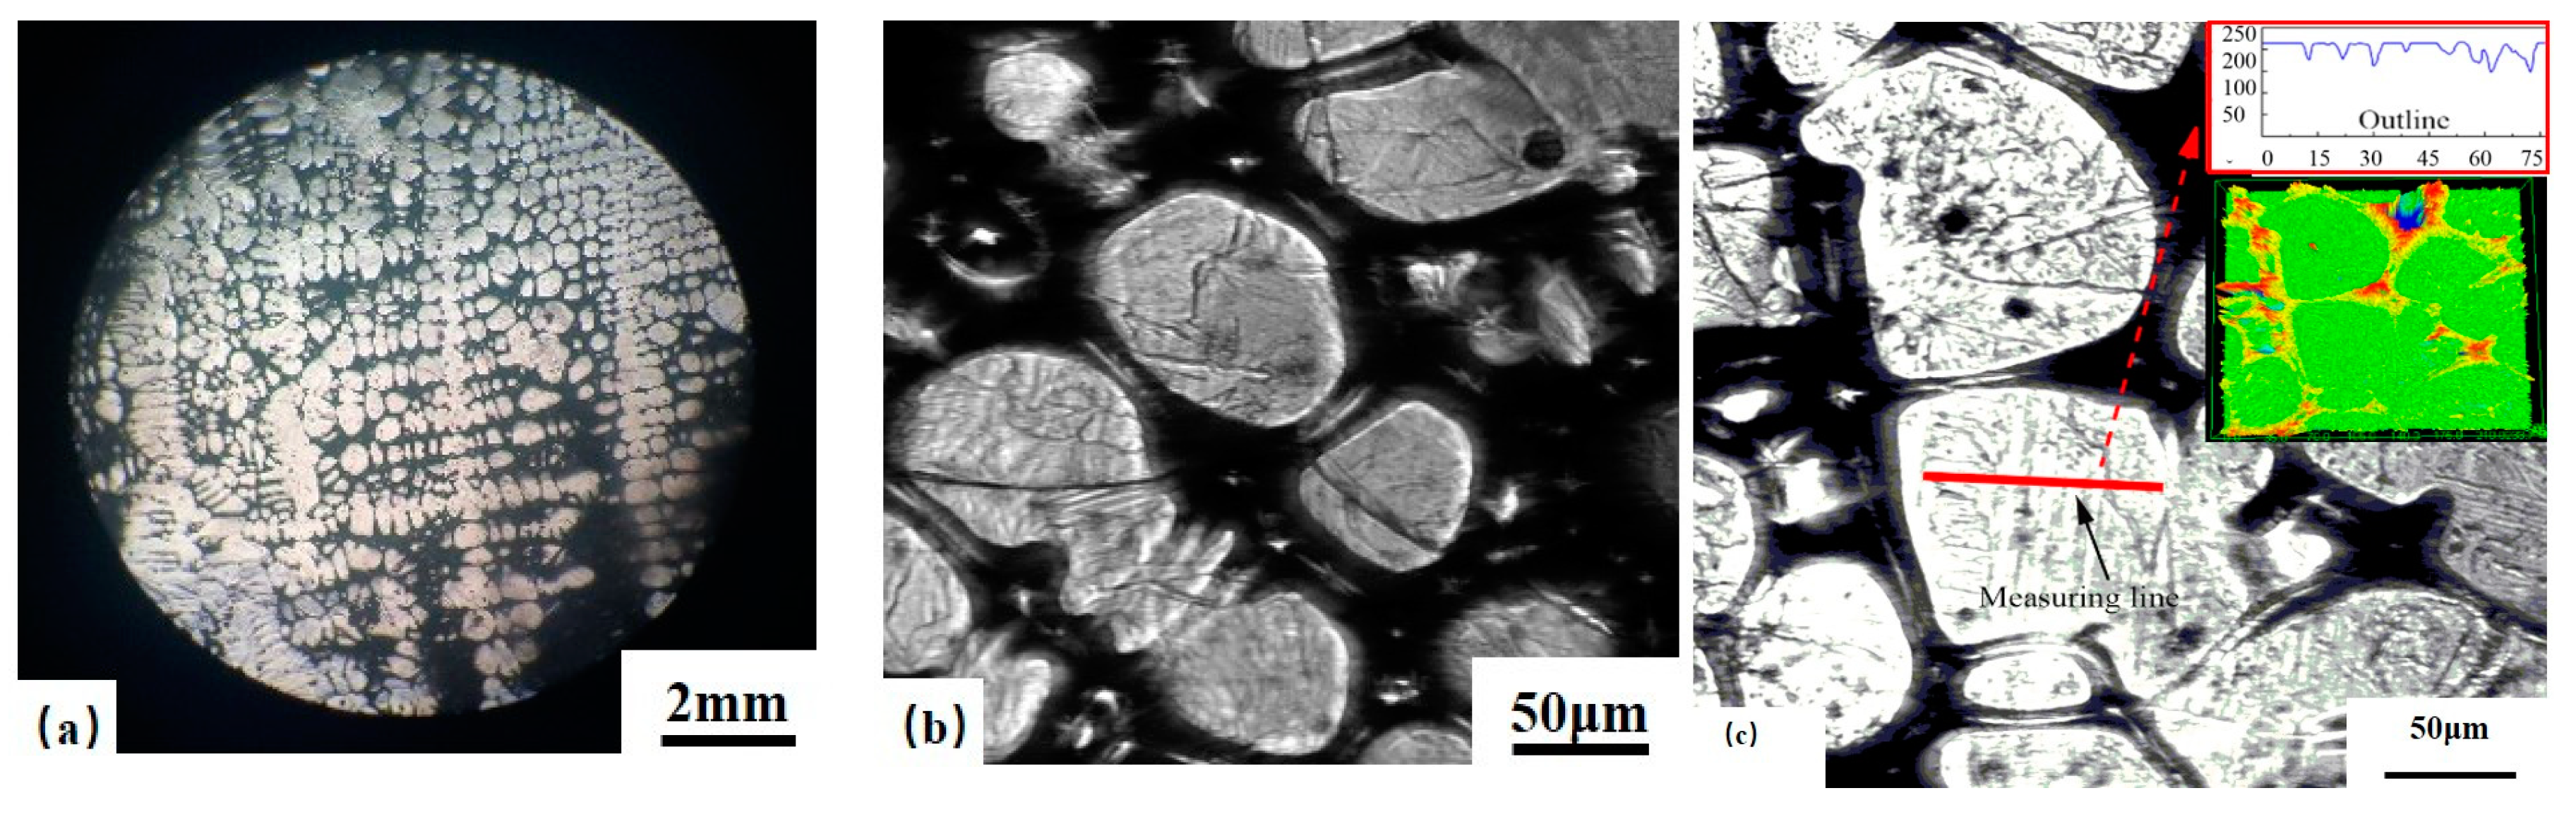
Figure 3.
(A) the direction of the different measuring line; (B) the surface roughness value of different measuring line.
Figure 3.
(A) the direction of the different measuring line; (B) the surface roughness value of different measuring line.

Figure 4.
Confocal scanning laser microscope (CSLM) results of the 0.10C% steel. (a) δ growth; (b,c) before and after δ–γ transformation; (d) the wrinkles of low temperature phase transformation.
Figure 4.
Confocal scanning laser microscope (CSLM) results of the 0.10C% steel. (a) δ growth; (b,c) before and after δ–γ transformation; (d) the wrinkles of low temperature phase transformation.
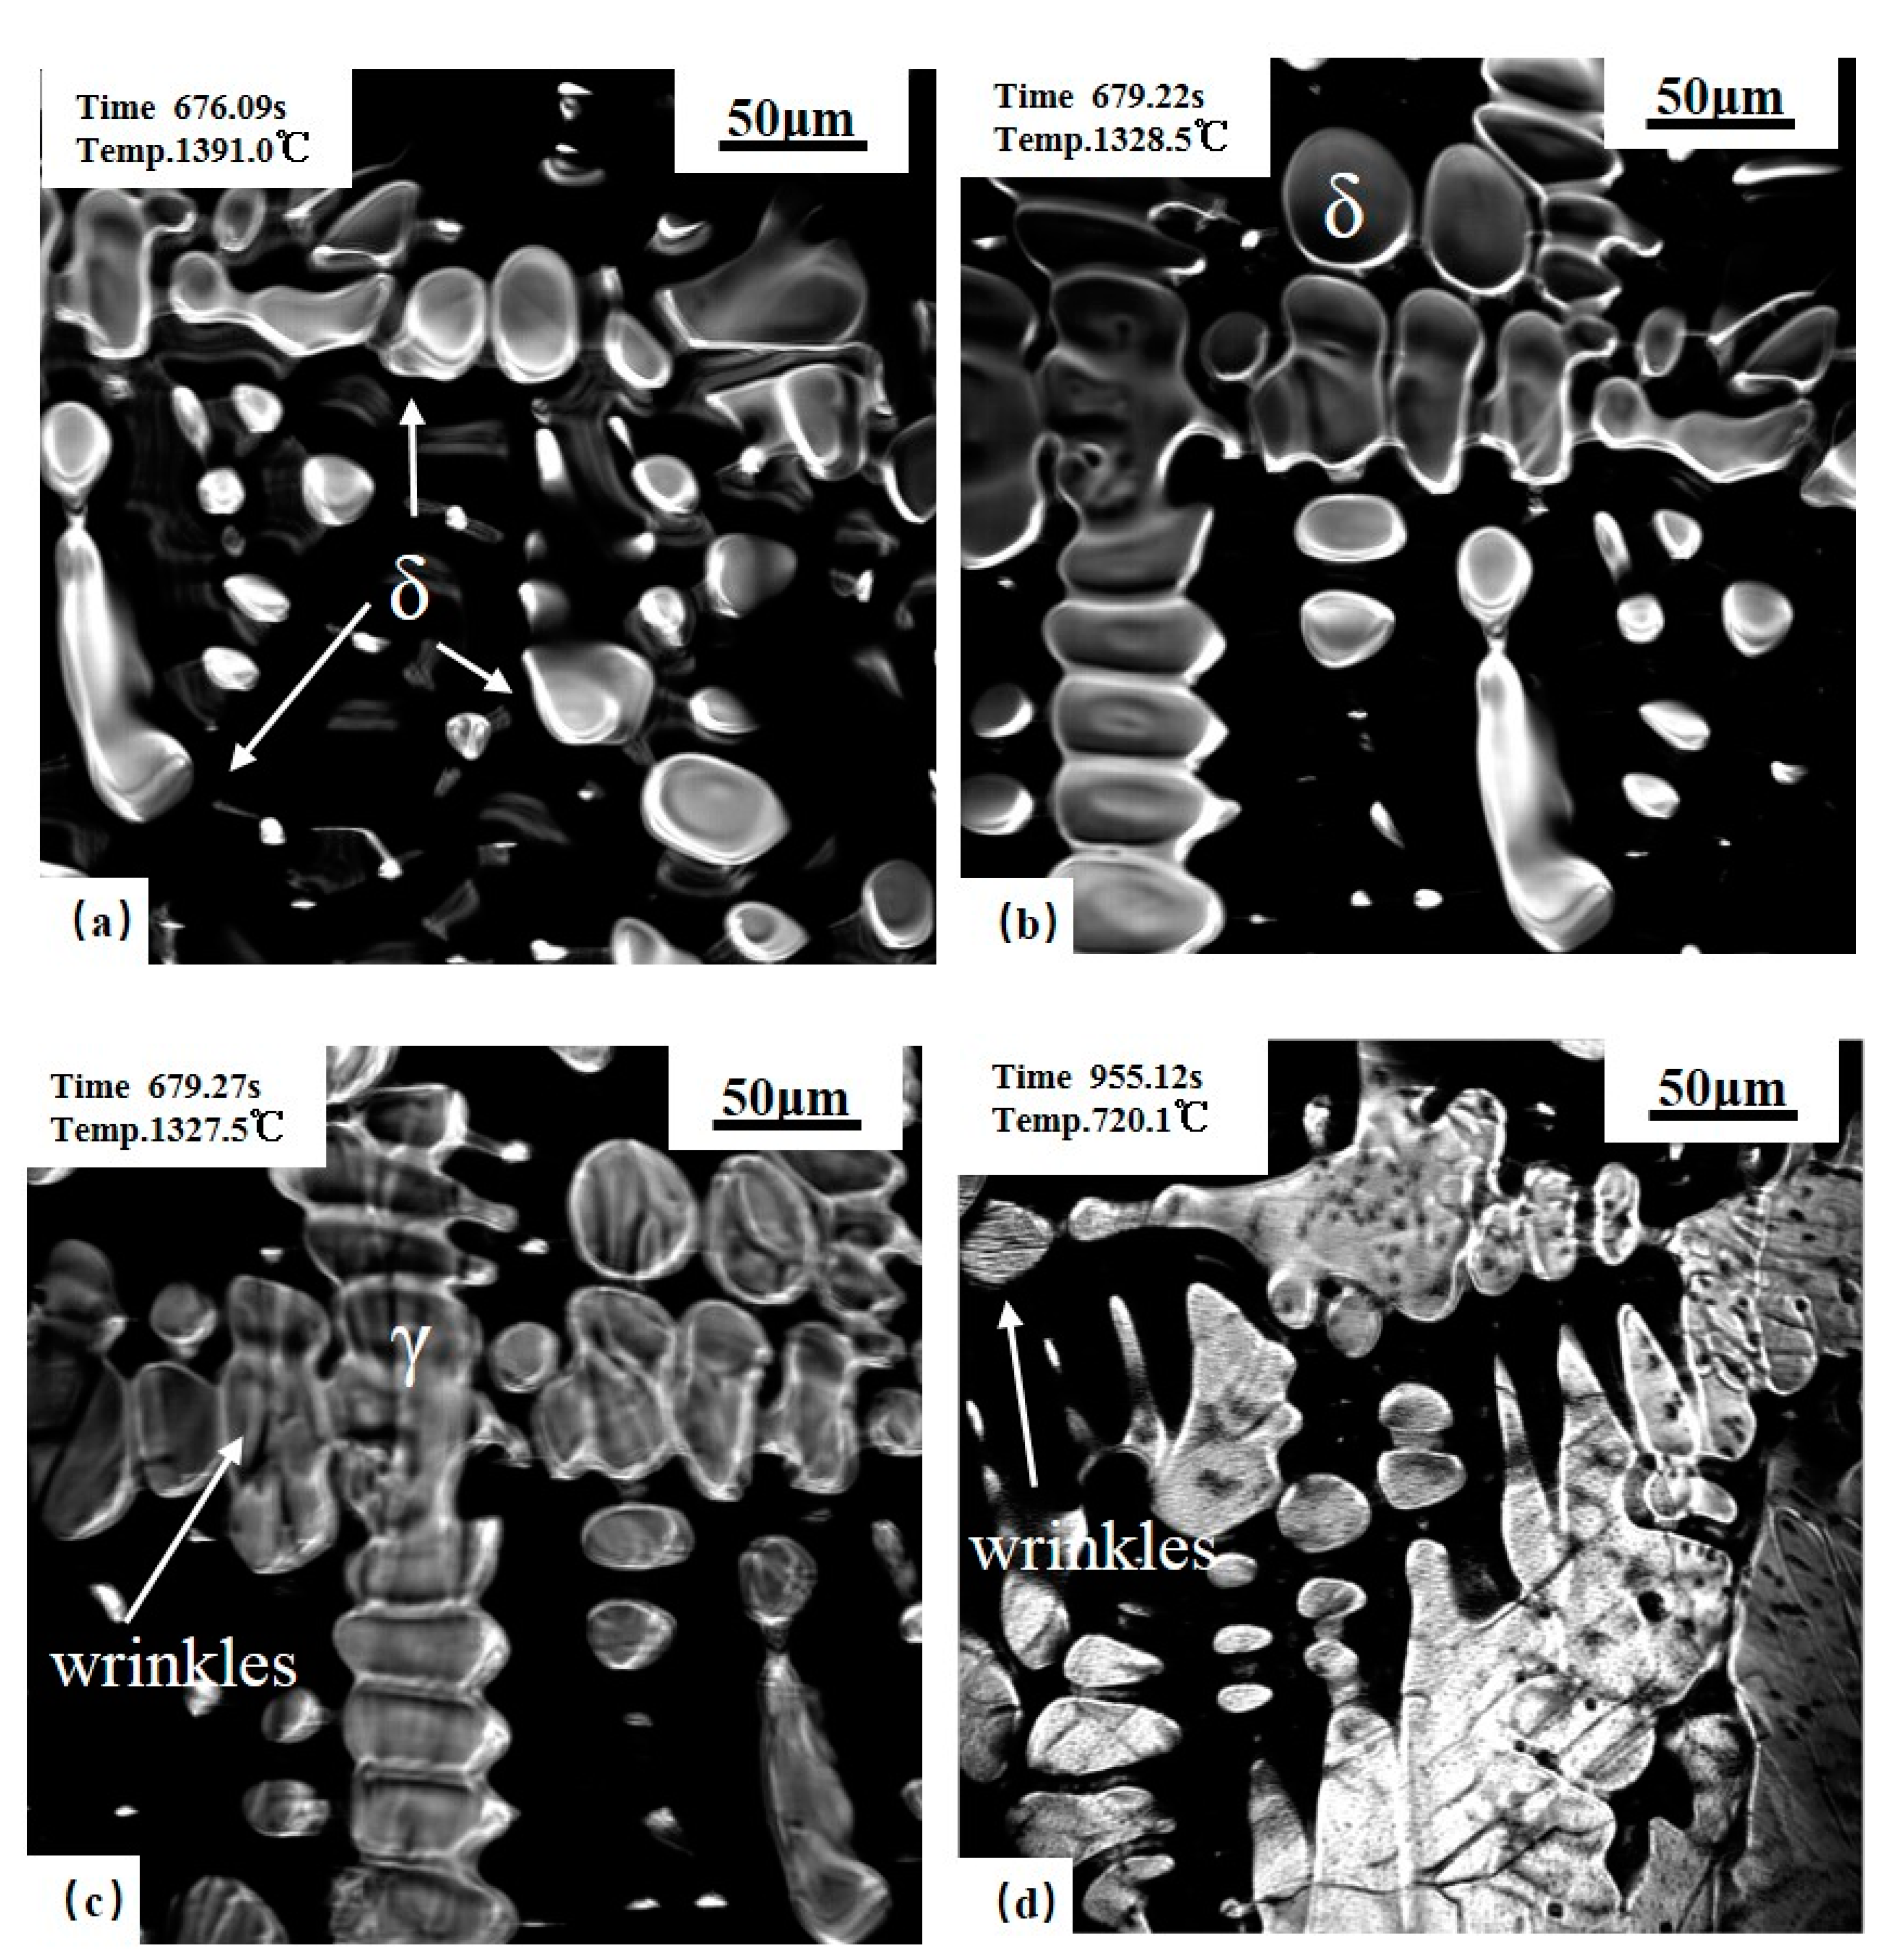
Figure 5.
CSLM results of the 0.14C% steel. (a) δ growth; (b,c) before and after δ–γ transformation; (d) the wrinkles of low temperature phase transformation.
Figure 5.
CSLM results of the 0.14C% steel. (a) δ growth; (b,c) before and after δ–γ transformation; (d) the wrinkles of low temperature phase transformation.
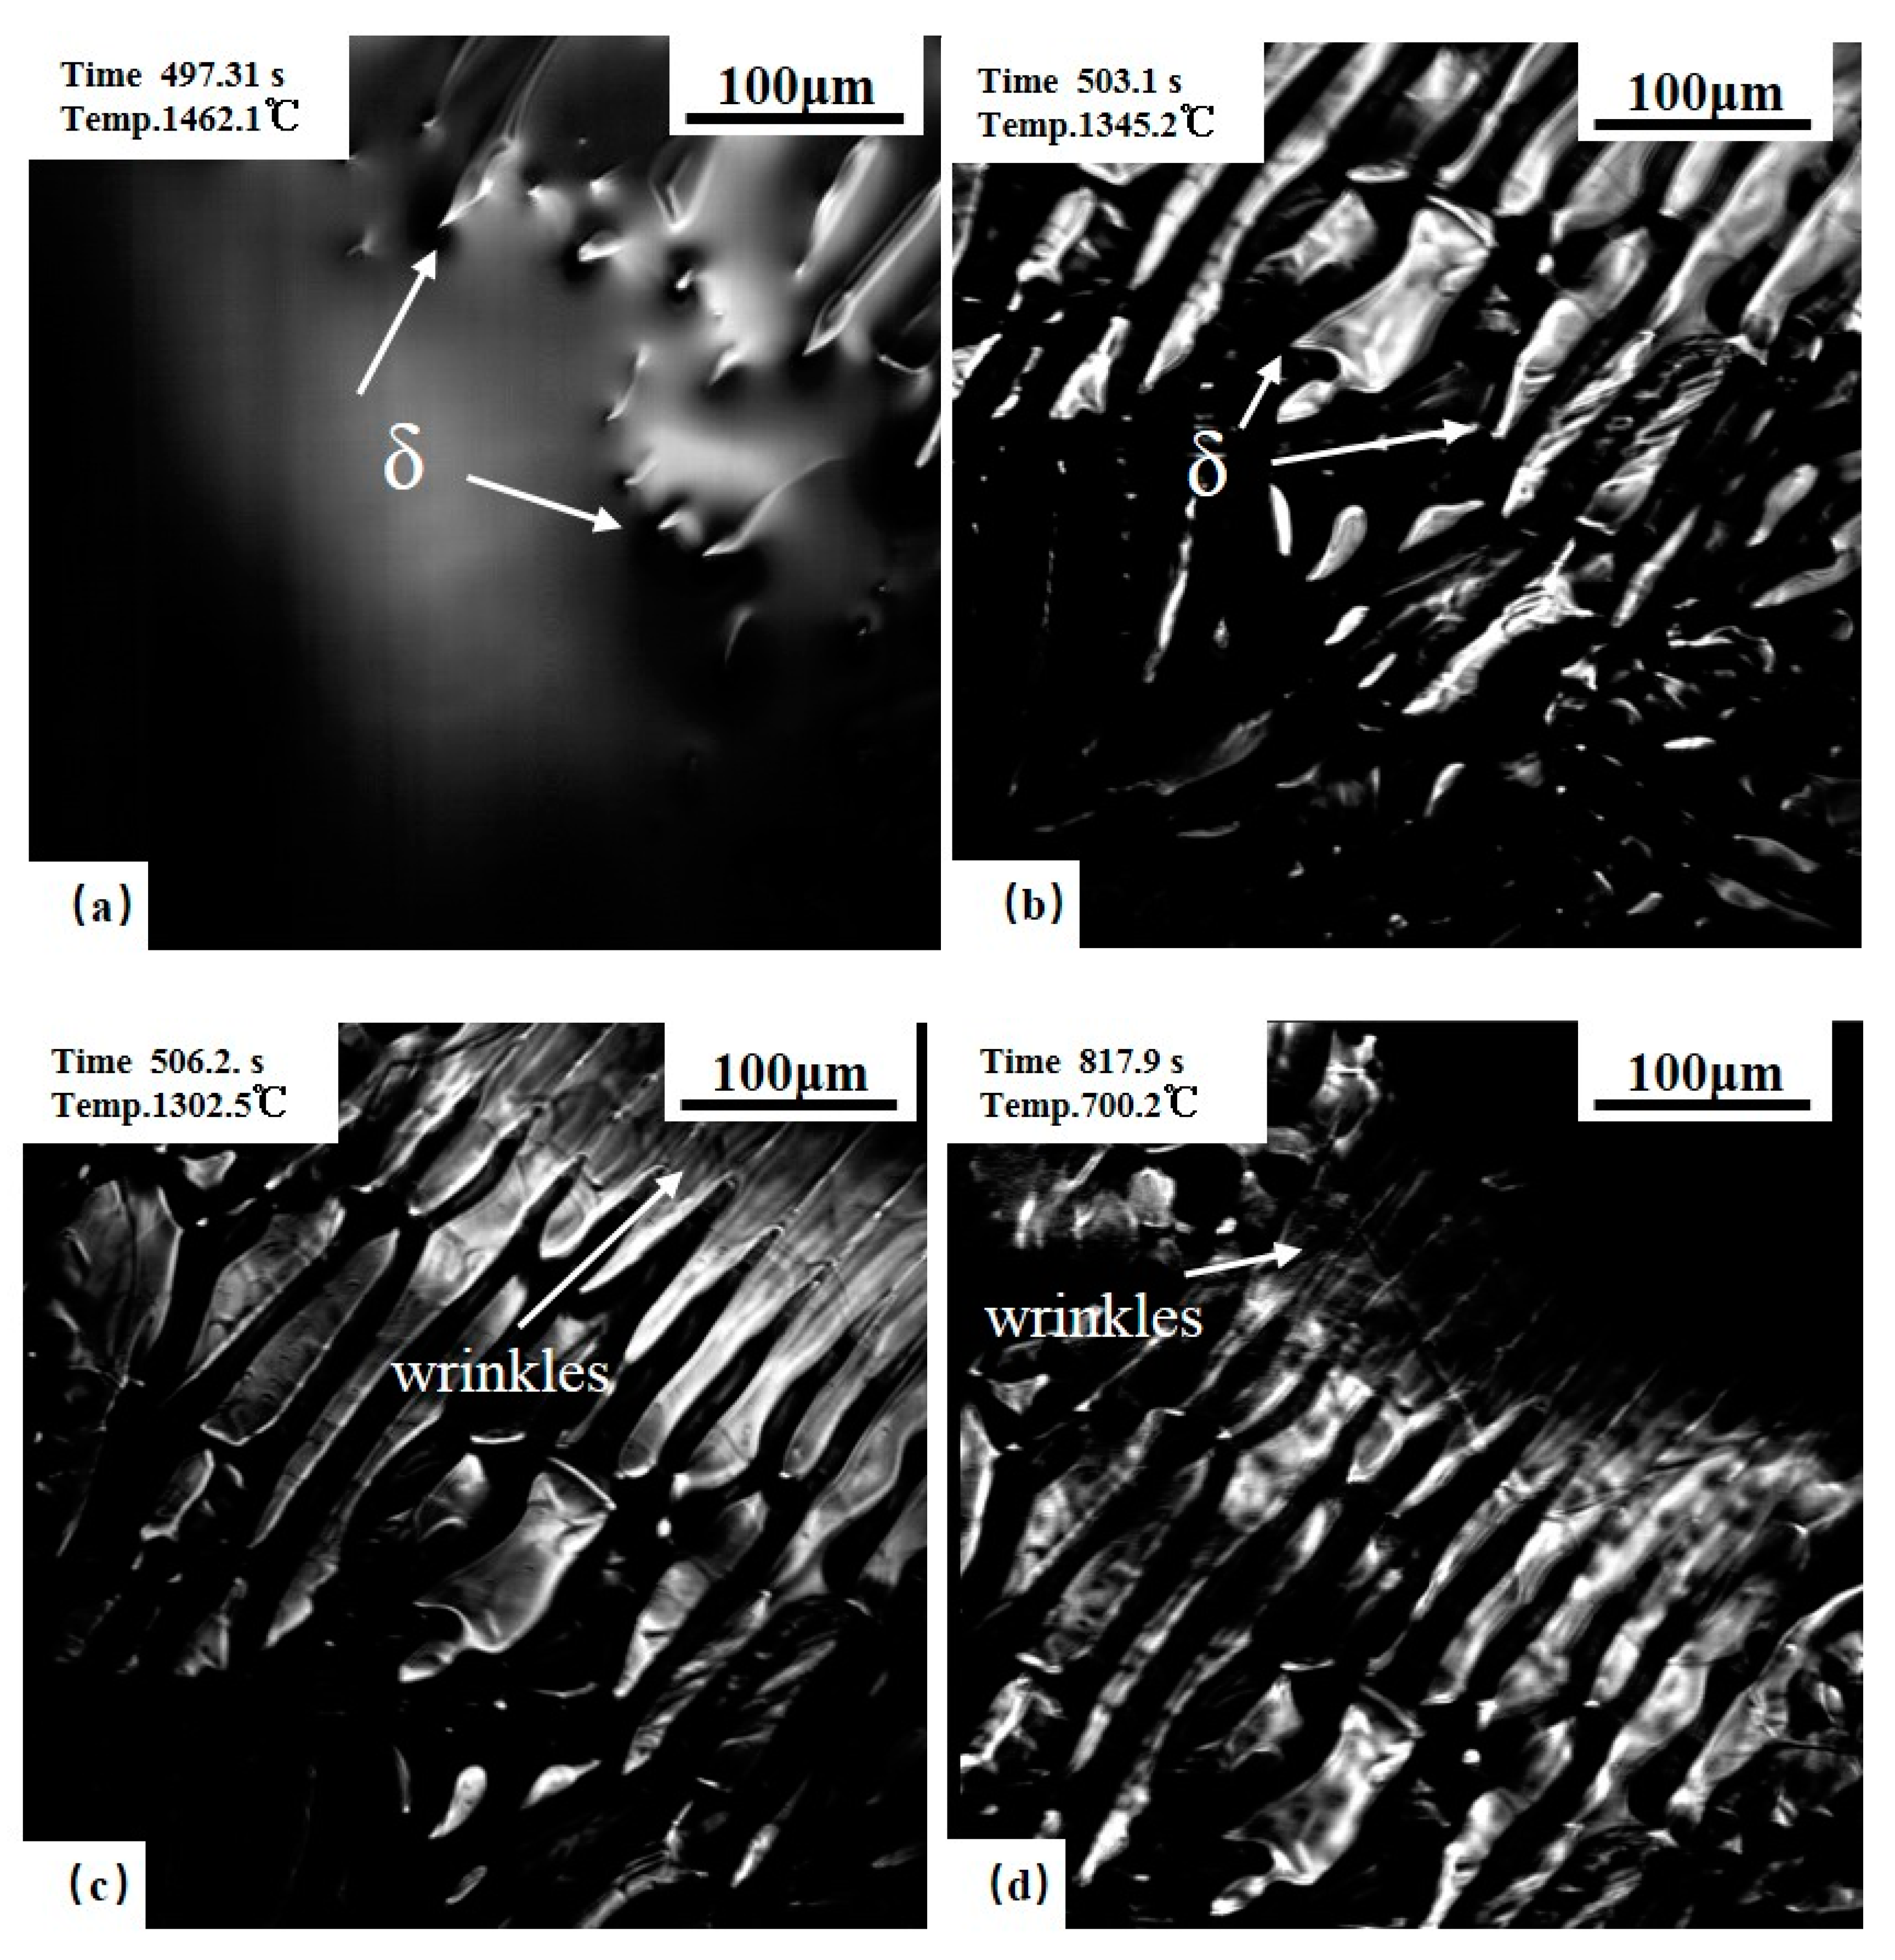
Figure 6.
CSLM results of the 0.16C% steel. (a) δ growth; (b,c) before and after δ–γ transformation; (d) the wrinkles of low temperature phase transformation.
Figure 6.
CSLM results of the 0.16C% steel. (a) δ growth; (b,c) before and after δ–γ transformation; (d) the wrinkles of low temperature phase transformation.

Figure 7.
Typical surface roughness profile curve of S1 (A) the direction of the measuring line; (B) the surface roughness value of different measuring line.
Figure 7.
Typical surface roughness profile curve of S1 (A) the direction of the measuring line; (B) the surface roughness value of different measuring line.
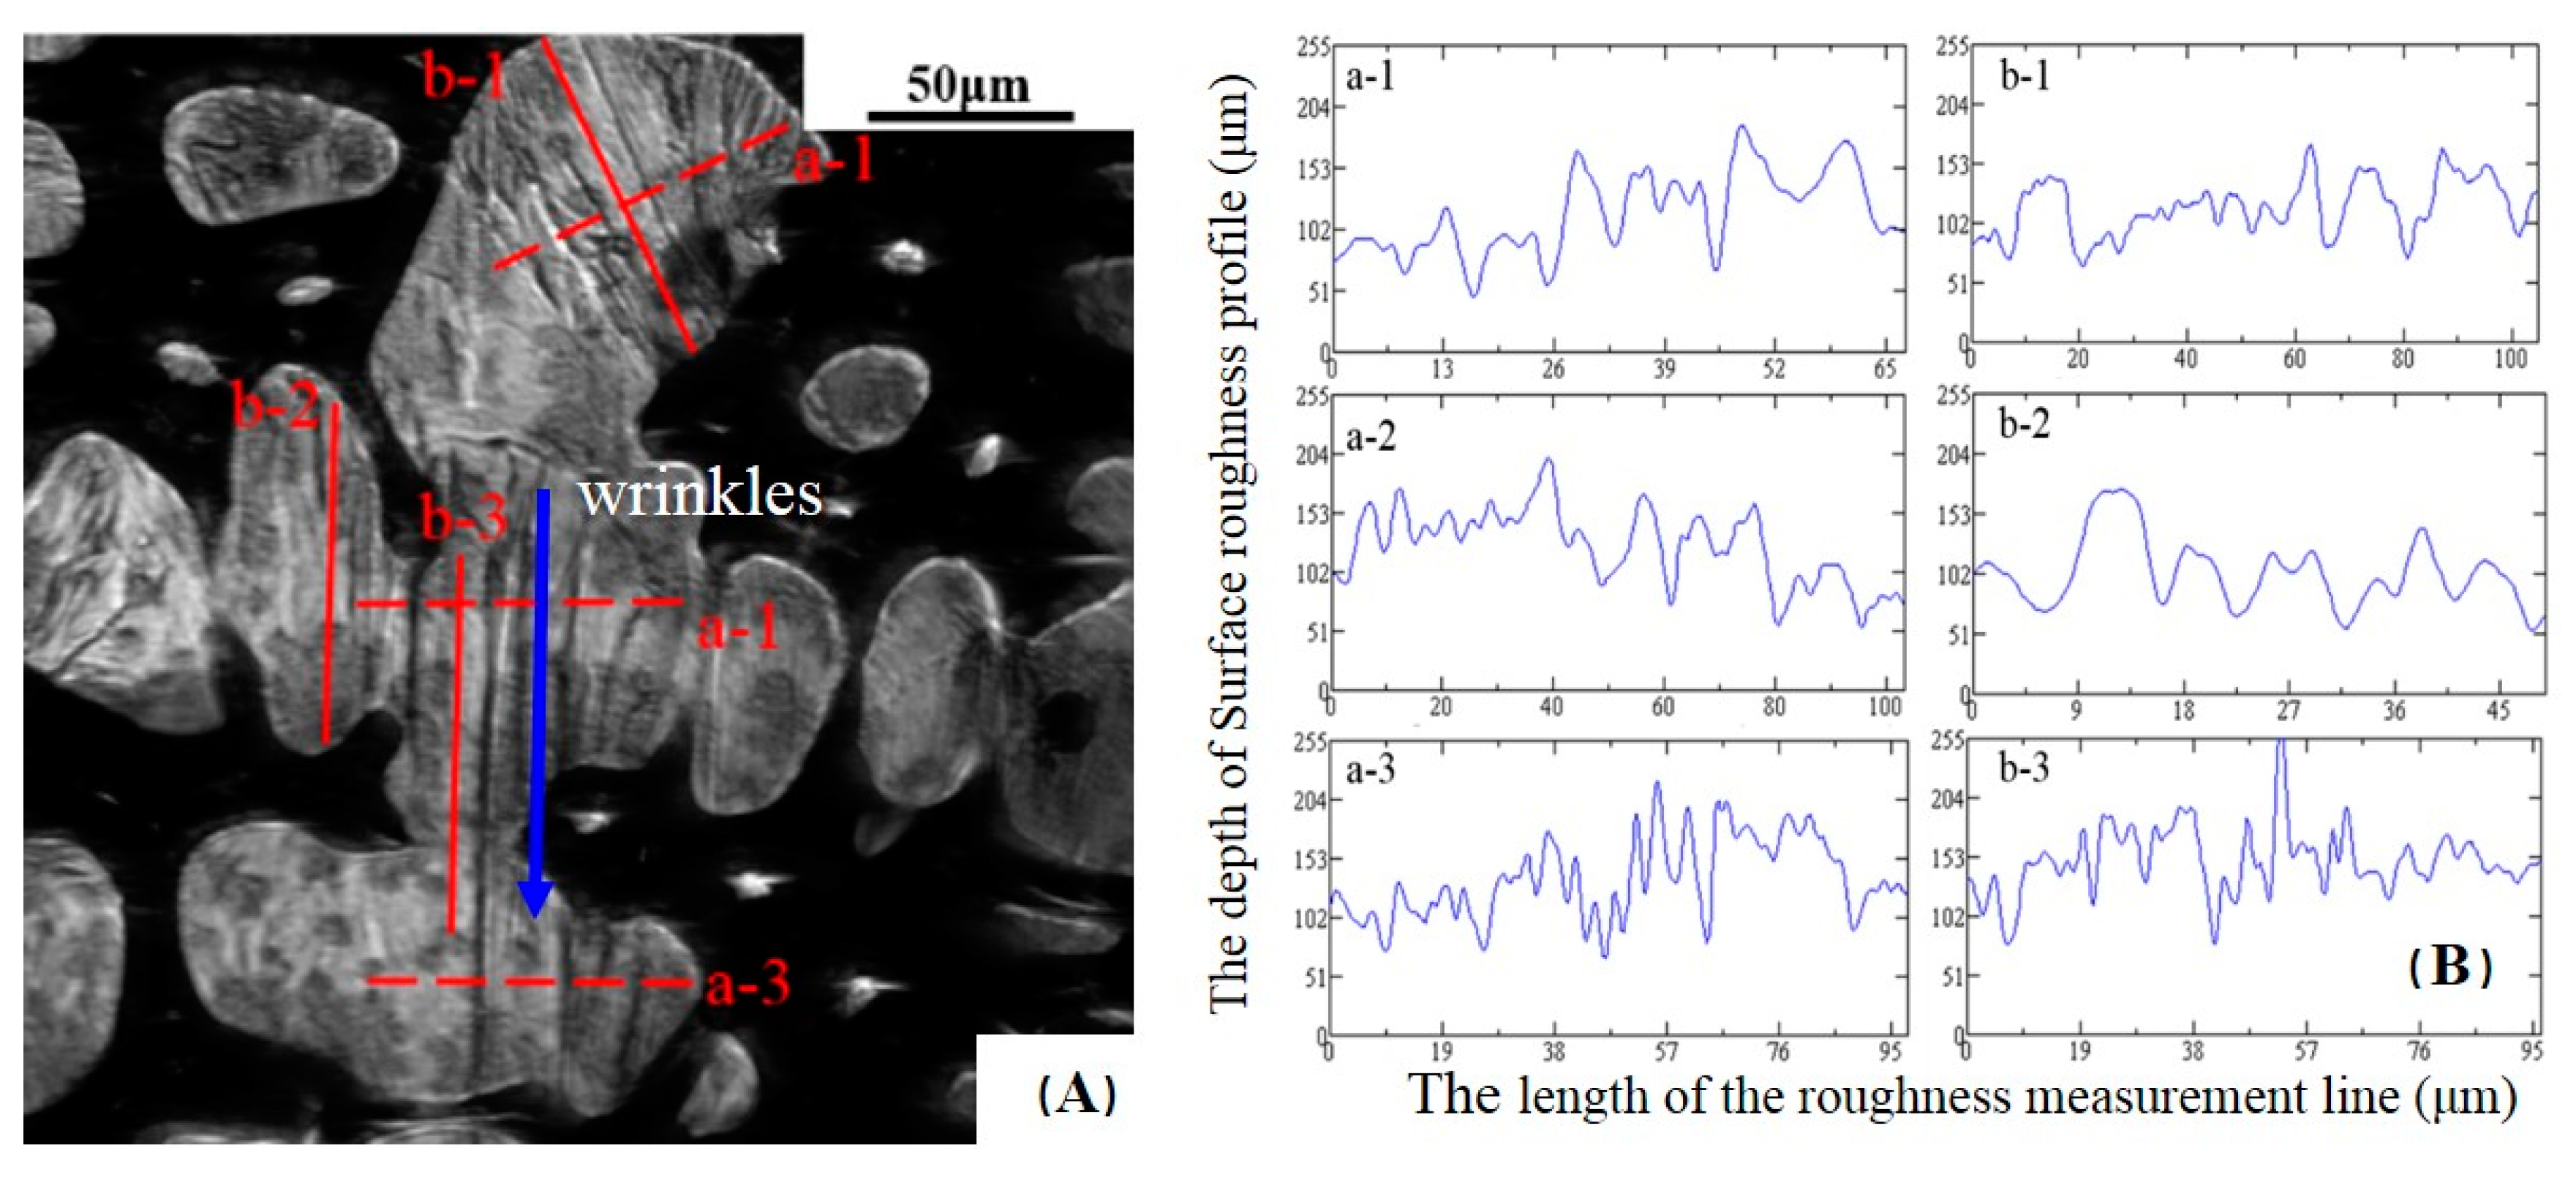
Figure 8.
(a) relationship between the surface roughness and carbon content; (b) influence of carbon content on thermal contraction of iron-carbon alloys at different undercooling ΔT [11].
Figure 8.
(a) relationship between the surface roughness and carbon content; (b) influence of carbon content on thermal contraction of iron-carbon alloys at different undercooling ΔT [11].

Table 1.
Chemical composition of the hypo-peritectic steel samples.
| Steel | Chemical Composition (mass%) | |||||||||
|---|---|---|---|---|---|---|---|---|---|---|
| C | Si | Mn | Al | S | P | Ni | Cr | Ti | Fe | |
| S1 | 0.10 | 0.250 | 1.22 | 0.049 | 0.001 | 0.011 | 0.120 | 0.179 | 0.017 | bal. |
| S2 | 0.14 | 0.250 | 1.25 | 0.035 | 0.002 | 0.015 | 0.116 | 0.014 | bal. | |
| S3 | 0.16 | 0.250 | 1.17 | 0.033 | 0.002 | 0.012 | 0.120 | 0.120 | 0.016 | bal. |
Table 2.
The surface roughness parameters of different measurement methods.
| Line | Ra (μm) | Rq (μm) | Rp (μm) | Rv (μm) |
|---|---|---|---|---|
| a-1 | 39.3 | 46.1 | 156.6 | 71.5 |
| a-2 | 38.4 | 45.7 | 150.0 | 70.1 |
| a-3 | 40.8 | 46.5 | 158.8 | 71.2 |
| Average value of Ra is 39.5 μm | ||||
| b-1 | 32.6 | 37.7 | 80.2 | 62.0 |
| b-2 | 31.3 | 37.0 | 78.6 | 60.1 |
| b-3 | 32.1 | 37.5 | 78.8 | 61.3 |
| Average value of Ra is 32.0 μm | ||||
© 2018 by the authors. Licensee MDPI, Basel, Switzerland. This article is an open access article distributed under the terms and conditions of the Creative Commons Attribution (CC BY) license (http://creativecommons.org/licenses/by/4.0/).
Share and Cite
MDPI and ACS Style
Pu, D.; Wen, G.; Fu, D.; Tang, P.; Guo, J. Study of the Effect of Carbon on the Contraction of Hypo-Peritectic Steels during Initial Solidification by Surface Roughness. Metals 2018, 8, 982. https://doi.org/10.3390/met8120982
AMA Style
Pu D, Wen G, Fu D, Tang P, Guo J. Study of the Effect of Carbon on the Contraction of Hypo-Peritectic Steels during Initial Solidification by Surface Roughness. Metals. 2018; 8(12):982. https://doi.org/10.3390/met8120982
Chicago/Turabian StylePu, Dazhi, Guanghua Wen, Dachao Fu, Ping Tang, and Junli Guo. 2018. "Study of the Effect of Carbon on the Contraction of Hypo-Peritectic Steels during Initial Solidification by Surface Roughness" Metals 8, no. 12: 982. https://doi.org/10.3390/met8120982
Note that from the first issue of 2016, this journal uses article numbers instead of page numbers. See further details here.