Article

Microstructure Evolution of a Ti-45Al-8.5Nb-0.2W-0.2B-0.02Y Alloy during Massive Transformation and Subsequent Annealing

1
State Key Laboratory of Solidification Processing, Northwestern Polytechnical University, Xi’an 710072, China
2
Nantong Elian Advanced Materials Science and Technology Ltd., Nantong 226399, China
*
Author to whom correspondence should be addressed.
Metals 2018, 8(2), 89; https://doi.org/10.3390/met8020089
Submission received: 25 December 2017 / Revised: 19 January 2018 / Accepted: 23 January 2018 / Published: 25 January 2018

Abstract

:
It has been widely reported that the microstructure refinement of TiAl alloys can be achieved by massive transformation and subsequent annealing in α2 + γ two phase field. To achieve this goal, several heat treatment parameters must be adjusted, including the heat treatment temperature around single α phase field, the annealing temperature, and the annealing time for the precipitation of α2 phase. Thus, a systematic study is needed for each alloy with different compositions. In this study, the heat treatment parameters for grain refinement via massive transformation of a high Nb-containing TiAl are investigated. Precipitation of α2 phase during annealing is observed by transmission electron microscopy. It is found that 30 min at single α phase field is appropriate for the massive transformation; a full, massively transformed microstructure cannot be obtained by oil or water quenching. A short annealing time can result in a refined microstructure, whereas the sizes of the precipitated α2 phase increases with the increase of annealing time. The α2 phase can form at the interface of twin boundaries of the γ phase, following the Blackburn orientation relationship with both sides. The Vickers hardness is measured for the annealed samples, which remains relatively stable for different annealing times.

1. Introduction

TiAl alloys have been considered as promising high-temperature structural materials for years, and their application on blades has been achieved in several alloy compositions [1,2]. Among the series of compositions of TiAl-based alloys, high Nb-containing TiAl (Nb-TiAl) alloys have attracted attention due to their superior high temperature strength, oxidation, and creep resistance [3,4]. Studies of high Nb-TiAl alloys over the past two decades in all aspects but especially the adjustment of microstructures have continued. For TiAl-based alloys, massive transformation, which is initiated by cooling from high temperature α phase in a controlled cooling rate to create massive γ phase, followed by subsequent annealing at α + γ two phase region is proven to be an effective method to refine the microstructures [5,6,7,8,9,10,11,12]. However, it is commonly agreed that a heat treatment window exists for each alloy composition; only in this window can the fully massive transformed microstructure be obtained that is suitable for the following annealing treatments, although the massive transformation is thought to be displacive only with atom rearrangement across interfaces [7,8,11,13]. For high Nb-TiAl alloys, although the microstructure is relatively finer than some other TiAl alloys during the common preparation process, further grain refinement is still necessary, since balanced mechanical properties usually exist in fine-grained fully lamellar microstructures [14,15,16]. Several studies of the massive transformation in high Nb-TiAl alloys have been conducted, even in alloys with higher amount of Nb contents [17]. Saage et al. [8] noted that the cooling rates required for initiating massive transformation apparently depend on the compositions, and the element Ta can increase the tendency of massive γ formation because of its lower diffusion rate than Nb, which is also supported by the results from Imayev et al. [11]. However, the addition of B suppresses the formation of the massive γ phase and increases the tendency of lamellar structure formation by the refinement of the high-temperature α phase, whereas the cooling rated needed for the onset of massive γ formation is hardly changed [18]. The massive γ phase is commonly reported to nucleate at the grain boundaries during cooling [9,19,20], which means that a fine-grained initial microstructure can facilitate the massive γ formation. Actually, the volume fraction of the massive γ phase depends on the specialized window of cooling rates for each alloy. The temperature range of the single α2 phase field in high Nb-TiAl alloys is rather small [21,22]; thus, a study on the heat treatment temperature for these alloys is needed. For the subsequent annealing parameters, usually a couple of hours are necessary to create the so-called convoluted structure [6]; however, the influence of annealing time on the resultant microstructure should be shown in detail for each alloy. As indicated by Sankaran et al. and Zhang et al., the precipitation behavior during annealing should be investigated [12,23]. The convoluted structure is composed of weaving α2 laths, and the γ matrix and complex interface structures are expected, especially those formed by neighboring α2 variants. These interfaces can be a very important factor in the mechanical properties of the refined microstructure. Although it has been noted that massive transformation may not be the best method to obtain balanced properties for a whole component in the further manufacturing process due to its restriction on the sample sizes, the basic knowledge of the phase transformation mechanisms should be known.
In this study, the heat treatment parameters for adjusting massive microstructures and the precipitation behavior of the α2 phase in a high Nb-TiAl alloy are investigated using electron microscopy. The effects of heat treatment parameters on the resultant convoluted microstructure are discussed. The interfaces between α2 variants and α2/γ phases are observed. Vickers hardness of the annealed samples is measured as a reference to the mechanical property.

2. Experiments

An ingot of Ti-45Al-8.5Nb-0.2W-0.2B-0.02Y alloy, measuring approximately 730 × 340 × 900 mm3 in size, was prepared by a plasma cold hearth melting furnace. Samples with a gauge of 10 × 10 × 15 mm3 were cut from the center of the upper part of the ingot. A series of samples were heat treated at 1340 °C, 1360 °C, and 1400 °C for 30 min followed by water-quenching to evaluate the effects of temperature on the quenched microstructures. One additional sample was kept at 1340 °C for 2 h followed by water-quenching. The samples were heated with a resistance furnace to the target temperatures. To study the effects of cooling rates on the massive transformation, samples heat treated at 1340 °C for 30 min were oil-quenched, air-cooled, and furnace-cooled to room temperature. The subsequent annealing was conducted at 1250 °C for 5 min to 4 h to examine the effects of annealing time on the convoluted microstructures. In the annealing process, the samples were put into the furnace prior set to 1250 °C, and 5 min were deducted from the total annealing time for heat conduction. After annealing, the samples were water-quenched. Microstructures of the samples after these various heat treatments were observed on a Zeiss SUPRA 55 (Carl Zeiss company, Oberkochen, Germany) field emission scanning electronmicroscope (SEM) using the backscattered electron (BSE) modeoperated at 15 kV and a working distance of 11 mm. To avoid oxidation, the surface layer of each sample prior to SEM observation was removed by mechanical polishing. The samples at different cooling rates and annealing times were examined in a Tecnai G2 F30 (FEI company, Hillsboro, OR, USA) transmission electron microscope (TEM) operated at 300 kV. The TEM specimens were cut from the center of the sample and then mechanically ground to 0.08 mm. The thin foils were prepared by electro-polishing in a solution of 30 mL perchloric acid, 175 mL butan-l-ol, and 300 mL methanol at 30 V and −30 °C. Vickers hardness tests of the as-quenched and annealed samples were conducted on the polished SEM samples. Each hardness parameter is the average value of at least 10 measurements. The standard deviations of these parameters are reflected as the error bars in the plotted figure.

3. Results and Discussion

3.1. Effects of Heat Treatment Parameters on the Massive Transformed Microstructure

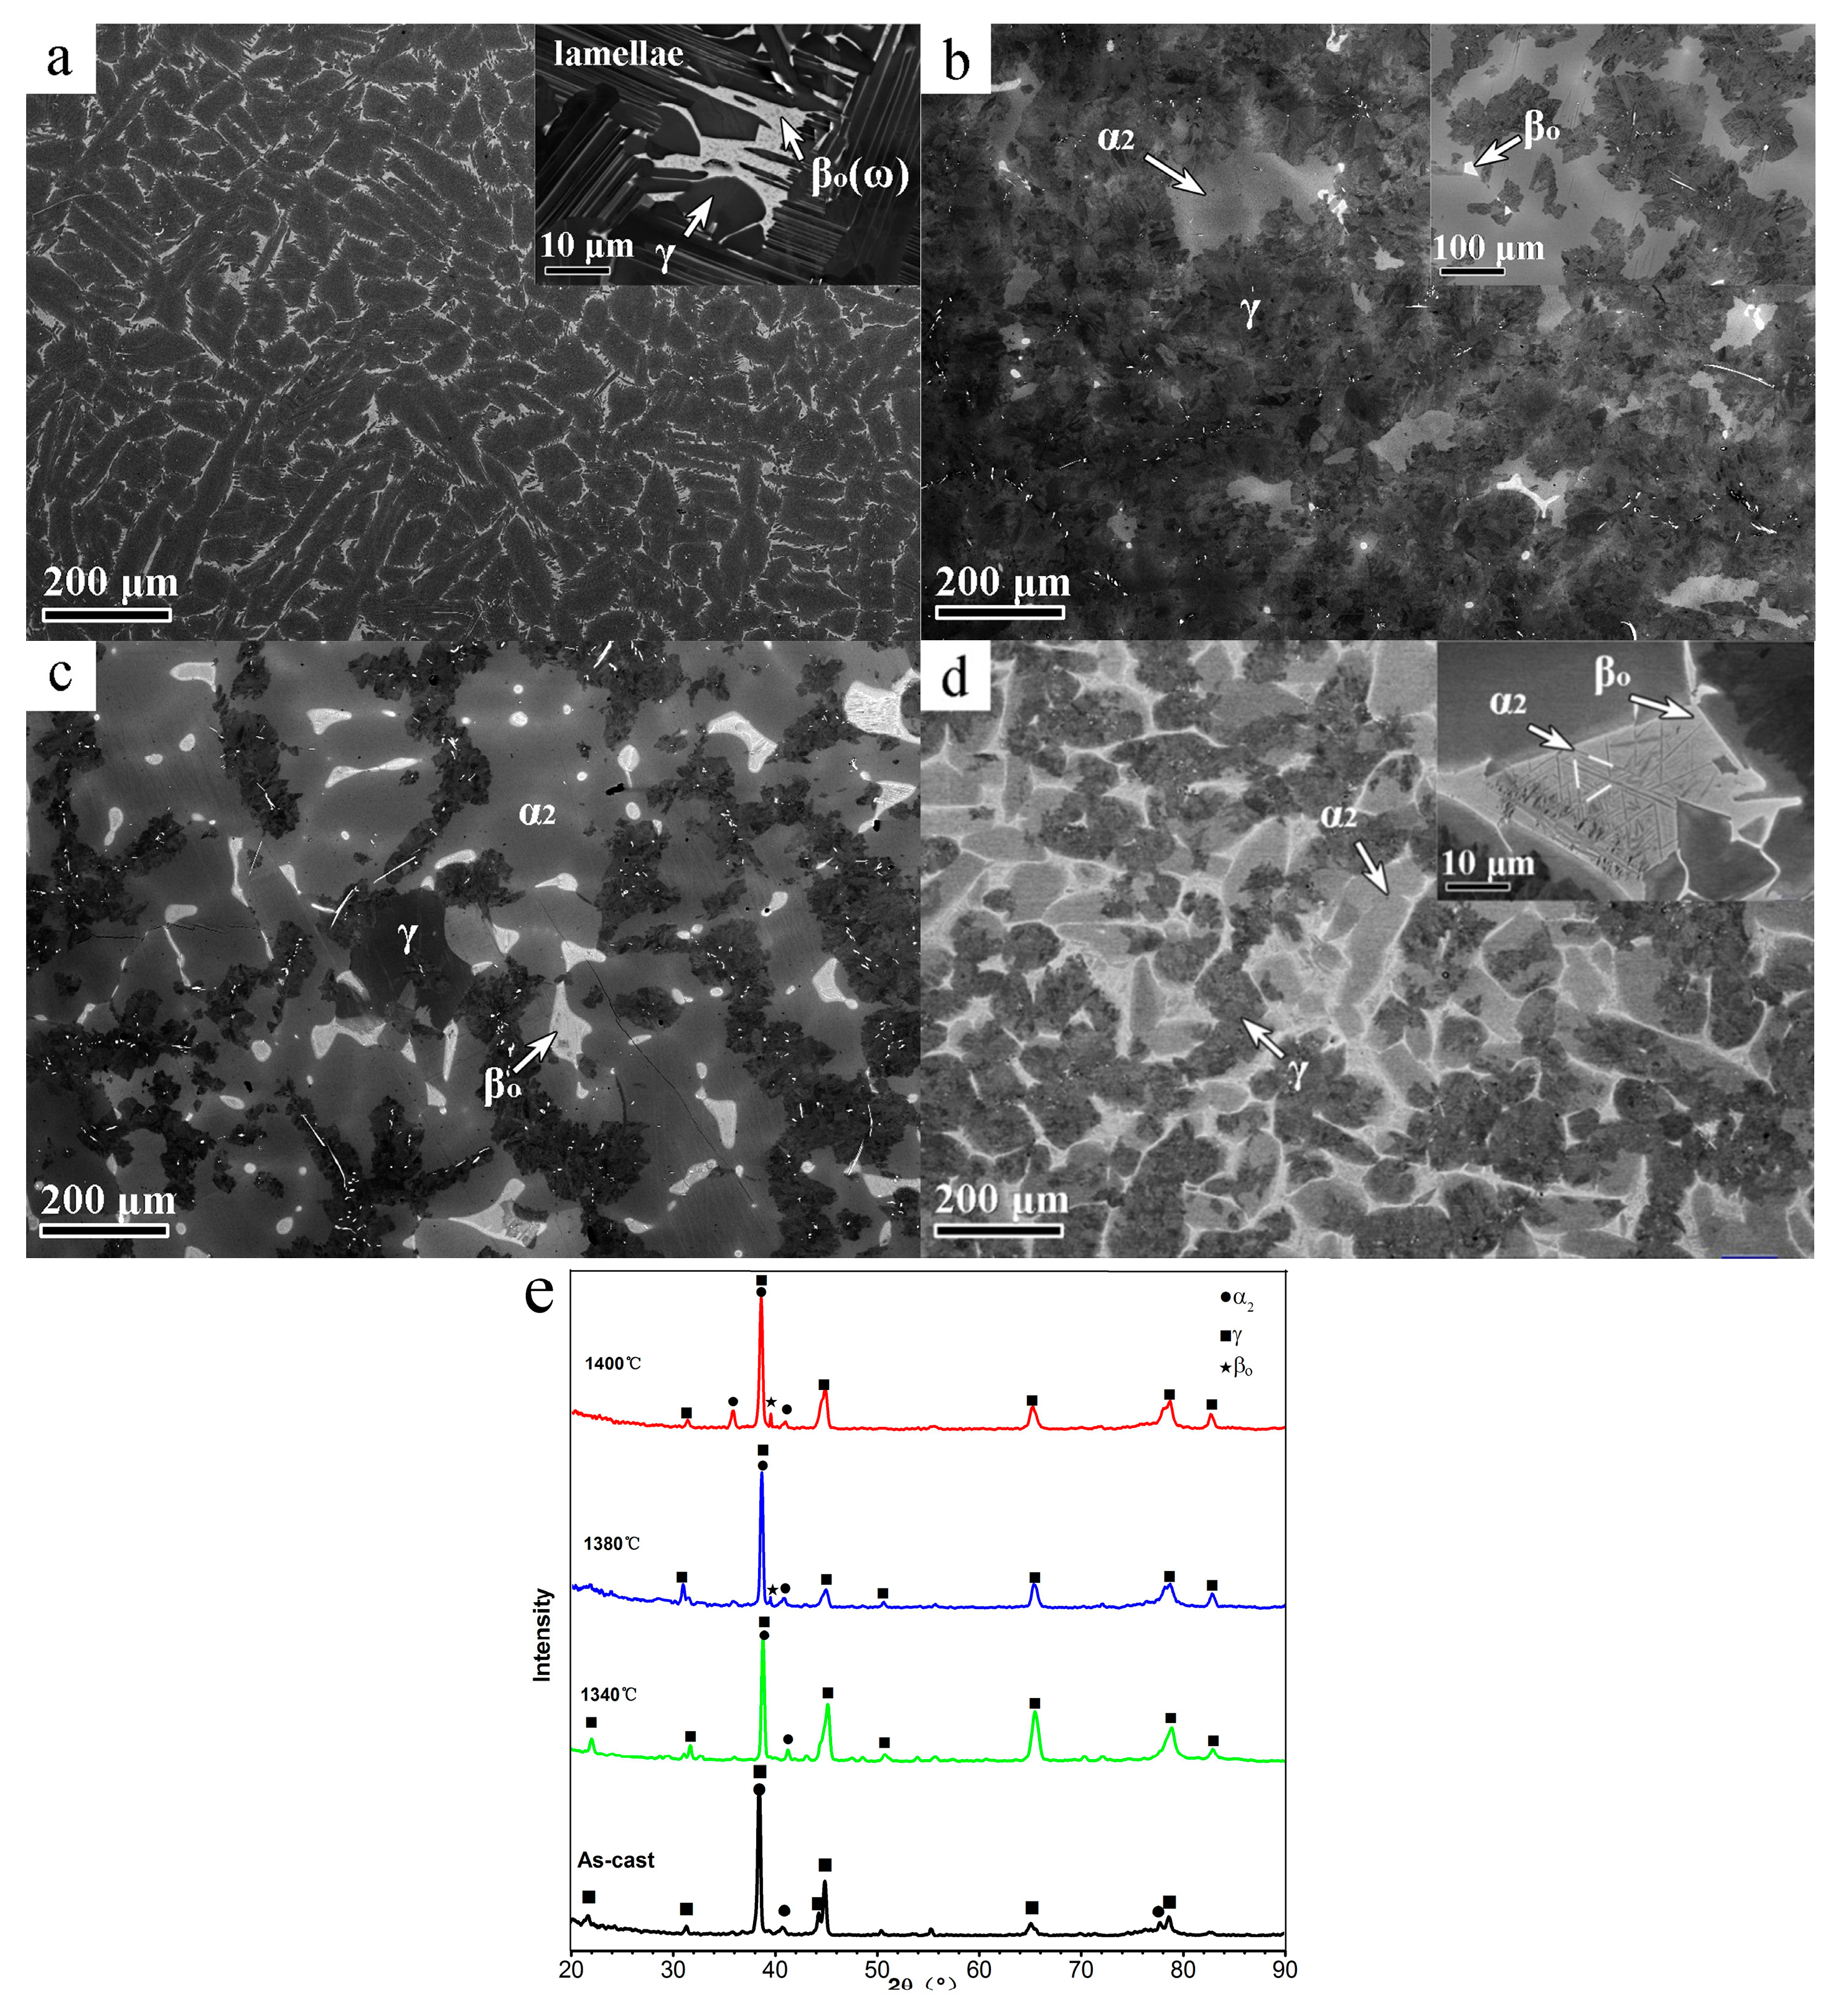
The as-cast microstructure of the Ti-45Al-8.5Nb-0.2W-0.2B-0.02Y alloy is shown in Figure 1a. As reported before, the lamellar colony sizes are in the range of 80–120 μm, which are much smaller than the commercial Ti-48Al-2Nb-2Cr alloy in as-cast state [24,25]. In addition to the grain refinement effect induced by the high amount of Nb, B can strongly lead to a fine-grained microstructure. Equiaxed γ grains are observed at the boundary of the lamellar colony (as shown in the insert of Figure 1a), which can be a result of the coarsening of γ laths during the slow cooling of the large ingot [26]. The βo phase at the lamellar colony boundary is a result of the order-disorder transformation from the high temperature β phase; the subsequent ordering within the βo phase can cause the formation of ordered ω phases, which was reported in detail in our previous research [25]. It should be noted that the α2/γ laths in the lamellar structure can be distinguished unambiguously in the magnified image, because the slow cooling rate of the ingot ensured enough time for the thickening of γ laths. Figure 1b–d shows the SEM images of the samples after quenching from different temperatures. The single α phase field is reported to be rather small in the phase diagram of high Nb-TiAl alloys [21]; thus, it is relatively easy for a certain part of the component to be overheated. As a result, overheating can occur so that the examination of the microstructures cooled from a higher temperature is necessary. It can be seen from the images that when quenched from 1340 °C, a large volume fraction of massive γ phase, i.e., approximately 80%, is obtained. The remaining α2 phase is a known result for higher cooling rates in literature because of the restricted range of the cooling rate for the massive transformation [7,18]. Beside the remaining α2 phase, a tiny amount of βo phase is observed mostly at the boundaries of the α2 phase. The βo phase is inferred to be the untransformed βo areas in the as-cast microstructure, because the heat treatment time is only 30 min. The microstructure after quenching from 1360 °C is shown in Figure 1c. Apparently, 1360 °C is in the α + β two phase region so that the β phase cannot be completely consumed by the α phase. The nucleation of β at certain locations is also possible. The volume fraction of βo areas is much higher and the volume fraction of massive structure is lower than those in the 1340 °C quenched sample. This finding is reasonable, because the nucleation sites of the massive γ phase are usually at the α grain boundaries. The presence of β phase at this temperature reduces the number of α grain boundaries. Although it is not clear whether the massive γ phase can nucleate at the α/β interfaces, the results shown in Figure 1c indicate a negative answer. It is agreed that the nuclei of the massive γ phase normally follow the orientation relationship, with an α grain on one side of the grain boundary that grows into the grain on the other side [19,27]. If a massive γ nuclei appeared at the α/β interface, the growth of γ phase into the neighboring β phase would encounter a high energy barrier due to the lattice structure and composition. Due to the reduced volume fraction of the massive γ phase, the amount of remaining α phase becomes higher, which would increase the heterogeneity in the microstructure if additional annealing was applied. The βo phase also leads to brittleness. In Figure 1d, in which the temperature was 1400 °C, the quenched microstructure seems similar to Figure 1c. The volume fraction of βo phase is higher due to the increased equilibrium β phase constitution at this temperature. The magnified image inserted in Figure 1d suggests that further structural transformation occurs within the βo phase, i.e., the martensite α phase has formed during quenching [28]. Due to the Burgers orientation relationship between α and β phases, different α variants appeared in the β matrix (as indicated by the white lines in the image), which further transform to ordered α2 phase as the temperature decreases [29]. Figure 1e shows the X-ray diffraction results of the above-mentioned microstructures. The phase constitutions fit well with the observed results, expect for the reduced diffraction peak of βo phase in the as-cast and 1340 °C heat treated samples, which is caused by the low volume fractions of βo phase. These results imply that the precise control of the high temperature heat treatment for high Nb-TiAl alloys is critical prior to massive transformation.
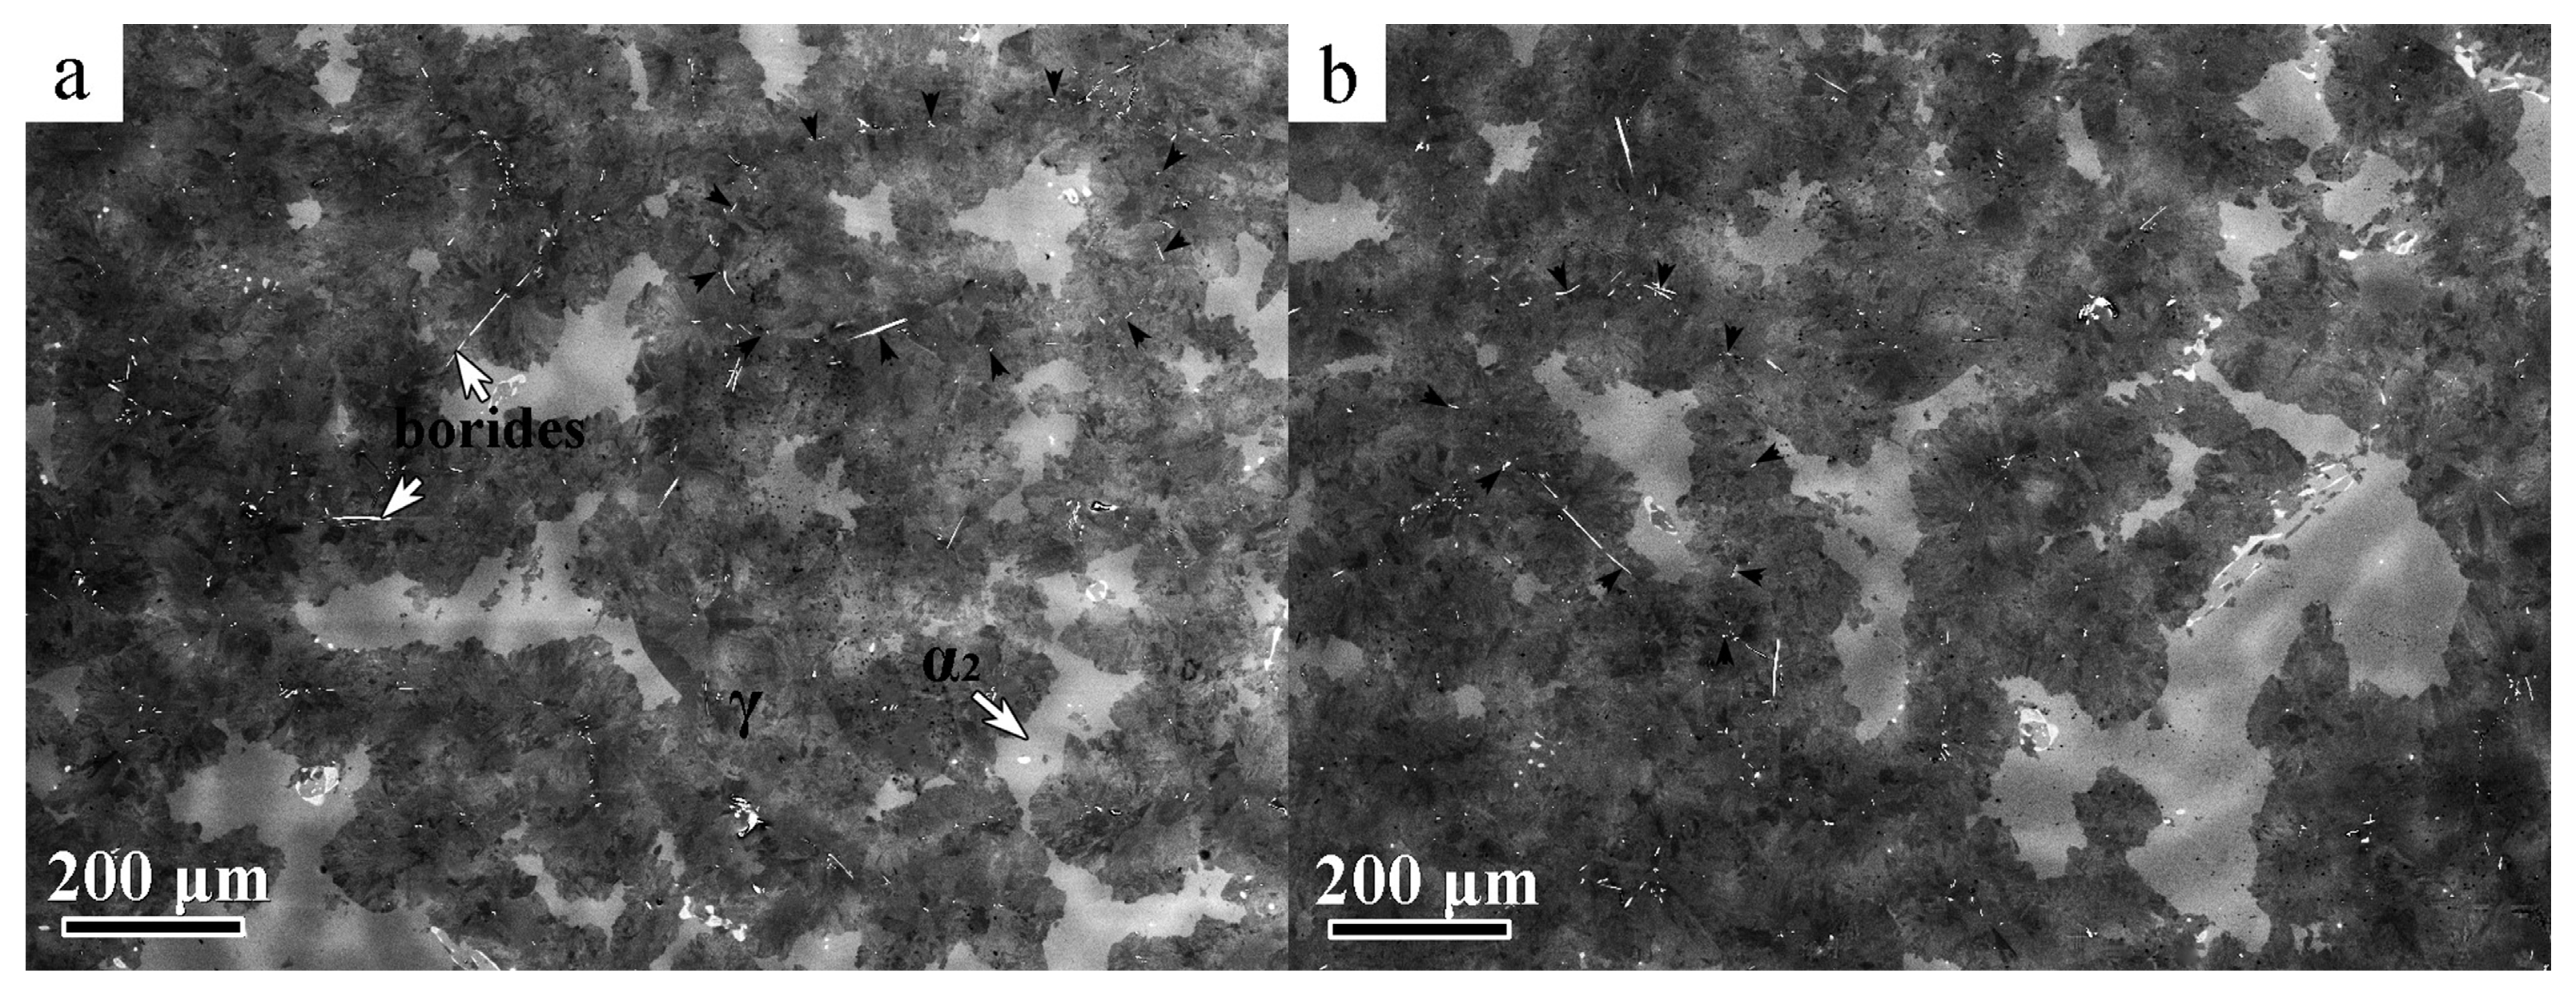
To understand the effects of heat treatment time on the massive transformed structure, an extra 2 h at 1340 °C was conducted followed by water-quenching. Figure 2a,b shows the SEM images of the samples after 30 min and 2 h at 1340 °C, respectively. These two images are almost identical in the volume fraction of the massive γ, as well as remaining α2 phase. Interestingly, the morphology of borides seems to be different from that in the as-cast microstructure. In the as-cast microstructure, the borides appear distributed randomly in the whole microstructure and not within a specific phase. In fact, the borides distribution in the cast material is a result of solidification [30]. In the massive transformed microstructure, the borides appear to make up circles of various sizes. The black arrows in Figure 2 indicate the locations of borides. As reviewed by Hu et al., the borides can act as barriers during the growth of α phase at high temperatures [31]. Based on this understanding, the traces labeled by the black arrows are actually the previous grain boundaries of a high temperature α grain. After careful observation of the traces in Figure 2, one can realize that the grain sizes of the α grains during 1340 °C heat treatment are similar, i.e., approximately 200–300 μm in both images, which is in accordance with other reports [31,32]. This finding can further lead to the conclusion that the growth rate of α grains may decrease with the increase of time. As a result, only after 30 min of heat treatment, the size of α grains can reach a relatively stable value, indicating that longer times have no significant effect. Although the increase of α grain sizes can expand the cooling rate range of massive transformation [18], the prolonged heat treatment time may lead to enhanced aluminium depletion or oxidation. The increased amount of α grain boundaries also serve as the nucleation sites of massive γ, as implied by Figure 1c, in which most borides are in the center of the massive γ grains. It seems that the borides at the boundary of α grains may have some effects on the nucleation of massive γ grains, which is beyond the scope of this article and needs further investigation.
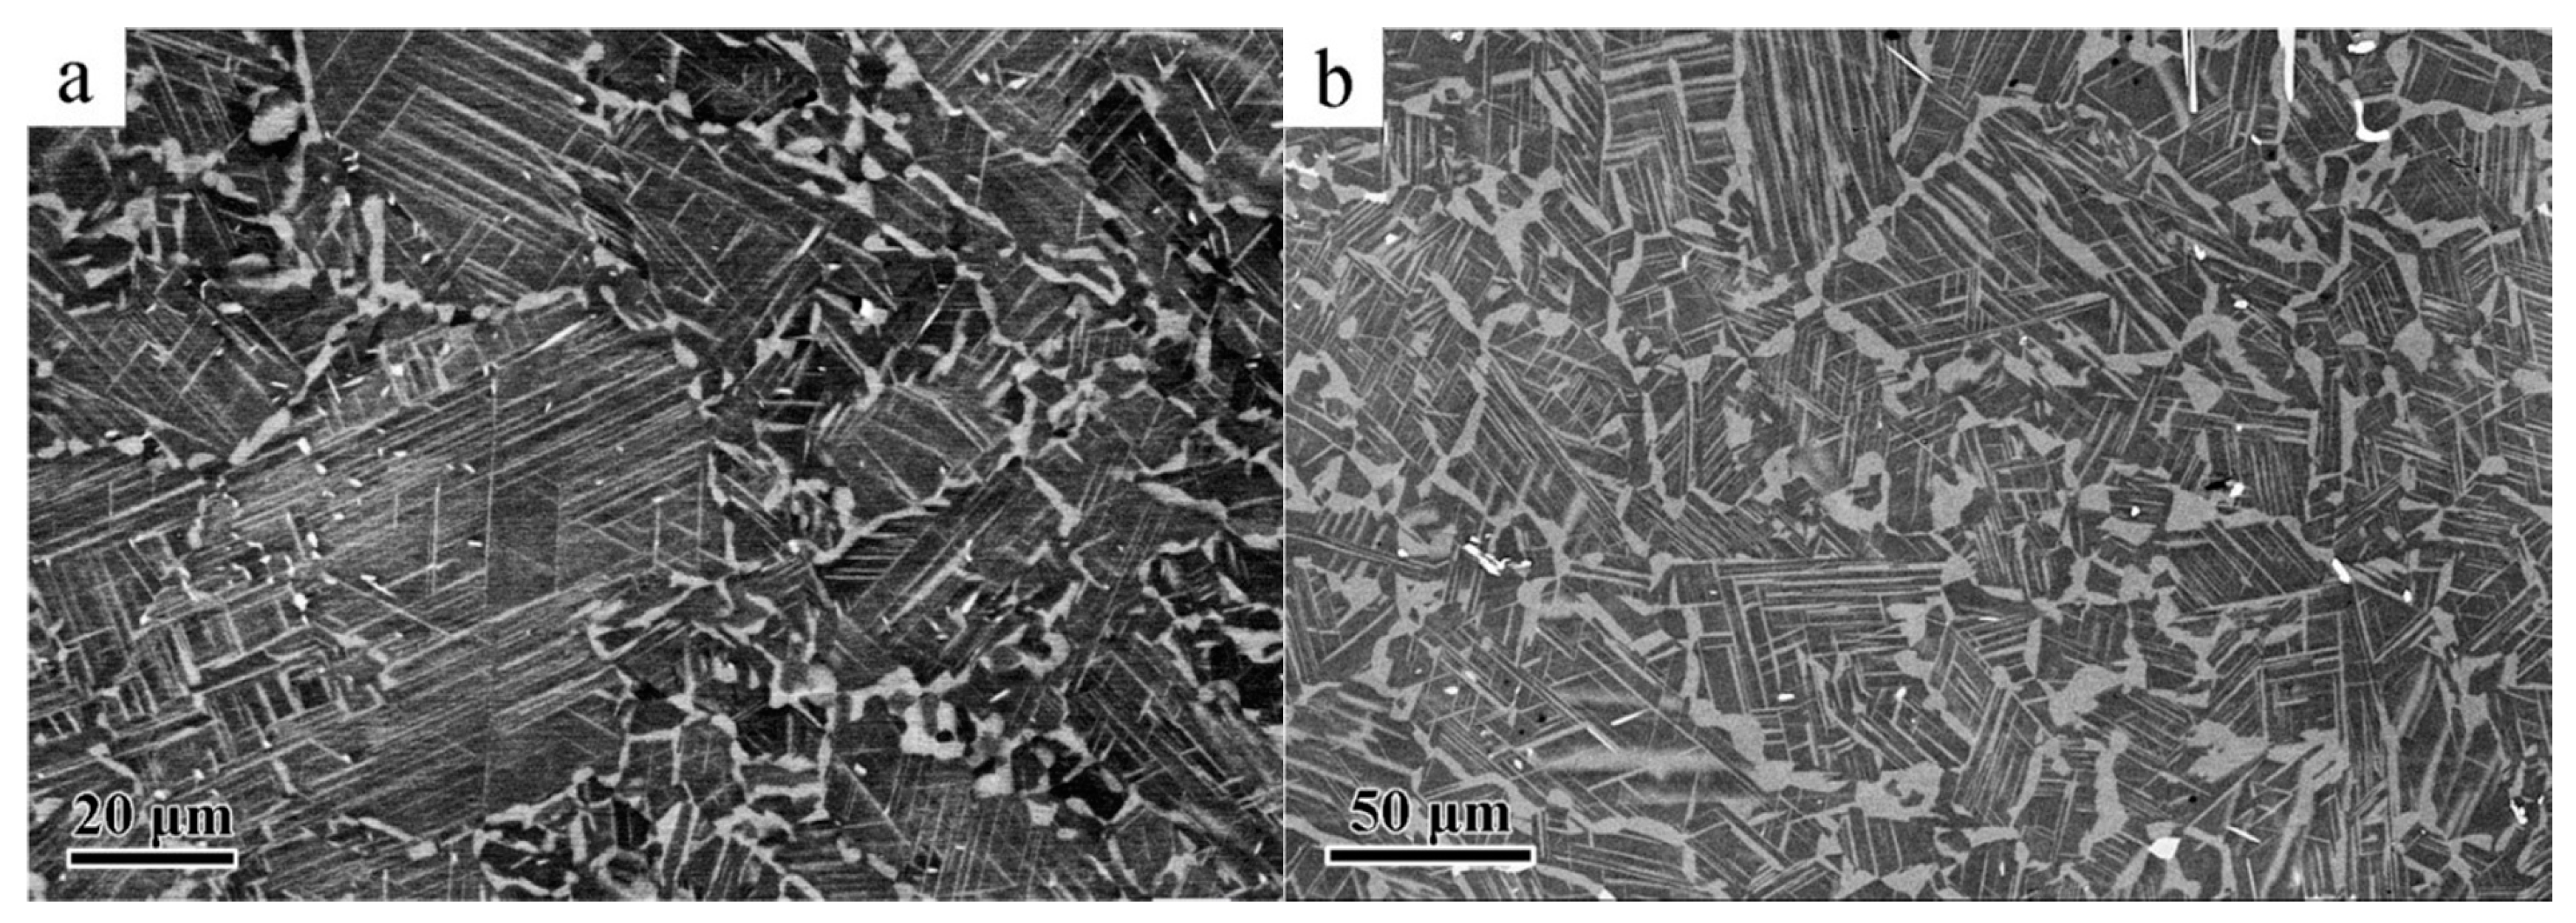
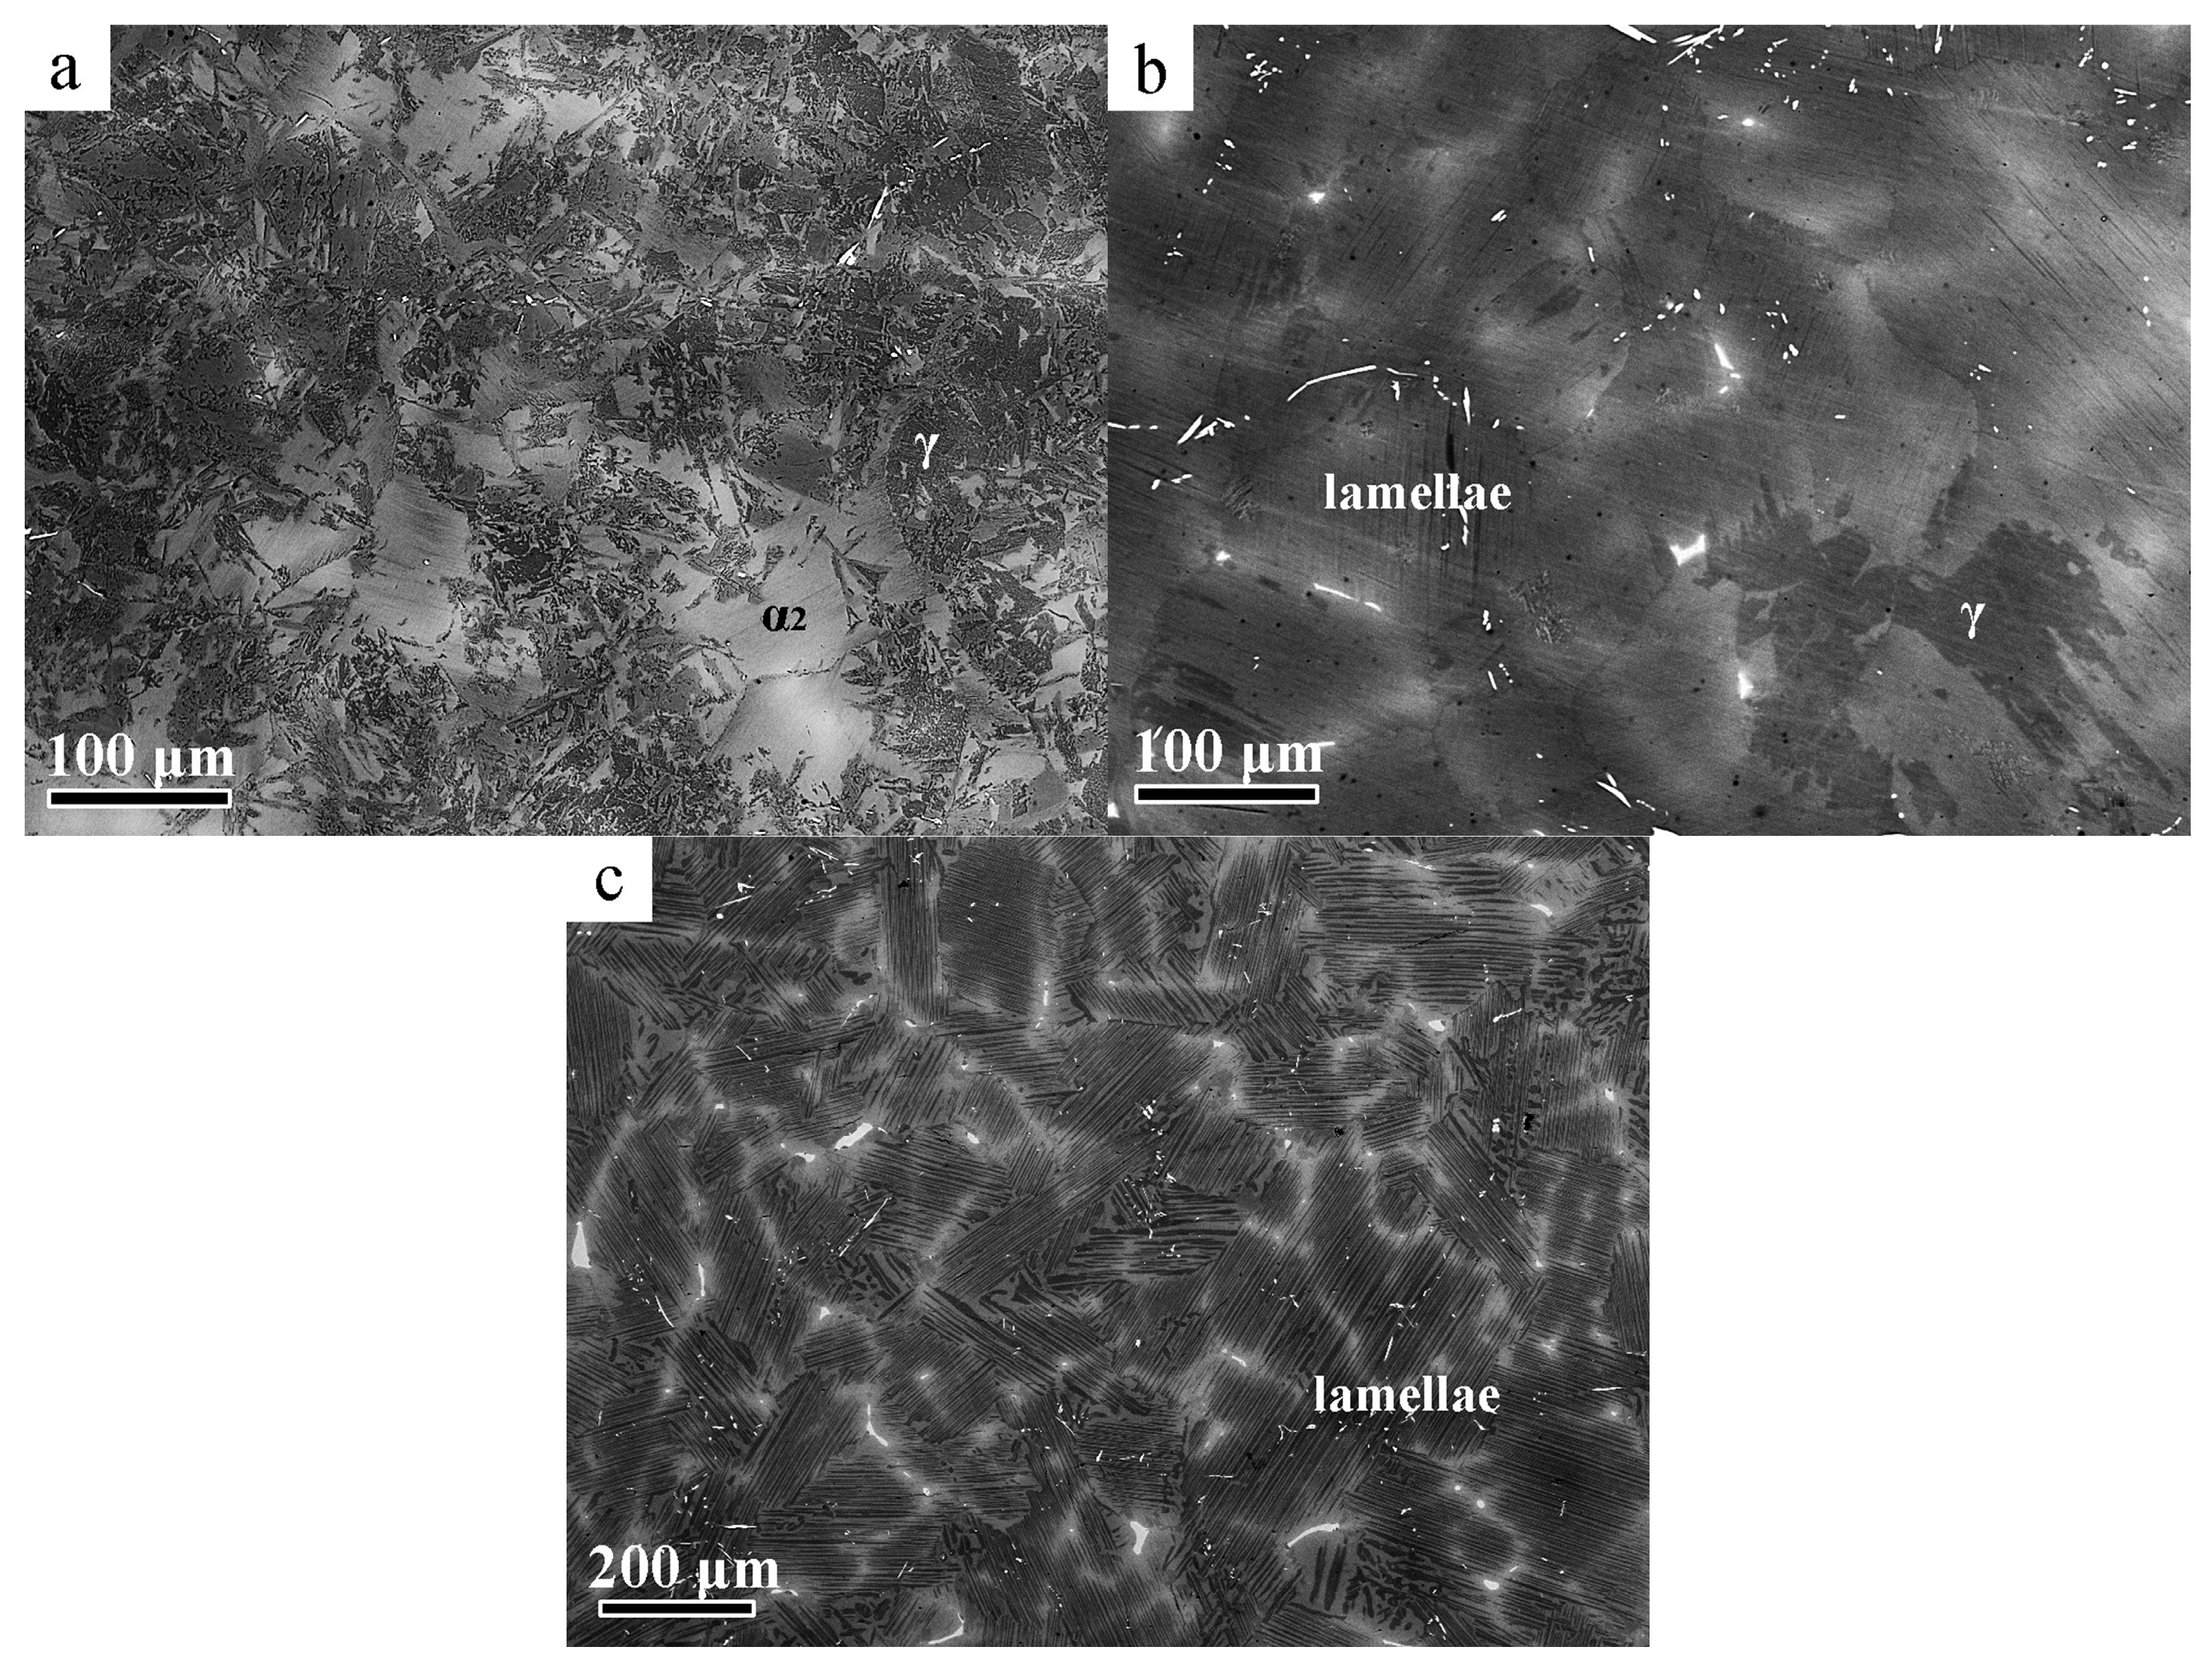
The effect of cooling rates on the microstructure is depicted in Figure 3. Figure 3a shows the microstructure after oil-quenching from 1340 °C. This morphology is similar to that observed in the water-quenched sample shown in Figure 2a. The cooling rate of oil-quenching should be lower than water-quenching; thus, more massive structures were expected in this sample [11]. This result might be related to the fact that boron has an effect on the kinetics of massive transformation [18]. The cooling rate with the same method will of course change for different specimen sizes. Figure 3b displays the morphology of the air-cooled sample. The massive γ phase can still be observed but in a very small volume fraction, which corresponds to the result in Ti-46Al-8Nb alloy [7]. The lamellar microstructure is observed in this air-cooled sample. It seems that the lamellar colonies are composed of numerous thin laths. As a result, it is concluded that the cooling rate during air-cooling is not high enough to generate sufficient massive structures; this outcome is different in the alloy containing Ta, in which a complete massive microstructure can be obtained during air-cooling. The sample after furnace-cooling is composed of a fully lamellar microstructure. The α2 and γ laths in the lamellar colony can be easily distinguished in the low-magnification image, as shown in Figure 3c. These results suggest that the massive microstructure formation in Ti-45Al-8.5Nb-0.2W-0.2B-0.02Y alloy cannot be easily achieved by simply using conventional cooling methods, even though there was firm evidence that a wide range of cooling rate can result in the massive transformed microstructures [33]. As a result, the precise control of the cooling rate is important. However, at present, this finding is not applicable for large components, which is the same problem as those encountered by other TiAl-based alloys [6].
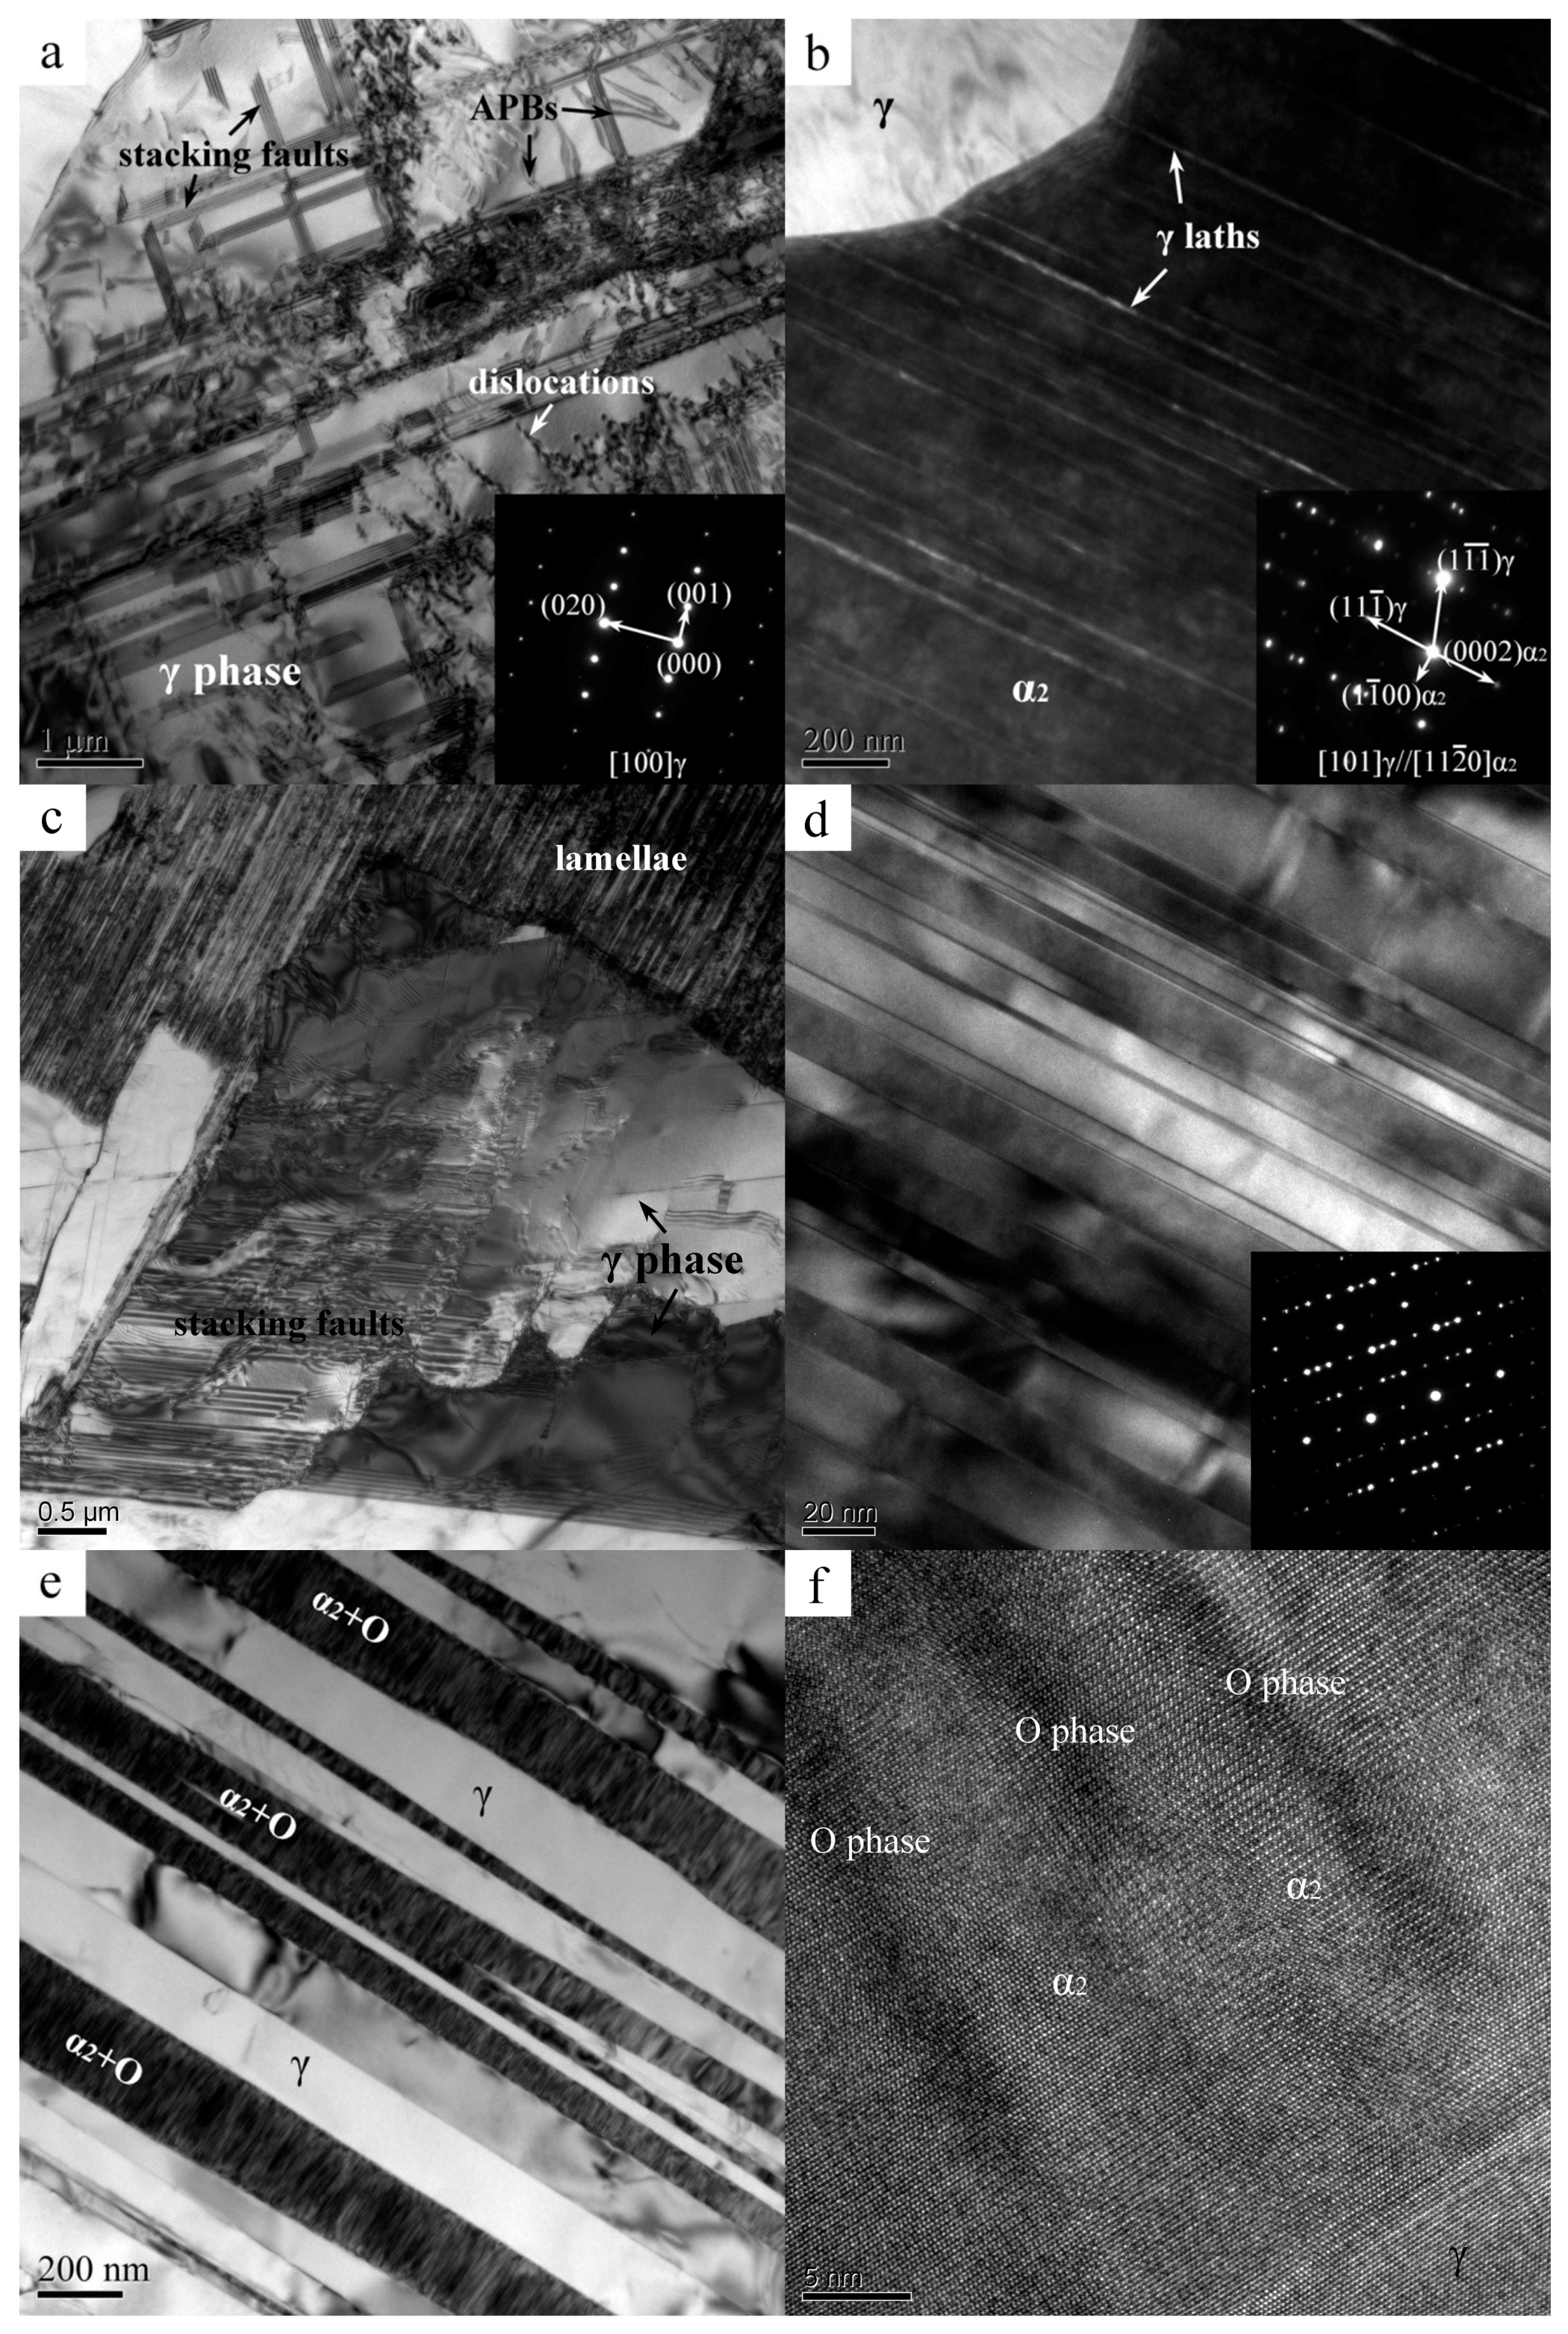
To further examine the microstructure in detail, TEM analysis was conducted on the sample under different cooling conditions. The results are shown in Figure 4. Similar to that reported in other TiAl alloys [27,32], the massive γ phase is full of various defects, including numerous stacking faults, anti-phase boundaries, and dislocations, as displayed in Figure 4a. The density of defects in some regions of massive γ is so high that it is difficult to find a local area free of defects. This observation indicates that the stress caused by quenching is very large, which could easily induce cracks in the microstructure. Obviously, this high cooling rate is not applicable during heat treatment. Similar results are also observed in the water-quenched samples. These defects were reported to be effective nucleation sites during annealing. Zhang et al. [23] confirmed that the dislocations and stacking faults can initiate the nucleation of α phase when annealing above the α transus. The high annealing temperature and numerous defects cause the nucleation at various positions. The researchers even reported the existence of a transition phase γ’ in the γ to α transformation. However, this phenomenon is not observed in the following TEM experiments in this study. Figure 4b is the TEM image of the remaining α2 phase in the oil-quenched sample. A large number of extremely thin γ laths precipitated in the α2 phase, following the commonly reported Blackburn orientation relationship: [101]γ//[11 2 ¯ 0]α2; (11 1 ¯ )γ//(0001)α2. The number and thickness of γ laths seems to be higher than those observed in the water-quenched sample in our previous research [29], probably because oil-quenching has a lower cooling rate so that the γ phase could have some time to thicken and stimulate more nucleation. In the air-cooled sample, however, the remaining α2 phase almost transformed to complete lamellar colonies full of extremely fine laths (Figure 4c). In fact, it is difficult to distinguish the γ or α2 phase in the lamellar colony. From the magnified image in Figure 4d, the thickness of the laths is approximately 5–25 nm, which is similar to the same alloy after low temperature annealing [29]. The defects in the bulk γ phase can still be observed, indicating that air-cooling cannot release the stress in the massive γ phase even though the α2 phase has transformed into lamellar colonies. The volume fraction of the massive structure in the air-cooled sample is in fact very low; therefore, a much larger cooling rate is necessary to form the desired amount of massive microstructure, which seems not available in the present alloy. Figure 4e,f is the TEM images of the furnace-cooled sample. The clear difference in the thickness of laths is apparent compared to Figure 4b,d. Inside the α2 laths the so-called modulated structure appeared, indicating that further phase transformations occurred. Recently, Rackel et al. have systematically studied this morphology and claimed that it was actually a combination of α2 and orthorhombic O phase, which formed below 700 °C [34]. Figure 4f is the high resolution TEM (HRTEM) image of this area. It can be seen that there is no clear interface between the O phase and α2 matrix. The structure of this modulated structure is now being agreed upon and in-depth TEM characterization was conducted recently, whereas the composition variation is still controversial [35,36]. It should be noted that the interface between α2 and γ phases is very smooth, indicating a relatively stable state is reached after furnace-cooling.

3.2. Precipitation Behavior of α2 Phase during Annealing at 1250 °C

A series of annealing treatments were conducted at 1250 °C for different times to examine the influence of annealing time on the massive microstructure. Figure 5a,b shows the SEM images of the samples after annealing for 5 min and 2 h. In general, the morphologies of these two images are similar. The α2 phase precipitated both at the grain boundaries of the massive γ phase and inside the γ matrix. Due to the Blackburn orientation relationship, every γ grain could have four α2 variants precipitated inside, each with their {0001}α2 planes parallel with one of the four {111}γ planes. Thus, the grains are uniformly refined by annealing. It has been reported that those globular α2 grains precipitated at the grain boundaries nucleate and grow faster than those inside the γ matrix [12]. Although this growth is not reflected on the SEM images in Figure 5, it can be reasonably deduced from the following TEM image in Figure 6, in which the α2 grains at the grain boundaries usually grow ahead of the α2 laths. Almost all of the massive γ boundaries are circled by the precipitated globular α2 grains, indicating that nucleation at the boundary is very common. This finding is likely due to the disordered atom arrangements at the grain boundary providing enough driving force for the nucleation, whereas the α2 laths formed within the γ phase need a higher driving force due to the coherent interface between the nuclei and matrix. The α2 precipitates in the sample annealed for 5 min are much smaller than those in the 2 h annealed sample. The width of needle-like α2 precipitates in Figure 5a is mostly less than 1 μm, and the globular α2 grains are approximately 3 μm in size. These results suggest two conclusions: first, only a short annealing time is necessary to initiate abundant precipitates to form a refined microstructure. Second, even though the globular α2 grains form earlier than the needle-like α2 precipitates, the nucleation of these two kinds of α2 phase is finished in a very short time. After examining the other samples with different annealing times, it is found that no essential changes appeared, expect for the sizes of the precipitates. Therefore, to avoid the excessive growth of the α2 phase and obtain a stable microstructure, the annealing time should be carefully adjusted.
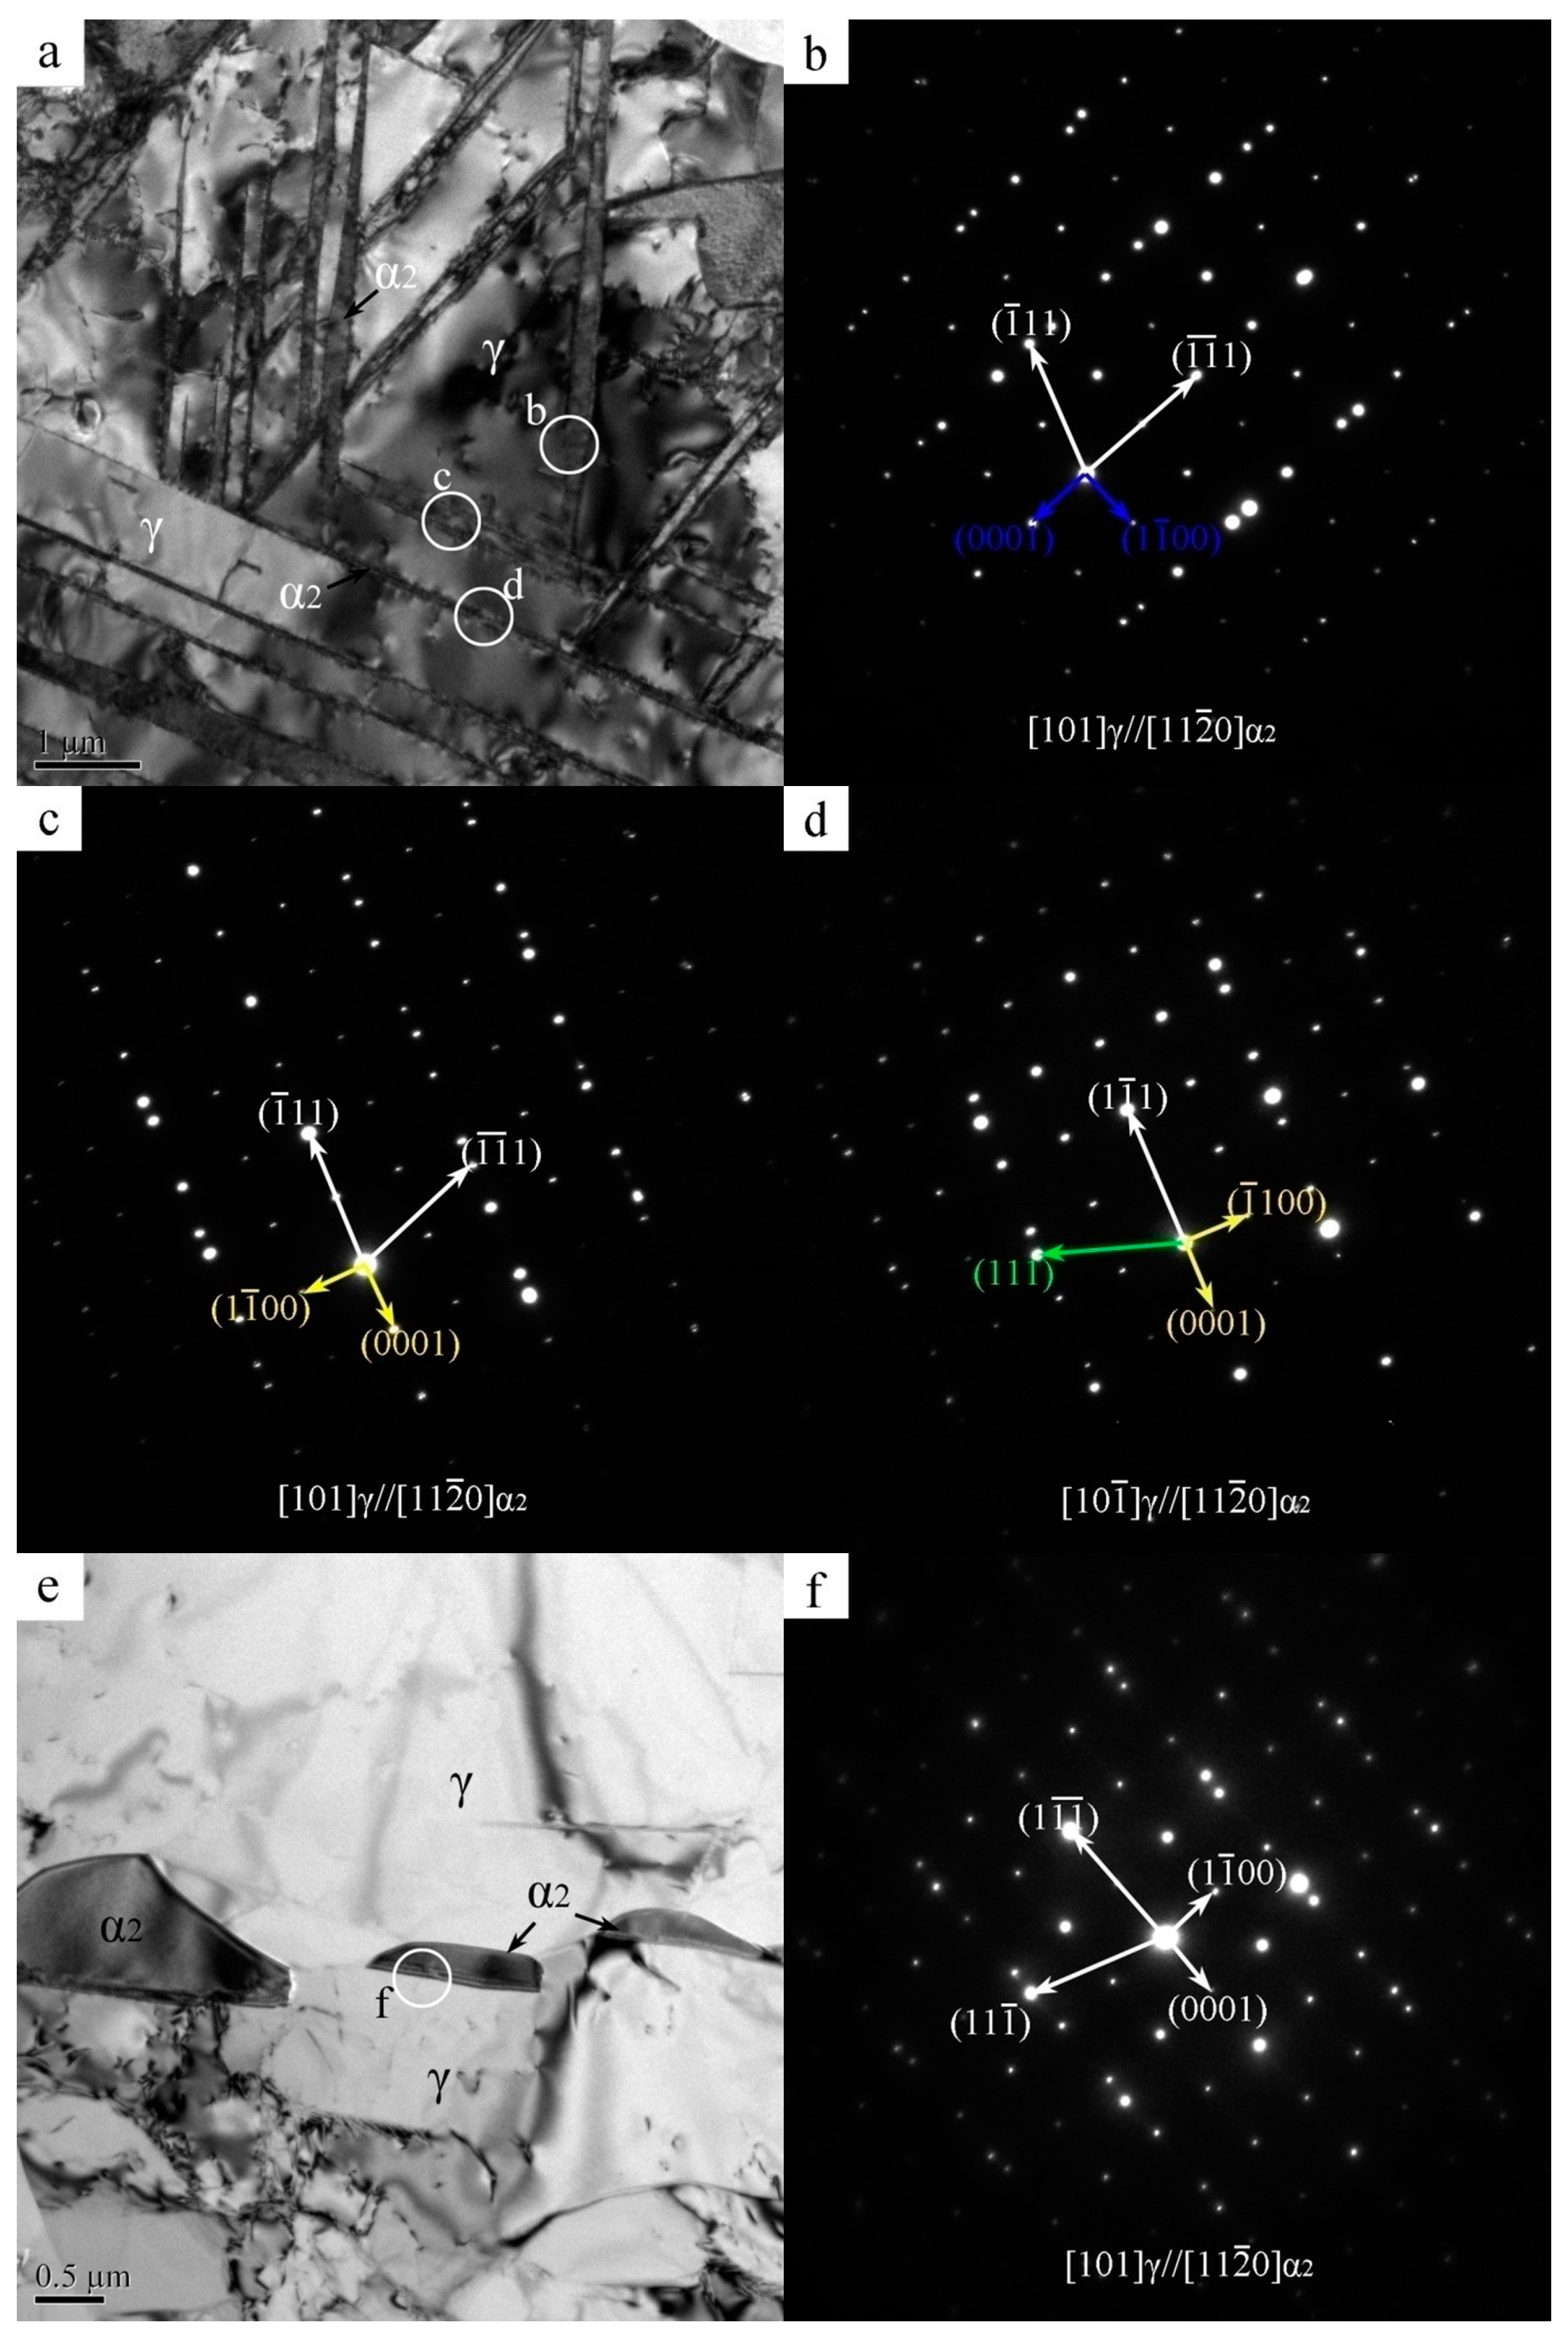
The TEM observations of the sample after annealing for 5 min are displayed in Figure 6. The needle-like α2 precipitates are clearly imaged in Figure 6a. Because there are four α2 variants along {111}γ planes, it is difficult to observe all the variants in a single image. The α2 precipitates seem to arrange in groups in which a couple of precipitates tend to form close to each other. However, this mechanism is not clear. The width of the precipitates at the edge is smaller than in the middle of the lath, indicating that the laths are growing and indicating that a continuous change in width occurred along their long axis. Compared to Figure 4a, the number of defects in γ grains is reduced, but a number of dislocations still exist. Figure 6b–d are the selected area diffraction (SAD) patterns obtained in the corresponding circled areas in Figure 6a. These three locations are the interfaces between the α2 precipitates and γ matrix. All three locations display the Blackburn orientation relationship. If carefully observed, one can find some detailed characteristics from these patterns. The SADs in Figure 6b,c are actually taken within one γ grain. The basal plane of the α2 precipitates in Figure 6b is parallel with the ( 11 ¯ 1)γ plane, while that in Figure 6c is parallel with ( 1 ¯ 11)γ. There is an approximately 71° deviation between the basal planes of these two α2 variants. When examining the SAD in Figure 6d, a distinct zone axis of the γ phase is recorded, which is indexed as a twinning diffraction. This finding indicates that the γ lath in the lower part of Figure 6a is in a twin relationship with the upper γ grain. Twinning in the massive transformed microstructure is very common, and successive twinning was claimed as the main growing mechanism during the development of a massive structure [19]. The SAD recorded in Figure 6d includes an α2 lath formed at the twinning interface that certainly follows the orientation relationship, which is the same as that in Figure 6c. Thus, a twinning interface can serve as nucleation site of α2 precipitates. Because there are four equivalent twinning planes in massive γ, nucleation on twinning interface is inferred to be relatively easier than in the matrix, but still presents convoluted characteristics. The twinning mechanism in the development of the massive structure is very useful and beneficial to establish an anisotropic annealed microstructure. The globular α2 grains formed at the boundaries of massive γ are shown in Figure 6e, and the corresponding SAD is shown in Figure 6f. It can be seen that several α2 grains are in the same orientation with respect to the γ phase, and the sizes of these grains are also similar, suggesting these α2 grains are developed from one side of the γ phase, remaining a relatively flat habit plane. This observation is analogous to that reported by Sankaran et al. and Kumagai et al. [12,37], in which the grain boundary α2 precipitates transformed into lamellar in the following slow cooling process. Therefore, it is expected that if the annealing was not followed by water-quenching but by furnace-cooling, the globular α2 precipitates would transform to lamellar colonies.
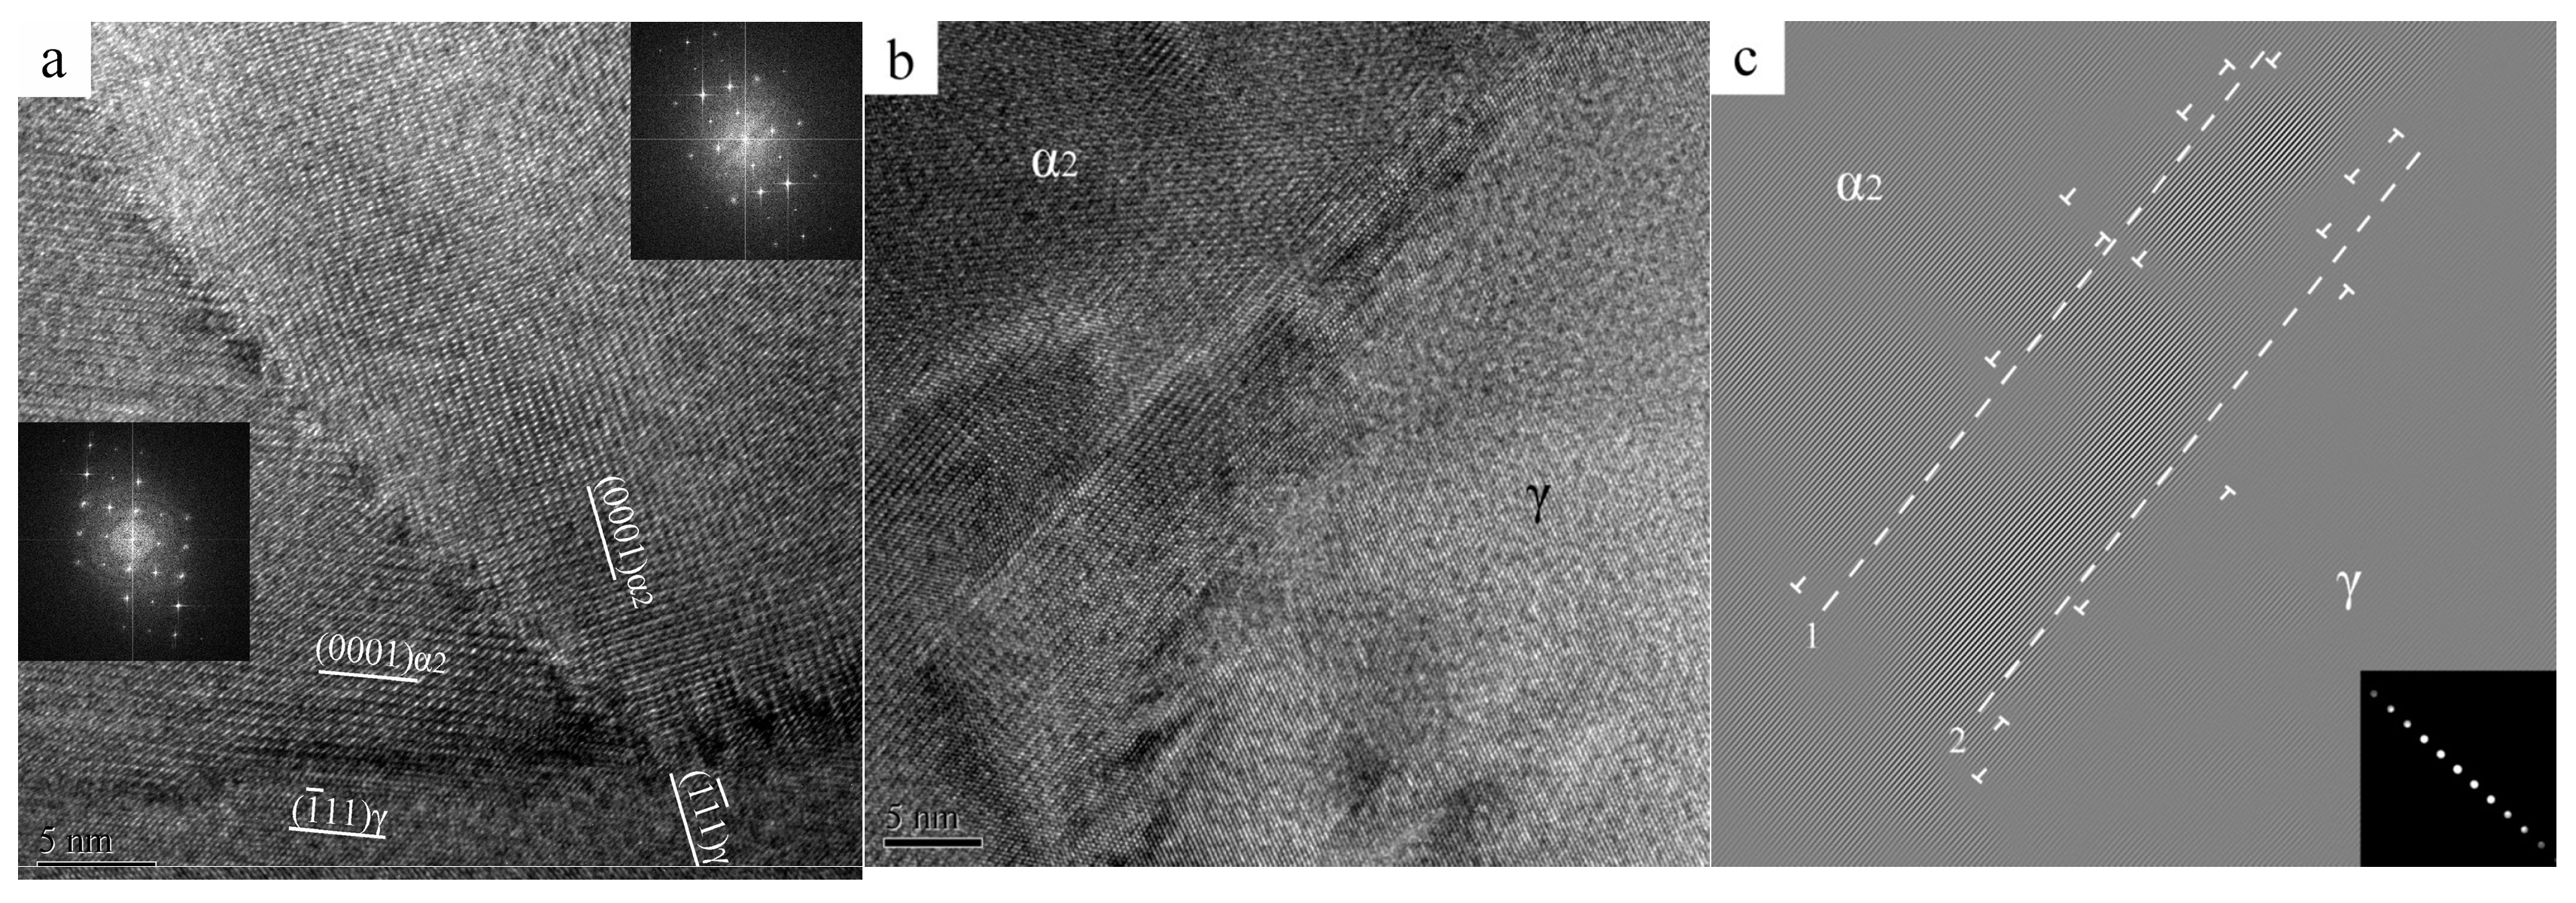
To further explore the precipitation behavior of the α2 phase, HRTEM observation was conducted on the interfaces between α2 variants and the α2 and γ matrix. Figure 7a exhibits the interface between two α2 variants formed from the same γ matrix. As described before, there is a 71° deviation between their (0001) zone axes. The interface is not totally disordered, and at some locations, the atoms are arranged well. Thus, limited defects are present at the interface, which is inferred to be a result of the atom rearrangement at the interface, reducing the interfacial energy, which is similar to the self-accommodation between α2 variants [38]. The reported self-accommodation effects were observed in titanium alloys and the angle between (0001)α2 planes was 60°, which was caused by the Burgers orientation relationship during the disordered β to α transformation [38]. For TiAl alloys, the 71° deviation is easy to understand in the massive transformation; however, detailed observation of the interface is scarce. With regard to the deformation mechanism, these interfaces become more important, because they are definitely very common in the annealed massive structure and can have a significant effect on the crack nucleation and propagation process. It can be seen from the image that the interface between α2 and γ is not coherent but has a few ledges, suggesting the thickening of the α2 laths, which is more clearly shown in Figure 7b. The inverse fast Fourier transformed image obtained from the series diffractions of (0001)α2 in Figure 7b is shown in Figure 7c. Many ledges caused by interface dislocations are labeled in Figure 7c. As indicated in the literature, the thickening of α2 precipitates is achieved by the movement of dislocations [21,35]. Many dislocations at the interface confirm this conclusion. The dislocations seem to form a line that marks the traces of the interface (roughly indicated by label “1” and “2”). The dislocations are mostly concentrated in these two lines, suggesting the interface has moved towards the γ matrix during annealing. As seen in line “2”, the lower part of Figure 7b is the α2 phase while the upper part remains in the γ phase. The annealing temperature is high so that the glide or climb of dislocations can be easily motivated. However, the nucleation of the α2 phase is thought to be displacive; thus, the nucleation can be more active than growth, resulting in the numerous thin α2 laths observed in Figure 5a.

3.3. Hardness Tests on the Annealed Samples

To evaluate the mechanical properties of the annealed samples, Vickers hardness tests were performed on samples annealed for different durations. Figure 8 displays the values and the variation tendency of the results. The highest hardness value occurs in the samples quenched from 1340 °C; this is reasonable because the as-quenched microstructure was composed of massive γ phase with numerous defects and bulk α2 which is difficult to deform. After annealing, the highest hardness appears in the short-term annealed sample (5 min), and it decreases with the increase of annealing time. After 30 min annealing, the hardness values seem to remain stable even if the annealing time reaches 4 h. Considering the microstructure examination mentioned above, the sample annealed for 5 min presents the finest microstructure (Figure 5a). With the increase of annealing time, the needle-like and the globular α2 grains become coarser. It is expected that the dislocations in the finest microstructure have the shortest glide distance compare to the others. The observed interface in Figure 7a could also serve as the source of dislocations, which reach the largest amount at the beginning of annealing. Extensive twinning may play an important role in this sample, since it is known that the interface between the α2 and γ phase is very effective in stimulating twinning deformation [39,40]. With the coarsening of precipitates in the long-term annealed samples, the glide distance of dislocations may not change significantly, because the nucleation is finished and the relative distance between grains has become increasingly stable. However, it should be noted that the variation in hardness values is not drastic in the annealed samples. The evolution of hardness is in accordance with many other alloys except that the highest value is obtained in a very short time, which is difficult to control. The annealing temperature and time can be further optimized in future research.

4. Conclusions

In this study, the effects of heat treatment parameters on the massive microstructure and microstructure evolution during annealing are investigated. The precipitation behavior of the α2 phase is observed in detail; and the hardness of the annealed samples is measured. A considerable amount of the βo and α2 phase could remain if the heat treatment temperature is slightly higher than the range of single α phase field. There are no distinct differences in the quenched microstructures after 30 min and 2 h at 1340 °C. The critical cooling rate for obtaining a fully transformed massive microstructure appears lower than oil-quenching but higher than air-cooling. α2 precipitates can nucleate on the twin boundaries of the massive γ phase. Although the nucleation of globular α2 grains is faster than that of needle-like α2 laths, a considerable amount of nucleation is finished in only 5 min. A certain interface rearrangement mechanism similar to the self-accommodation effects appears applicable for the α2 variants with 71° deviation. The interface between α2 variants is semi-coherent. The thickening of α2 laths is achieved by the movement of interfacial dislocations.

Acknowledgments

This work was supported by the National Natural Science Foundation of China (contract No. 51601146), Natural Science Basic Research Plan of Shaanxi Province (contract No. 2017JQ5006), and State Key Lab of Advanced Metals and Materials (contract No. 2017-ZD02).

Author Contributions

Lin song analyzed the experimental data and wrote this manuscript. Chunqing Wang helped design the research and performed most of experiments. Yong Xu helped do some experiments. XiangyiXue, Tiebang Zhang, and Jinshan Li participated in the discussionon the results and guided the writing of the article.

Conflicts of Interest

The authors declare no conflict of interest.

References

  1. Appel, F.; Clemens, H.; Fischer, F.D. Modeling concepts for intermetallic titanium aluminides. Prog. Mater. Sci. 2016, 81, 55–124. [Google Scholar] [CrossRef]
  2. Clemens, H.; Mayer, S. Design, processing, microstructure, properties, and applications of advanced intermetallic TiAl alloys. Adv. Eng. Mater. 2013, 15, 191–215. [Google Scholar] [CrossRef]
  3. Wu, Z.E.; Hu, R.; Zhang, T.B.; Zhang, F.; Kou, H.C.; Li, J.S. Understanding the role of carbon atoms on microstructure and phase transformation of high Nb containing TiAl alloys. Mater. Charact. 2017, 124, 1–7. [Google Scholar] [CrossRef]
  4. Gao, S.B.; Xu, X.J.; Shen, Z.Z.; Ye, T.; Xu, S.; Lin, J.P. Microstructure and properties of forged plasma arc melted pilot ingot of Ti–45Al–8.5Nb–(W, B, Y) alloy. Mater. Sci. Eng. A 2016, 677, 89–96. [Google Scholar] [CrossRef]
  5. Kościelna, A.; Szkliniarz, W. Effect of cyclic heat treatment parameters on the grain refinement of Ti–48Al–2Cr–2Nb alloy. Mater. Charact. 2009, 60, 1158–1162. [Google Scholar] [CrossRef]
  6. Hu, D.; Wu, X.; Loretto, M.H. Advances in optimisation of mechanical properties in cast TiAl alloys. Intermetallics 2005, 13, 914–919. [Google Scholar] [CrossRef]
  7. Hu, D.; Huang, A.J.; Wu, X. On the massive phase transformation regime in TiAl alloys: The alloying effect on massive/lamellar competition. Intermetallics 2007, 15, 327–332. [Google Scholar] [CrossRef]
  8. Saage, H.; Huang, A.J.; Hu, D.; Loretto, M.H.; Wu, X. Microstructures and tensile properties of massively transformed and aged Ti46Al8Nb and Ti46Al8Ta alloys. Intermetallics 2009, 17, 32–38. [Google Scholar] [CrossRef]
  9. Jiang, H.; Zhang, K.; Hao, X.J.; Saage, H.; Wain, N.; Hu, D.; Loretto, M.H.W. Nucleation of massive gamma during air cooling of Ti46Al8Ta. Intermetallics 2010, 18, 938–944. [Google Scholar] [CrossRef]
  10. Clemens, H.; Bartels, A.; Bystrzanowski, S.; Chladil, H.; Leitner, H.; Dehm, G.; Gerling, R.; Schimansky, F.P. Grain refinement in γ-TiAl-based alloys by solid state phase transformations. Intermetallics 2006, 14, 1380–1385. [Google Scholar] [CrossRef]
  11. Imayev, V.; Khismatullin, T.; Oleneva, T.; Imayev, R.; Valiev, R.; Wunderlich, R.; Minkow, A.; Fecht, U.H.J. Grain refinement in cast Ti-46Al-8Nb and Ti-46Al-8Ta alloys via massive transformation. Adv. Eng. Mater. 2008, 10, 1095–1100. [Google Scholar] [CrossRef]
  12. Sankaran, A.; Bouzy, E.; Fundenberger, J.J.; Hazotte, A. Texture and microstructure evolution during tempering of gamma-massive phase in a TiAl-based alloy. Intermetallics 2009, 17, 1007–1016. [Google Scholar] [CrossRef]
  13. Mishin, Y.; Herzig, C. Diffusion in the Ti-Al system. Acta Mater. 2000, 46, 589–632. [Google Scholar] [CrossRef]
  14. Paul, J.D.H.; Appel, F.; Wanger, R. The compression behaviour of niobium alloyed γ-titanium alumindies. Acta Mater. 1998, 46, 1075–1085. [Google Scholar] [CrossRef]
  15. Kim, Y.W.; Rosenberger, A.; Dimiduk, D.M. Microstructural changes and estimated strengthening contributions in a gamma alloy Ti-45Al-5Nb pack-rolled sheet. Intermetallics 2009, 17, 1017–1027. [Google Scholar] [CrossRef]
  16. Han, J.C.; Xiao, S.L.; Tian, J.; Chen, Y.Y.; Xu, L.J.; Wang, X.P.; Jia, Y.; Du, Z.X.; Cao, S.Z. Grain refinement by trace TiB2 addition in conventional cast TiAl-based alloy. Mater. Charact. 2015, 106, 112–122. [Google Scholar] [CrossRef]
  17. Leonard, K.J.; Vasudevan, V.K. Phase equilibria and solid state transformations in Nb-rich Nb-Ti-Al intermetallic alloys. Intermetallics 2000, 8, 1257–1268. [Google Scholar] [CrossRef]
  18. Hu, D.; Huang, A.J.; Novovic, D.; Wu, X. The effect of boron and alpha grain size on the massive transformation in Ti-46Al-8Nb-xB alloys. Intermetallics 2006, 14, 818–825. [Google Scholar] [CrossRef]
  19. Sankaran, A.; Bouzy, E.; Humbert, M.; Hazotte, A. Variant selection during nucleation and growth of γ-massive phase in TiAl-based intermetallic alloys. Acta Mater. 2009, 57, 1230–1242. [Google Scholar] [CrossRef]
  20. Fischer, F.D.; Cha, L.; Dehm, G.; Clemens, H. Can local hot spots induce α2/γ lamellae during incomplete massive transformation of γ-TiAl alloys? Intermetallics 2010, 18, 972–976. [Google Scholar] [CrossRef]
  21. Chen, G.L.; Xu, X.J.; Teng, Z.K.; Wang, Y.L.; Lin, J.P. Microsegregation in high Nb containing TiAl alloy ingots beyond laboratory scale. Intermetallics 2007, 15, 625–631. [Google Scholar] [CrossRef]
  22. Xu, X.J.; Lin, J.P.; Teng, Z.K.; Wang, Y.L.; Chen, G.L. On the microsegregation of Ti-45Al-(8-9)Nb-(W, B, Y) alloy. Mater. Lett. 2007, 61, 369–373. [Google Scholar] [CrossRef]
  23. Zhang, W.J.; Chen, G.L.; Evangelista, E. Formation of α phase in the massive and feathery γ-TiAl alloys during aging in the single α field. Metall. Mater. Trans. A 1999, 30, 2591–2598. [Google Scholar] [CrossRef]
  24. Dahar, S.; Seifi, S.M.; Bewlay, P.; Lewandowski, J.J. Effects of test orientation on fracture and fatigue crack growth behavior of third generation as-cast Ti-48Al-2Nb-2Cr. Intermetallics 2015, 57, 73–82. [Google Scholar] [CrossRef]
  25. Song, L.; Zhang, L.Q.; Xu, X.J.; Sun, J.; Lin, J.P. Omega phase in as-cast high-Nb-containing TiAl alloy. Scr. Mater. 2013, 68, 929–932. [Google Scholar] [CrossRef]
  26. Song, L.; Xu, X.J.; You, L.; Liang, Y.F.; Lin, J.P. Phase transformation and decomposition mechanisms of the βo(ω) phase in cast high Nb containing TiAl alloy. J. Alloys Compd. 2014, 616, 483–491. [Google Scholar] [CrossRef]
  27. Nie, J.F.; Muddle, B.C. Orientation and structure of planar facets on the massive phase γ m in a near-TiAl alloy. Metall. Mater. Trans. A 2002, 33, 2381–2389. [Google Scholar] [CrossRef]
  28. Hu, D.; Jiang, H. Martensite in a TiAl alloy quenched from beta phase field. Intermetallics 2015, 56, 87–95. [Google Scholar] [CrossRef]
  29. Song, L.L.; Li, J.S. Phase transformation mechanisms in a quenchedTi-45Al-8.5Nb-0.2W-0.2B-0.02Y alloy after subsequent annealing at 800 °C. J. Alloys Compd. 2017, 691, 60–66. [Google Scholar] [CrossRef]
  30. Cheng, T.T. The mechanism of grain refinement in TiAl alloys by boron addition—An alternative hypothesis. Intermetallics 2000, 8, 29–37. [Google Scholar] [CrossRef]
  31. Hu, D. Role of boron in TiAl alloy development: A review. Rare Met. 2016, 35, 1–14. [Google Scholar] [CrossRef]
  32. Chan, K.S.; Shin, D.S. Fundamental aspects of fatigue and fracturein a TiAl sheet alloy. Metall. Mater. Trans. A 1998, 29, 73–87. [Google Scholar] [CrossRef]
  33. Veeraraghavan, D.; Wang, P.; Vasudeven, V.K. Kinetics and thermodynamics of the α→γm massive transformation in a Ti-47.5 at.% Al alloy. Acta Mater. 1999, 47, 3313–3330. [Google Scholar] [CrossRef]
  34. Rackel, M.W.; Stark, A.; Gabrisch, H.; Schell, N.; Schreyer, A.; Pyczak, F. Orthorhombic phase formation in a Nb-richγ-TiAl based alloy—An in situ synchrotron radiation investigation. Acta Mater. 2016, 121, 343–351. [Google Scholar] [CrossRef]
  35. Gabrish, H.; Lorenz, U.; Pyczak, F.; Rackel, M.; Stark, A. Morphology and stability of orthorhombic and hexagonal phases in a lamellar γ-Ti-42Al-8.5Nb alloy-A transmission electron microscopy study. Acta Mater. 2017, 135, 304–313. [Google Scholar] [CrossRef]
  36. Ren, G.D.; Sun, J. High-resolution electron microscopy characterization of modulated structure in high Nb-containing lamellar γ-TiAl alloy. Acta Mater. 2018, 144, 516–523. [Google Scholar] [CrossRef]
  37. Kumagai, T.; Abe, E.; Kimura, T.; Nakamura, M. The γ→α phase transformation in γ-based TiAl alloy. Scr. Mater. 1996, 34, 235–242. [Google Scholar] [CrossRef]
  38. Lee, E.; Banerjee, R.; Kar, S.; Bhattacharyya, D.; Fraser, H.L. Selection of a variants during microstructural evolution inα/βtitanium alloys. Philos. Mag. 2007, 87, 3615–3627. [Google Scholar] [CrossRef]
  39. Appel, F.; Oehring, M.; Paul, J.D.H. Nano-scale design of TiAl alloys based onβ-phase decomposition. Adv. Eng. Mater. 2006, 8, 371–376. [Google Scholar] [CrossRef]
  40. Appel, F.; Paul, J.D.H.; Oehring, M. Phase transformations during creep of a multiphase TiAl-based alloy with a modulated microstructure. Mater. Sci. Eng. A 2009, 510–511, 342–349. [Google Scholar] [CrossRef]
Figure 1. SEM images of the as-cast microstructure (a) and microstructures after heat treatment at 1340 °C (b), 1360 °C (c), and 1400 °C (d) for 30 min followed by water-quenching, the corresponding x-ray diffraction patterns of the above microstructures are shown in (e).
Metals 08 00089 g001
Figure 2. SEM images of the microstructures after heat treatment at 1340 °C for 30 min (a) and 2 h (b) followed by water-quenching; the arrowheads indicate the boundaries of the former α2 phase at high temperature.
Metals 08 00089 g002
Figure 3. SEM images of the microstructures after cooling from 1340 °C by oil-quenching (a); air-cooling (b); and furnace-cooling (c).
Metals 08 00089 g003
Figure 4. (a,b) TEM images of the microstructures after oil-quenching; note the various defects in the γ phase and the thin γ laths in Blackburn orientation relationship formed inside the bulk α2 grains; (c,d) TEM images of the air-cooled sample; the gray contrast areas are actually extremely thin lamellar structures; (e,f) the α2 laths in the furnace-cooled sample decomposed into a complex structure of α2 + O phases; the HRTEM image displays the coherent or semi-coherent interfaces between α2 and O phases.
Metals 08 00089 g004
Figure 5. SEM images of the microstructures following annealing at 1250 °C for 5 min (a) and 2 h (b) after water-quenched from 1340 °C.
Metals 08 00089 g005
Figure 6. (a) TEM image of the precipitated α2 laths in the massive transformed γ phase; different variants are observed growing along various {111}γ planes; (bd) SAD patterns of the corresponding circled areas in (a), indicating the α2 variants following the Blackburn orientation relationship and the twinning of the γ phase; (e,f) TEM image and the corresponding SAD pattern of the globular α2 grains formed at the boundary of the γ phase; the α2 grains tend to form the Blackburn orientation relationship with one side of the γ phase.
Metals 08 00089 g006
Figure 7. HRTEM images of the interfaces formed by two α2 variants (a) and α2 lath and γ matrix (b); (c) the inverse FFT image of (b) obtained by the series of (0001)α2 reflection, indicating the thickening mechanism of α2 lath by the movement of ledges at the interface.
Metals 08 00089 g007
Figure 8. Vickers hardness values of the water-quenched and annealed samples; the hardness of the annealed samples remains stable even after 4 h annealing.
Metals 08 00089 g008

