Mechanical Behavior of Two Ferrite–Martensite Dual-Phase Steels over a Broad Range of Strain Rates
by
 , ,
, ,
Jiangtao Liang
1,2 ,
,
Zhengzhi Zhao
1,*,
Hong Wu
3,
Chong Peng
3,
Binhan Sun
2,
Baoqi Guo
2,
Juhua Liang
1 and
Di Tang
1 1
Collaborative Innovation Center of steel Technology, University of Science and Technology Beijing, Beijing 100083, China
2
Department of Materials Engineering, McGill University, 3610 University Street, Montreal, QC H3A 2B2, Canada
3
Xin Yu Iron and Steel Co., Ltd., Xinyu 338001, Jiangxi, China
*
Author to whom correspondence should be addressed.
Metals 2018, 8(4), 236; https://doi.org/10.3390/met8040236
Submission received: 27 February 2018
/
Revised: 22 March 2018
/
Accepted: 26 March 2018
/
Published: 3 April 2018
(This article belongs to the Special Issue Mechanical Behavior of High-Strength Low-Alloy Steels)
Abstract
:The present study concerns the deformation and fracture behavior of two ferrite–martensite dual phase steels (FMDP660 and FMDP780) with different phase fractions subjected to different strain rate (0.001 s−1 to 1000 s−1) tensile testing. For both steels, the yield strength (YS) monotonically increased with strain rates, whereas the values of ultimate tensile strength (UTS), uniform elongation (UE) and post-uniform elongation (PUE) were maintained stable at the low strain rate range (0.001–0.1 s−1), followed by a significant increase with strain rate at high strain rate levels (0.1–1000 s−1). The FMDP780 steel with a higher fraction of martensite possessed a stronger strain rate sensitivity of tensile strength and elongation (UE and PUE) values at the high strain rate stage, compared with the FMDP660 sample. The change of UTS and UE with different strain rates and phase fractions was highly related to the strain hardening behavior, which was controlled by the dislocation multiplication in ferrite, as validated by transmission electron microscopy (TEM). The fracture surface of the two steels was characterized by dimpled-type fracture associated with microvoid formation at the ferrite–martensite interfaces, regardless of the strain rates. The change of the dimple size and PUE value of the two steels with strain rates was attributed to the effect of adiabatic heating during tensile testing.
1. Introduction
The automotive industry is facing stringent regulations and significant challenges on weight reduction of road transportation vehicles for fuel economy, as well as improvement of crashworthiness performance to ensure vehicle safety. The response to these challenges requires the intensive use of advanced high strength steels (AHSS) in body-in-white assemblies. Ferrite–martensite dual-phase (FMDP) steels are one of the most widely used AHSS in the automotive industry [1,2,3,4]. The composite structure consisting of soft ferrite and hard martensite results in a great strength–ductility combination and interesting mechanical features, such as continuous yielding and initial high work hardening rate [5,6].
It is well documented that there is a large difference of the deformation behavior in automotive materials under collision and the quasi-static condition [7]. Understanding the dynamic deformation behavior of FMDP steels is thus very important in improving the safety of the vehicles. Despite the large amounts of the study on the dynamic deformation behavior of DP steels [8,9,10,11], some inconsistencies still remain with respect to the effect of strain rate on the change of mechanical property values. For example, Yu et al. [12] has investigated the strain rate-dependent mechanical behavior of a DP600 steel, using the John–Cook (JC) rate-dependent constitutive model. It was found that the yield strength (YS) and ultimate tensile strength (UTS) of the steel increased with higher strain rates, whereas the uniform elongation (UE) and total elongation (TE) at the low strain rates were much larger compared with the values at high strain rate ranges. Song et al. [13] studied the deformation behavior of the DP1000 steel by the JC and Zerilli–Armstrong (ZA) model, and found that the ZA model can reflect the deformation behavior more accurately at strain rates from 10−4 to 2000 s−1. Cadoni et al. [14] compared the dynamic mechanical behavior of the DP1200 and DP1400 steel, and observed that the two steels had good potential to absorb energy, and the DP1400 possessed a lower strain rate sensitivity. Wang et al. [15] investigated the high strain rate behavior of some DP steels and a martensitic (MS) steel. They found that the strain rate sensitivity of the UTS decreased with increasing martensite volume fractions, yet the fracture elongation (FE) demonstrated a reverse trend. Dong et al. [10] investigated the change of strength and ductility with increasing strain rate of DP600 steel and its welded joint. They found that the YS and UTS increase with the increase of strain rate, but the UE and TE present a fluctuation tendency. Singh et al. [7] researched the dynamic tensile behavior of MP800HY steel, they found the YS, UTS, UE and TE increased with increasing strain rate. Since most studies only focus on the change of the mechanical properties under various strain rates for one specific alloy composition and microstructure (i.e., phase fraction), such inconsistencies from the literature are most likely derived from the different alloy composition and microstructure selected in the literature [8,9,10]. Therefore, it is necessary to carry out systematic studies on the influence of the microstructure with respect to different phase fractions on the dynamic deformation behavior of FMDP steels.
In the present work, two types of ferrite–martensite dual-phase steels with different phase fractions were selected and subjected to tensile testing at different strain rates from 0.001–1000 s−1. The effects of the phase fraction on the dynamic mechanical properties and energy absorption, the strain hardening behavior associated with dislocation motion, fracture mechanism, the adiabatic heating and fracture behavior were addressed in detail.
2. Experiments
2.1. Materials
Two commercial non-galvanized ferrite–martensite dual-phase (FMDP) steel sheets (FMDP660 and FMDP780) were selected; the chemical composition of the two steels is listed in Table 1. The thickness of the two tested steels is ~1.2 mm.
2.2. Tensile Testing
Tensile tests at low strain rates were conducted on a material testing machine (CMT5105, SANS Testing Machine Co., Shenzhen, China), with a constant crosshead speed of 0.00002, 0.0002 and 0.002 m/s, corresponding to a nominal strain rate of 0.001, 0.01 and 0.1 s−1. Dynamic tensile tests with an average strain rate of the order of 1, 10, 100 and 1000 s−1 were carried out on a servo-hydraulic high-speed tensile testing machine (Zwick HTM16020, Zwick Roell, Ulm, Germany). The strain rate was determined by (v: the set speed; Lc: the length of the parallel part, Lc = 20 mm). In the low strain rate stage, we used an extensometer to measure the strain, while the strain gauge (HBM K-LY4, Hottinger Baldwin Measurement Co., Ltd, Suzhou, China) and the laser measurement were applied on measuring strain under high strain rate stage. Tensile specimens were directly machined from the steel sheets along the rolling direction. The dimension of the specimens tested at low and high strain rates is shown in Figure 1a,b, respectively. In order to avoid the size effect of the tensile specimen on the experimental results, the dimension of the gage part was maintained the same for all the samples. Three specimens were repeated for each set of conditions. Yield strength was determined according to the 0.2% offset strength, and the uniform elongation was obtained from the intersection point of the true stress-strain curve and the strain hardening rate curve (). It can be seen that the strain rate has no significant change under the dynamic tensile test (1–1000 s−1) (Figure 2), which can be considered as a constant value during the high strain rate stage. It is important to note that the strain rate sensitivity (m) is usually defined as [6]; however, in this paper we used the strain rate sensitivity term to describe the extent of the mechanical property variation with different strain rates. The microhardness measurements were carried out using a THV-1MD digital micro Vickers hardness tester (TEST-TECH Co., Ltd., Shanghai, China) with 50 g load and 10 s dwell time.
2.3. Microstructural Characterization
The microstructure and the fracture surface were characterized using a field emission scanning electron microscopy (SEM, FEI Quanta 450, FEI, Hillsboro, OR, USA). A transmission electron microscopy (TEM, JEM2100, Japan Electronics Co., Ltd., Tokyo, Japan) was used to study the micromechanical details pertaining to dislocation motions in the deformed specimens. The samples for SEM were polished and etched using 4% nital (4% nitric acid and 96% alcohol), and TEM specimens were mechanically ground to a thickness of about 0.06 mm and subsequently electro-polished in a twin-jet polishing machine in a solution of 5% perchloric acid and 95% alcohol at about −20 °C. The ferrite and martensite volume fractions were measured based on the ASTM E1245-03 standard using the image processing software ImageJ. Grain size was determined by the standard linear intercept method based on the SEM images.
3. Results and Discussion
3.1. Microstructure and Quasi-Static Mechanical Properties
Figure 3 shows the SEM micrographs of the FMDP660 and FMDP780 steel. For both steels, it is obvious that white martensite islands are imbedded in dark ferrite matrix and mainly distributed on the ferrite grain boundaries; the volume fraction of martensite is around 20% and 35% for the FMDP660 and FMDP780 steel, respectively. The grain size of the two steels is similar, which was determined to be 7.5 µm and 7.3 µm, respectively.
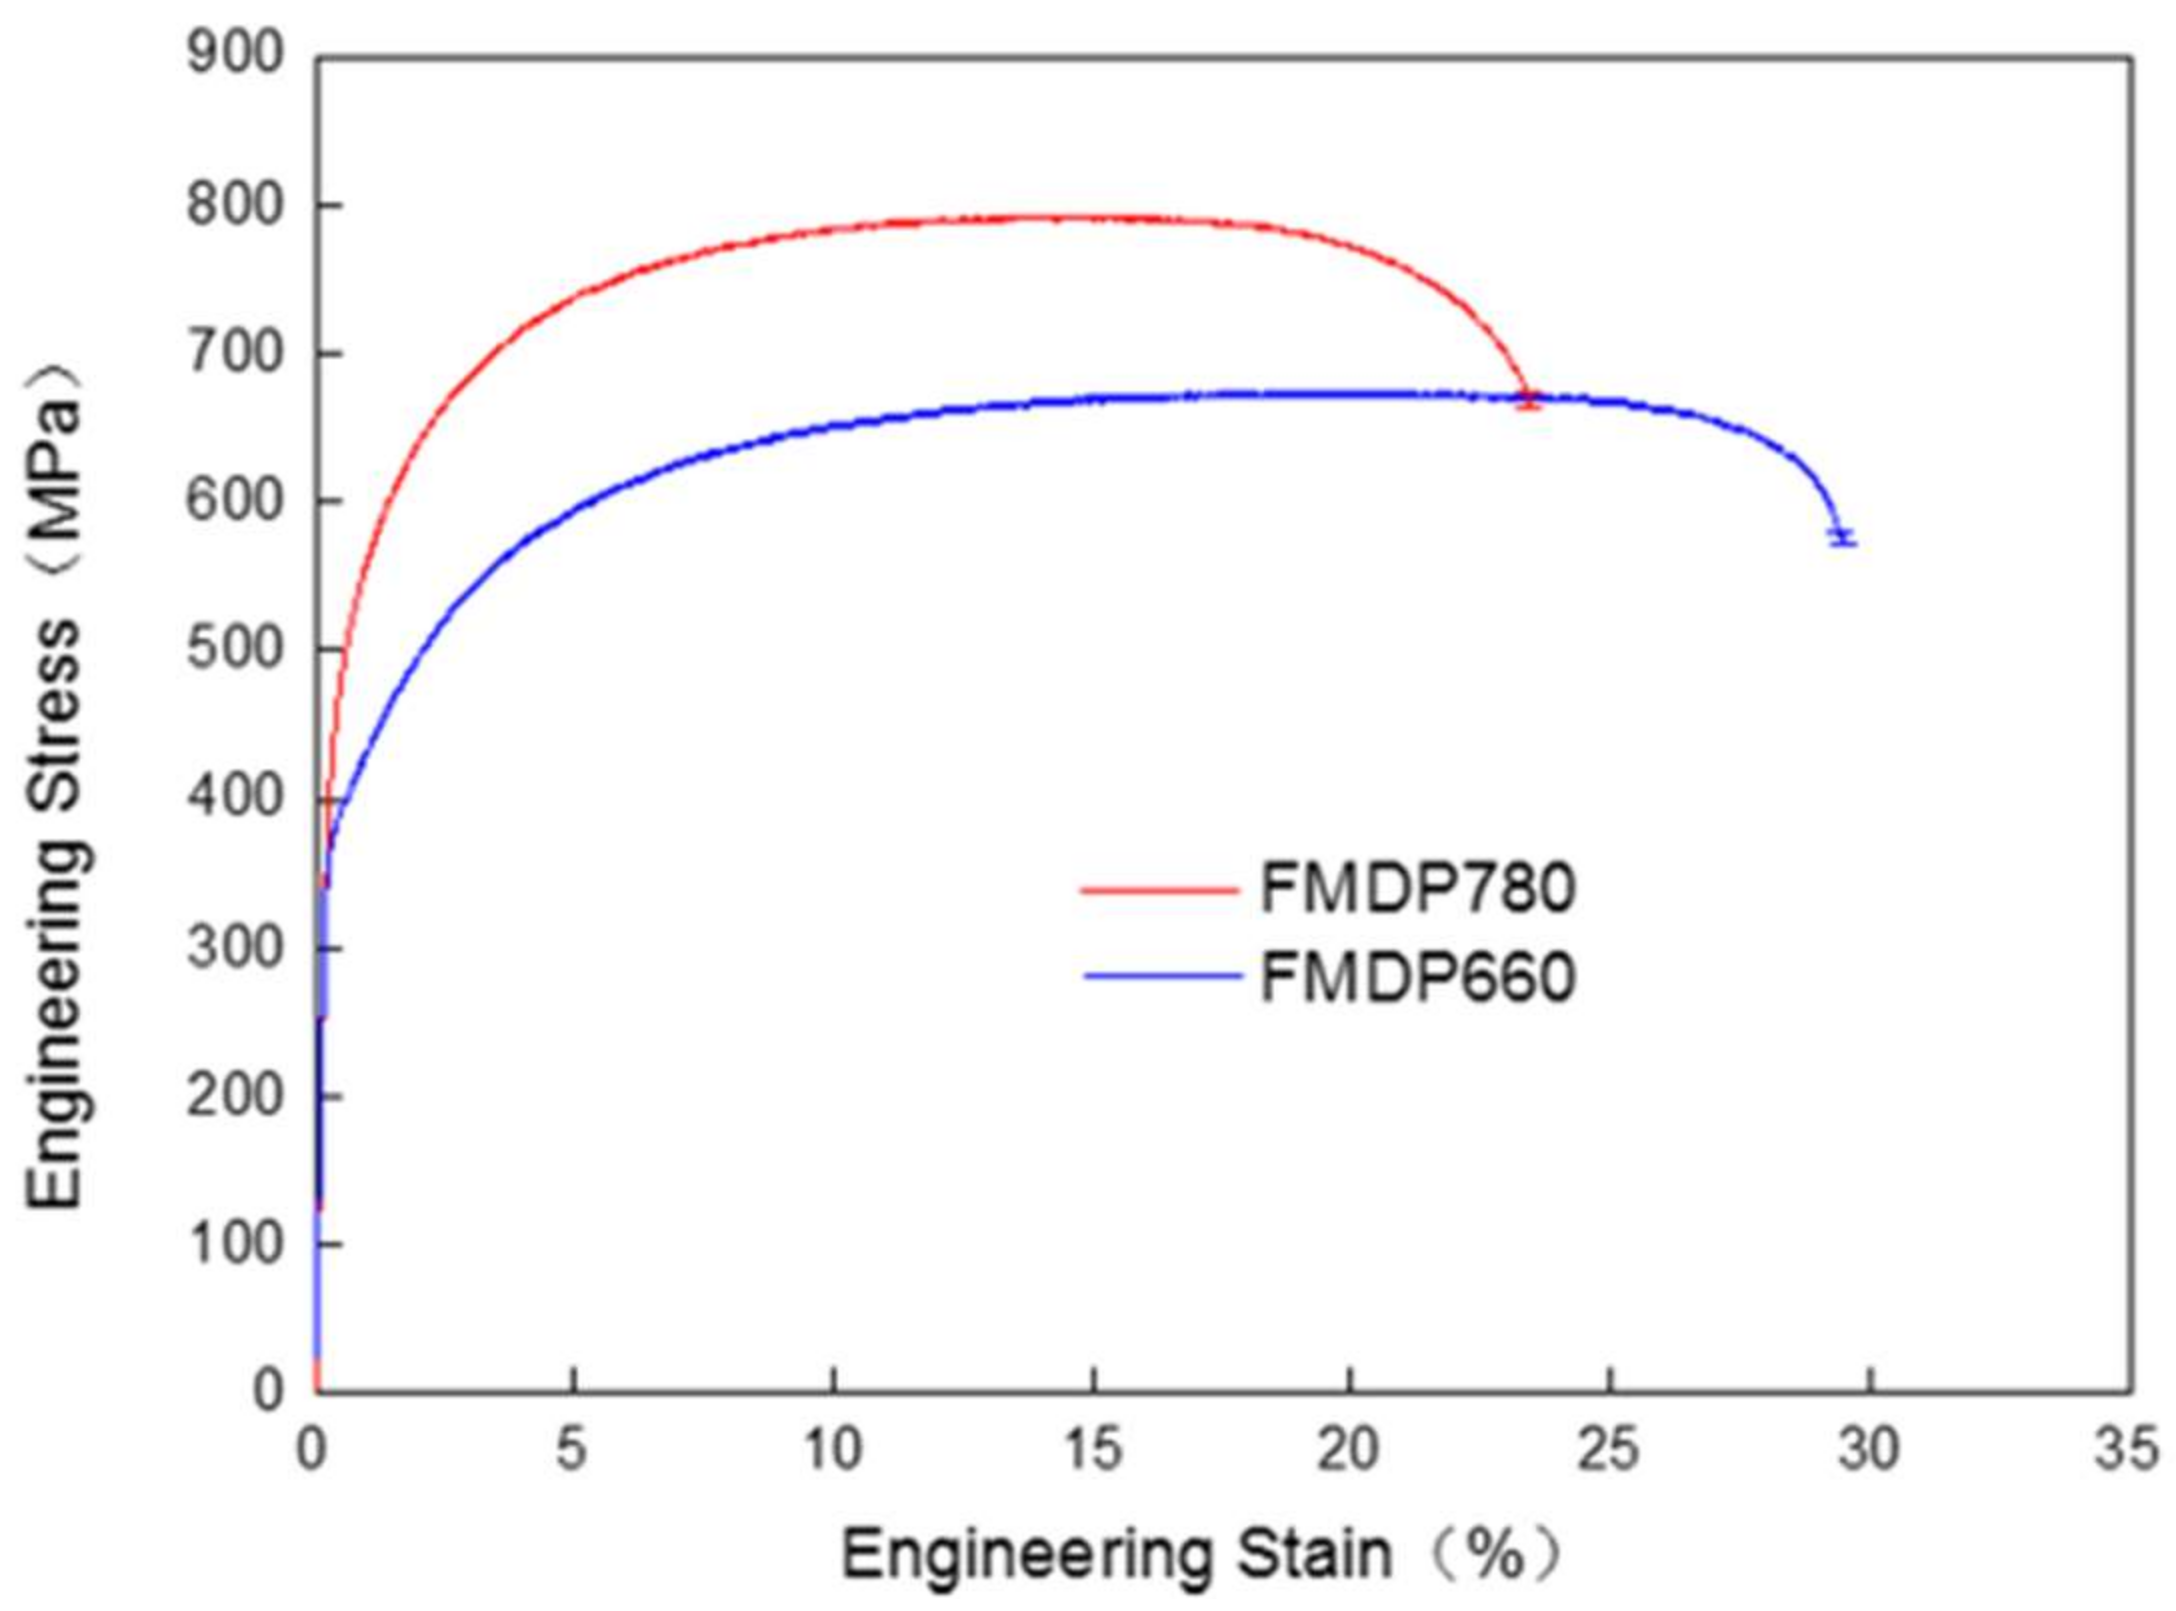
The quasi-static engineering stress-stain curve (0.001 s−1) of the two steels is present in Figure 4, with the strength/hardness and elongation values listed in Table 2. It is shown that both steels yield without an obvious yielding platform, namely, the two steels undergo continuous yielding, which is usually associated with the existing high mobile dislocation density in the microstructure [16,17,18]. The higher volume fraction of martensite in the FMDP780 steel leads to a higher hardness and strength and a lower elongation.
3.2. Mechanical Properties at Different Strain Rates
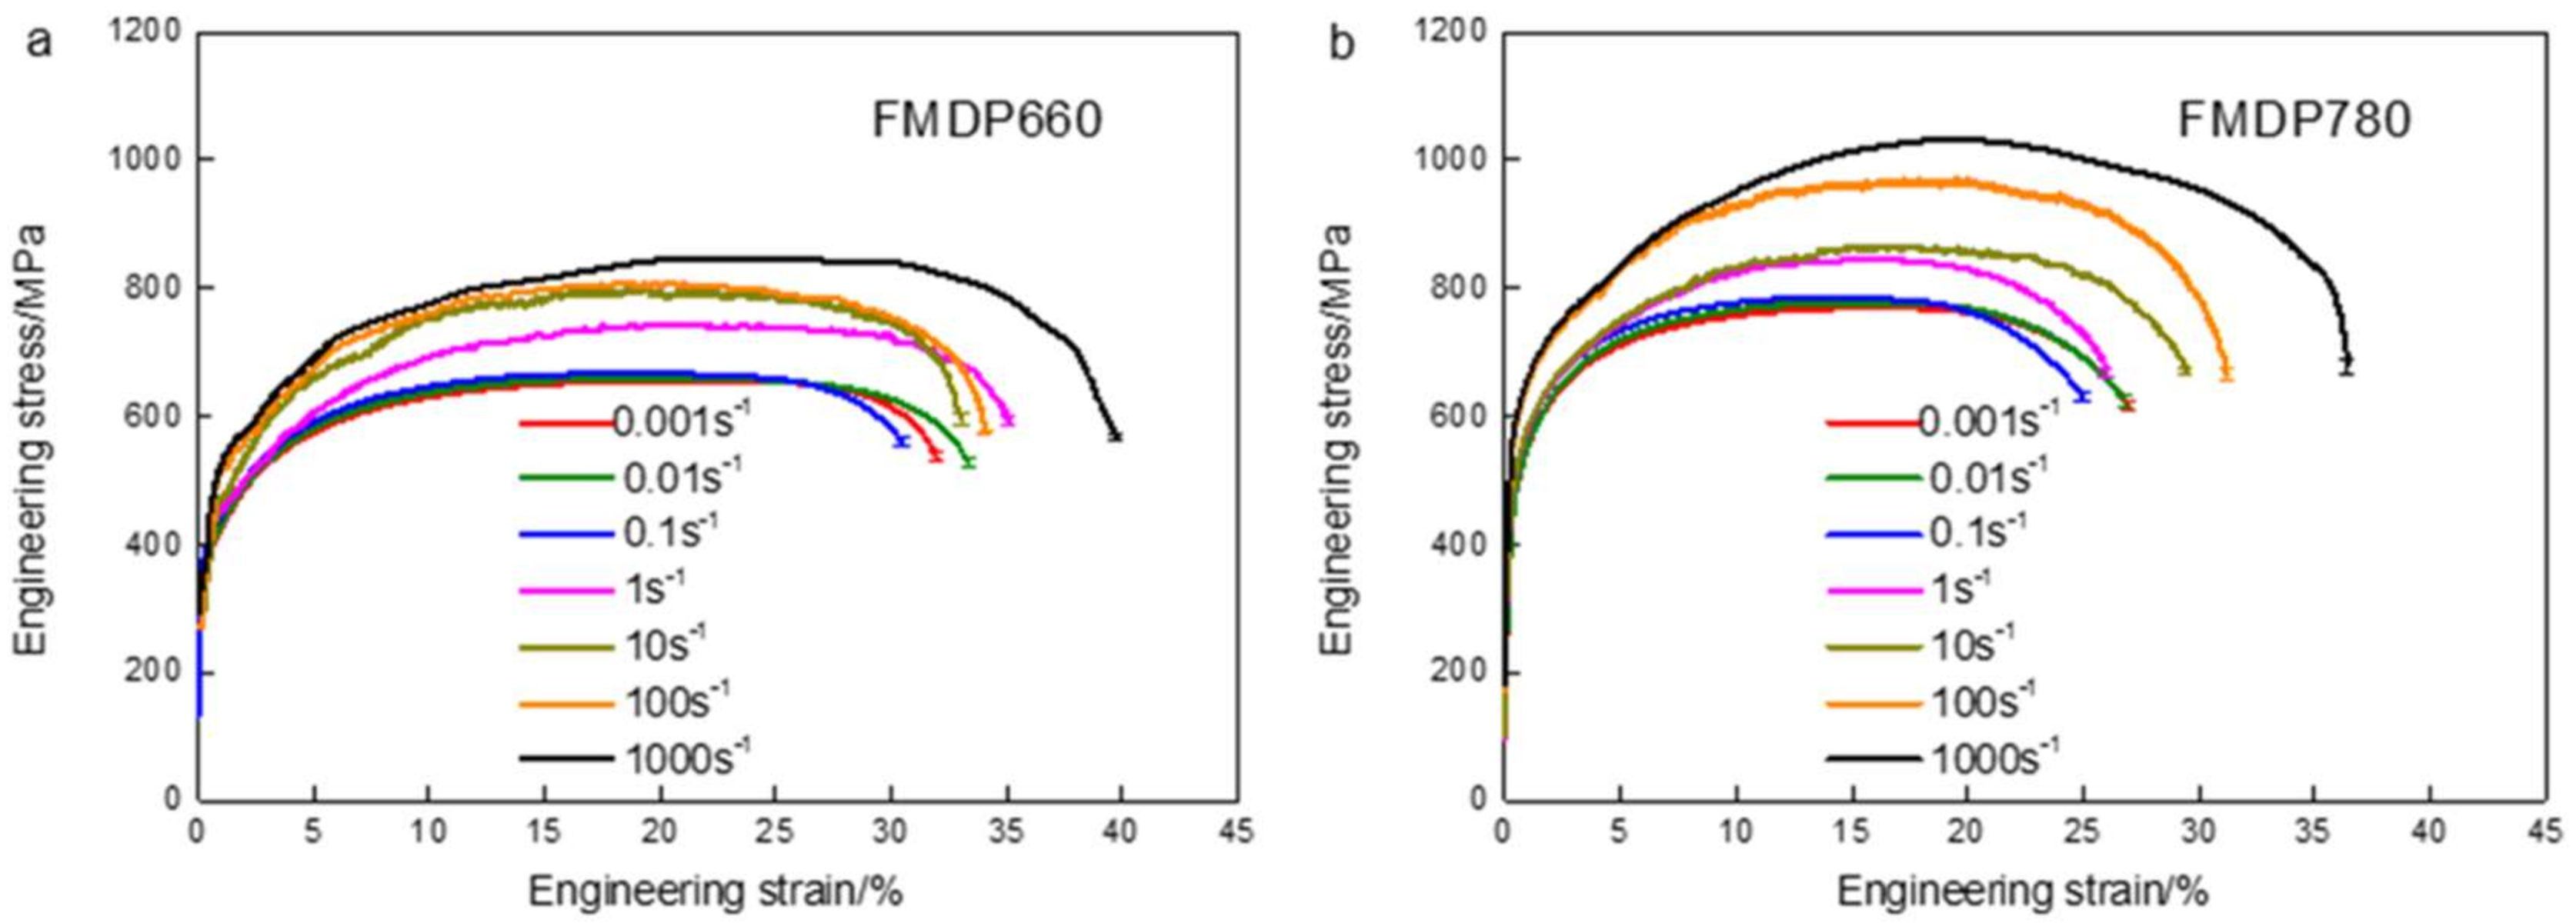
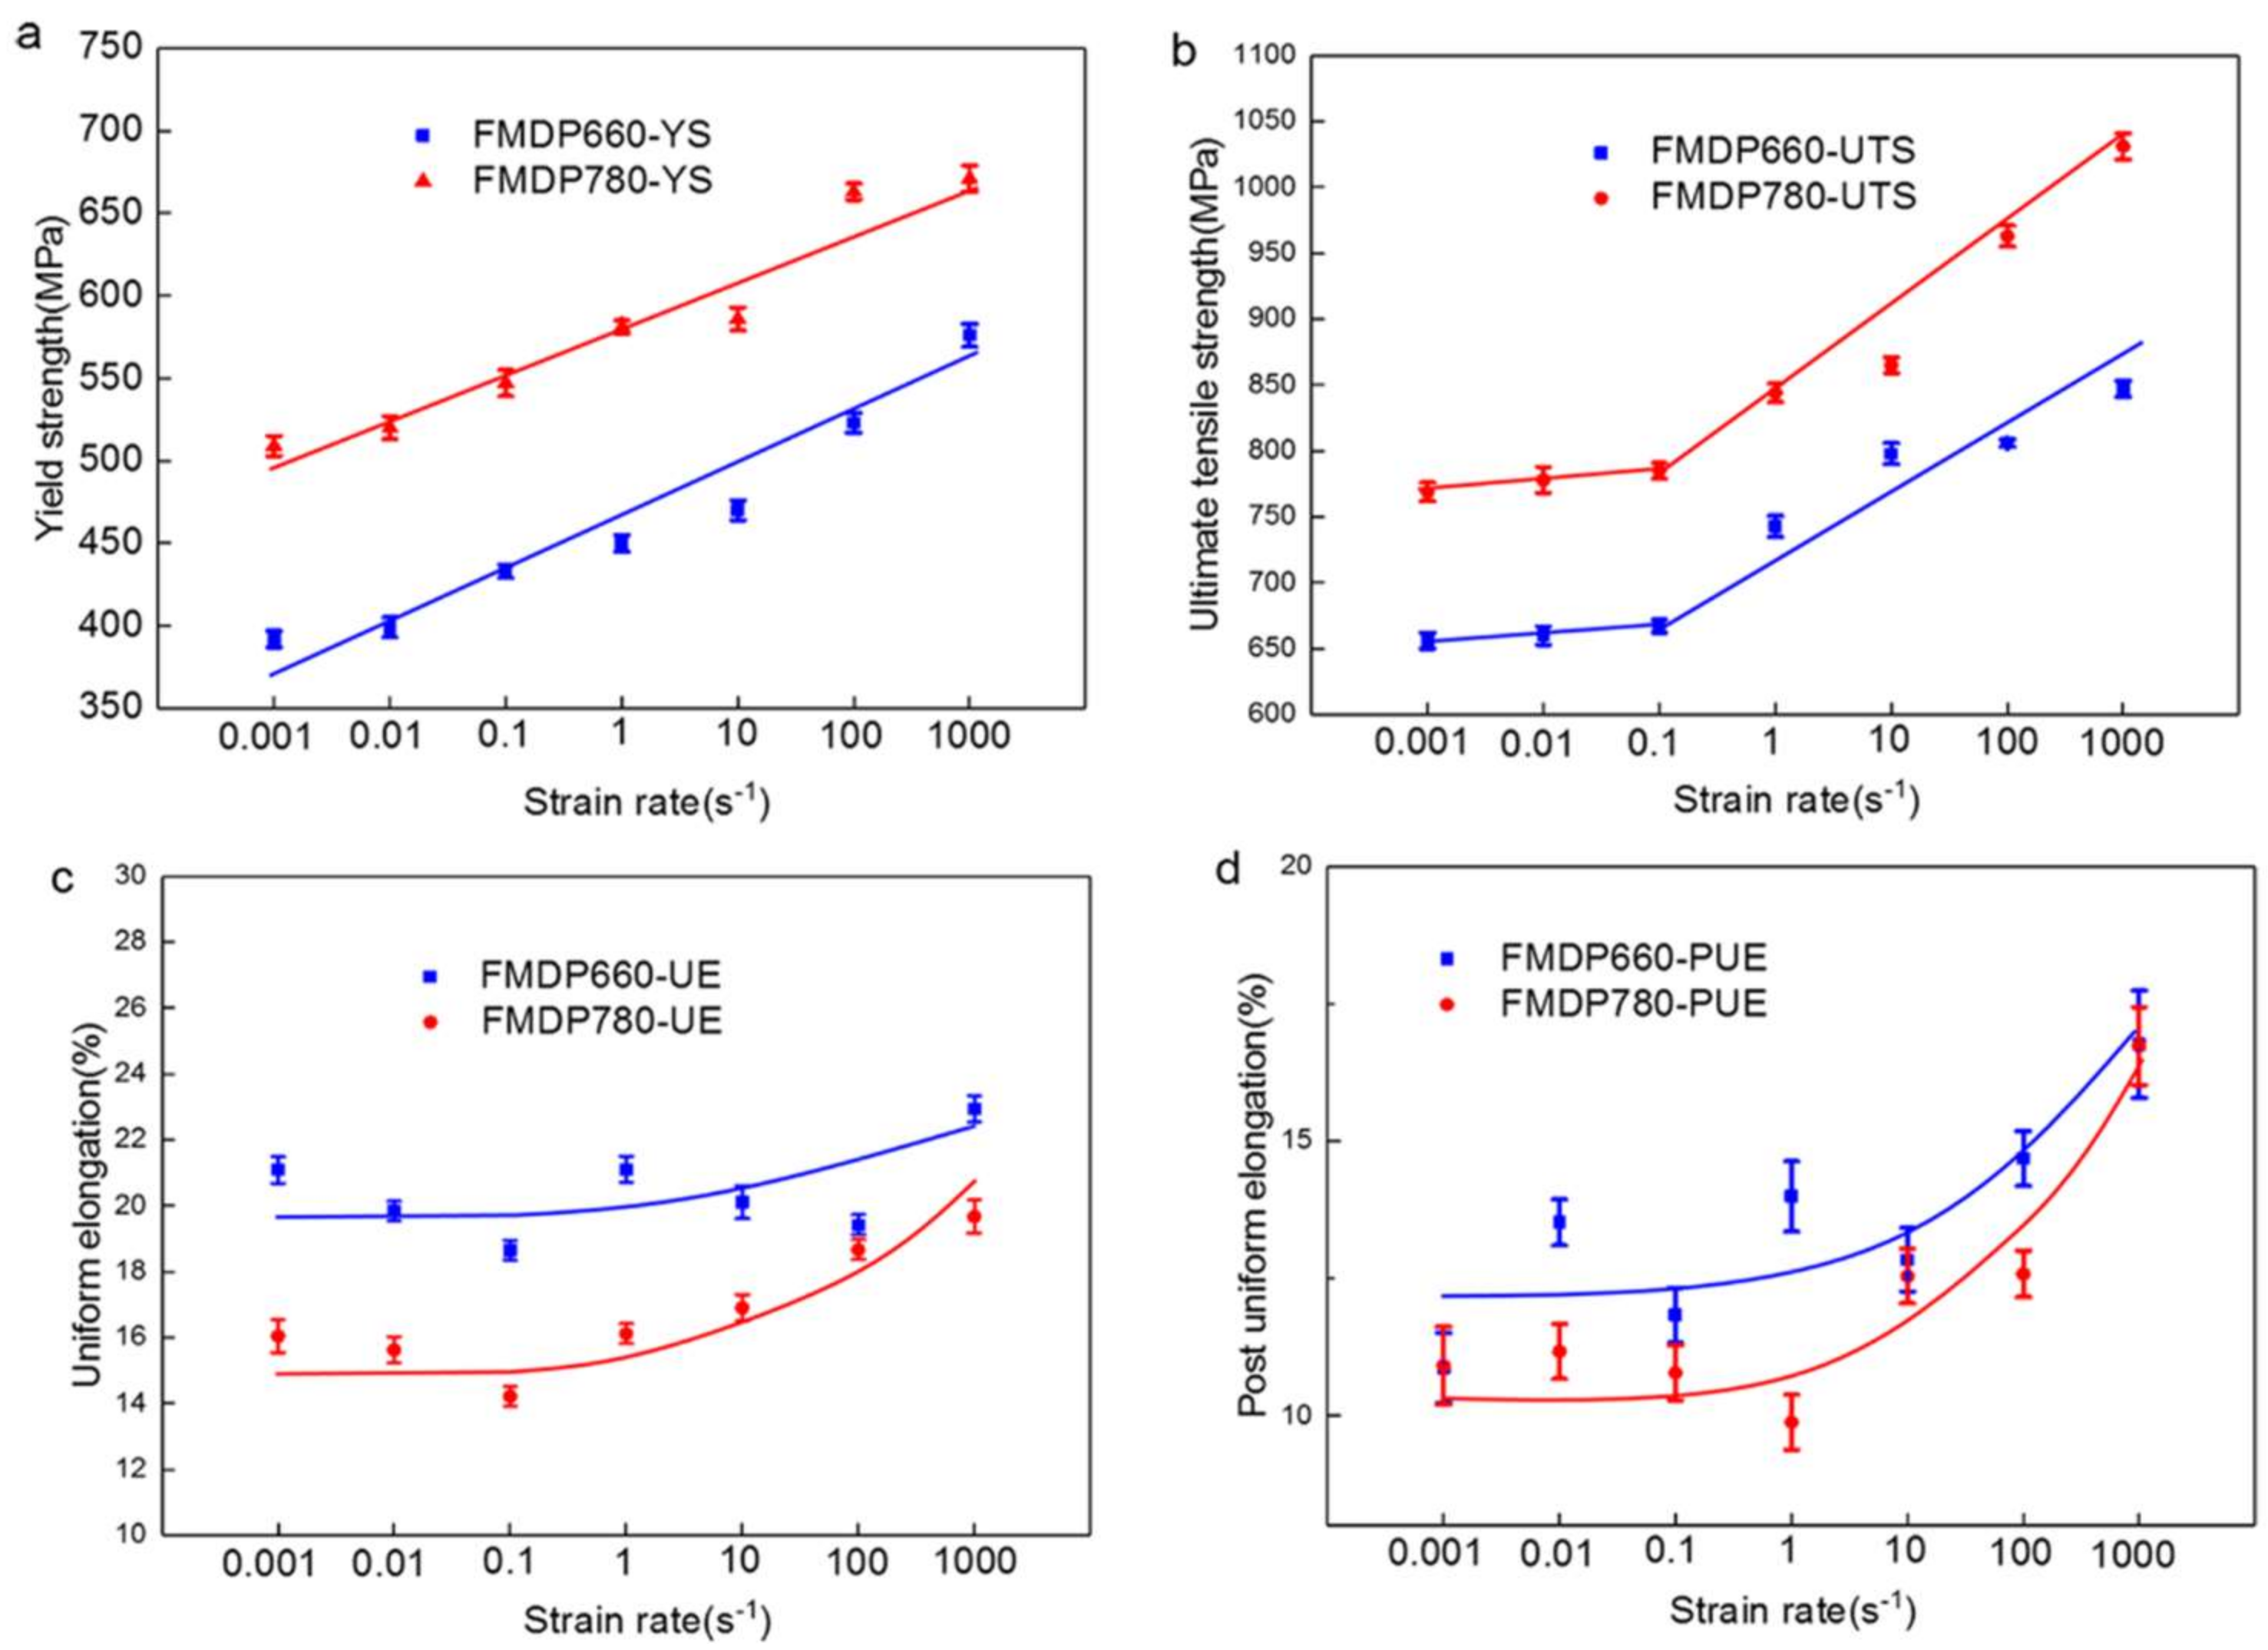
Figure 5 shows the engineering stress–strain curve of the two steels at strain rates ranging from 0.001 to 1000 s−1. Figure 6 plots the strain rate dependent tensile properties including YS, UTS, UE and PUE, with the values listed in Table 3. For all the investigated strain rates, the higher martensite fractioned sample, FMDP 780, possesses higher strength (YS and UTS) and lower elongation (UE and PUE) values compared with FMDP660. The effect of strain rate on the YS and UTS is similar for the two steels. Both steels show a monotonically increasing YS with higher strain rates, as demonstrated in Figure 5 and Figure 6a. This is similar to the behavior of other AHSS, such as low Mn TRIP steels [19]. The UTS of the two steels, however, presents a slight increase at low strain rates (0.001–0.1 s−1), followed by a significant rise at the higher strain rate range (0.1–1000 s−1). Besides, we use the () to assessment the strain rate sensitivity, where m is the strain rate sensitivity parameter, σ is the engineering stress and is the strain rate. The UTS strain rate sensitivity parameter is 0.02087 and 0.02177 for the FMDP660 and FMDP780. Obviously, the FMDP780 has a higher strain rate sensitivity. The reduction of the cross-section (Z) also keeps stable in the low strain rate stage (0.001–0.1 s−1) and increases with higher strain rates during the high strain rate stage (1–1000 s−1).
Figure 6c,d describes the trend of UE and PUE as a function of the strain rate for the two steels. At the low strain rate stage (0.001–0.1 s−1), the values of UE and PUE of both steels are maintained relatively stable; they start to increase with higher strain rates when the strain rate achieves above 0.1 s−1. The UE and PUE increment is larger for the FMDP780 steel at the high strain rate stage, that is, the FMDP780 steel possesses a higher strain rate sensitivity of ductility compared with the FMDP660 steel.
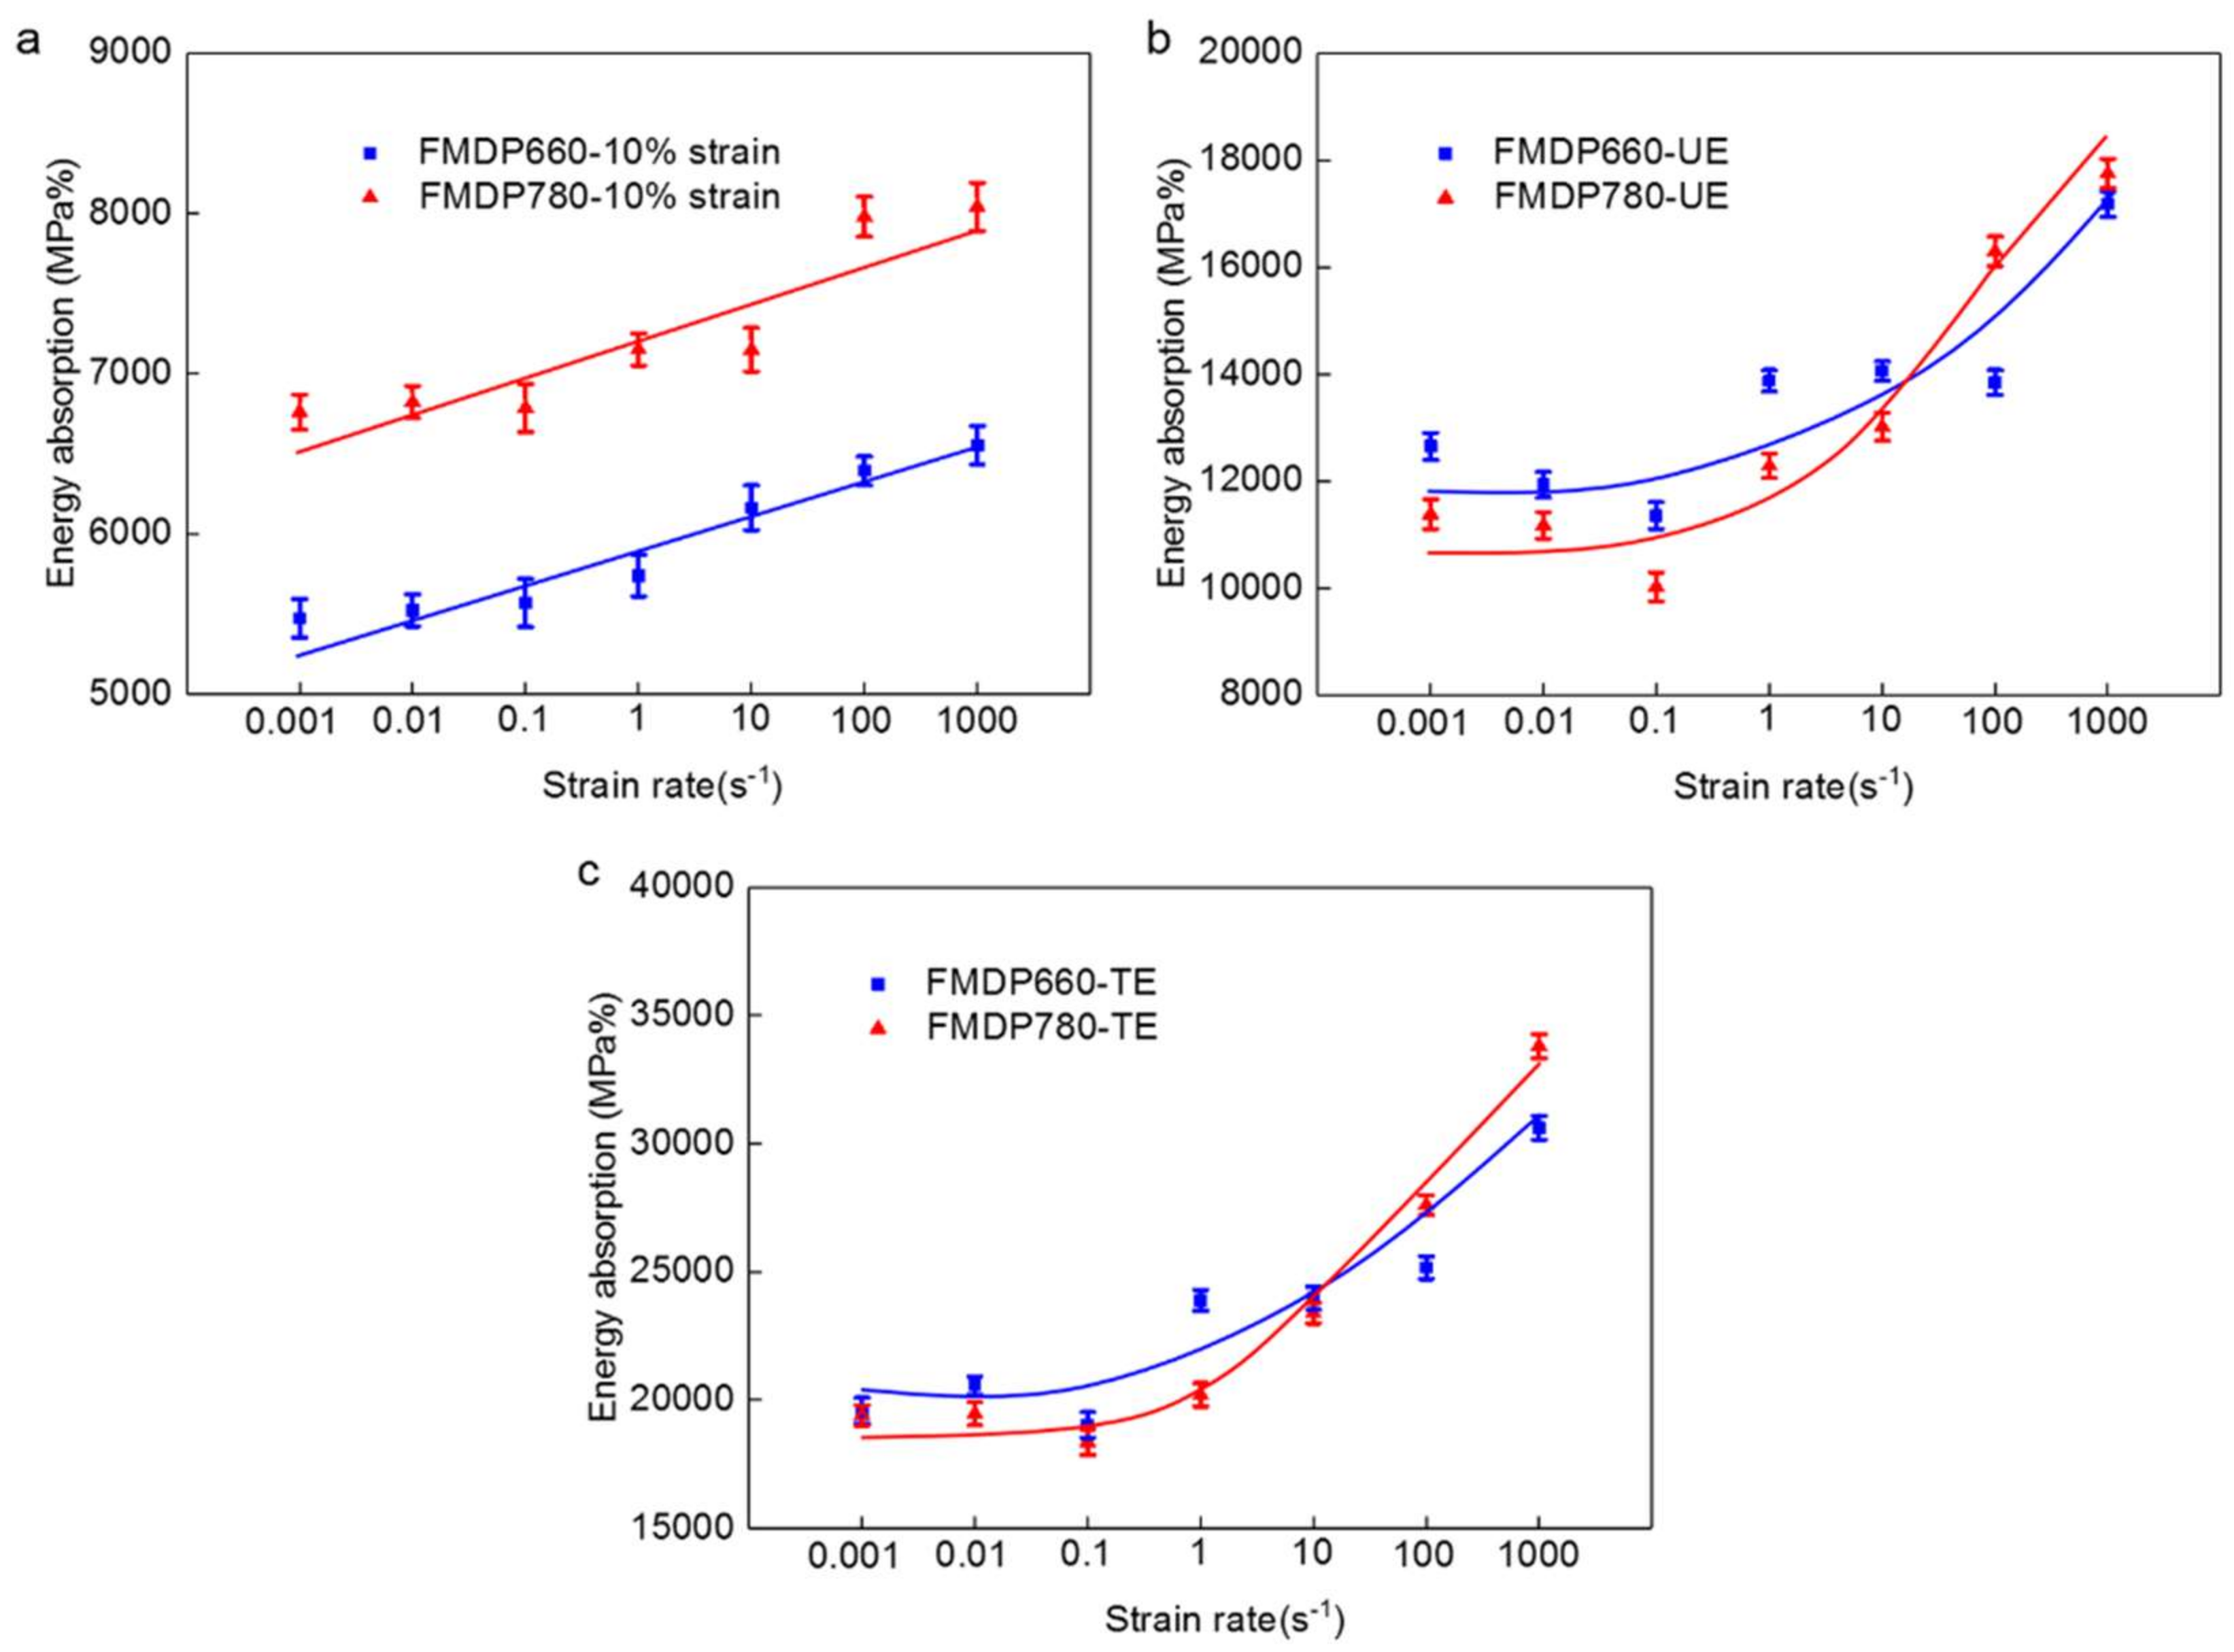
The energy absorption capacity of two steels was evaluated using the following equation [20]:
where is the absorbed energy during tensile testing, σ is the engineering stress and ε is the engineering strain. The calculated energy of the two steels at three strain levels is shown in Figure 7. At the strain of 10% (Figure 7a), the absorbed energy of both steels shows a monotonic increase with higher strain rates, and the FMDP780 steel possesses a much higher energy absorption than the FMDP780 steel over the whole strain rate range. This corresponds to the trend of the YS for the two steels. The behavior is different for the energy absorption determined at the strains corresponding to UE and TE (Figure 7b,c), where the values keep relatively stable at low strain rates (0.001–0.1 s−1) and increase sharply at the higher strain rate range (0.1–1000 s−1). At these two strain levels, the FMDP780 steel shows a lower energy absorption value at lower strain rates (up to 1 s−1) compared with the FMDP660 steel. However, the energy absorption of the FMDP780 steel demonstrates a higher increasing slope at the high strain rate stage, which makes it surpass the value of the FMDP660 steel when the strain rate reaches 100 s−1.
3.3. Strain Hardening Behavior
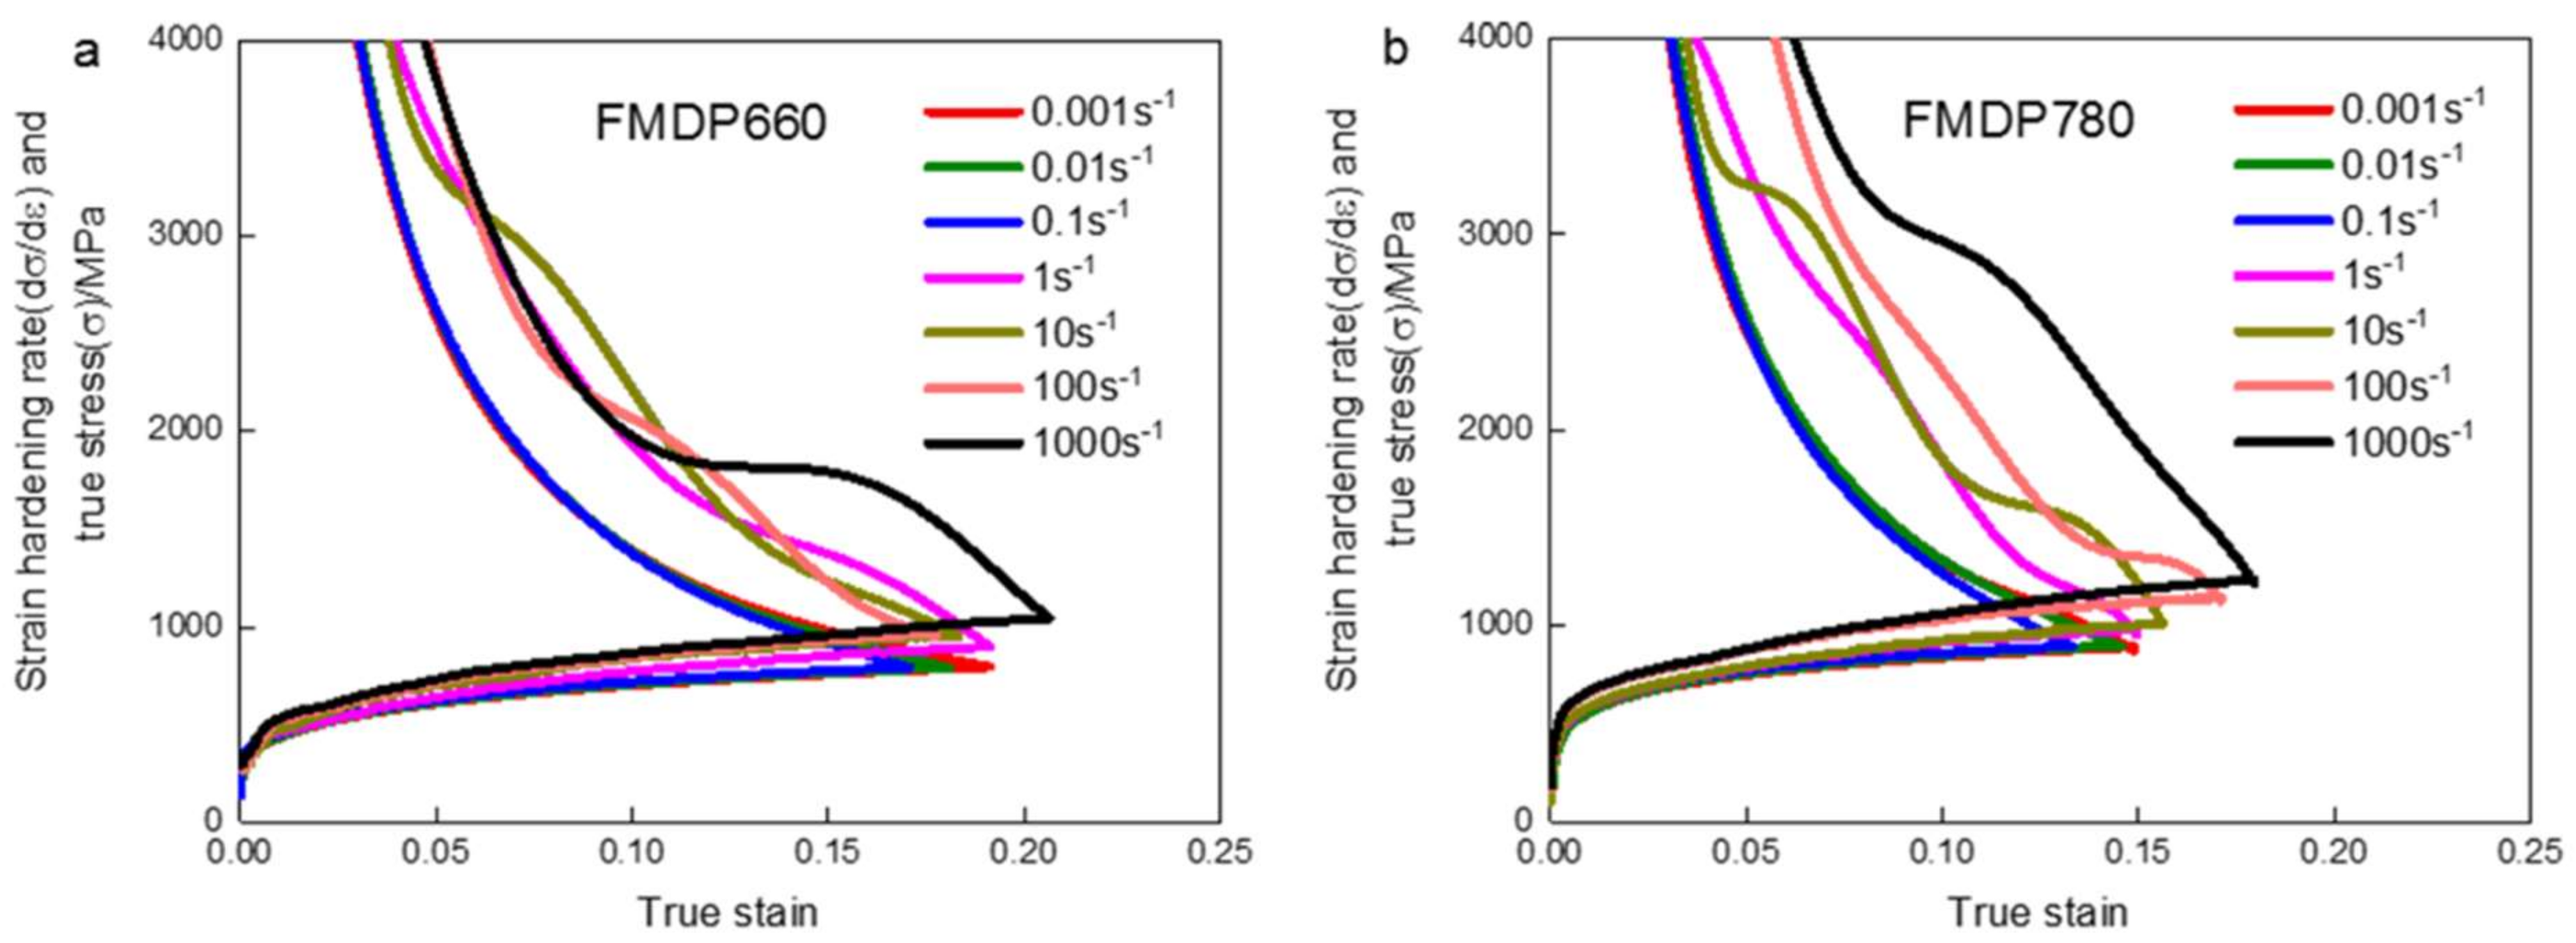
Figure 8 shows the strain hardening rate () along with the true stress–strain curves of the two steels at different strain rates. For all the strain rate levels, the strain hardening rate of the two steels show a one-stage decreasing trend until the occurrence of the plastic instability (i.e., necking). The work hardening rate of the two steels is not sensitive to the applied strain rate at low strain rate levels (0.001–0.1 s−1), but then it starts to increase with higher strain rates above 0.1 s−1. Such increase is more pronounced for the FMDP780 which contains a higher fraction of martensite. The different work hardening rate due to the variation of the strain rate and microstructure is the reason for the aforementioned behavior of UTS and UE.
In order to explain the change of the work hardening rate with applied strain rate, the adiabatic heating during the tensile testing should be firstly considered. For the low strain rate range, the adiabatic heating is normally ignored [10,14]. The adiabatic temperature rise () at the strain rate from 1 to 1000 s−1 was calculated as follows:
where ε is true strain, σ is true stress, η is the factor of the plastic work turning into thermal (taken as 1 [21]), ρ is the density of the FMDP steel (taken as 7.85 g/cm3 [22]), is the specific heat capacity at constant volume (0.48 J/(g·K) [21]). The calculated results of the two steels are shown in Figure 9. It is obvious that the adiabatic heating of the two steels during tensile testing increases with the increasing strain rates, and the change of adiabatic heating in FMFDP780 steel is more remarkable. It is well documented that higher temperature would promote dislocation recovery, thus resulting in a reduced work hardening rate. However, the calculated maximum adiabatic temperature rise is only around 50 °C for the two steels tested at the highest strain rate, i.e., 1000 s−1, which is unlikely to make a large influence on dislocation storage [23]. The increasing work hardening rate of both steels with higher strain rates and the higher strain rate sensitivity of the work hardening rate of the FMDP780 steel also validate this point.
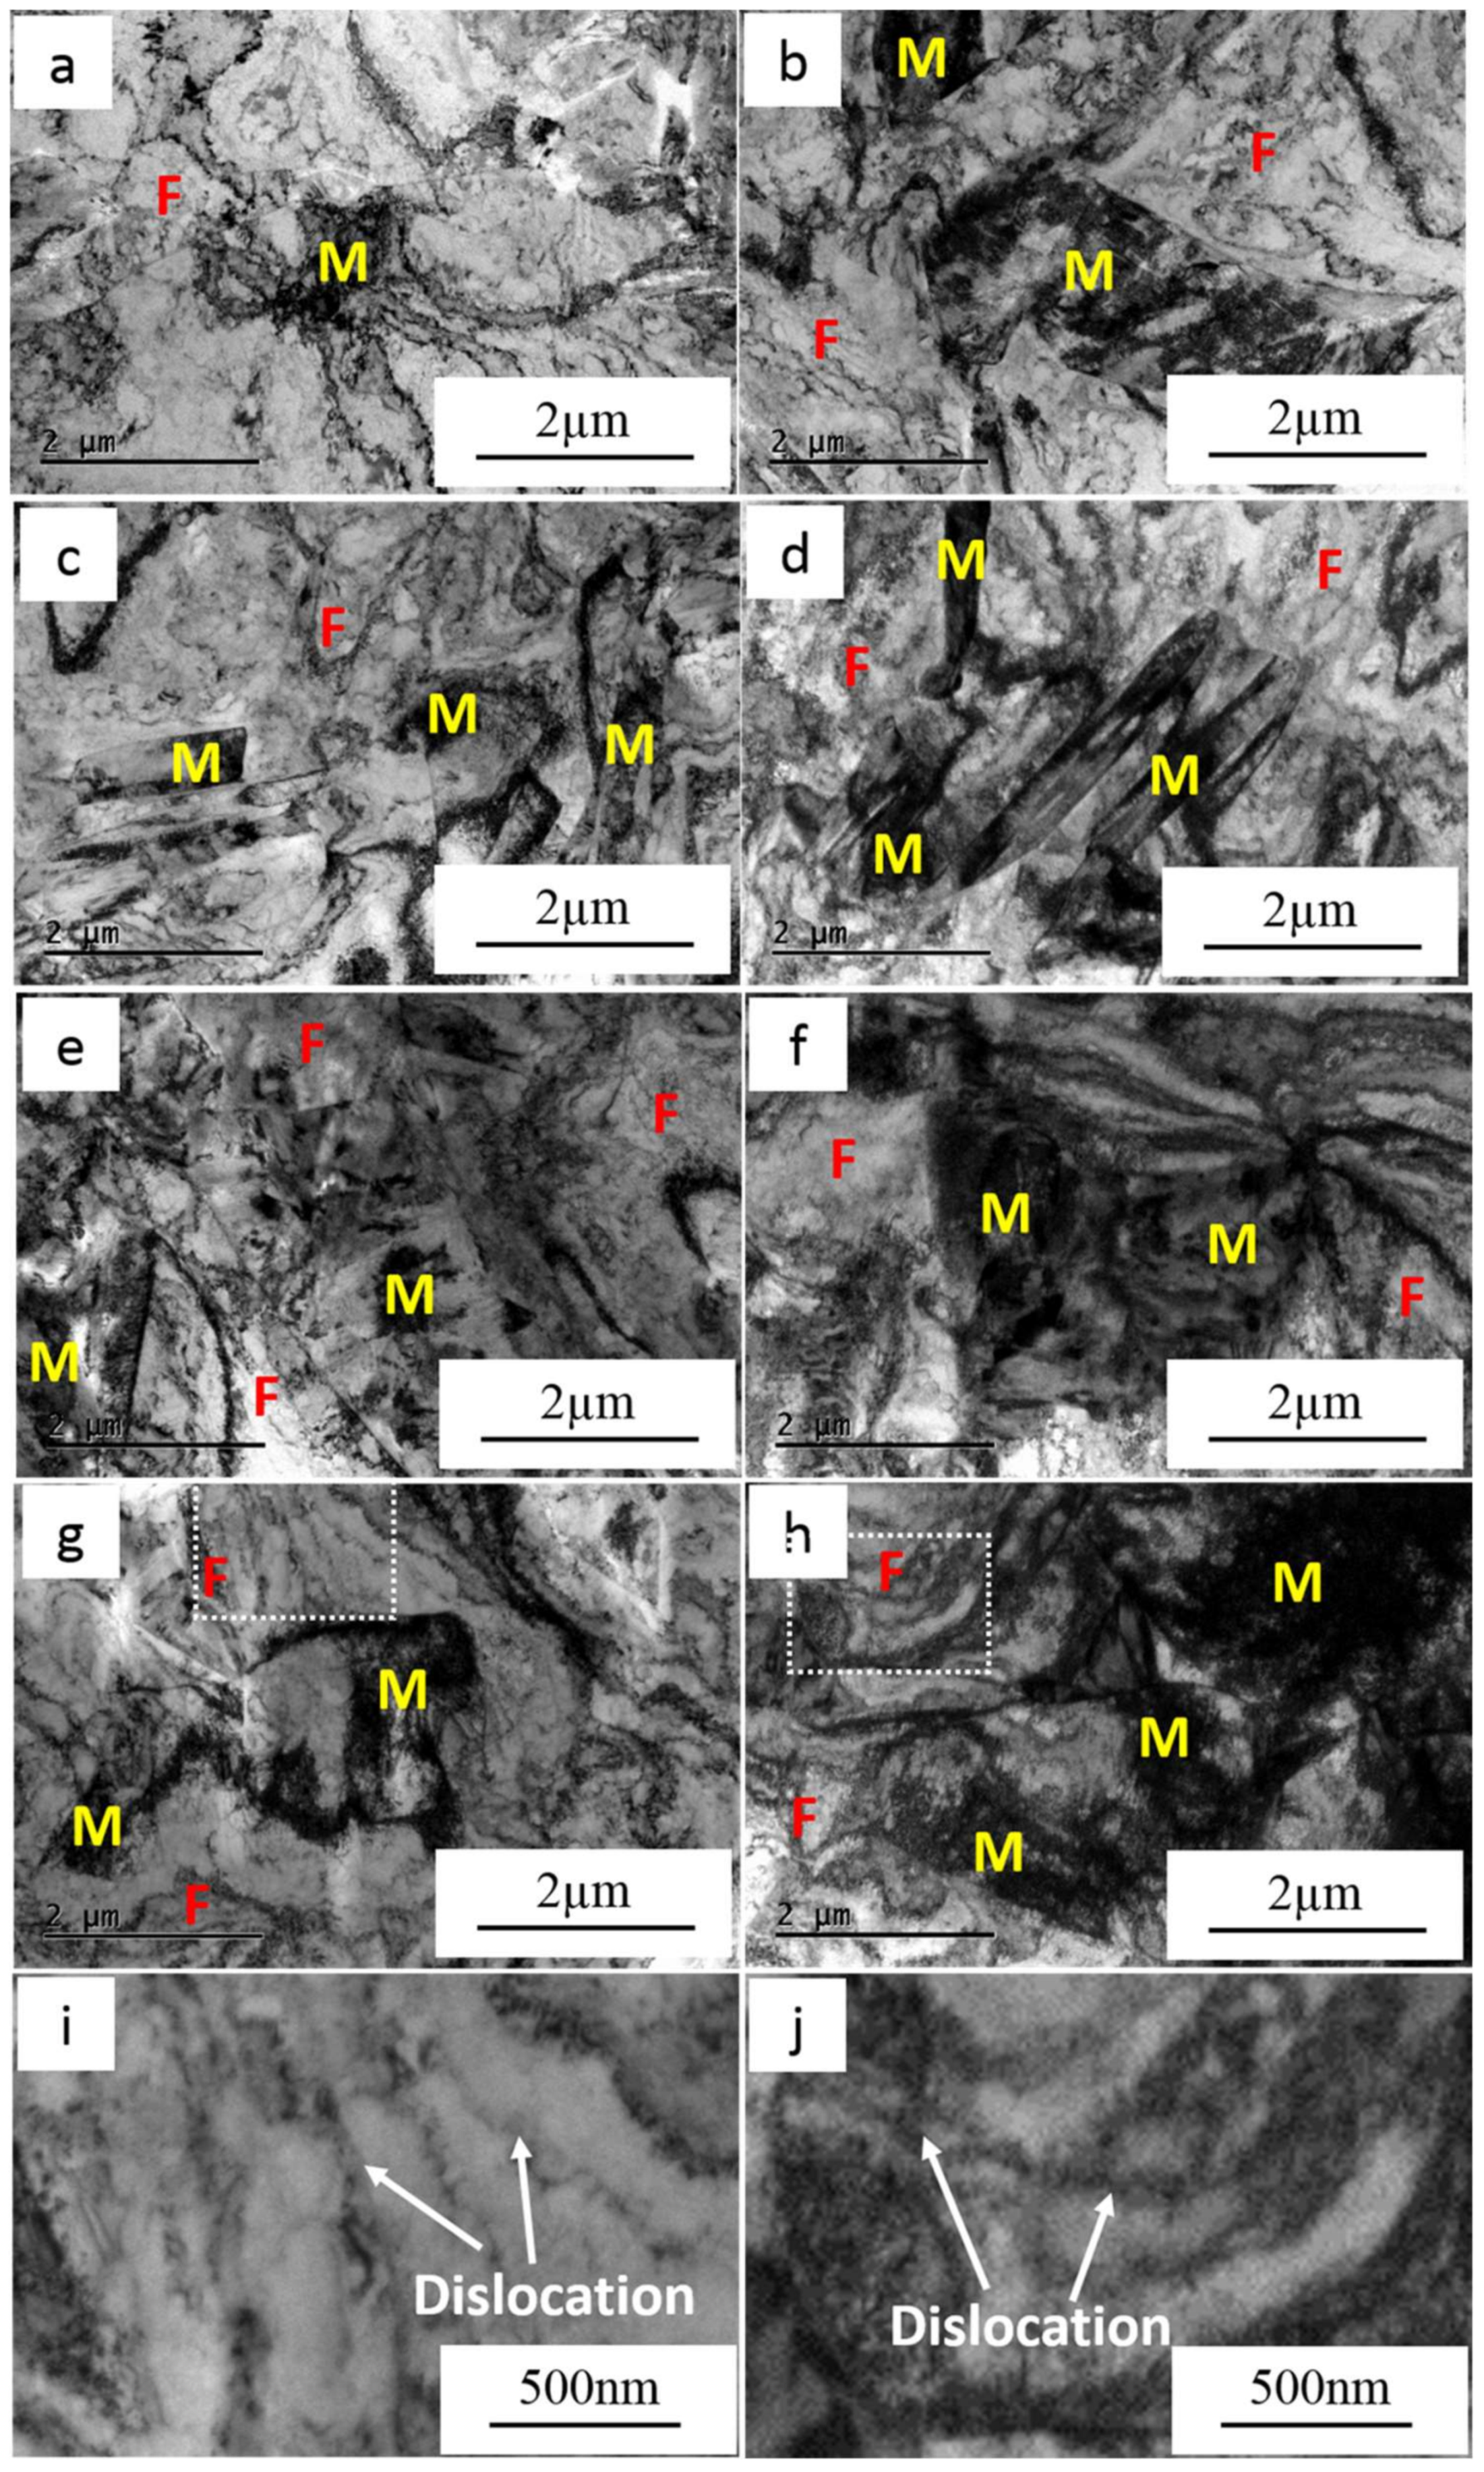
Figure 10 shows the dislocation configurations in the vicinity of the fracture surface of the two steels under various strain rates. It can be concluded that the dislocation density in ferrite of the two steels does not change significantly at low strain rates (0.001–0.1 s−1), as shown in Figure 10a–d. However, the dislocation density increases obviously in the high strain rate stage (1–1000 s−1) and multiple slip systems are also activated in some ferrite grains (Figure 10c,e,g and Figure 10d,f,h). Furthermore, at the high strain rate stage, the entwining degree of dislocation increases with higher strain rates [24,25]. This can explain why the work hardening rate of both steels at low strain rates is maintained unchanged and increases at high strain rates. In addition, it seems that the FMDP780 possesses a higher dislocation density compared to the FMDP660 at the same strain rate, which is likely to be the reason for the higher work hardening rate of the FMDP780 sample. The higher martensite fraction in the FMDP780 sample essentially results in a higher local strain in the ferrite phase during deformation [26], which leads to a larger amount of statistically stored dislocations (SSDs). The higher fraction of ferrite–martensite interfaces also gives rise to a higher number of geometrically necessary dislocation (GNDs).
3.4. Fracture Behavior
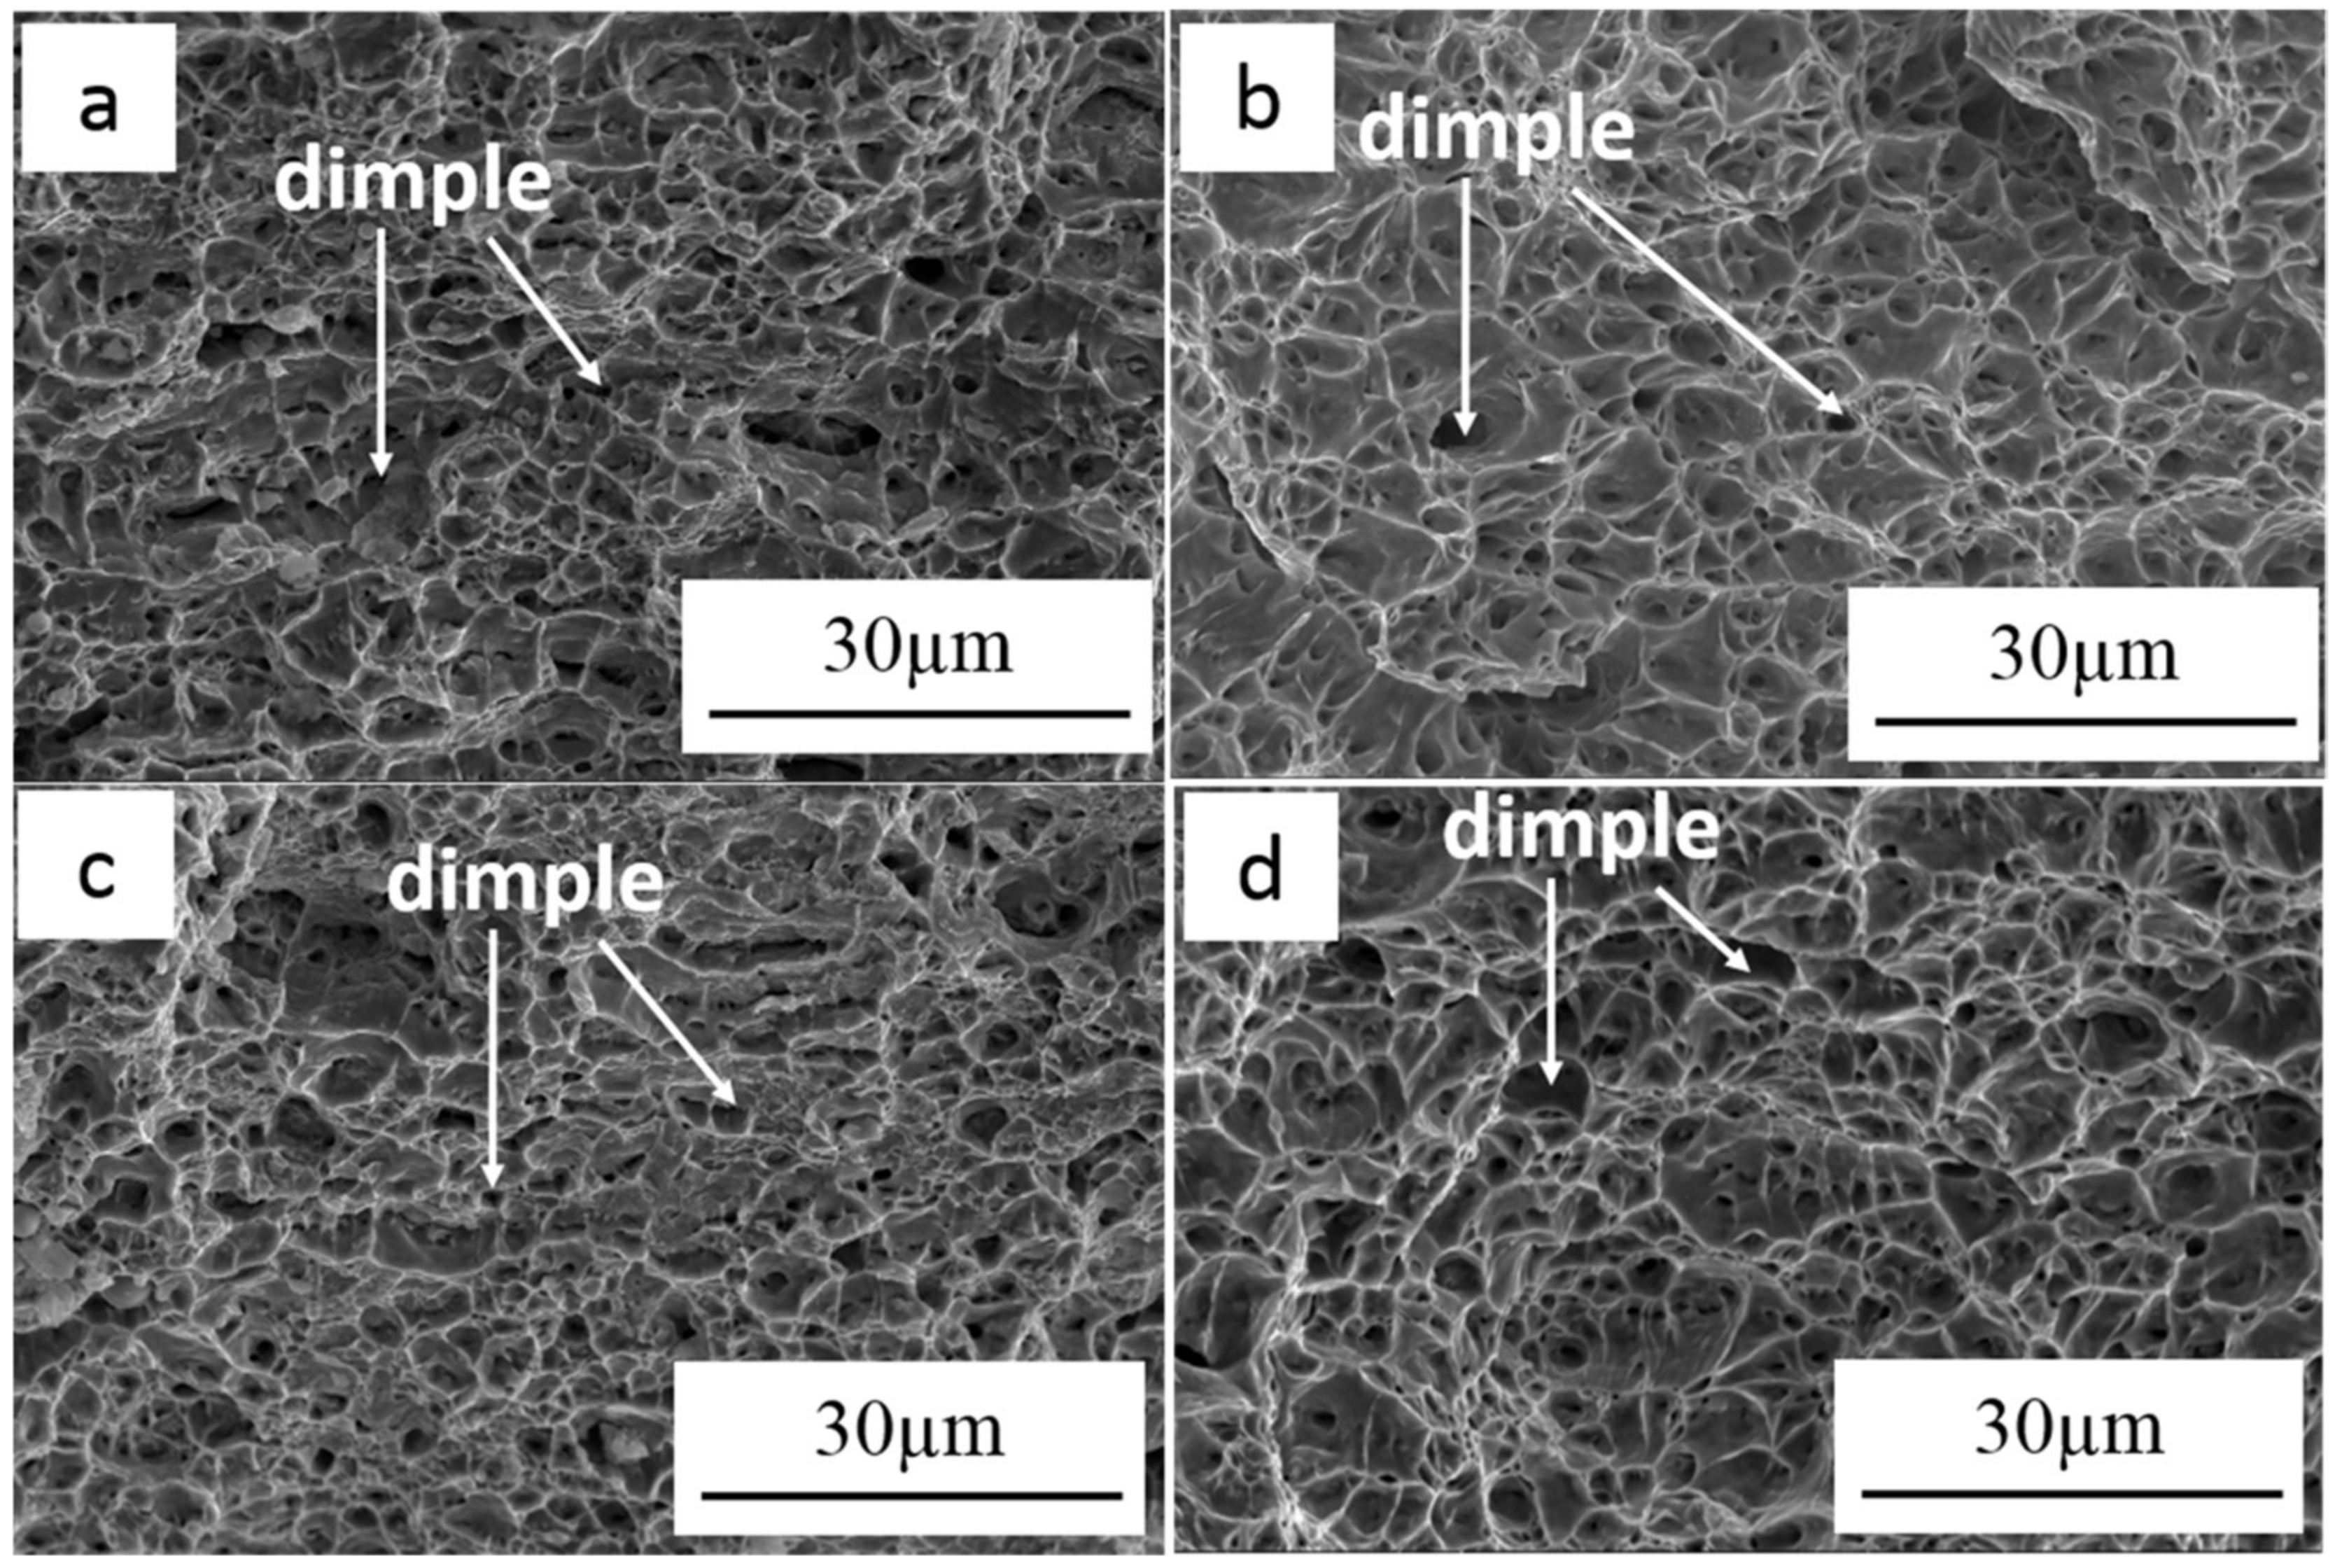
The fracture surface of the two steels is shown in Figure 11, which exhibits the typical micro-fractography of the fibrous zones at the strain rate of 0.001 and 1000 s−1, respectively. It should be noted that we have examined the samples tested at all the strain rates, here we only present the representative samples to explain the fracture mechanism. The fracture of the two steels is characterized by the well-defined dimple-typed fracture, regardless of the strain rate. However, it can be observed that the dimple becomes deeper and larger for the sample tested at higher strain rate, which corresponds to a higher PUE value as shown in Figure 6d. This might be due to the increased adiabatic temperature rise at high strain rates. The adiabatic heating can reduce the bonding strength among atoms, decompose the cell structure and decrease the energy of the grain boundary as well as the particles diffusion, which will result in softening [7,14,19,27,28]. At the low strain rate stage, the adiabatic temperature rise is negligible; as such the change of PUE is limited. For the high strain rate stage, the increasing adiabatic temperature rise with higher strain rates results in a higher PUE value. The more sharply increased PUE value of the FMDP780 sample compared to the FMDP660 steel can also be explained by the higher increment of the adiabatic temperature rise [28]. On the other hand, the increase of the local strain hardening with strain rate at the high strain rate stage might also lead to an increased PUE [2].
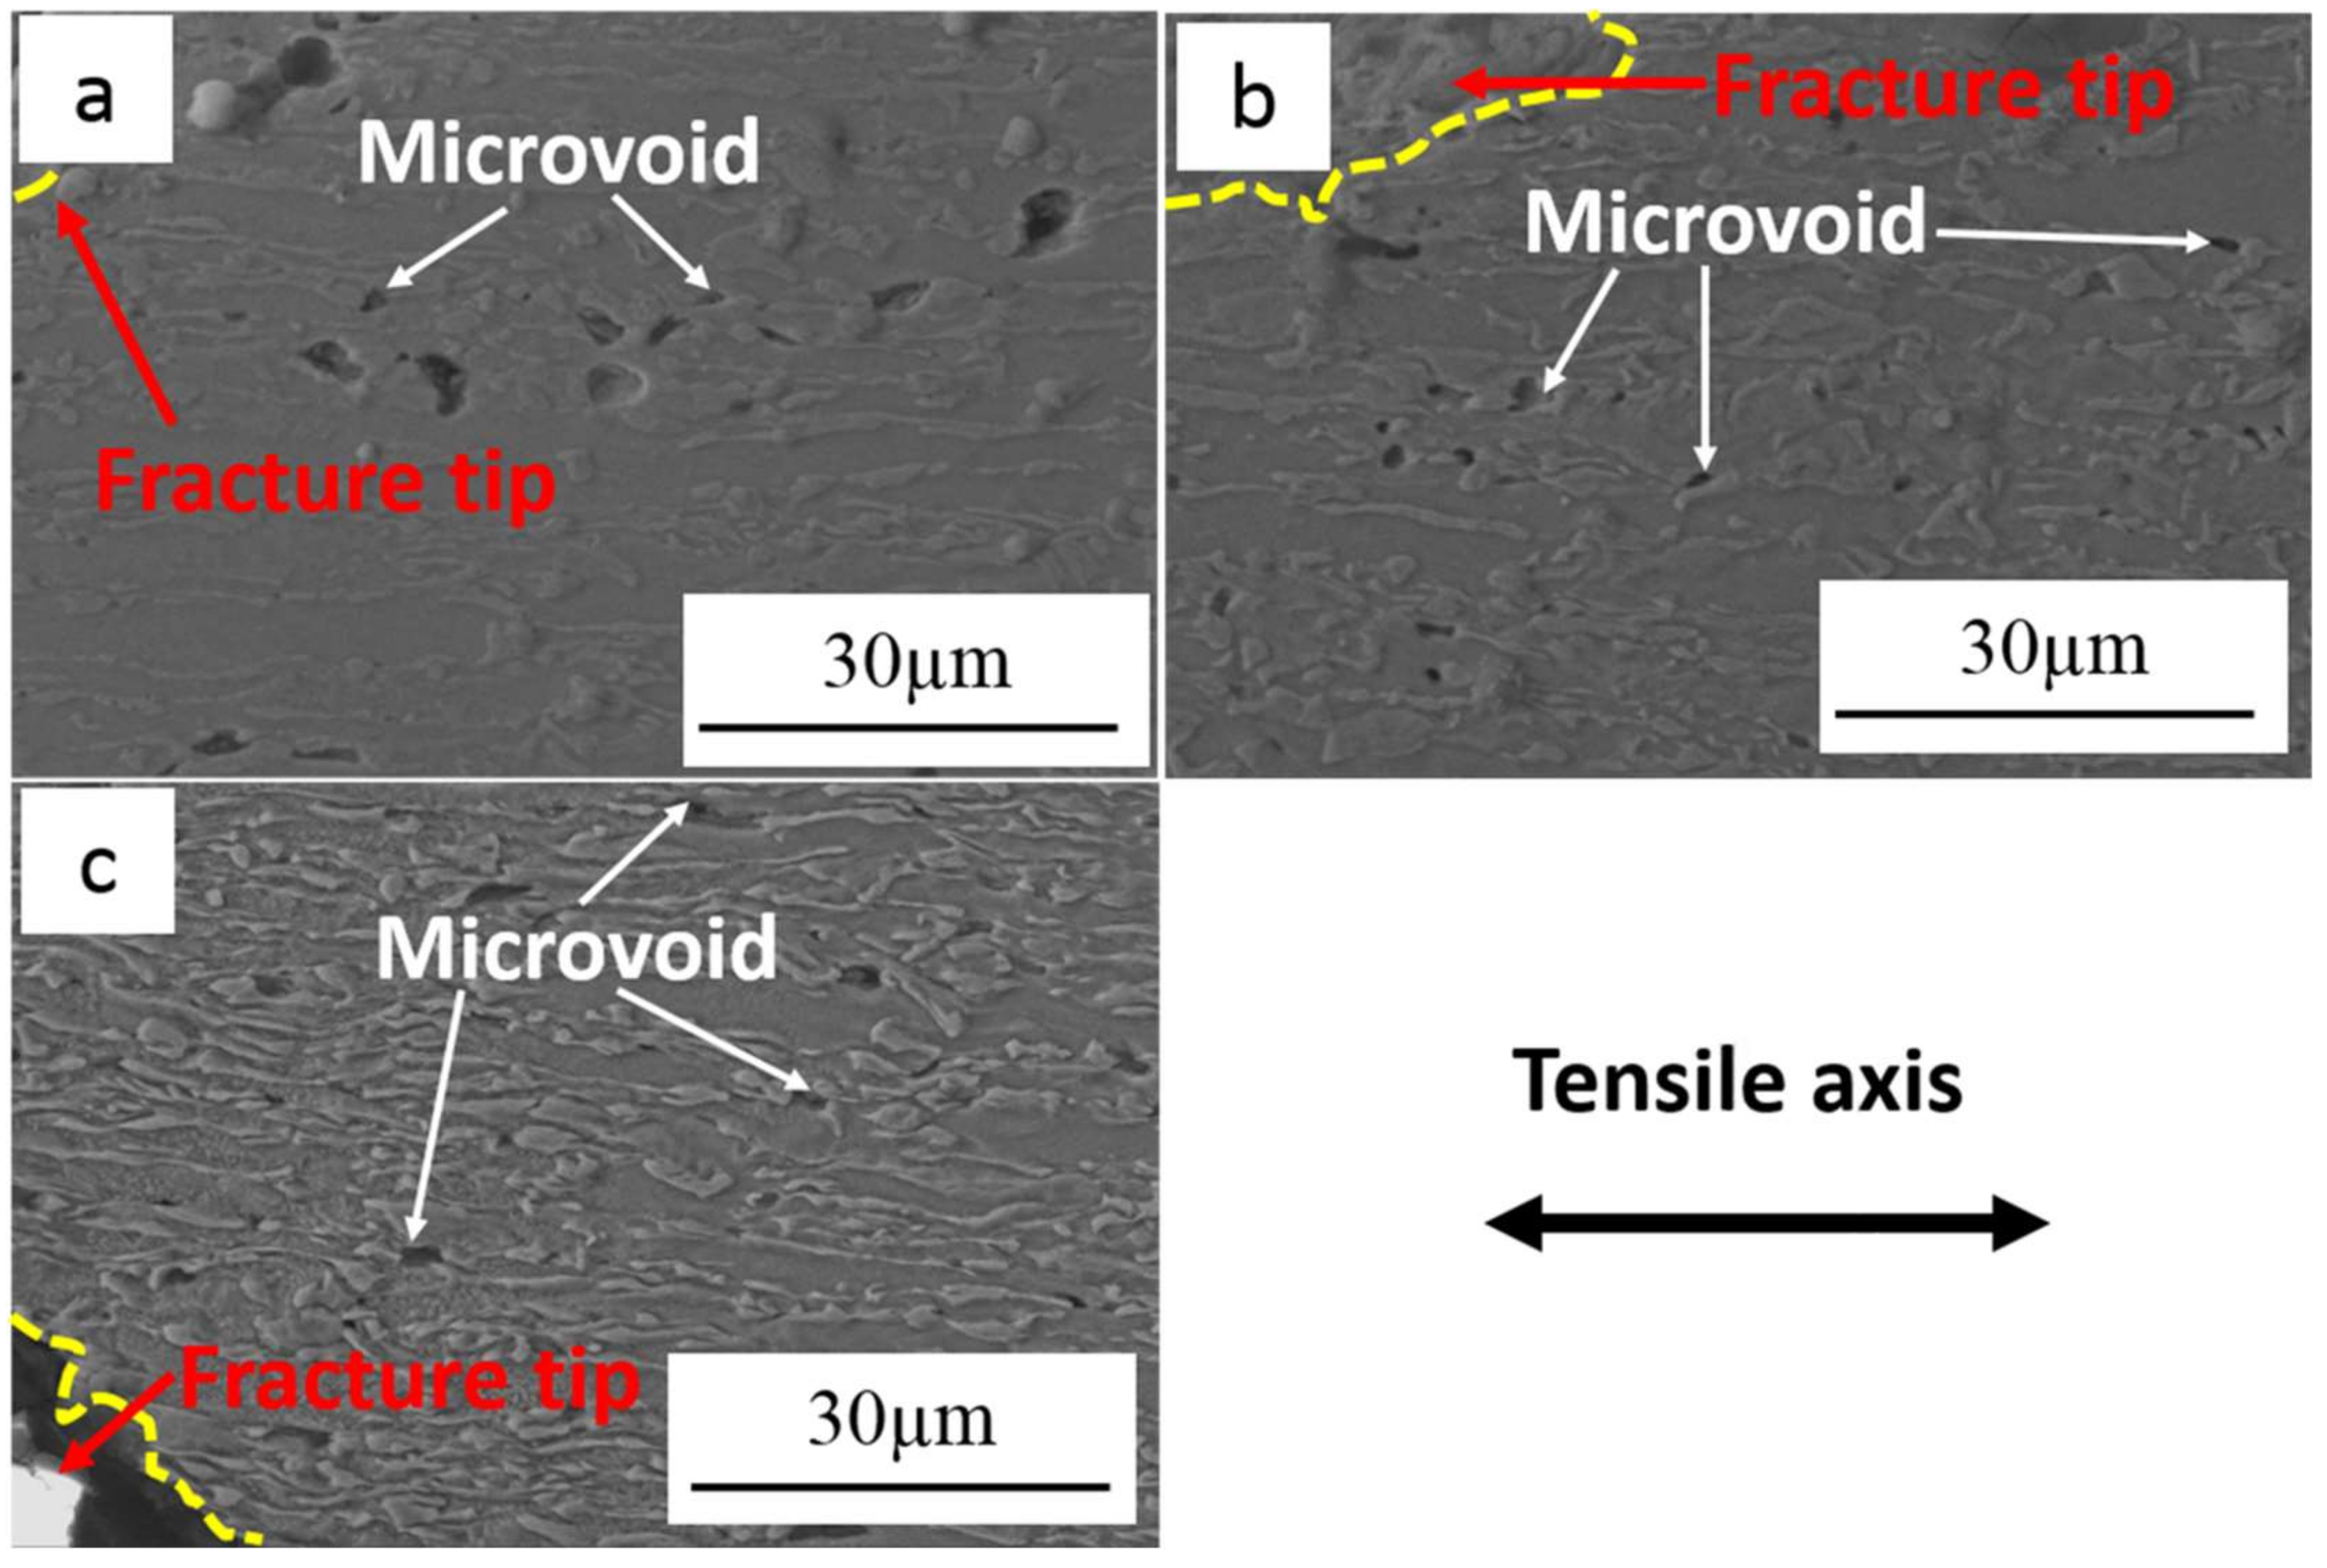
Figure 12 shows the typical microstructure of the side surface in the vicinity of the fracture surface of the FMDP780 sample at the quasi-static and two different strain rates, revealing the damage formation sites and the distributions. The microstructure of the FMDP660 sample is not present here due to the similar damage behavior. It is found that the microvoids are mainly formed on the interfaces between ferrite and martensite, for all the strain rate conditions. Previous research on DP steels has shown that the microvoids can be nucleated both inside the martensite and on the ferrite–martensite interfaces [29,30,31], whereas in this study only the latter nucleation sites were observed. Obviously, the grain exhibits a more obvious elongating trend at 1000 s−1 than the quasi-static.
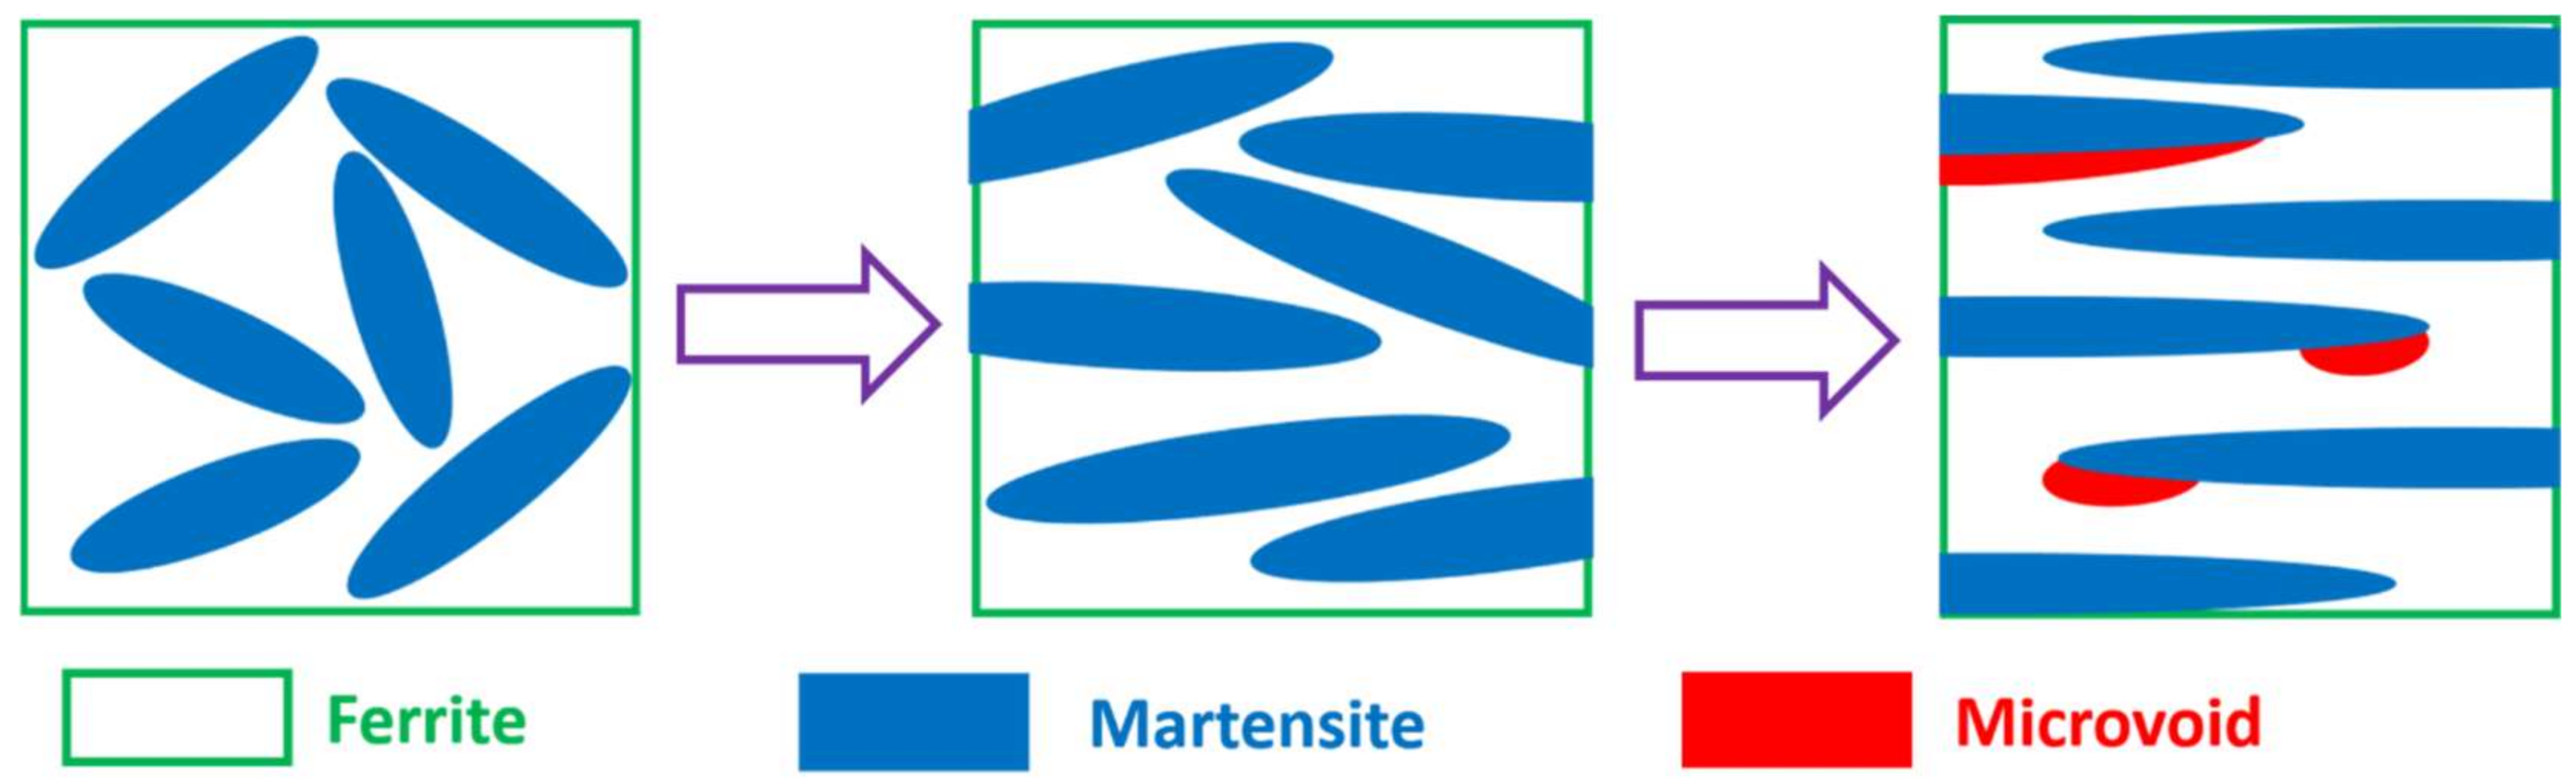
The formation of microvoids during tensile testing is mainly due to the heterogeneous deformation of martensite and ferrite under high strain rate conditions. It is more difficult to deform martensite than ferrite and the load is predominantly taken by the martensite phase during the deformation process. When the local stress exceeds the critical boundary binding stress, the microvoids would nucleate on the interfaces, followed by their growth and coalescence [31]. Ghadbeigi et al. [32], who use the Digital Image Correlation (DIC) and an in-situ tensile testing and found that the position of the nucleation is related to the strength of the interfaces and the stress distribution among different phases in the DP steel. The fracture mechanism of the investigated alloys tests at high strain rates is depicted by a schematic diagram shown in Figure 13.
4. Conclusions
In the present work, the mechanical behavior of two ferrite–martensite dual phase steels (FMDP660 and FMDP780) under tensile testing at different strain rate (0.001–1000 s−1) was investigated. The effect of the strain rate and microstructure on tensile properties and energy absorption, strain hardening behavior and associated dislocation motion, the adiabatic heating and the fracture mechanism was discussed. The main conclusions are as follows:
- (1)
- The YS in both steels monotonically increased with strain rates. However, the values of UTS, UE, PUE and Z of both steels were maintained stable at the low strain rate range (0.001–0.1 s−1), followed by a significant increase with strain rates at the high strain rate range (0.1–1000 s−1). The FMDP780 steel with a higher fraction of martensite possessed a stronger strain rate sensitivity of tensile strength and elongation values at the high strain rate stage, compared with the FMDP660 sample. For all the strain rates, the FMDP780 sample possessed higher strength and lower elongation values compared with FMDP660.
- (2)
- The energy absorption in the two steels at the strain of 10% increased with increasing strain rates. The energy absorption of the two steels at the stage of UE and TE showed a first stable and then increasing trend with increasing strain rates; such increase of the energy absorption was found to be more pronounced for the FMDP780 steel.
- (3)
- The different UTS and UE values due to different strain rates and microstructures were associated with the change of work hardening rate. At the low strain rate stage, the work hardening rate of both steels was relatively low and unchanged with strain rates. It started to increase when the strain rate was above 0.1 s−1, and the increase was more pronounced in the FMDP780 sample.
- (4)
- The dislocation density of ferrite in the two steels did not change significantly at low strain rates, whereas it increased obviously at the high strain rate stage. Further, it showed that the FMDP780 steel presented a higher dislocation density compared with the FMDP660 at the same strain rate.
- (5)
- The fracture surface of the steels was characterized by dimpled-type fracture associated with microvoid formation at the ferrite–martensite interfaces, regardless of the strain rates. The change of the PUE value of the two steels with strain rate was attributed to the effect of adiabatic heating during the tensile testing. Besides, the grain exhibits a more obvious elongating trend at 1000 s−1 than the quasi-static.
Acknowledgments
This research was supported by the National Natural Science Foundation of china (Grant No. 51574028), the Science and Technology Plan Project of Beijing (D151100003515002). The financial support of the Beijing Laboratory of Metallic Materials and processing for Modern Transportation is also gratefully acknowledged.
Author Contributions
Jiangtao Liang, Zhengzhi Zhao, and Di Tang conceived and designed the experiments; Jiangtao Liang and Hongwu performed the experiments; Jiangtao Liang, Zhengzhi Zhao, Binhan Sun, Baoqi Guo, and Juhua Liang analyzed the data; Jiangtao Liang and Chong Peng contributed reagents/materials/analysis tools; Jiangtao Liang wrote the paper; Zhengzhi Zhao and Binhan Sun revised the language in this paper.
Conflicts of Interest
The authors declare no conflict of interest.
References
- Verleysen, P.; Peirs, J.; Van Slycken, J.; Faes, K.; Duchene, L. Effect of strain rate on the forming behaviour of sheet metals. J. Mater. Process Technol. 2011, 211, 1457–1464. [Google Scholar] [CrossRef]
- Kim, S.B.; Huh, H.; Bok, H.H.; Moon, M.B. Forming limit diagram of auto-body steel sheets for high-speed sheet metal forming. J. Mater. Process Technol. 2011, 211, 851–862. [Google Scholar] [CrossRef]
- Sun, X.; Soulami, A.; Choi, K.S.; Guzman, O.; Chen, W. Effects of sample geometry and loading rate on tensile ductility of TRIP800 steel. Mater. Sci. Eng. A 2012, 541, 1–7. [Google Scholar] [CrossRef]
- Boyce, B.L.; Dilmore, M.F. The dynamic tensile behavior of tough, ultrahigh-strength steels at strain-rates from 0.0002 s−1 to 200 s−1. Int. J. Impact Eng. 2009, 36, 263–271. [Google Scholar] [CrossRef]
- Kim, J.H.; Kim, D.; Han, H.N.; Barlat, F.; Lee, M.G. Strain rate dependent tensile behavior of advanced high strength steels: Experiment and constitutive modeling. Mater. Sci. Eng. A 2013, 559, 222–231. [Google Scholar] [CrossRef]
- Curtze, S.; Kuokkala, V.T.; Hokka, M.; Peura, P. Deformation behavior of TRIP and DP steels in tension at different temperatures over a wide range of strain rates. Mater. Sci. Eng. A 2009, 507, 124–131. [Google Scholar] [CrossRef]
- Singh, N.K.; Cadoni, E.; Singha, M.K.; Gupta, N.K. Dynamic tensile behavior of multi phase high yield strength steel. Mater. Des. 2011, 32, 5091–5098. [Google Scholar] [CrossRef]
- Qin, J.; Chen, R.; Wen, X.; Lin, Y.; Liang, M.; Lu, F. Mechanical behaviour of dual-phase high-strength steel under high strain rate tensile loading. Mater. Sci. Eng. A 2013, 586, 62–70. [Google Scholar] [CrossRef]
- Liu, Y.; Dong, D.; Wang, L.; Chu, X.; Wang, P.; Jin, M. Strain rate dependent deformation and failure behavior of laser welded DP780 steel joint under dynamic tensile loading. Mater. Sci. Eng. A 2015, 627, 296–305. [Google Scholar] [CrossRef]
- Dong, D.; Liu, Y.; Yang, Y.; Li, J.; Ma, M.; Jiang, T. Microstructure and dynamic tensile behavior of DP600 dual phase steel joint by laser welding. Mater. Sci. Eng. A 2014, 594, 17–25. [Google Scholar] [CrossRef]
- Huh, H.; Kim, S.B.; Song, J.H.; Lim, J.H. Dynamic tensile characteristics of TRIP-type and DP-type steel sheets for an auto-body. Int. J. Mech. Sci. 2008, 50, 918–931. [Google Scholar] [CrossRef]
- Yu, H.; Guo, Y.; Lai, X. Rate-dependent behavior and constitutive model of DP600 steel at strain rate from 10−4 to 103 s−1. Mater. Des. 2009, 30, 2501–2505. [Google Scholar] [CrossRef]
- Song, R.B.; Dai, Q.F. Dynamic Deformation Behavior of Dual Phase Ferritic-Martensitic Steel at Strain Rates From 10−4 to 2000 s−1. Iron Steel Res. Int. 2013, 20, 48–53. [Google Scholar] [CrossRef]
- Cadoni, E.; Singh, N.K.; Forni, D.; Singha, M.K.; Gupta, N.K. Strain rate effects on the mechanical behavior of two Dual Phase steels in tension. Eur. Phys. J. Special Topic 2016, 225, 409–421. [Google Scholar] [CrossRef]
- Wang, W.R.; Li, M.; He, C.W.; Wei, X.C.; Wang, D.Z.; Du, H.B. Experimental study on high strain rate behavior of high strength 600–1000 MPa dual phase steels and 1200 MPa fully martensitic steels. Mater. Des. 2013, 47, 510–521. [Google Scholar] [CrossRef]
- Zhang, J.C.; Di, H.S.; Deng, Y.G.; Li, S.C.; Misra, R.D.K. Microstructure and mechanical property relationship in an ultrahigh strength 980 MPa grade high-Al low-Si dual phase steel. Mater. Sci. Eng. A 2015, 645, 232–240. [Google Scholar] [CrossRef]
- Calcagnotto, M.; Ponge, D.; Raabe, D. Effect of grain refinement to 1 μm on strength and toughness of dual-phase steels. Mater. Sci. Eng. A 2010, 527, 7832–7840. [Google Scholar] [CrossRef]
- Zhang, J.C.; Di, H.S.; Deng, Y.G.; Misra, R.D.K. Effect of martensite morphology and volume fraction on strain hardening and fracture behavior of martensite–ferrite dual phase steel. Mater. Sci. Eng. A 2015, 627, 230–240. [Google Scholar] [CrossRef]
- Wei, X.; Fu, R.; Li, L. Tensile deformation behavior of cold-rolled TRIP-aided steels over large range of strain rates. Mater. Sci. Eng. A 2007, 465, 260–266. [Google Scholar] [CrossRef]
- Feng, F.; Huang, S.; Meng, Z.; Hu, J.; Lei, Y.; Zhou, M.; Wu, D.; Yang, Z. Experimental study on tensile property of AZ31B magnesium alloy at different high strain rates and temperatures. Mater. Des. 2014, 57, 10–20. [Google Scholar] [CrossRef]
- Xu, Z.; Huang, F. Plastic behavior and constitutive modeling of armor steel over wide temperature and strain rate ranges. Acta Mech. Solida Sin. 2012, 25, 598–608. [Google Scholar] [CrossRef]
- Rana, R.; Liu, C.; Ray, R.K. Low-density low-carbon Fe–Al ferritic steels. Scr. Mater. 2013, 68, 354–359. [Google Scholar] [CrossRef]
- Sugimoto, K.I.; Kobayashi, M.; Hashimoto, S.I. Ductility and strain-induced transformation in a high-strength transformation-induced plasticity-aided dual-phase steel. Metall. Trans. A 1992, 23, 3085–3091. [Google Scholar] [CrossRef]
- Huh, H.; Kim, S.B.; Song, J.H.; Yoon, J.H.; Lim, J.H.; Park, S.H. Investigation of elongation at fracture in a high speed sheet metal forming process. Steel Res. Int. 2009, 80, 316–322. [Google Scholar]
- Dong, D.; Liu, Y.; Wang, L.; Su, L. Effect of strain rate on dynamic deformation behavior of DP780 steel. Acta Metall. Sin. 2013, 49, 159–166. [Google Scholar] [CrossRef]
- Bouaziz, O.; Buessler, P. Iso-work increment assumption for heterogeneous material behavior modelling. Adv. Eng. Mater. 2004, 6, 79–83. [Google Scholar] [CrossRef]
- Sung, J.H.; Kim, J.H.; Wagoner, R.H. A plastic constitutive equation incorporating strain, strain-rate, and temperature. Int. J. Plast. 2010, 26, 1746–1771. [Google Scholar] [CrossRef]
- He, Z.; He, Y.; Ling, Y.; Wu, Q.; Gao, Y.; Li, L. Effect of strain rate on deformation behavior of TRIP steels. J. Mater. Process Technol. 2012, 212, 2141–2147. [Google Scholar] [CrossRef]
- Mazaheri, Y.; Kermanpur, A.; Najafizadeh, A.; Saeidi, N. Effects of initial microstructure and thermomechanical processing parameters on microstructures and mechanical properties of ultrafine grained dual phase steels. Mater. Sci. Eng. A 2014, 612, 54–62. [Google Scholar] [CrossRef]
- Ghatei Kalashami, A.; Kermanpur, A.; Ghassemali, E.; Najafizadeh, A.; Mazaheri, Y. Correlation of microstructure and strain hardening behavior in the ultrafine-grained Nb-bearing dual phase steels. Mater. Sci. Eng. A 2016, 678, 215–226. [Google Scholar] [CrossRef]
- Mazaheri, Y.; Kermanpur, A.; Najafizadeh, A. A novel route for development of ultrahigh strength dual phase steels. Mater. Sci. Eng. A 2014, 619, 1–11. [Google Scholar] [CrossRef]
- Ghadbeigi, H.; Pinna, C.; Celotto, S.; Yates, J.R. Local plastic strain evolution in a high strength dual-phase steel. Mater. Sci. Eng. A 2010, 527, 5026–5032. [Google Scholar] [CrossRef]
Figure 1.
Tensile specimens at low strain rate (a) and high strain rate (b) with parallel region of 20 mm for the CMT5105 and the Zwick HTM 16020.
Figure 1.
Tensile specimens at low strain rate (a) and high strain rate (b) with parallel region of 20 mm for the CMT5105 and the Zwick HTM 16020.

Figure 2.
Values of strain rate (a) 1 s−1 and 10 s−1; (b) 100 s−1 and 1000 s−1 of the two steels as a function of time.
Figure 2.
Values of strain rate (a) 1 s−1 and 10 s−1; (b) 100 s−1 and 1000 s−1 of the two steels as a function of time.

Figure 3.
Scanning electron microscopy (SEM) micrographs of (a) FMDP660 and (b) FMDP780 steel of RD–ND plane. (RD represents rolling direction, ND represents normal direction)
Figure 3.
Scanning electron microscopy (SEM) micrographs of (a) FMDP660 and (b) FMDP780 steel of RD–ND plane. (RD represents rolling direction, ND represents normal direction)

Figure 4.
Quasi static engineering stress-strain curves of FMDP660 and FMDP780 steel.

Figure 5.
Engineering stress–strain curves of the FMDP660 (a) and FMDP780 (b) steel at strain rates from 0.001 to 1000 s−1.
Figure 5.
Engineering stress–strain curves of the FMDP660 (a) and FMDP780 (b) steel at strain rates from 0.001 to 1000 s−1.

Figure 6.
Values of (a) YS, (b) UTS, (c) UE and (d) PUE of the two steels as a function strain rate.
Figure 6.
Values of (a) YS, (b) UTS, (c) UE and (d) PUE of the two steels as a function strain rate.

Figure 7.
Absorbed energy of the two steels at the strain level of (a) 10% strain; (b) UE and (c) TE as a function of strain rate.
Figure 7.
Absorbed energy of the two steels at the strain level of (a) 10% strain; (b) UE and (c) TE as a function of strain rate.

Figure 8.
True stress–strain curve and strain hardening rate of the (a) FMDP660 and (b) FMDP780 steel at different strain rates from 0.001 to 1000 s−1.
Figure 8.
True stress–strain curve and strain hardening rate of the (a) FMDP660 and (b) FMDP780 steel at different strain rates from 0.001 to 1000 s−1.

Figure 9.
Adiabatic temperature rises of the two steels at the high strain rate stage (1–1000 s−1).
Figure 10.
Dislocation configurations near the fracture tip of the (a,c,e,g) FMDP660 and (b,d,f,h) FMDP780 steel at the stain rates of (a,b) 0.001 s−1; (c,d) 0.1 s−1; (e,f) 100 s−1 and (g,h) 1000 s−1. In addition, (i,j) are partially enlarged for (g,h), respectively.
Figure 10.
Dislocation configurations near the fracture tip of the (a,c,e,g) FMDP660 and (b,d,f,h) FMDP780 steel at the stain rates of (a,b) 0.001 s−1; (c,d) 0.1 s−1; (e,f) 100 s−1 and (g,h) 1000 s−1. In addition, (i,j) are partially enlarged for (g,h), respectively.

Figure 11.
Fracture surface of the (a,b) FMDP660 and (c,d) FMDP780 steel at strain rates of (a,c) 0.001 s−1 and (b,d) 1000 s−1.
Figure 11.
Fracture surface of the (a,b) FMDP660 and (c,d) FMDP780 steel at strain rates of (a,c) 0.001 s−1 and (b,d) 1000 s−1.

Figure 12.
SEM micrographs of the damage of the FMDP780 steel after tensile test at the strain rates of (a) quasi-static; (b) 10 s−1 and (c) 1000 s−1, showing the formation of microvoids at ferrite–martensite interfaces.
Figure 12.
SEM micrographs of the damage of the FMDP780 steel after tensile test at the strain rates of (a) quasi-static; (b) 10 s−1 and (c) 1000 s−1, showing the formation of microvoids at ferrite–martensite interfaces.

Figure 13.
Schematic diagram of microvoid formation in ferrite–martensite dual-phase steel.


Table 1.
Chemical compositions of the investigated steels (in wt %).
| Steel | C | Si | Mn | P | S | Al | N | Cr | Mo | Nb | Ti | B | Fe |
|---|---|---|---|---|---|---|---|---|---|---|---|---|---|
| FMDP660 | 0.12 | 1.2 | 1.5 | 0.015 | 0.005 | 0.05 | 0.003 | - | - | - | - | - | Balanced |
| FMDP780 | 0.08 | 0.1 | 2.0 | 0.015 | 0.015 | 0.6 | - | 0.25 | 0.2 | 0.018 | 0.012 | 0.0012 | Balanced |
Table 2.
Mechanical properties of FMDP660 and FMDP780 steel at the quasi-static condition, where YS, UTS, UE, TE are yield strength, ultimate tensile strength, uniform elongation, total elongation, respectively.
Table 2.
Mechanical properties of FMDP660 and FMDP780 steel at the quasi-static condition, where YS, UTS, UE, TE are yield strength, ultimate tensile strength, uniform elongation, total elongation, respectively.
| Tested Steel | YS/MPa | UTS/MPa | UE/% | TE/% | Microhardness/HV |
|---|---|---|---|---|---|
| FMDP660 | 425 ± 3 | 674 ± 4 | 19.25 ± 0.5 | 29.45 ± 0.5 | 211 ± 2 |
| FMDP780 | 624 ± 5 | 792 ± 6 | 14.72 ± 0.5 | 23.43 ± 0.4 | 263 ± 3 |
Table 3.
Comparison of mechanical properties of FMDP660 and FMDP780 steels at strain rates from 0.001 to 1000 s−1, where YS, UTS, UE, PUE and Z are, respectively, the yield strength, ultimate tensile strength, uniform elongation, post uniform elongation and the reduction of the cross-section area of the specimens.
| Materials | (s−1) | YS (MPa) | UTS (MPa) | UE (%) | PUE (%) | Z (%) |
|---|---|---|---|---|---|---|
| FMDP660 | 0.001 | 392 ± 5 | 656 ± 6 | 21.09 ± 0.4 | 10.87 ± 0.6 | 31.96 ± 0.5 |
| 0.01 | 399 ± 6 | 660 ± 7 | 19.84 ± 0.3 | 13.52 ± 0.4 | 33.36 ± 0.3 | |
| 0.1 | 433 ± 4 | 667 ± 5 | 18.65 ± 0.3 | 11.83 ± 0.5 | 30.48 ± 0.4 | |
| 1 | 450 ± 5 | 743 ± 8 | 21.11 ± 0.4 | 13.99 ± 0.6 | 35.1 ± 0.5 | |
| 10 | 470 ± 6 | 798 ± 8 | 20.76 ± 0.5 | 12.29 ± 0.6 | 33.05 ± 0.3 | |
| 100 | 523 ± 6 | 806 ± 3 | 19.42 ± 0.3 | 14.68 ± 0.5 | 34.1 ± 0.4 | |
| 1000 | 576 ± 7 | 847 ± 6 | 22.94 ± 0.4 | 16.76 ± 1.0 | 39.7 ± 0.9 | |
| FMDP780 | 0.001 | 509 ± 6 | 769 ± 7 | 16.05 ± 0.5 | 10.91 ± 0.7 | 26.96 ± 0.5 |
| 0.01 | 520 ± 7 | 778 ± 10 | 15.63 ± 0.4 | 11.17 ± 0.5 | 26.8 ± 0.3 | |
| 0.1 | 547 ± 8 | 785 ± 6 | 14.22 ± 0.3 | 10.78 ± 0.5 | 25 ± 0.4 | |
| 1 | 581 ± 4 | 844 ± 7 | 16.12 ± 0.3 | 9.88 ± 0.5 | 26 ± 0.3 | |
| 10 | 586 ± 7 | 865 ± 6 | 16.91 ± 0.4 | 12.54 ± 0.5 | 29.45 ± 0.3 | |
| 100 | 663 ± 5 | 963 ± 8 | 18.67 ± 0.3 | 12.58 ± 0.4 | 31.25 ± 0.3 | |
| 1000 | 671 ± 8 | 1031 ± 10 | 19.67 ± 0.5 | 16.73 ± 0.7 | 36.4 ± 0.5 |
© 2018 by the authors. Licensee MDPI, Basel, Switzerland. This article is an open access article distributed under the terms and conditions of the Creative Commons Attribution (CC BY) license (http://creativecommons.org/licenses/by/4.0/).
Share and Cite
MDPI and ACS Style
Liang, J.; Zhao, Z.; Wu, H.; Peng, C.; Sun, B.; Guo, B.; Liang, J.; Tang, D. Mechanical Behavior of Two Ferrite–Martensite Dual-Phase Steels over a Broad Range of Strain Rates. Metals 2018, 8, 236. https://doi.org/10.3390/met8040236
AMA Style
Liang J, Zhao Z, Wu H, Peng C, Sun B, Guo B, Liang J, Tang D. Mechanical Behavior of Two Ferrite–Martensite Dual-Phase Steels over a Broad Range of Strain Rates. Metals. 2018; 8(4):236. https://doi.org/10.3390/met8040236
Chicago/Turabian StyleLiang, Jiangtao, Zhengzhi Zhao, Hong Wu, Chong Peng, Binhan Sun, Baoqi Guo, Juhua Liang, and Di Tang. 2018. "Mechanical Behavior of Two Ferrite–Martensite Dual-Phase Steels over a Broad Range of Strain Rates" Metals 8, no. 4: 236. https://doi.org/10.3390/met8040236
Note that from the first issue of 2016, this journal uses article numbers instead of page numbers. See further details here.