Article

AC Iron Loss Prediction and Magnetic Properties of Fe-6.5 wt. % Si Ribbons Prepared by Melt-Spinning

State Key Laboratory for Advanced Metals and Materials, University of Science and Technology Beijing, Beijing 100083, China
*
Author to whom correspondence should be addressed.
Metals 2018, 8(4), 259; https://doi.org/10.3390/met8040259
Submission received: 8 March 2018 / Revised: 29 March 2018 / Accepted: 10 April 2018 / Published: 11 April 2018

Abstract

:
Ultra-thin Fe-6.5 wt. % Si ribbons of 35 μm in thickness were prepared by melt-spinning. The magnetic properties were investigated before and after annealing at 1000 °C. The DC properties and low-frequency (400 Hz~10 kHz) iron losses significantly improved after heat treatment. A simplified formula— P t = k t B m N —based on the Steinmetz law, which can be used to predict the AC iron loss, is presented. The symbols “kt” and “N” are defined as functions of microstructure and frequency. According to the tested results of iron loss, the values of “kt” and “N” can be fitted and therefore the simplified formula can be determined. The extent of AC iron losses can be predicted according to the formula. The results obtained from the formula predict AC iron loss to a good degree. The method developed in this work could be extended to other magnetic materials for predicting AC iron loss with greater ease.

1. Introduction

Silicon steels are mainly used in transformers, power generators, and motors as important soft magnetic materials. In these, core loss occurs due to hysteresis and eddy current circulation during usage, wherein the hysteresis loss is proportional to the frequency, and the eddy current loss is proportional to the square of the frequency. Therefore, eddy current loss accounts for a large proportion in high-frequency use.
Compared with ordinary silicon steel, Fe-6.5 wt. % Si (high silicon steel) alloy has many advantages in terms of magnetic properties, such as its properties of near-zero magnetostriction, high permeability, high resistivity, and low core loss [1]. The high resistivity aids in the suppression of the eddy current and thus leads to a significant reduction in eddy current loss.
However, due to the brittleness of Fe-6.5 wt. % Si originated from ordered phases of B2 and D03 [2,3], it is extremely difficult to produce the Fe-6.5 wt. % Si alloy by the traditional hot–cold rolling process. Rapid solidification can suppress the transformation of ordered phases due to the high cooling rate, and thereby enhance the ductility [4]. Melt-spinning can be used for refining grains [5] and preparing magnetic material ribbons with good magnetic properties [6]. Previously, high-silicon steel ribbons of 25 mm in width were prepared by melt-spinning [7]. In this paper, various heat treatments were applied to the as-spun Fe-6.5 wt. % Si ribbons. The relationship between microstructures and magnetic properties was investigated. In addition, a method based on Steinmetz law for prediction of iron loss is presented and verified.

2. Materials and Methods

Herein, Fe-6.5 wt. % Si ribbons with 35 μm thickness were used. The composition of the ribbons measured by chemical analysis was Fe: 93.54 wt. %, Si: 6.46 wt. %. Micromorphology and cross sections of the ribbons were observed using a Zeiss Supra 55 (Carl Zeiss AG, Oberkochen, Germany) scanning electron microscope (SEM).
For magnetic properties measurement, the Fe-6.5 wt. % Si ribbons were cut into 10 mm widths and subsequently coated with MgO powder, which plays dual roles of insulation and adhesion prevention. Moreover, the ribbons were wound into a toroidal core of 32 mm inner and 40 mm outer diameter, respectively (Figure 1 inset). The alternating current (AC) and direct current (DC) magnetic properties were measured using NIM-2000S AC and NIM-3000S DC instruments (National Institute of Metrology, Beijing, China), respectively. B8, B50 were tested at magnetic field strengths of 800 A/m and 5000 A/m, respectively.
To explore the changes in magnetic properties with greater accuracy and reduce the number of errors caused by differences between the different samples, the same core was tested over five rounds of measurements. It should be noted that first the core was tested without heat treatment and subsequently it was annealed in an Ar atmosphere at 1000 °C for 0.5 h), following which the magnetic properties were tested. Subsequently, the same core was heated in an Ar atmosphere at 1000 °C for 1 h (referred to as 1.5 h), then at 1000 °C for 1.5 h (referred to as 3 h) and then another 2 h (referred to as 5 h). After each heat treatment, the magnetic properties were tested and the grain sizes were observed.

3. Results and Discussion

The DC properties of Fe-6.5 wt. % Si ribbons are shown in Table 1, and it is evident that the DC properties greatly improved after the 1000 °C heat treatment, which is reflected in the improvement of the magnetic permeability, B8, and reduction in coercivity value. It is observed that there is almost no change in B50 before and after heat treatment, owing to the sufficiently large magnitude of the external magnetic field, resulting in the same value of the magnetic induction due to an identical arrangement of the magnetic domain.
Figure 1 presents the values of AC iron losses. The iron loss corresponding to the frequency range between 400 Hz and 10 kHz shows a decreasing trend with heat treatment at 1000 °C. For frequencies higher than 10 kHz, the iron loss increases compared to the as-spun state. Figure 2a–e show the free surfaces of the ribbons and Figure 2f depicts the grain sizes on the free surface with respect to the annealing time. Figure 2a,b insets represent the longitudinal sections of the ribbons before and after heat treatment. The original ribbons consist of equiaxed grains on the wheel surface (the surface contacting the copper roller) and columnar grains on the free surface (the surface not contacting the roller). The grain size is small and uniform. After being subjected to 1000 °C for 0.5 h, each grain extends through the entire thickness, and the grain size increases from a few microns to about 30 microns. With increasing heat treatment time, the grain size tends to increase, but very slowly. The ribbon surfaces would hinder the growth of grain size [8]. After heat treatment, the grain growth results in reduction of grain boundaries, which aids in the reduction of the obstacles of the movement of magnetic domains, thereby reducing the hysteresis loss.
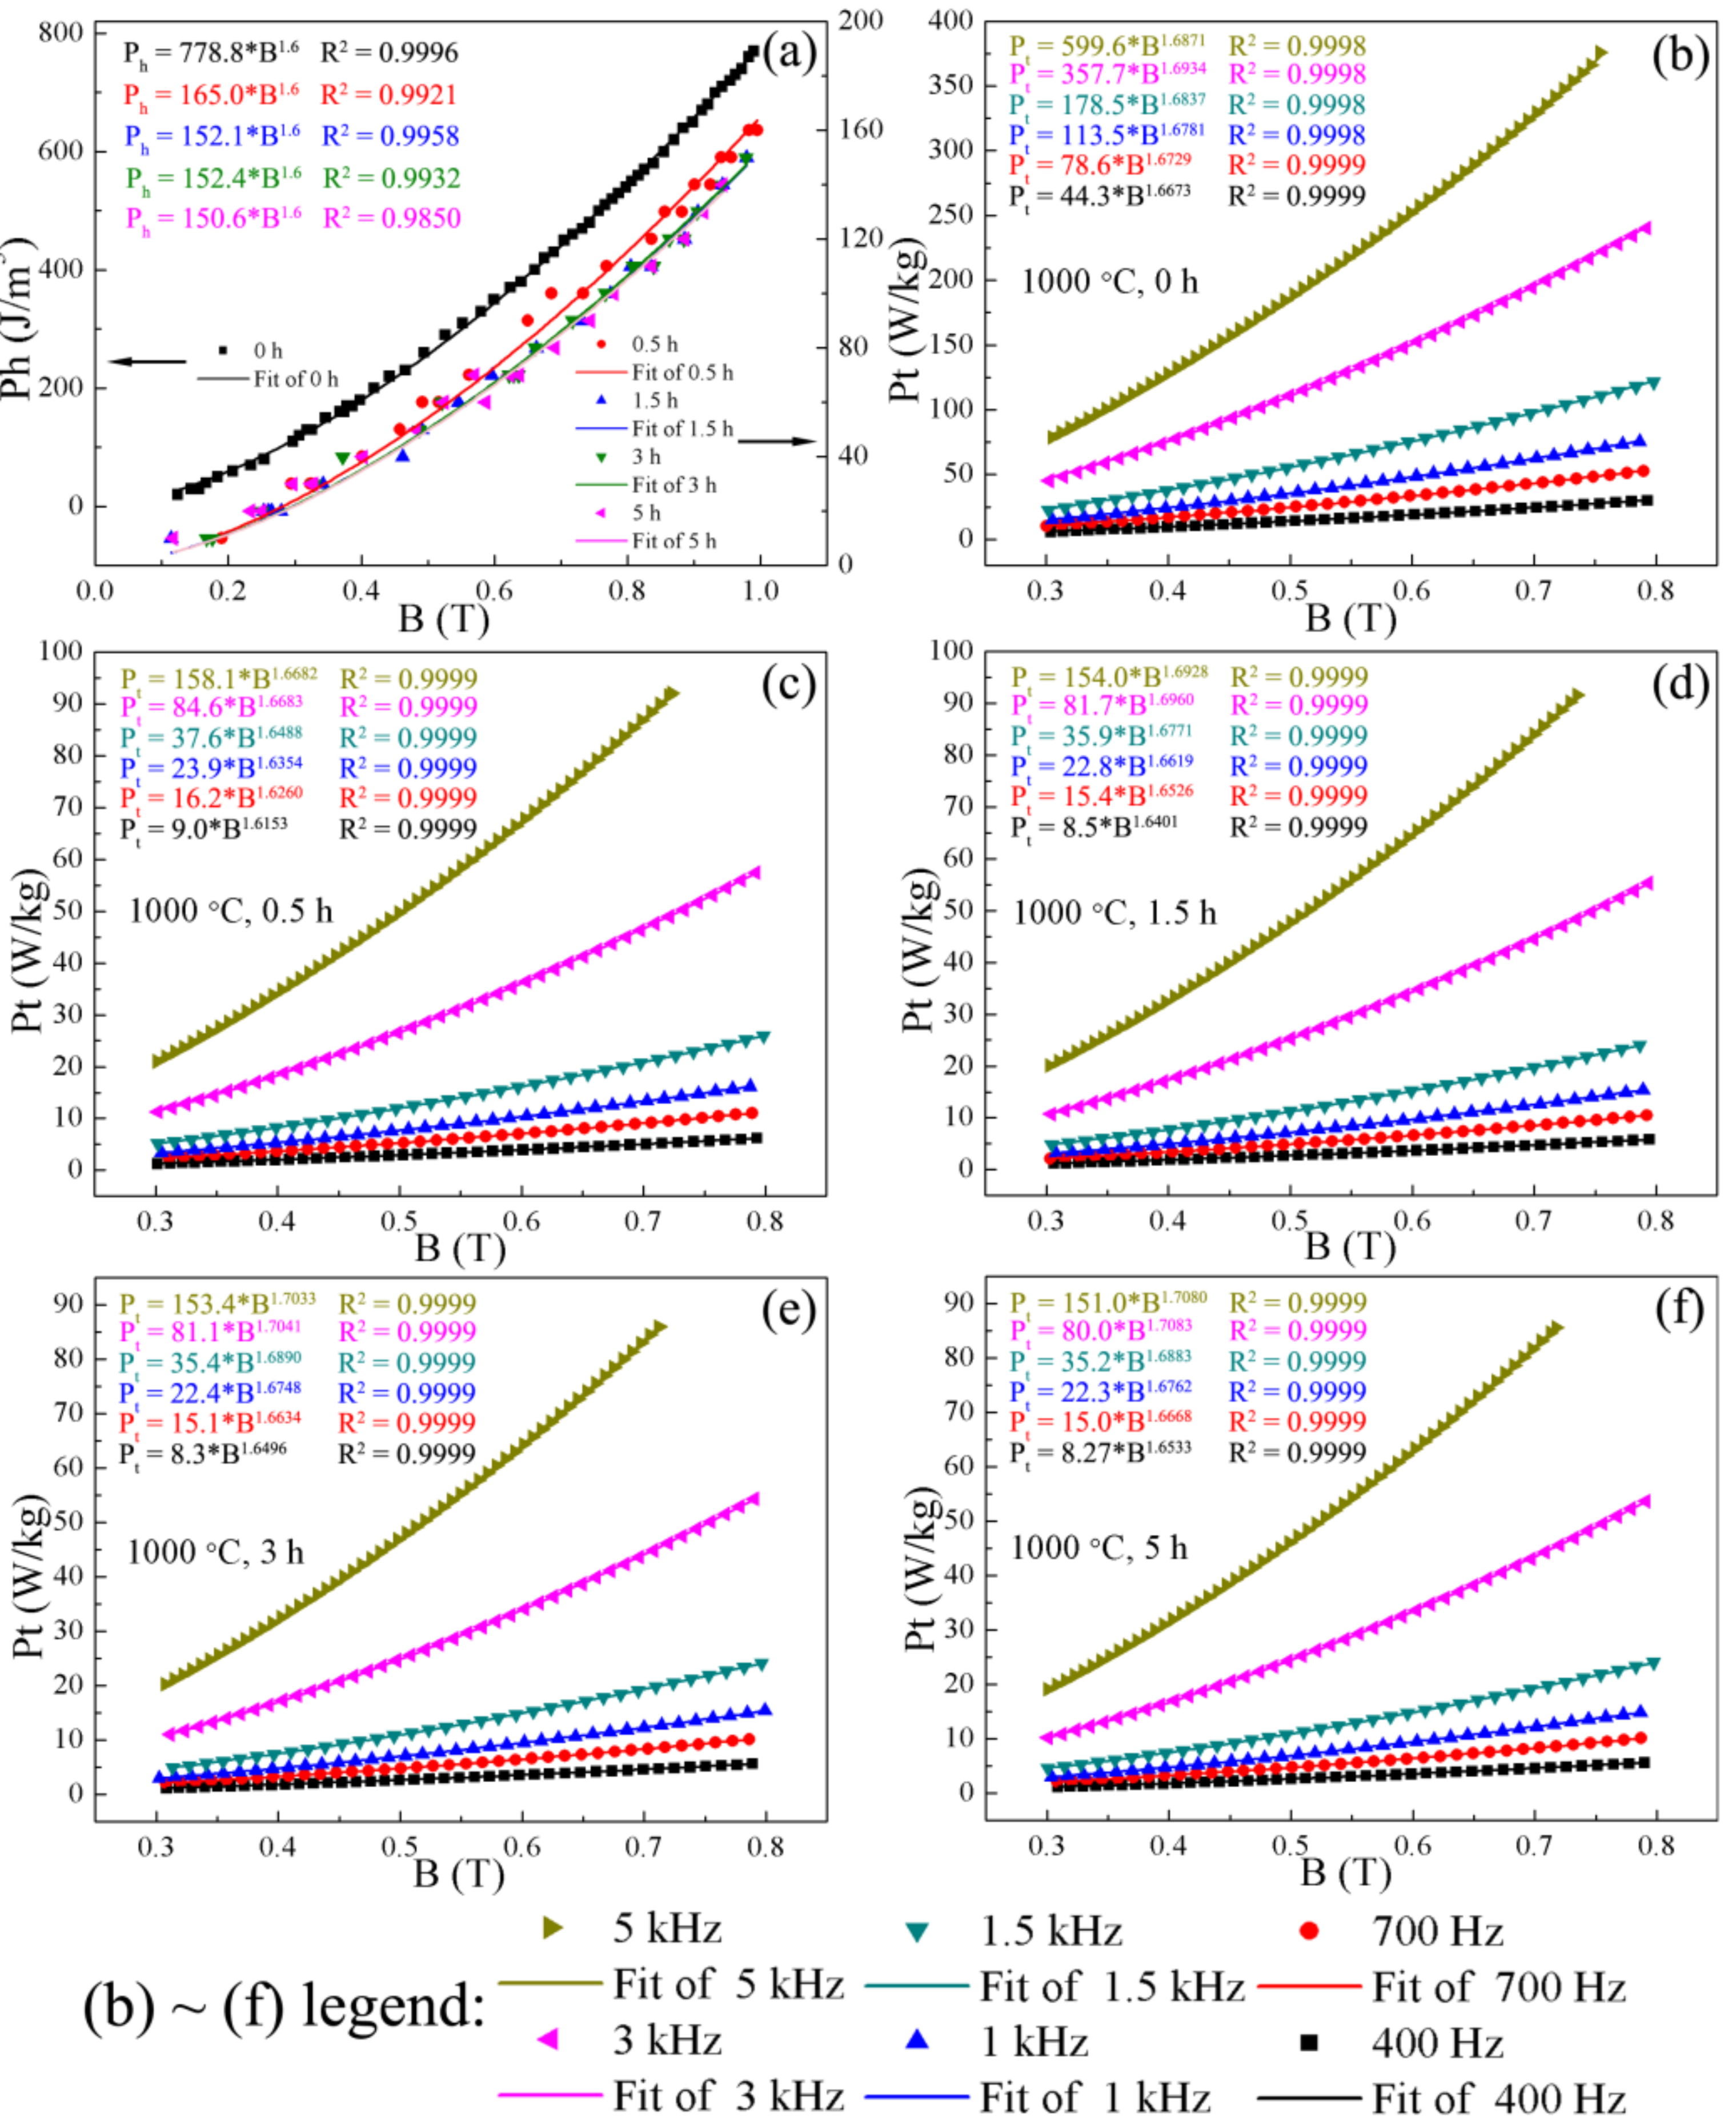
Figure 3 depicts the results of the hysteresis loss curves and the AC iron loss curves. It is well known that the Steinmetz law [9] is used to describe the relationship between Phys (hysteresis loss) and Bm (maximum magnetic induction), wherein: P h y s = k h B m n at DC field, where, kh is the hysteresis loss coefficient, and n is the exponent of Bm, which is always near 1.6. The different color formulas in the Figure 3a represent the fitting results of DC iron loss for different heat treatment time. R2 is the goodness of fit and the closer the value is to 1, the better the fit is. From Figure 3a, the DC iron losses decrease drastically after heat treatment and tend to decrease with the extension of the duration of heat treatment, and the coefficients of the fitted results (“kh” values) also have such a tendency. Generally, the “kh” value is affected by the kind of material, thickness, stress, grain size, etc. Any factor that reduces the resistance of magnetic domain motion can reduce the “kh” value.
Ever since Steinmetz formulated the law, many modifications have been proposed, such as the “AC Steinmetz law”: P t = k a c B m n f α , where Pt is the total iron loss under AC conditions, kac is the loss coefficient, n is the exponent of maximum magnetic induction Bm and α is the exponent of AC frequency f [10,11]. Upon comparing the hysteresis loss curve and the AC iron loss curve in Figure 3, it can be seen that their shapes are similar, exhibiting monotonically increasing concave functions. Here, we simplify the AC Steinmetz law into P t = k t B m N similar to “Steinmetz law” P h y s = k h B m n and different to “AC Steinmetz law” P t = k a c B m n f α where, “kt” and “N” are defined as functions of microstructure and frequency. According to the tested results of iron loss, the values of “kt” and “N” can be fitted using the simplified formula— P t = k t B m N , as shown in Figure 3b–f. The different color formulas represent the fitting results of different frequencies. The prediction of iron loss through the formula— P t = k t B m N is based on determining of “kt” and “N”.
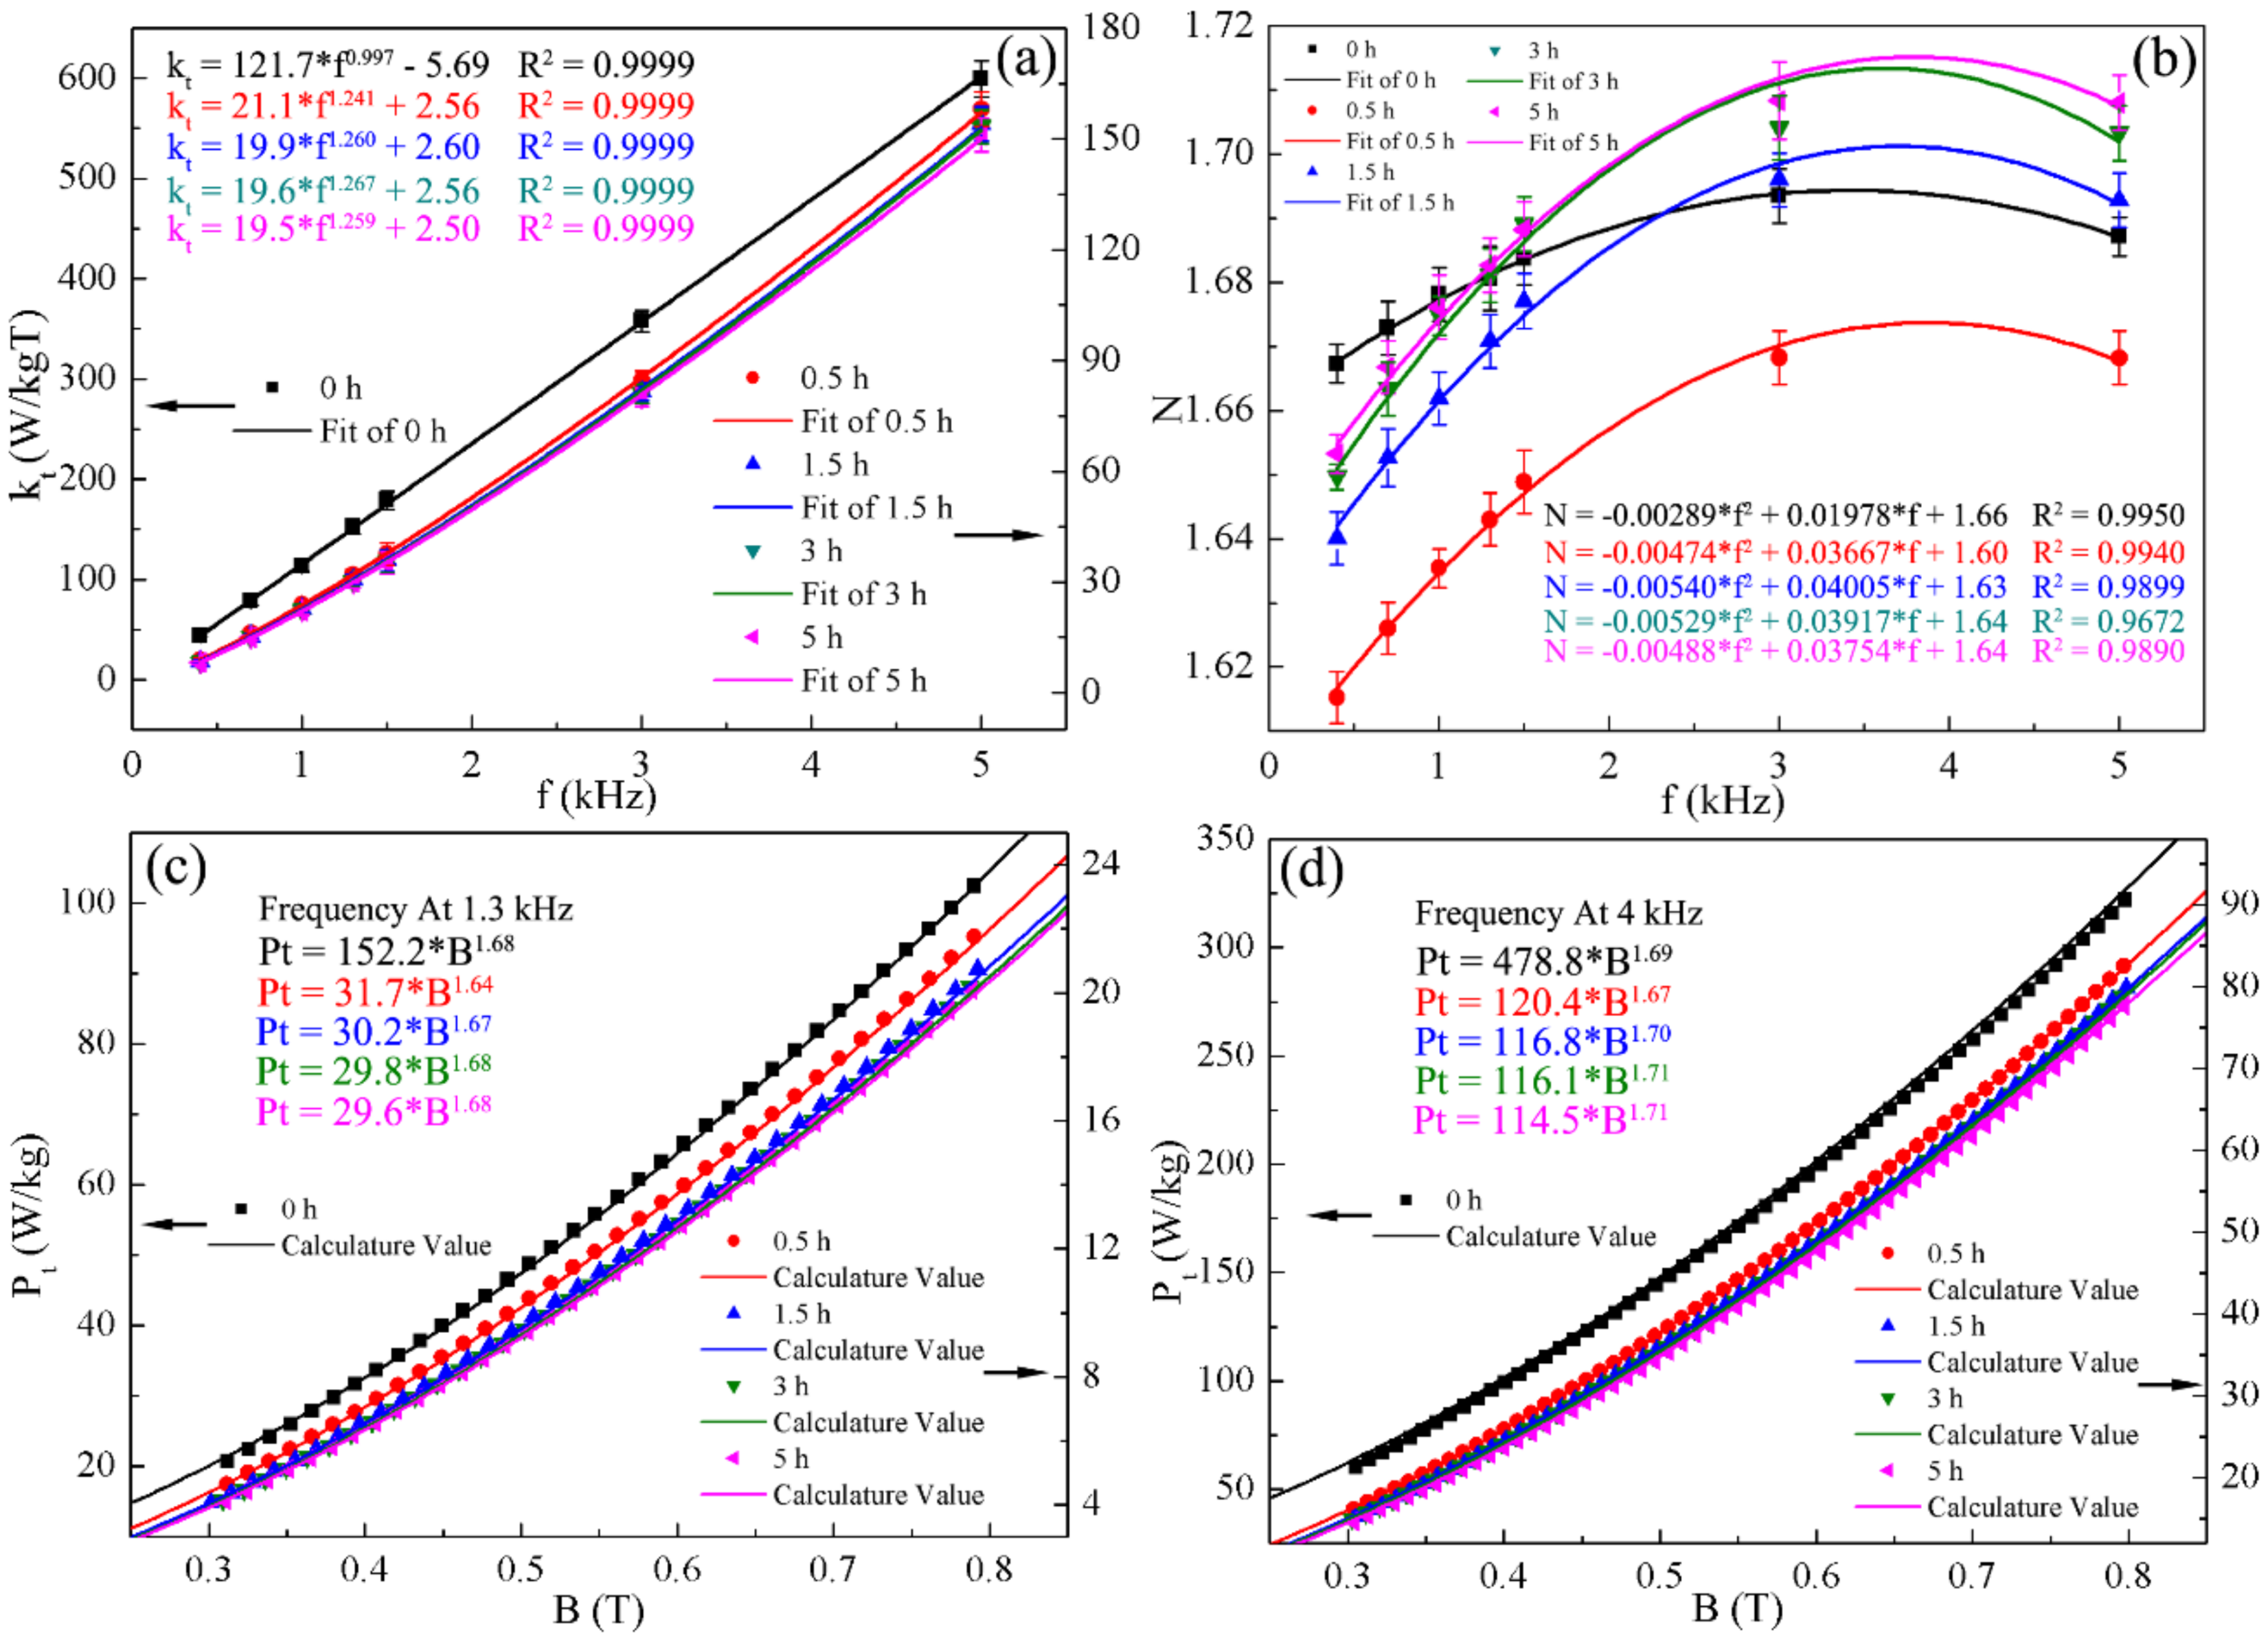
Figure 4a,b depict the results of “kt” and “N”. The different color formulas represent the fitting results of “kt” and “N” at different frequencies. Based on the fitting results, the values of “kt” and “N” can be calculated at other frequencies. Then, “kt” and “N” are taken into AC iron loss formula to predict the iron loss at other frequencies, such as 1.3 kHz, 4 kHz. From the Figure 4a,b fitting results, “kt” and “N” can be gained at 1.3 kHz, 4 kHz and core losses prediction results are shown in the Figure 4c,d. In order to verify the accuracy of the prediction, iron losses were tested and compared at 1.3 kHz and 4 kHz. From Figure 4c,d, the calculated value was found to be in good agreement with the actual test results.
In addition, the “AC Steinmetz law” ( P t = k a c B m n f α ) shows the total iron loss is affected by magnetic induction intensity and frequency. If this formula is used to predict the AC iron losses, first the exponent “n” value, “α” value and the coefficient “kac” should be fitted out from iron loss-magnetic induction intensity curves at a certain frequency or from iron loss-frequency curves at a certain magnetic induction intensity. However, at other frequency or magnetic induction intensity, the value of “n” and “α” will change and then the core loss cannot be calculated according to the “AC Steinmetz law” ( P t = k a c B m n f α ). Here, we integrate the variable “f” into the coefficient “kt” and the exponent “N” and determine the coefficient “kt” and the exponent “N” of the formula— P t = k t B m N by fitting. Further to find out the dependence of “kt” and “N” on the frequency by fitting. Thereby “kt” and “N” can be obtained in the certain frequency range and the iron loss can be predicted at other frequencies according to the formula— P t = k t B m N .
And when designing a core for using at a certain frequency or a certain frequency range, the core loss and magnetic induction intensity are important indicators. Based on some iron losses data and fitting results, designers can calculate iron losses at different frequencies according to the formula— P t = k t B m N . The design of magnetic induction intensity is not only related to the composition and structure of the magnetic material, but also to the upper limit of the design of the iron loss. According to the requirements of iron loss, designers can also calculate the design of magnetic induction intensity.

4. Conclusions

Magnetic properties of the melt-spun Fe-6.5 wt. % Si ribbons are investigated before and after heat treatment at 1000 °C. DC properties are greatly improved, as well as the iron loss in the frequency range of 400 Hz to 10 kHz. Above 10 kHz, the melt-spun ribbons exhibit a lower total iron loss compared with the annealed one.
A simplified formula based on the Steinmetz law is proposed and verified to predict the AC iron loss for high silicon steel ribbons in the range of 400 Hz to 5 kHz and the results are presented in this paper according to iron losses data, “kt” and “N” of the simplified formula— P t = k t B m N can be determined, and the AC iron losses can be predicted. The method developed in this work could be used for other magnetic materials to predict AC iron loss with ease.

Acknowledgments

Financial support from the National Natural Science Foundation of China (No. U1660115, 51471031 and 51301019) is gratefully acknowledged.

Author Contributions

All co-authors have contributed substantially to the paper. Shuai Wang conceived, designed, and performed the experiments; Biao Chen contributed to the magnetic properties test; Shuai Wang wrote the manuscript; Yongfeng Liang, Feng Ye, and Junpin Lin supervised the work.

Conflicts of Interest

The authors declare no conflict of interest.

References

  1. Bozorth, R.M. Ferromagnetism; Van Nostrand-Reinhold: New York, NY, USA, 1951; Volume 595, pp. 50–52. ISBN 0-7803-1032-2. [Google Scholar]
  2. Viala, B.; Degauque, J.; Baricco, M.; Ferrara, E.; Pasquale, M.; Fiorillo, F. Magnetic and mechanical properties of rapidly solidified Fe-Si 6.5 wt. % alloys and their interpretation. J. Magn. Magn. Mater. 1996, 160, 315–317. [Google Scholar] [CrossRef]
  3. Haiji, H.; Okada, K.; Hiratani, T.; Abe, M.; Ninomiya, M. Magnetic properties and workability of 6.5% Si steel sheet. J. Magn. Magn. Mater. 1996, 160, 109–114. [Google Scholar] [CrossRef]
  4. Li, H.; Liang, Y.F.; Ye, F. Effect of heat treatment on ordered structures and mechanical properties of Fe-6.5 mass % Si Alloy. Mater. Trans. 2015, 56, 759–765. [Google Scholar] [CrossRef]
  5. Liu, S.Q.; Cui, C.X.; Wang, X.; Li, N.; Shi, J.J.; Cui, S.; Chen, P. Effect of Cooling Rate on Microstructure and Grain Refining Behavior of In Situ CeB6/Al Composite Inoculant in Aluminum. Metals 2017, 7, 204. [Google Scholar] [CrossRef]
  6. Tan, X.; Li, H.Y.; Xu, H.; Han, K.; Li, W.D.; Zhang, F. A Cost-Effective Approach to Optimizing Microstructure and Magnetic Properties in Ce17Fe78B6 Alloys. Materials 2017, 10, 869. [Google Scholar] [CrossRef] [PubMed]
  7. Liang, Y.F.; Wang, S.; Li, H.; Jiang, Y.M.; Ye, F.; Lin, J.P. Fabrication of Fe-6.5 wt. % Si ribbons by melt spinning method on large scale. Adv. Mater. Sci. Eng. 2015, 2015, 296197. [Google Scholar] [CrossRef]
  8. Palmer, J.; Thompson, C.V.; Smith, H.I. Grain growth and grain size distributions in thin germanium films. J. Appl. Phys. 1987, 62, 2492–2497. [Google Scholar] [CrossRef]
  9. Steinmetz, C.P. On the law of hysteresis. Proc. IEEE 1984, 72, 197–221. [Google Scholar] [CrossRef]
  10. Kollár, P.; Olekšáková, D.; Vojtek, V.; Füzer, J.; Fáberová, M.; Bureš, R. Steinmetz law for ac magnetized iron-phenolformaldehyde resin soft magnetic composites. J. Magn. Magn. Mater. 2017, 424, 245–250. [Google Scholar] [CrossRef]
  11. Svensson, L.; Frogner, K.; Jeppsson, P.; Cedell, T.; Andersson, M. Soft magnetic moldable composites: Properties and applications. J. Magn. Magn. Mater. 2012, 324, 2717–2722. [Google Scholar] [CrossRef]
Figure 1. Iron losses corresponding to different conditions before after heat treatment; the inset represents the samples for test.
Metals 08 00259 g001
Figure 2. Free surface microstructure of Fe-6.5 wt. % Si ribbons (a) in the absence of heat treatment; (b) 1000 °C, 0.5 h; (c) 1000 °C, 1.5 h; (d) 1000 °C, 3 h; (e) 1000 °C, 5 h. (f) Grain size statistics.
Metals 08 00259 g002
Figure 3. DC iron losses (Ph) and AC iron losses (Pt) and fit results before and after heat treatment, (a) DC iron losses–magnetic induction curves, which has two y axes: the left vertical axis represents DC iron losses (Ph) before heat treatment and the right vertical axis represents DC iron losses (Ph) after heat treatment with different duration; (bf) AC iron losses–magnetic induction curves at different frequencies. R2 is the goodness of fit wherein, the closer the value is to 1, the better the fit is.
Metals 08 00259 g003
Figure 4. (a) AC iron loss coefficient kt and fit results; (b) AC iron loss factor N and fit results. The iron loss test result and calculation value at (c) 1.3 kHz frequency and (d) 4 kHz frequency. (a,c,d) have two y axes: the left vertical axe represents results before heat treatment and the right vertical axe represents results after heat treatment with different duration.
Metals 08 00259 g004
Table 1. DC properties of Fe-6.5 wt. % Si ribbons.
SampleμmB (T)Hc (A/m)
B8B50
0 h1843 ± 601.16 ± 0.021.55 ± 0.03237.6 ± 6.8
0.5 h10,589 ± 3111.31 ± 0.031.55 ± 0.0448.9 ± 1.6
1.5 h10,931 ± 3271.31 ± 0.041.55 ± 0.0346.6 ± 1.3
3 h11,082 ± 2951.31 ± 0.031.55 ± 0.0545.7 ± 1.0
5 h11,051 ± 3011.32 ± 0.041.56 ± 0.0445.3 ± 1.1