Microstructure and Properties of Semi-solid ZCuSn10P1 Alloy Processed with an Enclosed Cooling Slope Channel


1
Faculty of Material Science and Engineering, Kunming University of Science and Technology, Kunming 650093, China
2
Research Center for Analysis and Measurement, Kunming University of Science and Technology,
Kunming 650093, China
*
Author to whom correspondence should be addressed.
Metals 2018, 8(4), 275; https://doi.org/10.3390/met8040275
Submission received: 14 March 2018
/
Revised: 11 April 2018
/
Accepted: 16 April 2018
/
Published: 17 April 2018
(This article belongs to the Special Issue Semi-Solid Processing of Alloys and Composites)
Abstract
:Semi-solid ZCuSn10P1 alloy slurry was fabricated by a novel enclosed cooling slope channel (ECSC). The influence of pouring length of ECSC on the microstructures of ZCuSn10P1 alloy semi-solid slurry was studied with an optical microscope an optical microscope (OM), scanning electron microscope (SEM), X-ray diffraction (XRD) and energy dispersive spectrometer (EDS). Liquid squeeze casting and semi-solid squeeze casting were performed under the same forming conditions, and the microstructure and properties were compared. The results show that primary α-Cu phase gradually evolved from dendrites to worm-like or equiaxed grains under the chilling action of the inner wall of the ECSC. The mass fraction of tin in the primary α-Cu phase increased from 5.85 to 6.46 after the ECSC process, and intergranular segregation was effectively suppressed. The finest microstructure can be obtained at 300 mm pouring length of ECSC; the equivalent diameter is 46.6 μm and its shape factor is 0.73. The average ultimate tensile strength and average elongation of semi-solid squeeze casting ZCuSn10P1 alloy reached 417 MPa and 12.6%, which were improved by 22% and 93%, respectively, as compared to that of liquid squeeze casting.
1. Introduction
Tin bronze has excellent flexibility, wear resistance, corrosion resistance, and high strength, and is widely used in the ship-building industry and is important in gears, valves, worm gears, etc. [1,2,3]. However, the primary α-Cu phase is a coarse dendritic structure and the segregation of tin in traditional tin-bronze ZCuSn10P1 is significant [4], which leads to microstructural heterogeneity and poor properties, limiting its uses in industry. Therefore, it is very necessary to find a technology that can improve the uniformity of microstructures and properties.
Semi-solid process is widely studied due to its many technical and economic advantages; it includes rheo-casting and thixo-casting [5]. In recent years, rheo-casting has attracted the interest of many researchers, and there are several ways to prepare non-dendrite microstructures [6,7,8]. The cooling slope plate method is a simple way to prepare semi-solid slurry. Abdelsalam et al. [9] fabricated A356/Al2O3 metal matrix nano-composites by a combination of stir casting and cooling slope casting typically. The results show that the average grain size of samples fabricated is fine, the finer α-Al grains were obtained at the bottom of the ingots. However, the addition of Al2O3 nanoparticles did not significantly influence the shape factor of the primary α-Al grains. Das et al. [10] studied the microstructural evolution of semi-solid slurry generation of Al-Si-Cu-Fe alloy and the effect of microstructural morphology of the slurry on its rheological behavior. Yoshida et al. [11] studied the formation of hollow AZ31B magnesium alloy pipe made by vertical continuous casting using semi-solid slurry prepared on an inclined cooling plate. The results show that it was possible to make the pipe using both a taper mold and a core rod. However, holding at 650 °C of molten alloy has no tapering of the mold, and the core rod 1 mm crack appears on both outside and inside surface of the hollow material. Cit et al. [12] prepared the semi-solid slurry of tin bronze alloy by the slope plate method, and the effect of tin mass fraction on the microstructure of semi-solid slurry was studied. The results show that the size of primary α-Cu phase decreases with the increase of tin mass fraction. The size of the primary α-Cu phase is about 60 μm when the tin mass fraction reaches 3%. Kose et al. [13] prepared the semi-solid slurry of ZCuSn10P0.1 alloy by Shearing Cooling Roll (SCR). The effect of mold temperature on the tensile properties was studied. The results show that ZCuSn10P0.1 alloy was suitable for semi-solid process and an excellent semi-solid slurry can be prepared. The elongation of direct-squeeze casting parts was increased by 60% due to the improvement of tin segregation in the microstructure, the mold temperature at this time was 700 °C. According to the above study, it is known that there are few studies on semi-solid rheo-casting of ZCuSn10P1 copper alloys.
In this investigation, we attempted to make semi-solid slurry of ZCuSn10P1 with fine solid grains for rheo-casting, the influence of the pouring length of ECSC on the microstructures of ZCuSn10P1 alloy semi-solid slurry was studied. Subsequently, a shaft sleeve was obtained from the semi-solid slurry with a favorable solid morphology by squeeze casting. Effect of melt processing by ECSC on microstructure and properties of squeeze casting ZCuSn10P1 alloy were investigated.
2. Materials and Methods
2.1. Materials
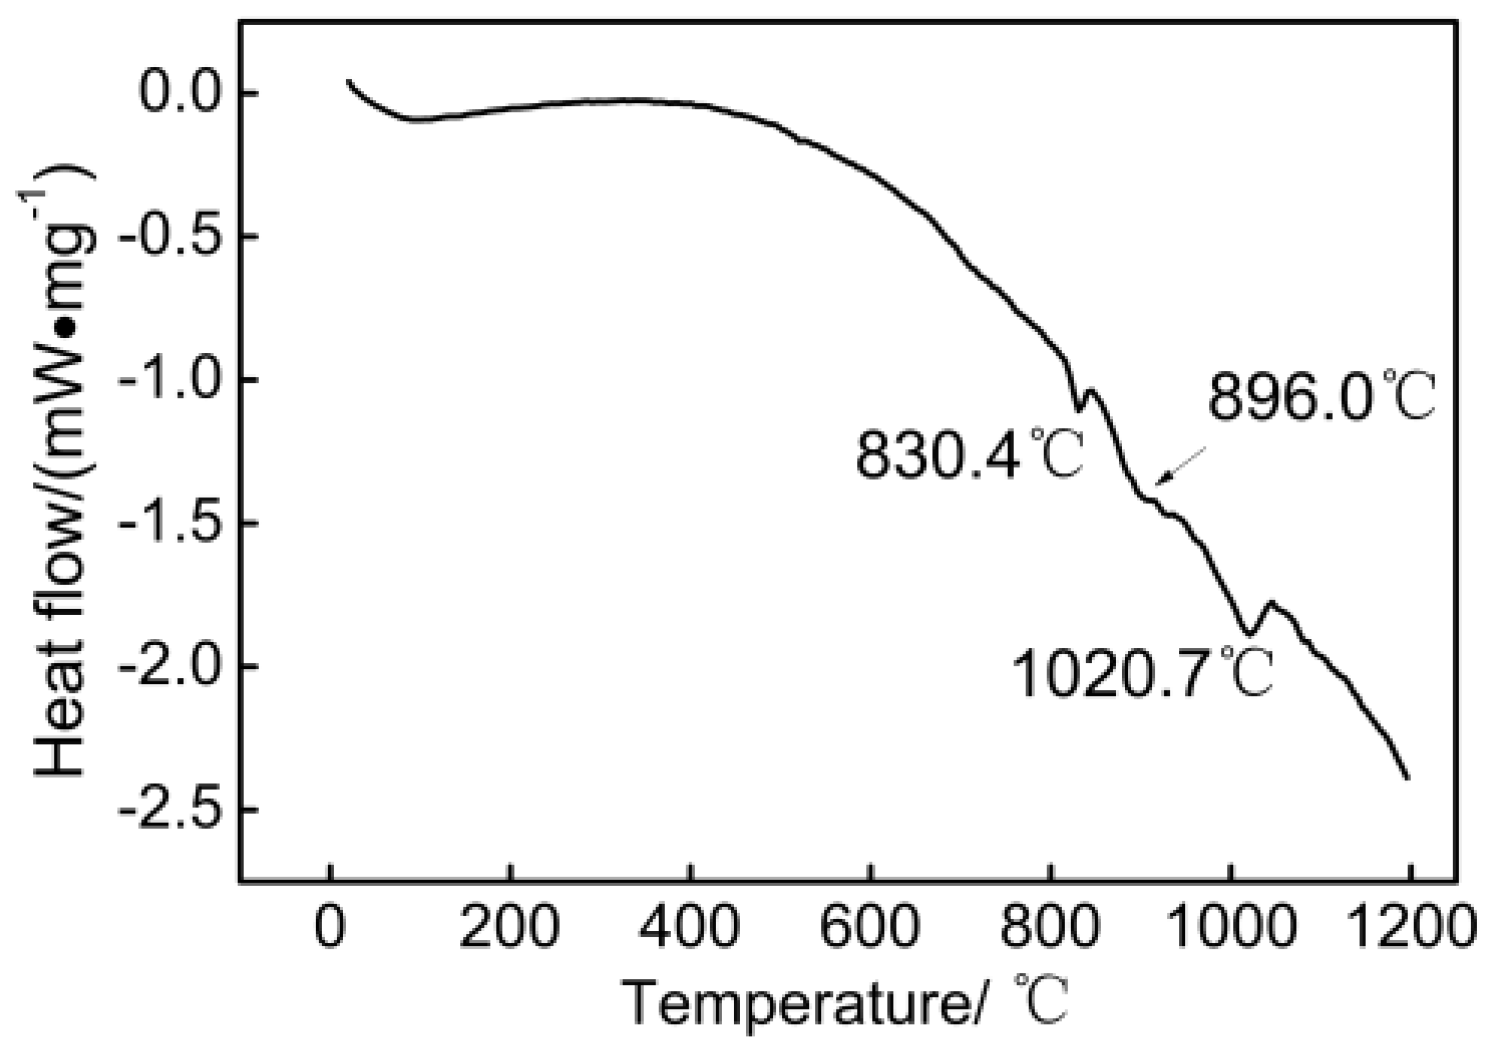
The chemical composition of the ZCuSn10P1 alloy used in this study is listed in Table 1. The alloy had liquidus and solidus temperatures of 1020.7 °C and 830.4 °C, respectively. Measurements by differential scanning calorimetry (STA 449F3, NETZSCH, Bavaria, Germany) were carried out on about 10 mg samples obtained from the as-cast alloys under an argon at a heating rate of 10 K·min−1, as shown in Figure 1.
2.2. Fabrication of the ZCuSn10P1 Alloy Semi-Solid Slurry
A schematic illustration of the ECSC equipment and forming process curve is shown in Figure 2. The slurry-making equipment consists of two parts: an enclosed cooling slope channel and an angle adjuster (Figure 2a). The channel thickness of metal flow was 5 mm [14]. The enclosed cooling slope channel was made from stainless steel and fixed at 45° with respect to the horizontal plane and was cooled by water circulation in the gap. The pouring length was set to different values in this investigation.
Fabrication of the ZCuSn10P1 alloy semi-solid slurry was carried out according to the following procedures (Figure 2b): about 6.5 kg of ZCuSn10P1 alloy in a graphite crucible was melted at 1200 ± 10 °C in a medium frequency induction furnace. After complete melting, the temperature dropped to 1080 °C and it was poured immediately into the ECSC. The ECSC casting of the ZCuSn10P1 involved pouring the melt over an enclosed cooling slope channel and its width is 100 mm. The prepared slurry was collected by a high-purity graphite crucible preheated to 950 °C to ensure that the temperature of the slurry was almost constant during the transfer process (Figure 2b).
By changing the pouring length of ECSC, the semi-solid slurry of ZCuSn10P1 alloy under different pouring length conditions was obtained. A 10 mm × 10 mm × 10 mm cube was removed from the slurry and water quenching immediately. The microstructure of these specimens was observed using an optical microscope. The number of primary α-Cu phases in the metallographic images under five different fields of view was counted to calculate the average value under each field of view. Then, the total number of per unit area based on the area of the field of view and the average number of primary α-Cu phases was calculated. Measurements of the equivalent diameter (D) and shape factor (F) of the primary α-Cu phase were carried out using image-analysis techniques [15]. The equivalent diameter (D) and shape factor (F) were determined from the following equations [15]:
where A is the area of primary α-Cu phase and p is the perimeter. We obtained them using the Image-pro plus (Media Cybernetics, Rockvile, MD, USA) software suite. At F = 1, the shape is a perfect circle.
2.3. Squeeze Casting
Mold map and the product of ZCuSn10P1 alloy are shown in Figure 3. Squeeze casting of the semi-solid was at pressure 100 MPa and speed 21 mm/s to obtain a four-cavity part, as shown in Figure 3a. The semi-solid slurry was prepared at a pouring length of 300 mm. Liquid squeeze casting at casting temperature 1050 °C was also carried out for comparison with semi-solid squeeze casting. The forming process parameters of liquid squeeze casting and semi-solid squeeze casting were the same. The mold temperature was 450 °C. As shown in Figure 3c, samples were taken from different positions A, B and C for microstructure observation and phase analysis. To accurately reflect the properties of different position in the part, we took four tensile samples symmetrically on both sides of the parting surface (Figure 3b). The average value of four tensile samples as the final property index was calculated. Mechanical properties of ZCuSn10P1 alloy parts were measured using a CMT300 tensile machine.
3. Results and Discussion
3.1. Influence of ECSC Process on the Microstructures of ZCuSn10P1 Alloy
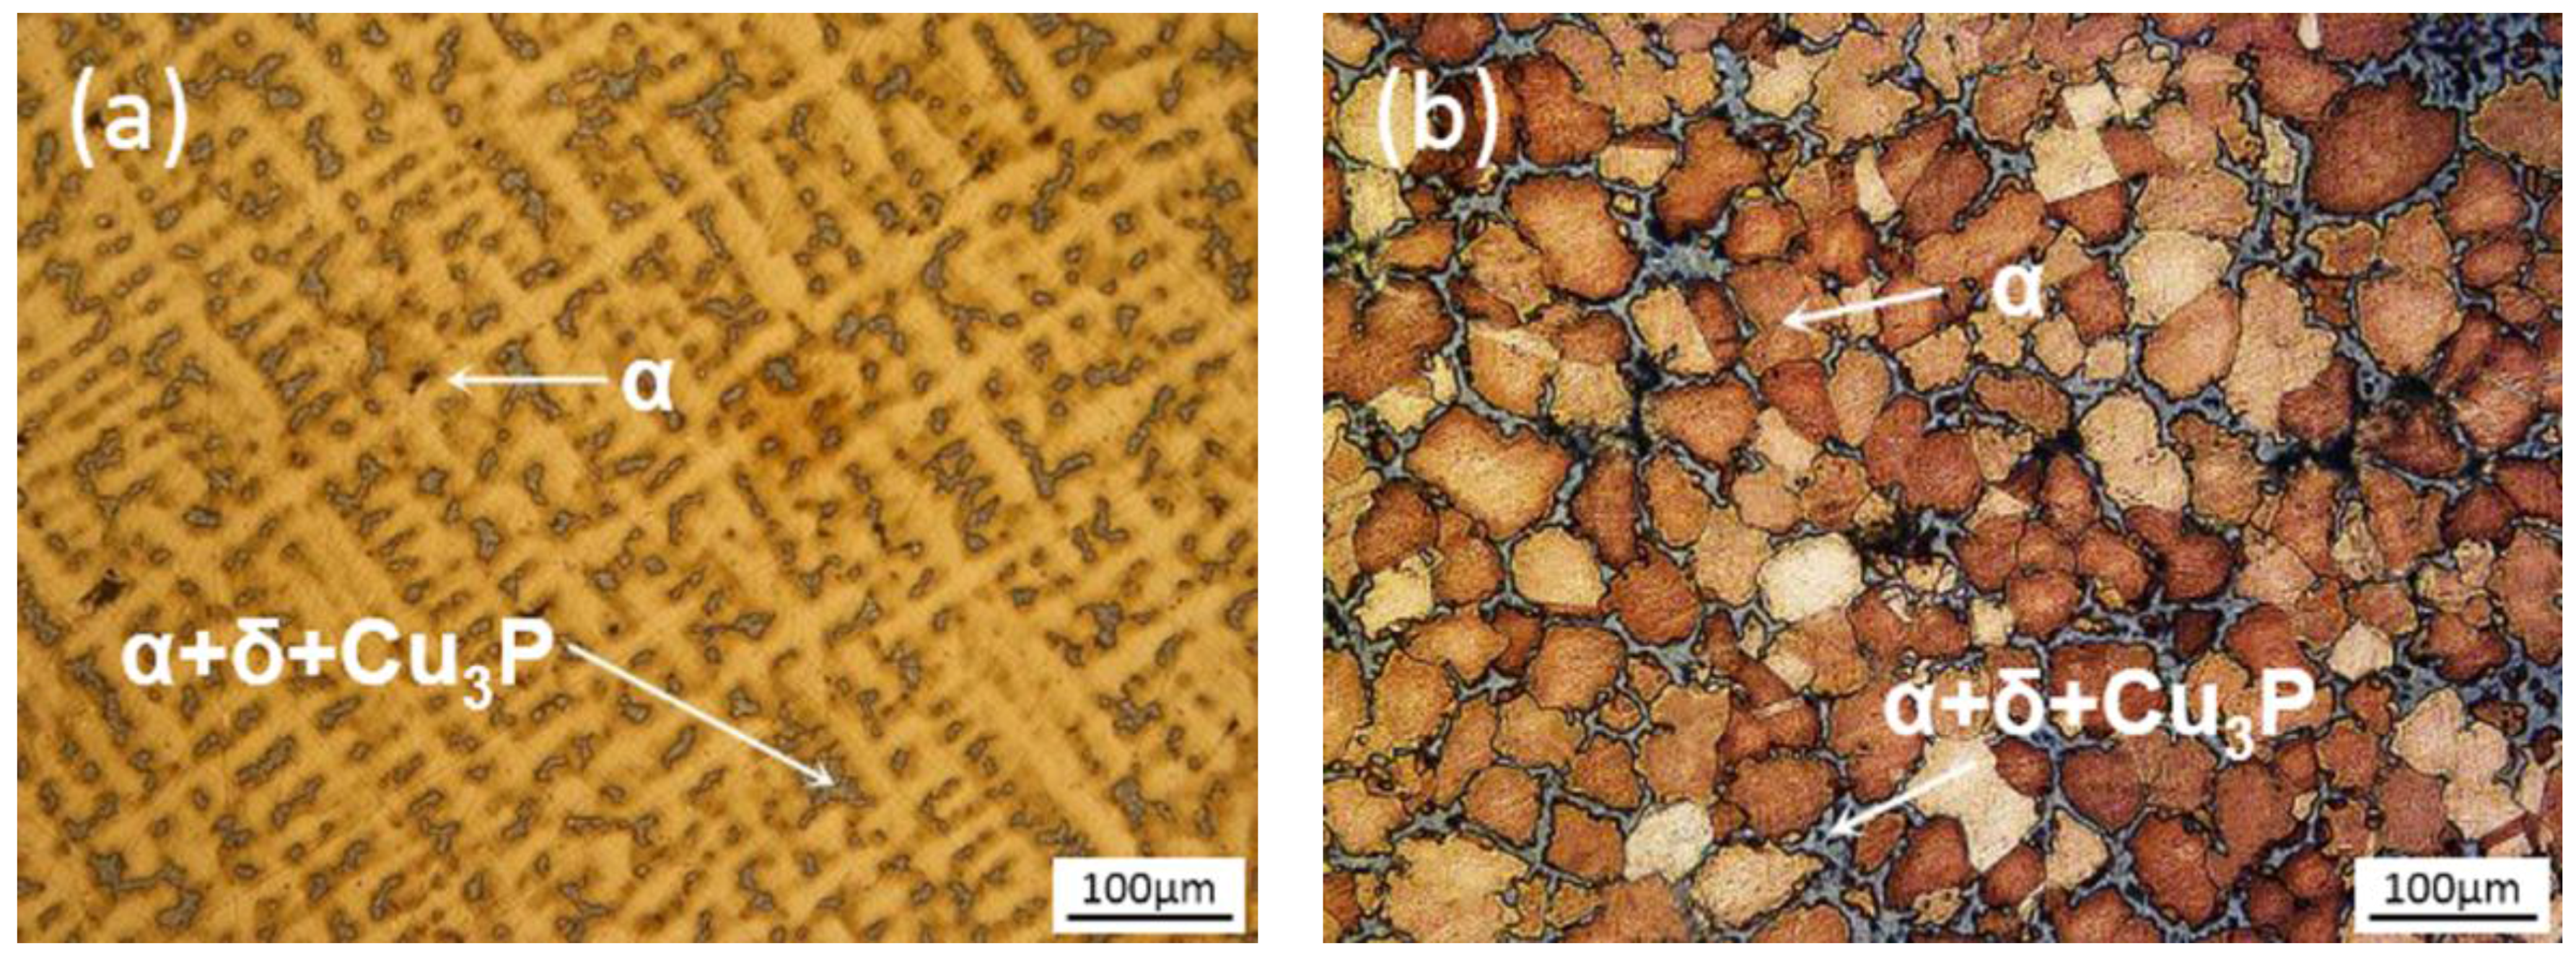
Figure 4 shows the as-cast microstructures and semi-solid slurry microstructures of ZCuSn10P1 alloy. The as-cast sample was obtained by direct water quenching of the molten at 1050 °C. The processing parameters of ECSC were a pouring temperature of 1080 °C, and the pouring length and angle of 300 mm and 45°, respectively. As can be seen, the two types of samples are mainly composed of primary α-Cu and (α+δ +Cu3P) phases. The primary α-Cu phase is the coarse mesh dendritic structure and the (α+δ +Cu3P) phase is distributed in the dendrite clearance in as-cast samples (Figure 4a). The primary α-Cu become worm-like grains or equiaxed grains by ECSC process (Figure 4b). The primary α-Cu was surrounded by a liquid phase, the solid grain filling together with the liquid phase in the process of forming improved the synergistic effect of solid-liquid flows. Note that the liquid content shown in the micrographs is not suggested: the number present at temperature because the quench rate is not rapid enough for the content of liquid to be entirely “frozen in” [16]. During the quench, some liquid deposits onto the solid, appearing to be “solid” in the quenched microstructure [16,17].
Phase identification was accomplished by comparison of the observed XRD peaks with published crystallographic data (JCPDS database, International Centre for Diffraction Data, Powder Diffraction Standards Joint Committee, Newtown Square, PA, USA). Figure 5 shows the XRD traces from as-cast and semi-solid slurry of the ZCuSn10P1 alloy. Primary α-Cu and δ-Cu31Sn8 were detected in as-cast sample and semi-solid sample; the Cu3P phase was not detected, but the Cu3P phase was nevertheless present [18]. Some peaks become weaker and wider (as shown in Figure 5, marked “2”), indicating that the grains were more refined (see also Figure 4).
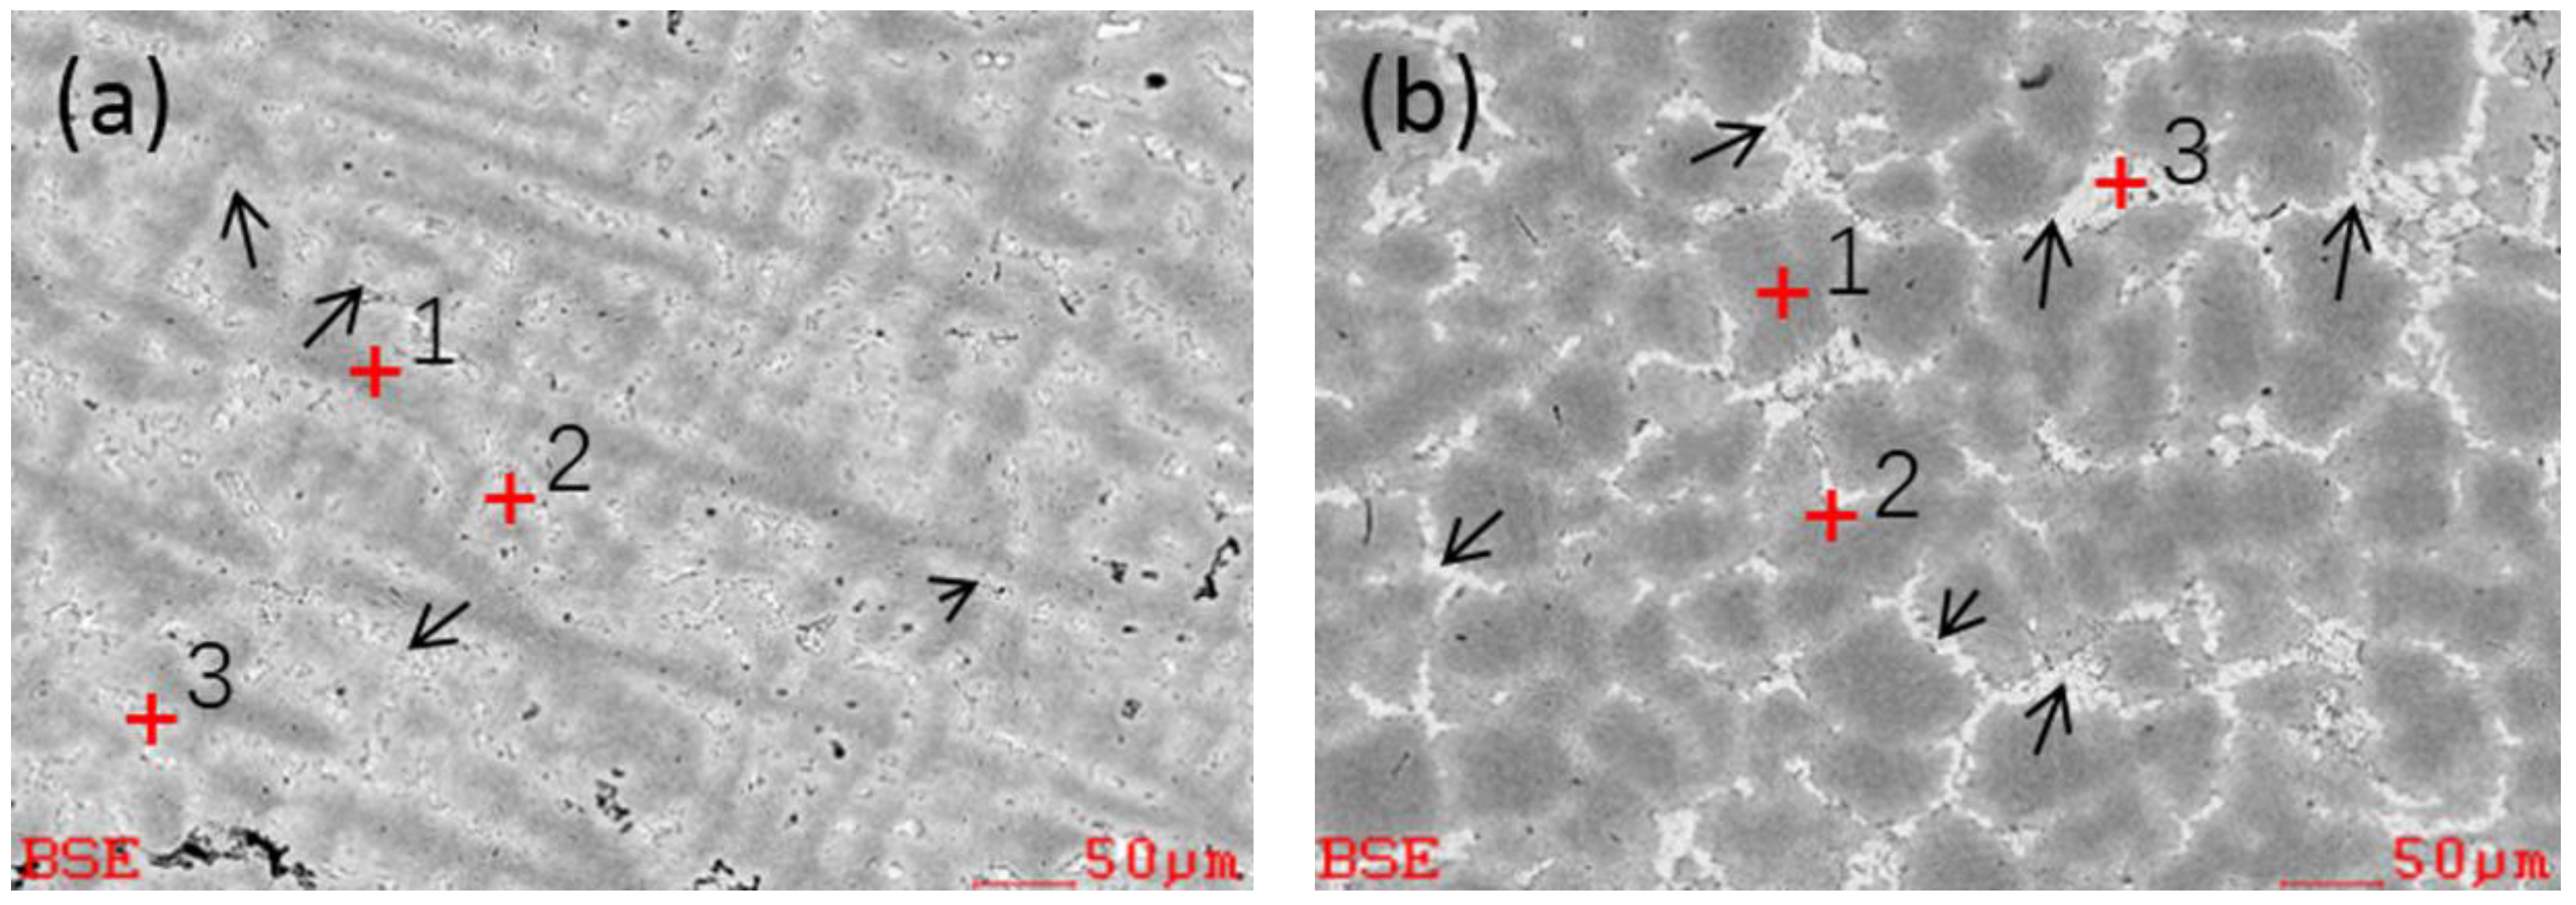
Figure 6 shows the as-cast and semi-solid slurry SEM micrograph of ZCuSn10P1 alloy. They are composed of three regions due to the different tin mass fraction (dark grey areas, light grey areas, and bright white areas). The points showing EDS are marked in Figure 6 and the EDS results are listed in Table 2. The tin mass fraction gradually increases as the color becomes lighter, as indicated by the arrows in Figure 6. The EDS results contrast the as-cast and semi-solid slurry: the tin mass fraction in the α-Cu phase of semi-solid slurry is higher than the as-cast, and the tin mass fraction in the liquid phase of the semi-solid is lower than the as-cast, indicating that the distribution of tin is relatively uniform in the semi-solid slurry and less segregated. Some peak shift (as shown in Figure 5, marked “1”) indicated that the solid solubility of tin has changed (consistent with Table 2). The Cu3P phase is lamellar structure and distributed on the edge of the primary α-Cu phase [18]. It may be affected by the Cu3P phase when measuring two- or three-point energy spectrum, and shows the accumulation of P near primary α-Cu phase.
3.2. Influence of Pouring Length on the Microstructure of the ZCuSn10P1 Semi-solid Slurry.
The pouring length directly affects the cooling length of the alloy on the cooling plate, so it is an important factor affecting the microstructure. When the pouring temperature is constant at 1080 °C and the pouring length is 200 mm, the alloy melt flows through the cooling channel rapidly, thus the cooling time is shorter. The number of nucleation sites decreases and the melt temperature is higher. The microstructure was mainly worm-like and dendrite-like, as shown in Figure 7a. With pouring length increased to 300 mm, the flow time of the melt in the cooling channel increases. The number of nucleation sites increases, and the temperature is more uniform. The microstructure is basically composed of worm-like grains or equiaxed grains due to suppression of the formation of dendrite structures, as shown in Figure 7b. However, with the increase of the pouring length to 400 mm, the flow time in the cooling channel is further increased. The primary α-Cu phase is finer and rounder due to the increase in pouring cooling length, as shown in Figure 7c. The temperature of the melt at the exit of the cooling channel is very low due to the increase of the pouring cooling length. It is easier to form crusts inside the cooling channel, which is not conducive to the preparation of a semi-solid slurry.
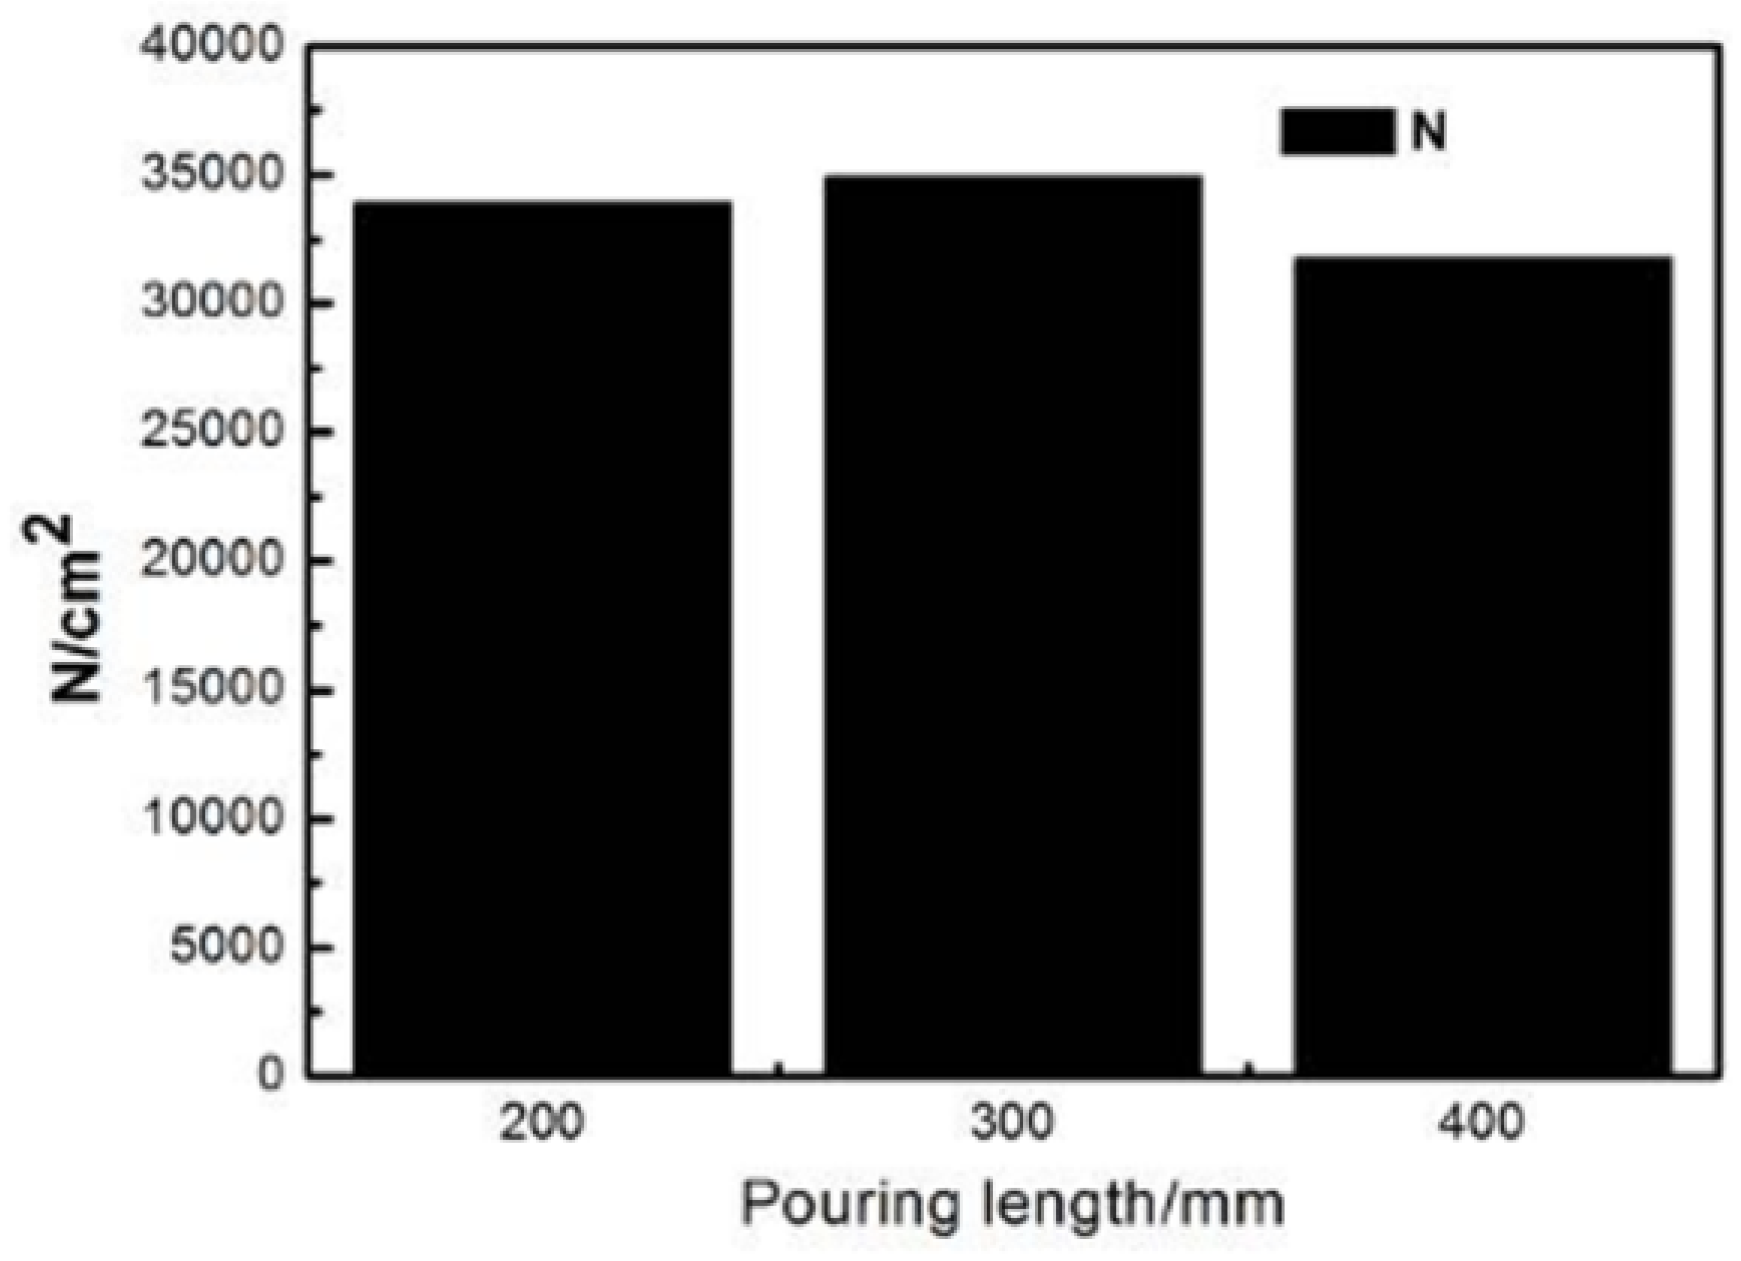
Figure 8 shows the relationship between equivalent diameter and shape factor of the primary α-Cu phase with pouring length (Figure 8a), and distribution of primary α-Cu phase equivalent diameter (Figure 8b) at different pouring lengths of semi-solid ZCuSn10P1 alloy. Figure 9 shows the relationship between the amount of primary α-Cu phase per unit area and pouring length in semi-solid ZCuSn10P1 alloy. In Figure 8 and Figure 9, it can be found that the equivalent diameter of the primary α-Cu grains was 50 μm and the shape factor was 0.72 when the casting temperature was constant at 1080 °C and the pouring length was 200 mm. The equivalent diameters are mainly in the range of 30 μm to 60 μm, but there are also some larger grain diameters exceeding 100 μm. At this point, the number of grains per square centimeter of primary α-Cu phase is about 33,939 and the solid fraction is about 63.58% after quenching. The equivalent diameter of primary α-Cu grains is 46.6 μm and the shape factor is 0.73 when the pouring length is 300 mm. The number of grains with an equivalent diameter between 20 μm and 60 μm, accounting for 83% of the total number of grains. At this point, the number per square centimeter of primary α-Cu phase grains is maximum about 34,909 and the solid fraction was 66.34% after water-quenching. The equivalent diameter of primary α-Cu phase grains increased to 53.2 μm and the shape factor decreased to 0.68 when the pouring length was 400 mm. The size of primary α-Cu phases is mainly distributed within 40 μm and 70 μm, accounting for 78.8% of the total number grains. The number per square centimeter of primary α-Cu phase grains was 31,757 and the solid fraction was 75.3% after water-quenching. The actual solid fraction calculated is much higher than the theoretical solid fraction [16,17].
Figure 10a shows a schematic diagram of the Crystal Separation Theory [19] and Figure 10b shows the shear stress and velocity distribution of the melt during flow through the ECSC process. Many primary α-Cu phases are nucleated on the surface of the cooling plate due to the melt chilling effect when the liquid metal is poured onto a cooling slope plate [19]. The crystal nucleus and the cooling plate are detached into the interior of the solution under the action of the melt flow. The surface of the cooling slope plate forms new nuclei again so that the downstream liquid melt becomes the semi-solid slurry. Therefore, the formation of slurry is related to the temperature field and the velocity field. The cooling channel thickness of ECSC is only 5 mm, which means the temperature field and the velocity field are relatively uniform. The semi-solid slurry with equiaxed or worm-like grains is finally formed under the combined action of heterogeneous nucleation and homogeneous nucleation.
In summary, the pouring length determines the flow time through the cooling channel, too short or too long time cannot prepare excellent semi-solid slurry. There is not enough time for chilling when the pouring length is too short (200 mm). The melt chilling time is too long and it is not conducive to prepare of semi-solid slurry when the pouring length is too long (400 mm). To ensure that the melt has a certain chilling time and the fine semi-solid slurry can be prepared continuously, the recommended pouring length in this paper is 300 mm.
3.3. Rheo-Casting
Figure 11 shows the comparison of microstructures of ZCuSn10P1 alloy parts obtained by liquid squeeze casting and semi-solid squeeze casting. It can be found that liquid squeeze casting is made up of coarse dendrites or mesh and large area eutectoid phase segregation. This sort of microstructure would be detrimental to mechanical properties. During liquid squeeze casting, liquid metal was adopted. The squeeze casting mold and liquid metal had a huge temperature differential, which led to a large temperature gradient; therefore, coarse dendrites are easily formed in the alloy. At once, eutectoid phase could solidify rapidly due to high cooling rate. Moreover, the micro-segregation also occurred in the parts. It can be seen that dendritic at position A is relatively less than at position B, and minimum at position C. The different filling sequence of these positions leads to different solidification speed and cooling rate (Figure 3a). Filling mouth away from position A, the temperature of alloy was higher and the mold temperature was lower at position A. Thus, the solidification speed is fastest at position A, and slowest at position C.
However, it is discovered that the microstructures of ZCuSn10P1 alloy parts prepared by semi-solid squeeze casting is made up of worm-like or equiaxed grains and eutectoid structure. The average size of grains of semi-solid squeeze casting is finer than that of liquid squeeze casting. Microstructures at position A and B have almost no difference, therefore, the average size of grains and grain shape are almost the same. In addition, eutectoid phase segregation almost disappears. However, grain size at position C is bigger than at positions A and B, and solid fraction is higher than at positions A and B. The reason is that the filling sequence of these positions are different (Figure 3a), resulting in different solidification speed and cooling rate. The uniformity of semi-solid squeeze casting has been greatly improved compared to liquid squeeze casting, which reveals that melt processing by ECSC process has a significant effect. Semi-solid squeeze casting process and liquid squeeze casting have different solidification modes. Semi-solid squeeze casting process consists of two solidification stages, namely in the enclosed cooling slope channel and in the mold. However, liquid squeeze casting only has solidification in the mold. Semi-solid alloy had a relatively higher solid fraction than liquid alloy, so the cooling rate in the mold was slower, and the solidification was much closer to equilibrium solidification in the mold, thus suppressing microstructure segregation.
Table 3 shows ultimate tensile strengths and elongations of ZCuSn10P1 alloy parts produced by liquid squeeze casting and semi-solid squeeze casting for different positions. The average ultimate tensile strengths of ZCuSn10P1 alloy parts prepared by semi-solid squeeze casting reach 417 MPa and the average elongation reach 12.56%. The average ultimate tensile strengths of ZCuSn10P1 alloy parts prepared by liquid squeeze casting reach 342 MPa and average the elongation reach 6.5%. We can see that the average ultimate tensile strength and average elongation of ZCuSn10P1 alloy by semi-solid squeeze casting are higher than liquid squeeze casting. The average ultimate tensile strength and average elongation are improved by 22% and 93%, respectively, as compared to that of liquid squeeze casting. This is attributed to the grain refinement and homogeneity of microstructure. Therefore, the squeeze casting combined with the ECSC process is an effective technique to prepare tin bronze alloy sleeve with good mechanical properties.
4. Conclusions
The conclusions obtained from the present study are described below:
- The processing by ECSC can refine grain size and suppress tin segregation as well as regional segregation which usually appears in liquid squeeze casting. The mass fraction of tin in the primary α-Cu phase increased from 5.85 to 6.46 after the ECSC process.
- The pouring length of ECSC process is an important factor affecting the microstructure and successful preparation of semi-solid slurry. The optimal pouring length is 300 mm; at this time, the equivalent diameter of primary α-Cu is 46.6 μm and its shape factor is 0.73.
- The average ultimate tensile strength and average elongation of semi-solid squeeze casting ZCuSn10P1 alloy reached 417 MPa and 12.6%, which were improved by 22% and 93%, respectively, as compared to that of liquid squeeze casting. This is attributed to the grain refinement and homogeneity of microstructure.
Acknowledgments
The authors acknowledge funding for the research from National Science Foundation of China (51765026 and 51665024). This work is supported by National-local Joint Engineering Laboratory of Metal Advanced Solidification Forming and Equipment Technology of China.
Author Contributions
Rongfeng Zhou and Yongkun Li designed most of the experiments, analyzed the results and wrote this manuscript. Yongkun Li and Lu Li performed most experiments. Han Xiao and Yehua Jiang helped analyze the experiment data and gave some constructive suggestions about how to write this manuscript.
Conflicts of Interest
The authors declare no conflict of interest.
References
- Charles, J.A. The development of the usage of tin and tin-bronze: some problems. In The Search for Ancient Tin; Smithsonian Institution: Washington, DC, USA, 1978; pp. 25–32. [Google Scholar]
- Afshari, E.; Ghambari, M.; Farhangi, H. Effect of microstructure on the breakage of tin bronze machining chips during pulverization via jet milling. Int. J. Min. Met. Mater. 2016, 23, 1323–1332. [Google Scholar] [CrossRef]
- Walsh, F.C.; Low, C.T.J. A review of developments in the electrodeposition of tin-copper alloys. Surf. Coat. Technol. 2016, 304, 246–262. [Google Scholar] [CrossRef]
- Kodama, H.; Nagase, K.; Umeda, T.; Sugiyama, M. Microsegregation during dendritic growth in Cu-8% Sn alloys. J. Jpn. Foundry Eng. Soc. 1976, 49, 287–293. [Google Scholar]
- Jorstad, J.L. Semi-Solid Metal Processing from an Industrial Perspective; The Best is yet to Come! Solid State Phenom. 2016, 256, 9–14. [Google Scholar] [CrossRef]
- Hassas-Irani, S.B.; Zarei-Hanzaki, A.; Bazaz, B.; Roostaei, A.A. Microstructure evolution and semi-solid deformation behavior of an A356 aluminum alloy processed by strain induced melt activated method. Mater. Des. 2013, 46, 579–587. [Google Scholar] [CrossRef]
- Yurko, J.A.; Martinez, R.A.; Flemings, M.C. Commercial development of the semi-solid rheocasting (SSRTM) process. Metall. Sci. Technol. 2013, 21, 10–15. [Google Scholar]
- Hofmann, D.C.; Kozachkov, H.; Khalifa, H.E.; Schramm, J.P.; Demtriou, M.D.; Vecchio, K.S.; Johnson, W.L. Semi-solid induction forging of metallic glass matrix composites. JOM 2009, 61, 11. [Google Scholar] [CrossRef]
- Abdelsalam, A.A.; Mahmoud, T.S.; El-Betar, A.A.; EI-Assal, A.M. A Study of Microstructures Characteristics of A356-Al2O3 Composites Produced by Cooling Slope and Conventional Stir Cast. Int. J. Curr. Eng. Technol. 2015, 15, 3560–3571. [Google Scholar]
- Das, P.; Samanta, S.K.; Bera, S.; Dutta, P. Microstructure Evolution and Rheological Behavior of Cooling Slope Processed Al-Si-Cu-Fe Alloy Slurry. Metall. Mater. Trans. A 2016, 47, 2243–2256. [Google Scholar] [CrossRef]
- Yoshida, R.; Motoyasu, G.; Motegi, T. Production of Continuous Casting Pipe Using Semi-solid Slurry of Magnesium Alloy. Trans. Mater. Res. Soc. Jpn. 2015, 40, 169–174. [Google Scholar] [CrossRef]
- Cit, M.T.; Tanabe, F. New semi-solid casting of copper alloys using an inclined cooling plate. In Proceedings of the 8th International Conference on Semi-Solid Processing of Alloys and Composites, Limassol, Cyprus, 21–23 September 2004. [Google Scholar]
- Kose, T.; Uetani, Y.; Nakajima, K.; Matsuda, K.; Lkeno, S. Effect of die temperature on tensile property of rheocast phosphor bronze. Mater. Sci. Forum 2012, 706, 931–936. [Google Scholar] [CrossRef]
- Zhao, Z.Y.; Guan, R.G.; Wang, X.; Huang, H.Q.; Chao, R.Z.; Dong, L.; Liu, C.M. Boundary layer distributions and cooling rate of cooling sloping plate process. Wuhan Univ. Technol. Mater. Sci. Ed. 2013, 28, 701–705. [Google Scholar] [CrossRef]
- Das, P.; Dutta, S.; Samanta, S.K. Evaluation of primary phase morphology of cooling slope cast Al-Si-Mg alloy samples using image texture analysis. Proc. Inst. Mech. Eng. B J. Eng. Manuf. 2013, 227, 1474–1483. [Google Scholar] [CrossRef]
- Atkinson, H.V.; Liu, D. Microstructural coarsening of semi-solid aluminium alloys. Mater. Sci. Eng. A 2008, 496, 439–446. [Google Scholar] [CrossRef]
- Tzimas, E.; Zavaliangos, A. Evolution of near-equiaxed microstructure in the semi-solid state. Mater. Sci. Eng. A 2000, 289, 228–240. [Google Scholar] [CrossRef]
- Davis, J.R. ASM Specialty Handbook: Copper and Copper Alloys; ASM International: Geauga County, OH, USA, 2008; pp. 1–600. [Google Scholar]
- Ohno, A.; Motegi, T.; Soda, H. Origin of the equiaxed crystals in castings. Trans. Iron Steel Inst. Jpn. 1971, 11, 18–23. [Google Scholar]
Figure 1.
DSC heating curve of as-cast ZCuSn10P1 alloy.

Figure 2.
Schematic illustration of the: (a) ECSC equipment; (b) forming process curve; and (c) temperature recording curve during slurry transfer ① ECSC process, ② slurry transfer, ③ mold filling,④ holding pressure, ⑤ parts air cooling.
Figure 2.
Schematic illustration of the: (a) ECSC equipment; (b) forming process curve; and (c) temperature recording curve during slurry transfer ① ECSC process, ② slurry transfer, ③ mold filling,④ holding pressure, ⑤ parts air cooling.

Figure 3.
Mold map and the product of ZCuSn10P1 alloy: (a) mold map; and (b,c) squeeze part (A, B and C are sampling positions for microstructure observation, while D is sampling position and shape for tensile test, 1 to 4 are sampling positions for tensile test from above the parting surface to below the parting surface).

Figure 4.
Microstructures of ZCuSn10P1 alloy: (a) as-cast; and (b) semi-solid.

Figure 5.
XRD spectrum of ZCuSn10P1 alloy.

Figure 6.
SEM micrograph of ZCuSn10P1 alloy: (a) as-cast; and (b) semi-solid.

Figure 7.
Microstructures of ZCuSn10P1 alloy at different pouring lengths at a pouring temperature of 1080 °C: (a) 200 mm; (b) 300 mm; and (c) 400 mm.
Figure 7.
Microstructures of ZCuSn10P1 alloy at different pouring lengths at a pouring temperature of 1080 °C: (a) 200 mm; (b) 300 mm; and (c) 400 mm.

Figure 8.
Relationship between equivalent diameter and shape factor of primary α-Cu phase with pouring length (a); and distribution of primary α-Cu phase equivalent diameter (b) at different pouring lengths of semi-solid ZCuSn10P1 alloy.
Figure 8.
Relationship between equivalent diameter and shape factor of primary α-Cu phase with pouring length (a); and distribution of primary α-Cu phase equivalent diameter (b) at different pouring lengths of semi-solid ZCuSn10P1 alloy.

Figure 9.
Relationship between number of primary α-Cu phase per unit area and pouring length in semi-solid ZCuSn10P1 alloy.
Figure 9.
Relationship between number of primary α-Cu phase per unit area and pouring length in semi-solid ZCuSn10P1 alloy.

Figure 10.
Schematic diagram of: (a) the mechanism of neck formation of α-Cu grains; and (b) principle of generation of new semi-solid slurry using the ECSC.
Figure 10.
Schematic diagram of: (a) the mechanism of neck formation of α-Cu grains; and (b) principle of generation of new semi-solid slurry using the ECSC.

Figure 11.
Comparison of microstructures of ZCuSn10P1 alloy parts obtained by liquid squeeze casting and semi-solid squeeze casting.
Figure 11.
Comparison of microstructures of ZCuSn10P1 alloy parts obtained by liquid squeeze casting and semi-solid squeeze casting.


Table 1.
Chemical composition of ZCuSn10P1 alloy (mass %).
| Cu | Sn | P | Other |
|---|---|---|---|
| 88.90 | 10.22 | 0.71 | 0.17 |
Table 2.
EDS results for the microstructure of the as-cast and semi-solid ZCuSn10P1 alloy.
| Element | As-Cast | Semi-Solid | ||||||||||
|---|---|---|---|---|---|---|---|---|---|---|---|---|
| 1 | 2 | 3 | 1 | 2 | 3 | |||||||
| Wt. % | At. % | Wt. % | At. % | Wt. % | At. % | Wt. % | At. % | Wt. % | At. % | Wt. % | At. % | |
| Cu | 93.79 | 96.04 | 79.25 | 78.46 | 71.53 | 81.68 | 93.22 | 95.78 | 84.6 | 90.30 | 70.69 | 70.47 |
| Sn | 5.85 | 3.21 | 13.73 | 7.28 | 27.94 | 17.08 | 6.46 | 3.56 | 14.85 | 8.48 | 20.59 | 11.83 |
| P | 0.36 | 0.75 | 7.02 | 14.26 | 0.53 | 1.24 | 0.32 | 0.66 | 0.56 | 1.22 | 8.71 | 17.7 |
Table 3.
Ultimate tensile strengths and elongations of ZCuSn10P1 alloy parts produced by semi-solid squeeze casting and liquid squeeze casting for different positions.
Table 3.
Ultimate tensile strengths and elongations of ZCuSn10P1 alloy parts produced by semi-solid squeeze casting and liquid squeeze casting for different positions.
| Process | Mechanical Properties | Positions | Average Value | |||
|---|---|---|---|---|---|---|
| 1 | 2 | 3 | 4 | |||
| Semi-solid squeeze casting | Ultimate tensile strength/MPa | 411 | 420 | 422 | 415 | 417 |
| Elongation/% | 12.03 | 12.96 | 13.07 | 12.18 | 12.56 | |
| Liquid squeeze casting | Ultimate tensile strength/MPa | 325 | 352 | 358 | 333 | 342 |
| Elongation/% | 5.5 | 7.43 | 7.87 | 5.2 | 6.5 | |
© 2018 by the authors. Licensee MDPI, Basel, Switzerland. This article is an open access article distributed under the terms and conditions of the Creative Commons Attribution (CC BY) license (http://creativecommons.org/licenses/by/4.0/).
Share and Cite
MDPI and ACS Style
Li, Y.; Zhou, R.; Li, L.; Xiao, H.; Jiang, Y. Microstructure and Properties of Semi-solid ZCuSn10P1 Alloy Processed with an Enclosed Cooling Slope Channel. Metals 2018, 8, 275. https://doi.org/10.3390/met8040275
AMA Style
Li Y, Zhou R, Li L, Xiao H, Jiang Y. Microstructure and Properties of Semi-solid ZCuSn10P1 Alloy Processed with an Enclosed Cooling Slope Channel. Metals. 2018; 8(4):275. https://doi.org/10.3390/met8040275
Chicago/Turabian StyleLi, Yongkun, Rongfeng Zhou, Lu Li, Han Xiao, and Yehua Jiang. 2018. "Microstructure and Properties of Semi-solid ZCuSn10P1 Alloy Processed with an Enclosed Cooling Slope Channel" Metals 8, no. 4: 275. https://doi.org/10.3390/met8040275
Note that from the first issue of 2016, this journal uses article numbers instead of page numbers. See further details here.