Evaluation of Failure Pressure for Gas Pipelines with Combined Defects
by
 , and
, and
Tadas Vilkys
1, 
Vitalijus Rudzinskas
2,
Olegas Prentkovskis
3,*,
Jurijus Tretjakovas
4,
Nikolaj Višniakov
2 and
Pavlo Maruschak
5 1
Vilpros Pramonė, UAB, Vilniaus g. 11, Izabelinė LT-14200, Lithuania
2
Department of Mechanical and Material Engineering, Faculty of Mechanics, Vilnius Gediminas Technical University, J. Basanavičiaus g. 28, Vilnius LT-03224, Lithuania
3
Department of Mobile Machinery and Railway Transport, Faculty of Transport Engineering, Vilnius Gediminas Technical University, Plytinės g. 27, Vilnius LT-10105, Lithuania
4
Department of Applied Mechanics, Faculty of Civil Engineering, Vilnius Gediminas Technical University, Saulėtekio al. 11, Vilnius LT-10223, Lithuania
5
Department of Industrial Automation, Ternopil National Ivan Pul’uj Technical University, Rus’ka str. 56, Ternopil 46001, Ukraine
*
Author to whom correspondence should be addressed.
Metals 2018, 8(5), 346; https://doi.org/10.3390/met8050346
Submission received: 11 March 2018
/
Revised: 7 May 2018
/
Accepted: 8 May 2018
/
Published: 11 May 2018
(This article belongs to the Special Issue Mechanical Behavior of High-Strength Low-Alloy Steels)
Abstract
:The paper presents the study of the influence of mechanical damage on the safe operation of gas transmission pipelines. The main types of pipeline damage with the actual parameters and their influence on the operational parameters are analysed. The damaged fractures of the section of the pipeline Kaunas (Lithuania)–Kaliningrad (Russia) were investigated in the laboratory. The main operational characteristics and the structure of the pipeline’s metal after the period of long-term operation were determined using various research and experimental methods. The influence of the pipeline’s damage was modelled by using the Finite Element Method and the ANSYS code. The predictions of the failure pressure were made, taking into consideration the actual properties of the pipeline’s metal. Techniques including the hardness and microhardness measurement, chemical analysis, the impact strength test, and metallography analysis with an optical microscope, were used in the experimental study.
1. Introduction
Lithuania has a well-developed gas pipeline network, which is continuously being improved. However, most of the gas transmission pipelines were laid when Lithuania was a part of the Soviet Union. In the European Union, some of the trunks were laid underground. The total length of the gas pipelines in the Soviet Union in 1970 was 70 thousand kilometres, while in 1986, it reached 174 thousand kilometres [1,2]. Most of the pipes used for the trunks in the Soviet Union were the first- generation pipes made of normalised steel 17G1S GOST 19281-73 (1970s) [3]. The second-generation pipes were made of the improved (carbide-hardened) steel of grades 17G2SF or 17G2SAF GOST 19281-73 (since 1975) [3]. The steel of grades 17G2SF and 7G2SAF were used to produce spiral-welded pipes from 530 to 1220 mm in diameter according to TU 14-3-731-78 [4]. The Minsk–Vilnius–Kaunas–Kaliningrad (Belorussia–Lithuania–Russia) gas pipeline (ø 530 mm), which is currently operating on the territory of the Republic of Lithuania, was put into operation in 1985. These pipelines have been operated for more than 30 years [1]. This period of pipeline operation was marked by the increased likelihood of accidents due to metal aging, fatigue, and corrosion.
Thirty or forty years ago, the building technologies were imperfect and the quality of work was very low. Therefore, pipelines with various mechanical damages were buried and put into operation [5,6,7,8]. The operating time of these pipelines was inevitably very short. The analysis of the practical use of gas pipelines [9,10,11] allows us to state that the main causes of pipeline accidents and leakages are as follows:
- Corrosion;
- Gouges;
- Plain and kinked dents;
- Smooth dents on welds;
- Smooth dents with other types of defects;
- Manufacturing defects in the pipe body;
- Girth and seam weld defects;
- Cracking;
- Environmental cracking.
Mechanical damage is the most common causes of pipeline accidents: the majority being external damages (49.6%). Manufacturing defects reach 16.5%, corrosion makes 15.3%, and ground displacement makes 7.3%, while other causes contribute 11.3% [12,13,14,15].
Because of the high level (49.6%) of accidents caused by mechanical damages, the companies maintaining the buried pipelines are often reluctant to apply expensive diagnostics, monitoring, and repairing techniques. As a rule, the buried pipelines are checked by using the intelligent pigging and inspection methods. The application of these technical solutions helped to detect many dangerous defects during the pipelines’ operation [16,17,18,19]. Sometimes, the shape defects were so huge that the intelligent pigging robot could not move forward.
The shape defects, which are characterised by large plastic deformations with (or without) reduced wall thickness, are very dangerous because they can initiate (or can be combined with) various types of corrosion defects or cracks [20,21,22,23]. Therefore, these defects should also be examined to decide whether the pipelines of this age can be safely used further, or whether these defects must be removed.
For this reason, it is important to model the influence and evolution of local shape defects in order to assess the pipeline’s reliability. The traditional analytical methods for evaluating the pipeline’s failure pressure and probability of leaks are based on the determination of the defect’s depth and length. Well-known mathematical methods, codes, and mathematical expressions can be used to predict the failure pressure of steel pipelines with various corrosion defects. The Finite Element Method allows for predicting failure pressure and evaluating complex defects for obtaining better results than the traditional methods can yield [23].
2. The Object of Research
The research object is the fragment of the pipeline ø 530 mm with mechanical surface defects, which has been operated since 1985. The pipeline’s steel 17G2SF (GOST 19281-73) [3], which contains alloying elements such as Nb, V, and Ti, was investigated (Table 1) [24]. Its standard yield strength Re is 380 MPa and the tensile strength Rm is 550 MPa (Table 2) [3]. The class of the steel strength is K55 according to GOST 19281-73 [3], while the pipe’s grade is Ch55 according to API 5L [25].
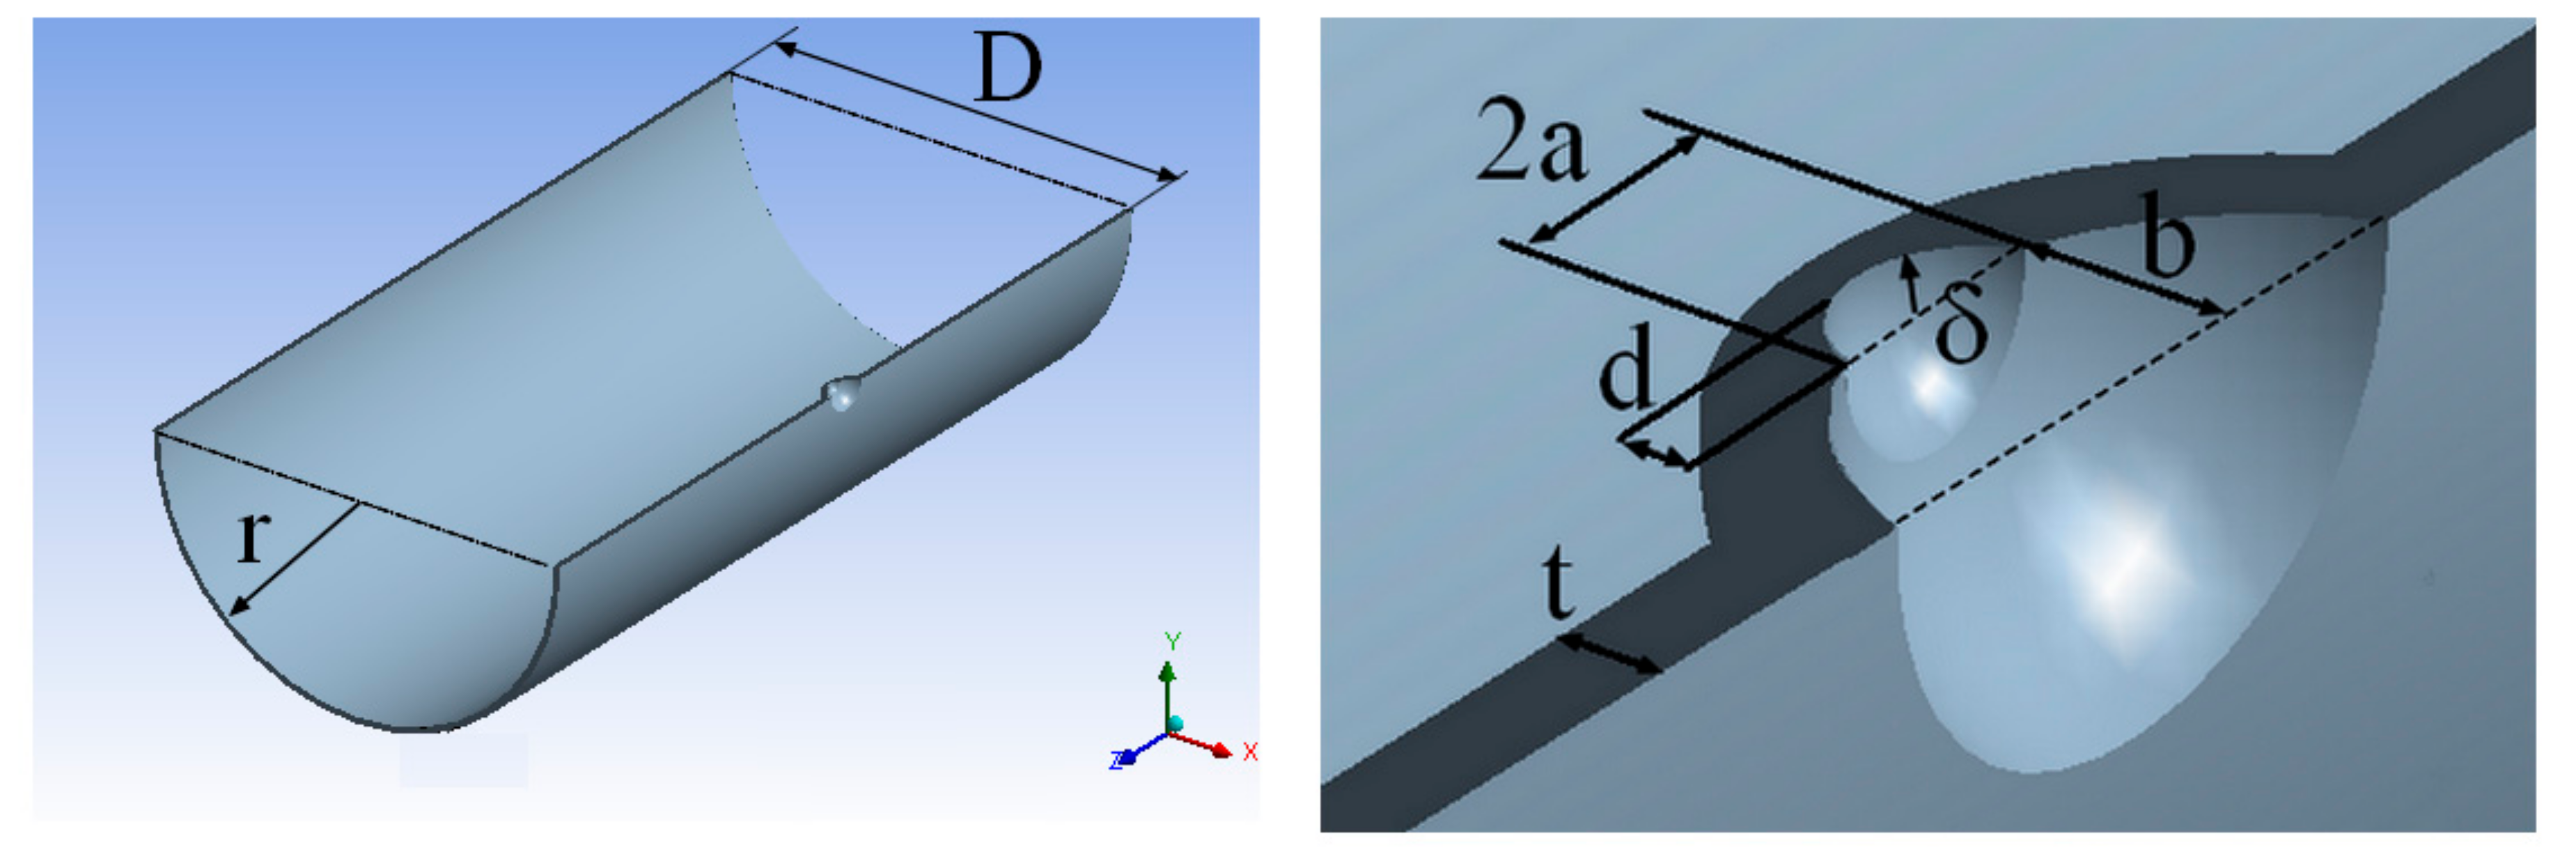
The geometric parameters of the pipe according to TU 14-3-731-78 [4] and the specification GOST 20295-85 [26] are as follows: the external diameter is ø 530 ± 3 mm and the wall thickness is 8 mm. The working pressure of the gas pipelines, which are from 530 mm to 1020 mm in diameter, is 5.45 MPa during the operation period [24]. The surface of the fragment of the investigated pipe had some combined defects such as dents, gouges, and corroded areas. The detected defects differed in size, but the depth of the most dangerous geometric defects reached 4 mm (about 50% of the total wall thickness) (Table 3). The geometry of the combined defects is presented in Figure 1.
3. Methodology of the Experiment
The chemical analysis of a metal sample was performed to identify the metal grade and to make sure that it meets the requirements of the project documentation and GOST 19281-73 [3] and to assess the metal equivalent carbon content.
The chemical analysis was performed using the optical spectroscopy BELEC Compact Lab N according to GOST 7565-81 [27]. The carbon equivalent of steel was calculated by the equation as follows [3]:
where CE is carbon equivalent, %, and C, Mn, Si, Cr, Ni, Cu, V, and P denote the concentration of the elements, wt. %.
The main mechanical properties of the pipe’s metal were determined to assess the changes in the metal properties during the elaboration period and to determine their state at the present moment. The Charpy pendulum impact test was performed according to the specification EN ISO 148-1:2016 [28]. Since the tube’s wall thickness is 8 mm, the standard-size sample could not be used. Therefore, the V-notch test pieces of the square section with 7.5 mm sides and 55 mm length were used. The pendulum impact tester 2130KM-03 (Soviet Union) and an 8 mm strike were used in testing. The tests were made at the ambient temperature of 20 °C. The test pieces for the impact test were taken from various zones of the tube (Figure 2). Three specimens were taken from the undamaged zone and one from the dented zone. The specimen from the dented zone was aligned prior to impact testing because the shell of the pipe in this area was deformed.
Metallographic tests were performed to assess the potential level of degradation of the metal in the vat. The samples were taken from the undamaged and deformed sections of the pipe.
The Buehler Beta 2 (Buehler, Lake Bluff, IL, USA) grinding and polishing machine was used for preparing metallographic samples (Figure 3). After performing the abrasive grinding and polishing of the specimens, the polished surface was etched with the most commonly used metallographic etchant, 2% Nital. The microstructure of the metal in the pipe bend was examined by using a microscope MA200 (Nikon, Tokyo, Japan) with optical magnification of ×50 to ×500. The strengthening of steel in the deformation (dent) area was investigated by performing a microhardness test according to the requirement of EN ISO 9015-2:2016 [29]. The automatic microhardness tester ZHμ (Zwick Roell, Ulm, Germany) with a load of 25 g and 10 s of storage was used in the experiment. The measurements were made on the surfaces of metallographic samples taken from the deformed and undamaged sections of the pipe.
The basic mechanical properties of the pipe’s metal were determined by performing the hardness and stretching tests. Metal hardness tests were made on the outer surface of the pipe according to the specifications EN ISO 6507-1:2005 [30]. The Vickers’ hardness was measured in the dented zone and compared to the hardness in the non-dented zone.
The universal hardness tester ZHU (Zwick Roell, Ulm, Germany) with a diamond pyramid indenter was used for the test. Since hardness tests do not allow for determining the important mechanical properties of the metal of the pipe, destructive tensile tests were also made. Only the tensile testing of the samples taken from the undamaged pipe’s area was performed, since the tensile testing of the metal taken from the area with defects could not be made because of the fragment’s small dimensions.
Tensile tests were performed according to EN ISO 6892-1:2016 [31]. The universal testing machine TIRA Test 2300 (up to 100 kN) (TIRA GmbH, Schalkau, Germany) with a multi-channel electronic PC data acquisition system SPIDER8 (HBM, Darmstadt, Germany)was used for the tensile test. The machined longitudinal test pieces were of E type, with cross section So = 112.5 mm2, original gauge length Lo = 60 mm, and parallel length Lc = 68 mm, were used for testing at room temperature.
4. Experimental Results and Discussion
The chemical composition of the metal of the tested pipe’s fragment meets the 17G2SF steel grade (Table 4). This steel is analogous to 17G1S, but is alloyed with Ti and V.
The carbon equivalent of the carbon steel calculated by Equation (1) was 0.423%. Steel with CE < 0.45% is welded appropriately, and its additional heating is optional.
According to the results of the impact-tensile test, it is evident that the impact load characteristics are similar to the characteristics of the deformed and undamaged pipe sections. There was no significant change in the impact durability of the investigated steel (Table 5). The impact strength of the samples is practically equivalent (the average KCV 65.27 J/cm2) to the ordinary 17G2SF steel strength, according to GOST 19281-73 [3].
A typical steel 17G2SF microstructure consists of ferrites, pearlite, and dispersive carbides. The welded spiral pipes are made of these steel sheets, which have been normalised. The microscopic microstructure of the investigated samples is typical of this steel grade. The microstructure consists of the ferrite and pearlite phases (Figure 4).
Metallographic evaluation of the steel grain size was performed according to the specification EN ISO 643:2013 [32]. The 17G2SF steel pipe has a fine-grained structure with a typical ferrite grain size G 7–9 (with the average diameter of 0.015–0.031 mm) [24]. The metal grain size of the analysed tube fragments corresponds to G 6.5 (when the mean diameter of the ferrite grain is 0.035 mm). However, in the deformed tube section, there is a significant deformation of the grain (Table 6). The deformation of the grain due to the pipe’s deflection was evaluated according to equation [33]:
where K is the deformation coefficient; Dx is the diameter of the grain along X axis, mm; Dy is the diameter of the grain along Y axis, mm.
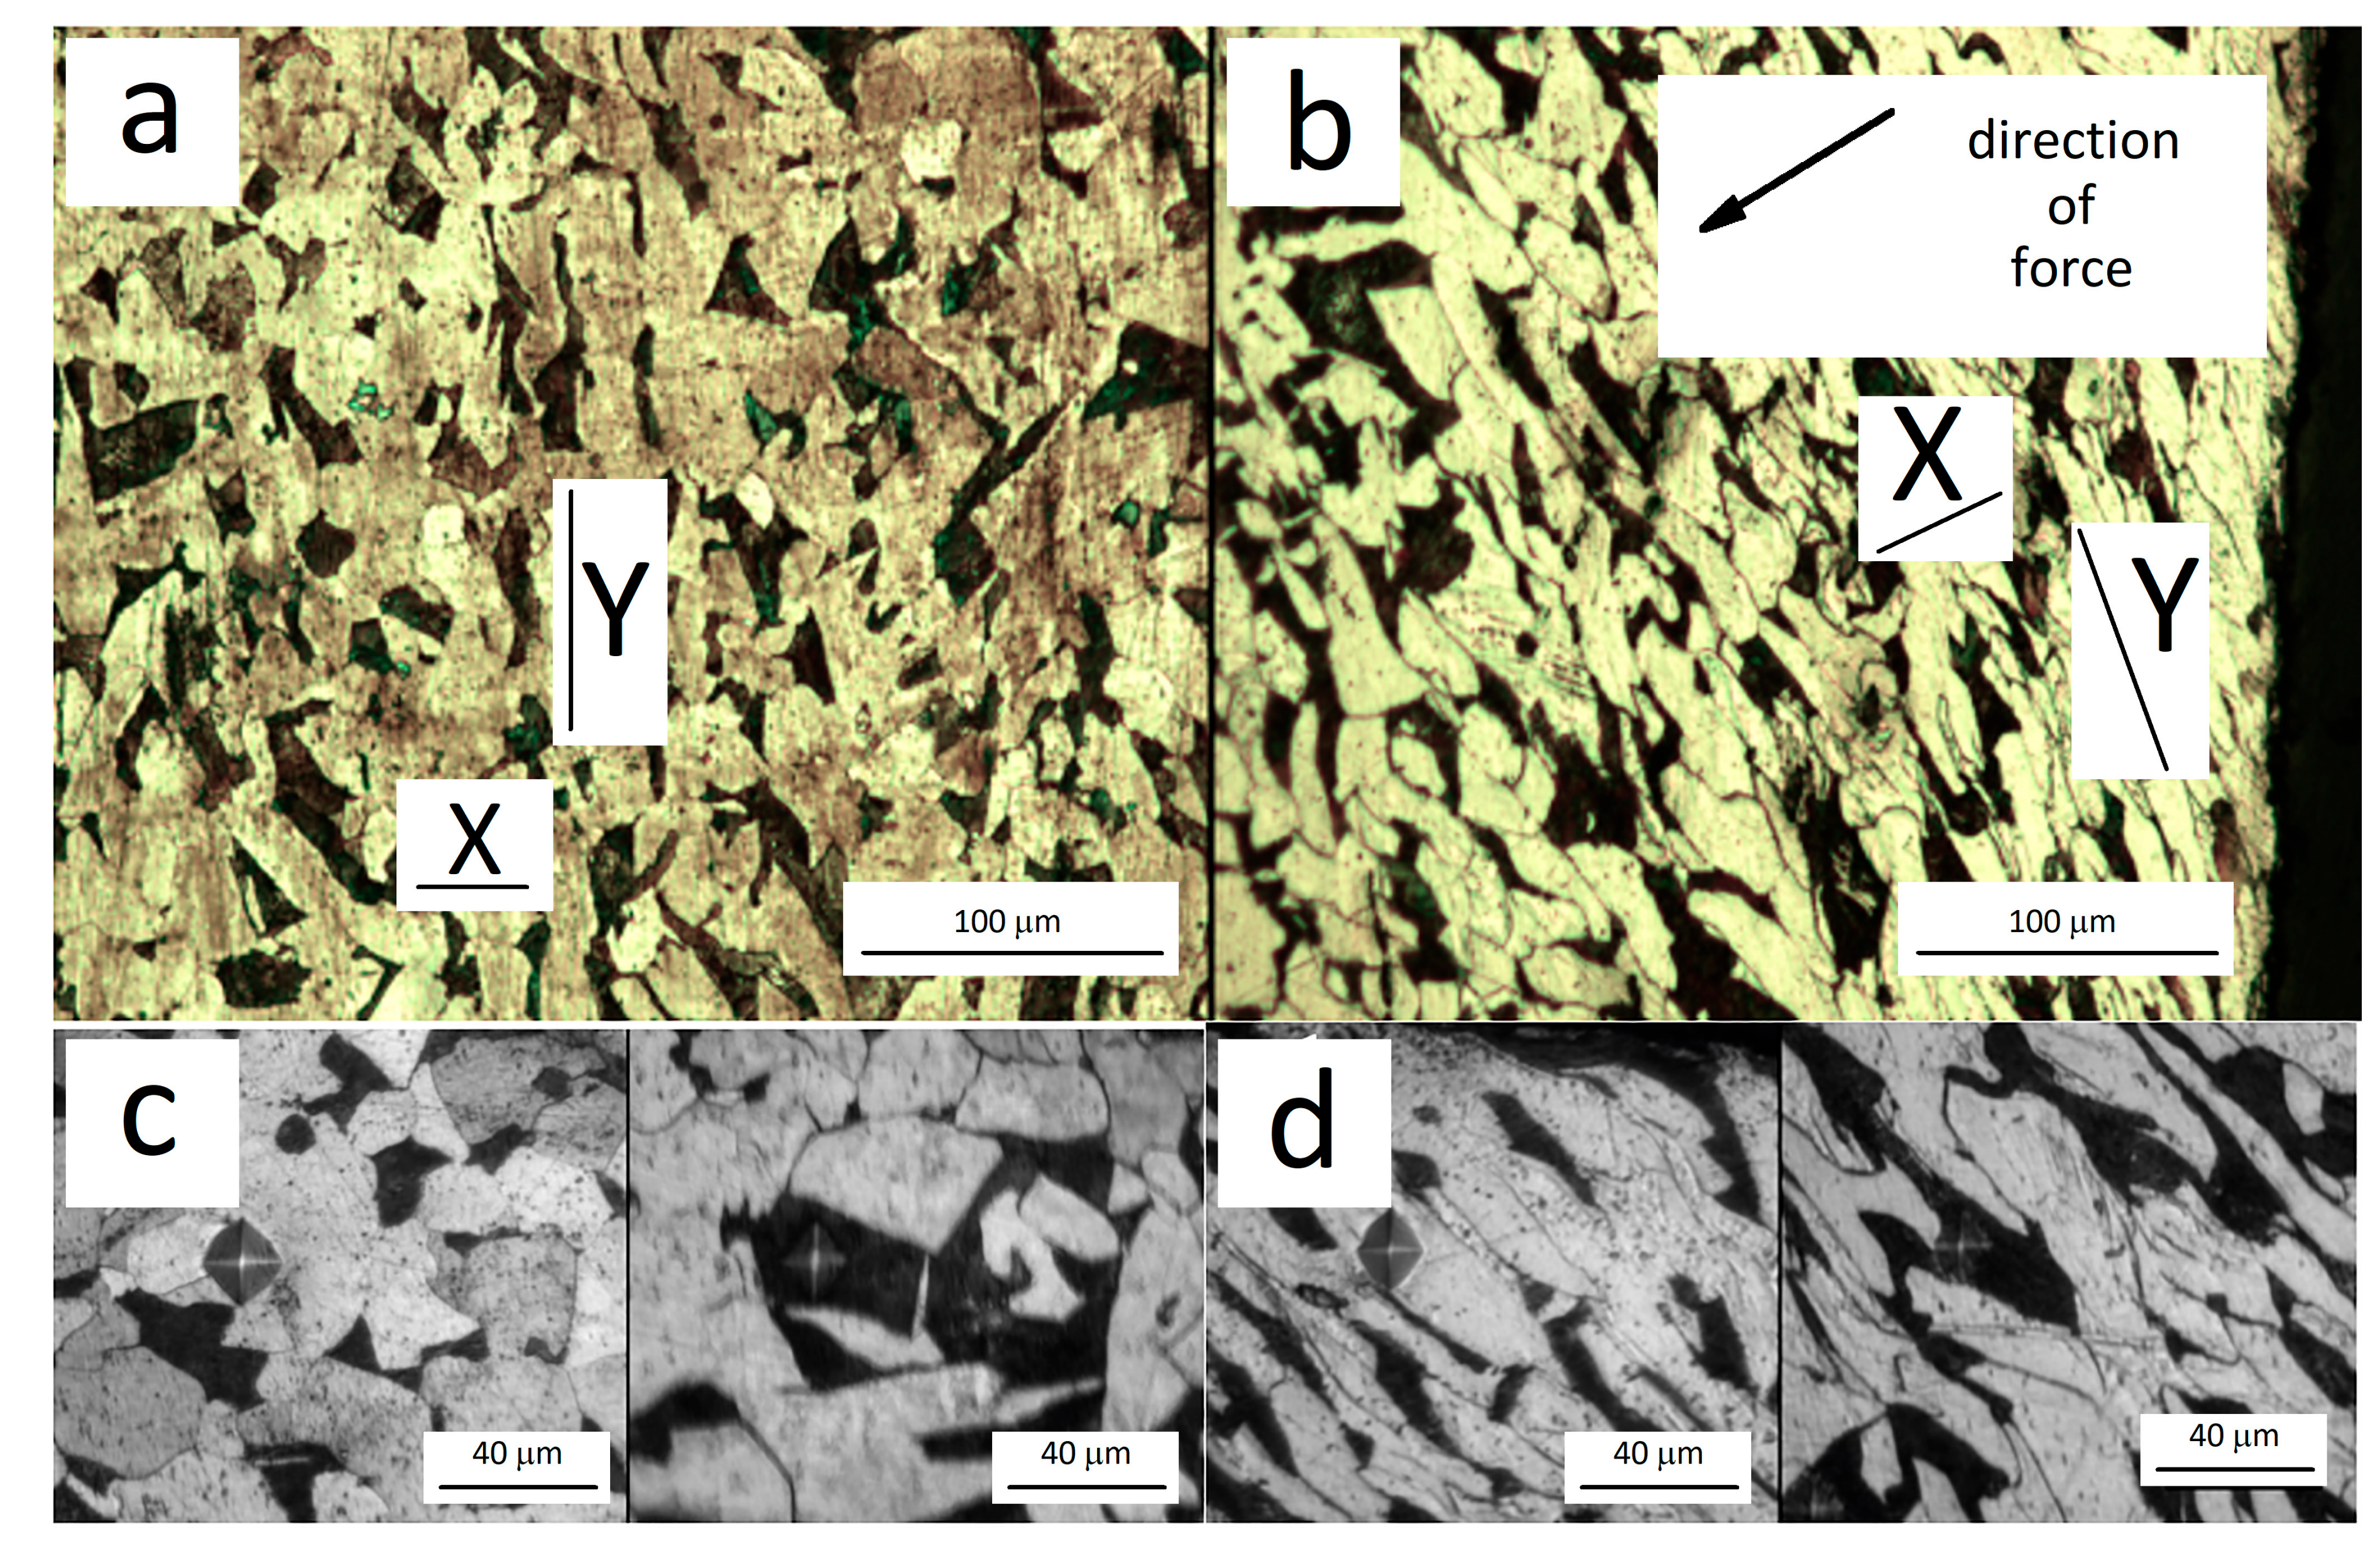
In the undeformed section of the pipeline, ferrite grains have a regular shape. In the area of defects, the deformation of ferrite grains in the direction along the X axis is 2.7 times as large. Pearlite dimensions along the X and Y directions have not changed. The orientation of the grains has changed in the dent area. This is logical because pearlite grains are harder than the ferrite ones.
According to the orientation of the stretched asymmetric grains, it is possible to determine the direction of the external loads in the deformed area (Figure 4b). These structural changes increase the material’s anisotropy because the deformed grains have different mechanical properties in different directions. This was confirmed by the results of the microhardness testing of this pipe. In the undeformed section of the pipe, the impression diagonals on the ferrite and pearlite grains are symmetrical (Figure 4c). Meanwhile, in the deformed part of the tube, the impressions are asymmetrical (Figure 4d). As shown in Figure 4d, the ferrite deformation level is higher than that of pearlite. In the area of the undeformed ferrite grains, the difference in the diagonal length of the impression is 1.4 times. As shown in Figure 5, the changes in hardness can be observed only in the deformed part of the pipe (the dent area). The hardness of HV in the undeformed section was 152 HV10, while in the deformed part it was 197 HV10. The degree of hardening in the dent area, when compared to that of the undeformed section of the tube, was approximatively 1.3.
The microstructure and hardness measurements provided important information about the anisotropy of the metal of the pipe in the deformed tube’s section. Theoretically, based on the Vickers’ hardness value, it is possible to determine the approximate tensile strength of the metal [34] as follows:
where Rm is tensile strength, MPa; HV is the Vickers hardness, MPa.
According to the above equation, the calculated strength limit for an undeformed pipe is 506 MPa. This value is very close (with the difference not exceeding 9%) to the typical steel tensile strength of 550 MPa. In the deformed section of the pipe, the strength limit calculated according to the given equation is 656 MPa. The results of the tensile tests confirm that the metal of the pipe remains sufficiently plastic (A = 23%). Its relative elongation still meets the requirements of GOST 19281-73 [3]. However, the tensile strength of the metal pipe tested is about 10% lower than the tensile strength of similar new pipes (Table 7).
5. The Calculation of Failure Pressure
Now, there is a number of methodologies for calculating the critical pressure of a pipeline with defects. The critical pressure P is close to the limit pressure given by a simple equation [14,15]:
where Rm is the ultimate strength determined by the tension test (502 MPa); t is the wall thickness (8 mm); r is the outer radius of the pipe (257 mm).
The burst pressure of a ø 530 mm vessel made of 17G2SF steel without any defects is equal to 15.5 MPa. When there are deep gouges in the pipeline, causing the decrease in the wall thickness by half or more, the burst pressure, according to this equation, can reach the operating pressure of 5.45 MPa. Following the considered equation, this can occur when a gouge’s depth reaches about 5 mm.
6. The Numerical Modelling of the Pipe
The ANSYS code [35] was used for calculation and simulation by employing the finite elements method. A model of the 3D FEA (Finite Element Analysis) of the pipe with the combined defects was developed. The 8-node brick finite elements for the volumetric model of the pipe with defects were used. The main geometrical characteristics of the pipe (Figure 6) were as follows: the external diameter of the tube was de = 530 mm and the thickness of the pipe’s wall was t = 8.00 mm. The internal pressure p of the fluid pipeline can vary from 2.5 MPa to 10 MPa [36], but in practice, these pipelines operate at a pressure of up to 5.4 MPa [37]. Since the length of the pipe was infinite, for modelling, it was considered a constant equal to 1.0 m. The material of the pipe was assumed to be elastoplastic, with the nonlinear stress–strain relation, as well as homogeneous and isotropic. However, in the course of the experimental investigation, the anisotropy of the metal was found to be in the field of the pipe’s defects. The experimentally obtained mechanical characteristics of the steel were applied in testing. The stress–strain curve of the material modelled by BKIN (Bilinear Kinematic Hardening Model) was used. The plastic behaviour of the material characterised by a non-recoverable strain could be observed when the internal stresses exceeded the material’s yield point. Static stress analysis of the pipe with defects was performed by simulating three pressure modes (minimum pressure of 3.6 MPa, medium pressure of 4.4 MPa, and maximum pressure of 5.4 MPa).
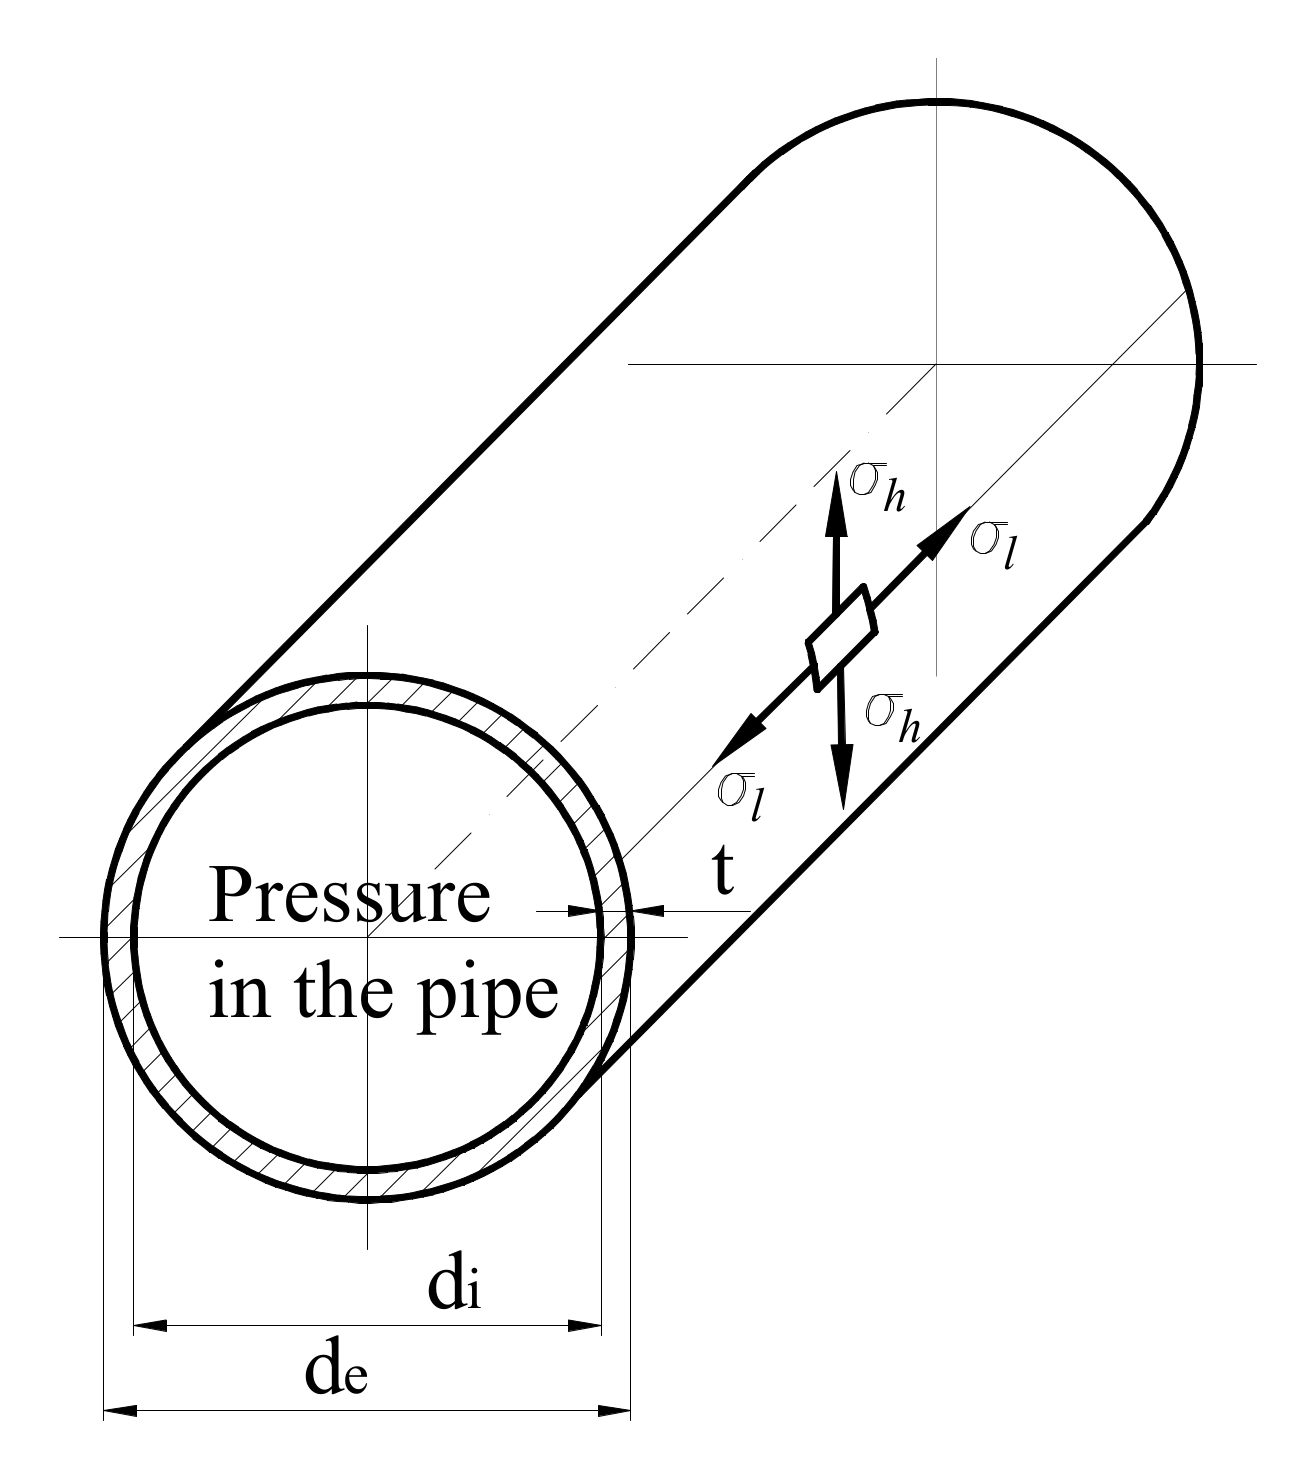
Figure 6 shows a classical model of an internally pressurised pipe with the external radius de and thickness t. The plastic behaviour of the material, characterised by the non-recoverable strain, can be observed when the stresses exceed the yield point of the material.
The hoop stresses σh and longitudinal stresses σl induced by the internal pressure are given by the closed-form equations:
The hoop stresses of the pipeline without defects under normal operating conditions (at a pressure of 3.6 MPa) could reach 115.4 MPa (Table 8).
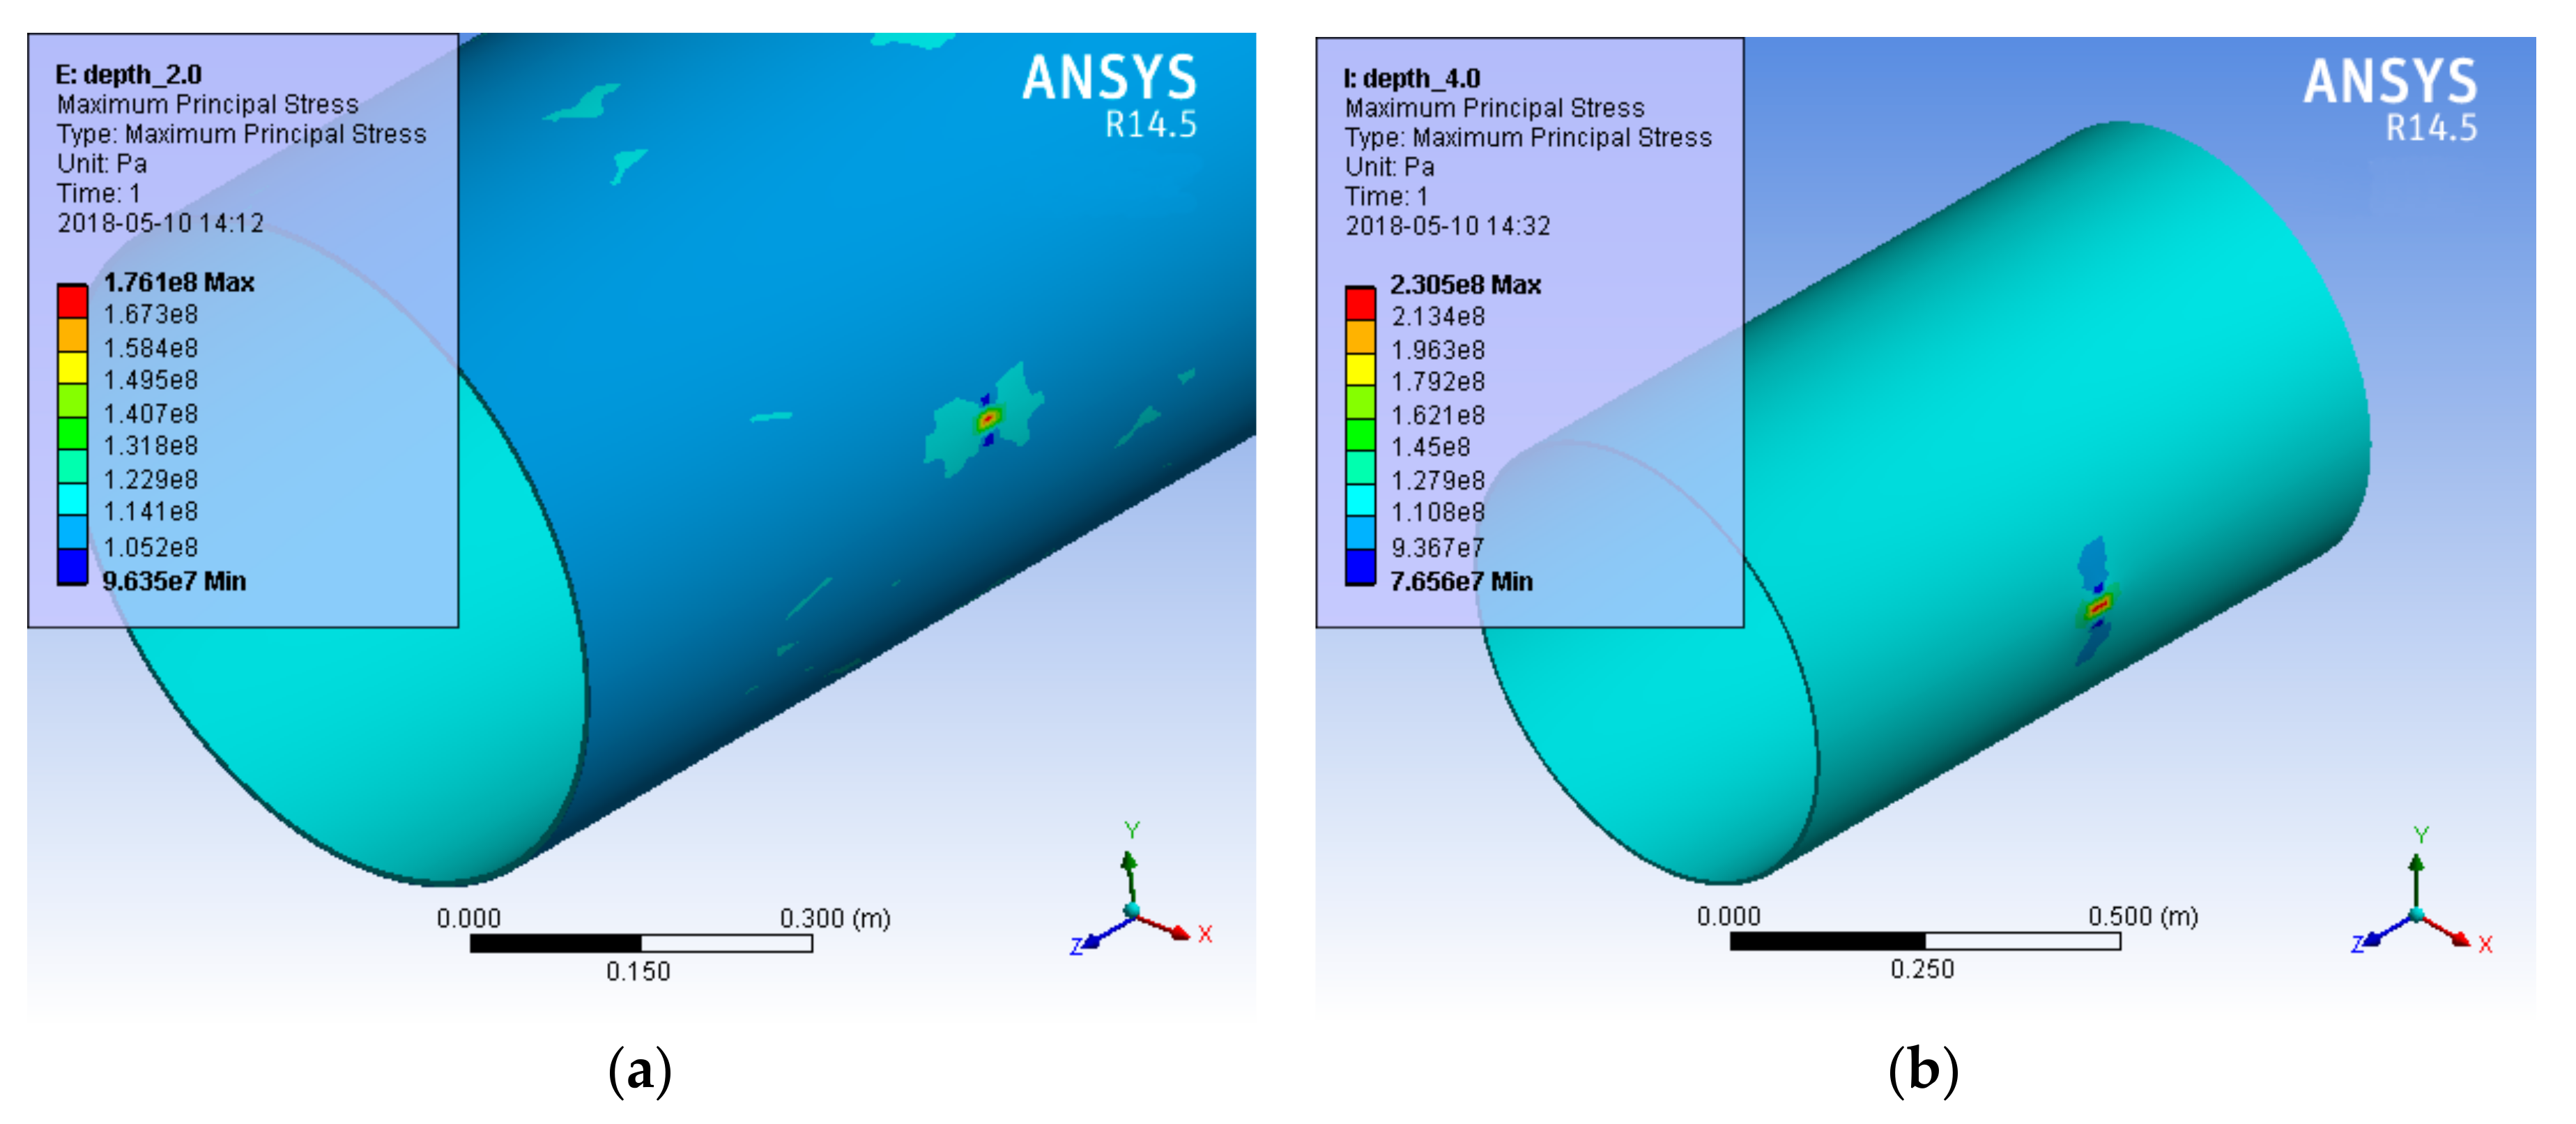
Over the course of the research, several defect combinations were modelled: (1) only a gouge or a pitting corrosion defect was modelled; (2) a combination of a dent and a gouge was modelled (Figure 7). Their depth could vary. Thus, in the model of the pipe, the defects’ depth increased in 0.5 mm increments from zero to 4.0 mm. The influence of the defect’s depth on the distribution of principal stresses, σ1, of the pipe was investigated numerically. The principal stresses of the pipe with a gouge defect under 3.6 MPa pressure are presented in Table 9 and Figure 8. Table 9 shows that in the pipeline with a 4-mm deep gouge at a working pressure of 3.6 MPa, the values of the maximum principal stresses are 1.96 times as large as these values obtained for a pipe without any defects.
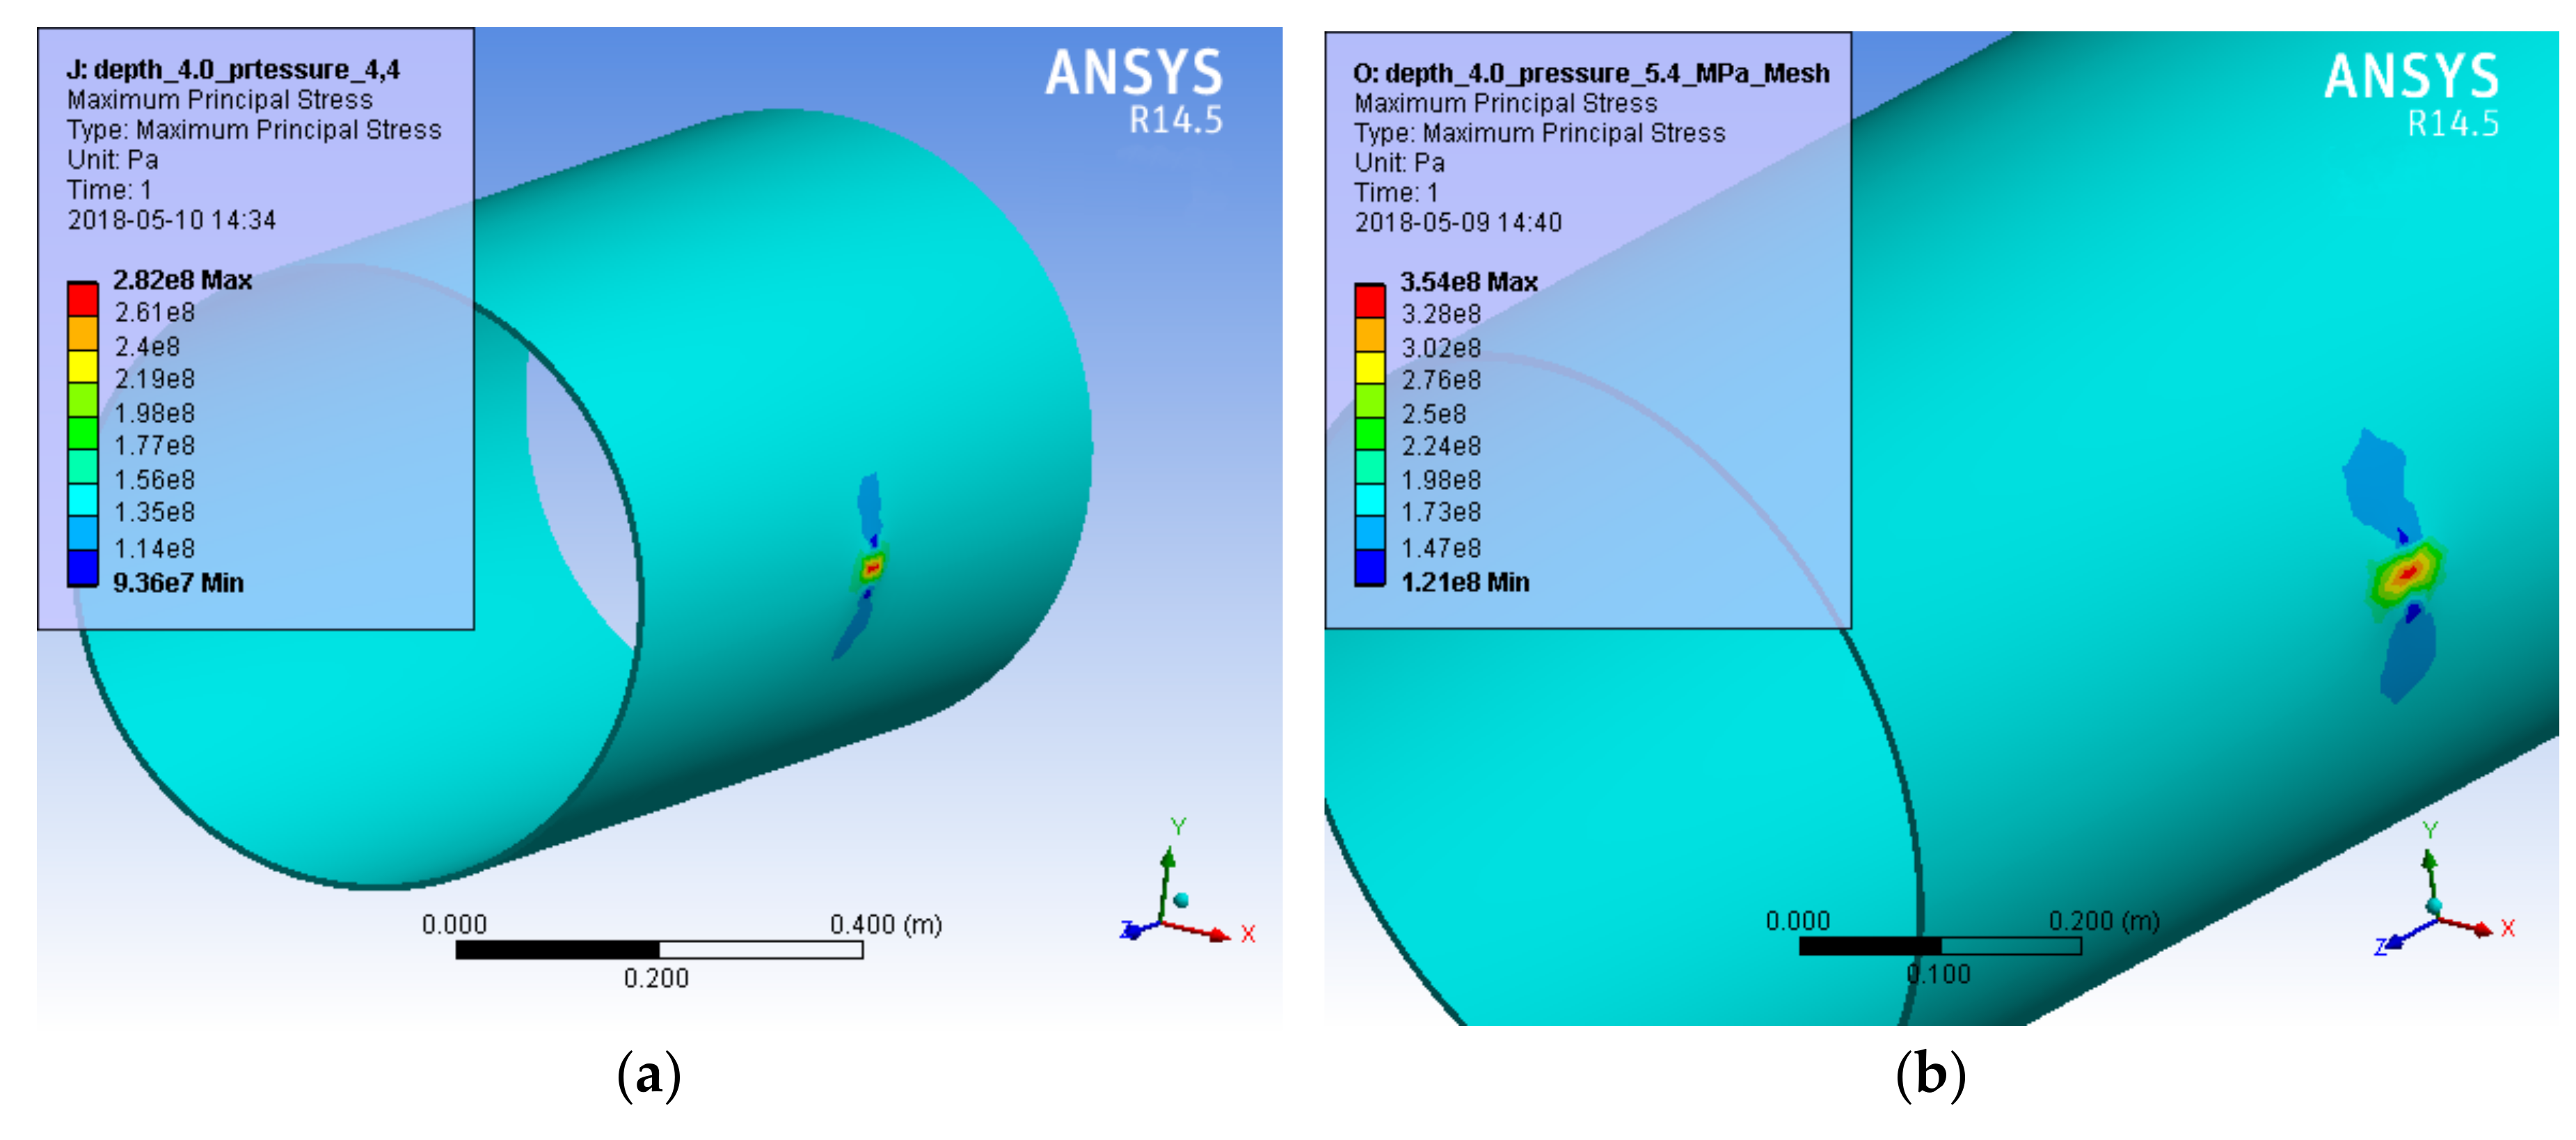
Similarly, the principal stresses in the pipe with a gouge defect under the pressures of 4.4 MPa and 5.4 MPa were simulated (Figure 9). In the pipeline with a 4-mm deep gauge under the working pressure of 4.4 MPa, the values of the maximum principal stresses reached 282 MPa (Figure 9a). Then, the elastic-plastic geometrical linear model with a 4-mm deep gouge was solved, using the load with the maximum value p = 5.4 MPa. Stress of 354 MPa (Figure 9b) developed in the defect area. The yield stress of the pipe’s steel was 350 MPa, therefore, the plastic deformation of metal could be initiated in the defect area. If the defect is larger than 4 mm, the internal stress of 354 MPa in the defect area significantly exceeds the metal’s yield strength. Therefore, the working pressure of the pipe at 5.4 MPa becomes dangerous for its safe operation because of the risk of the pipe bursting.
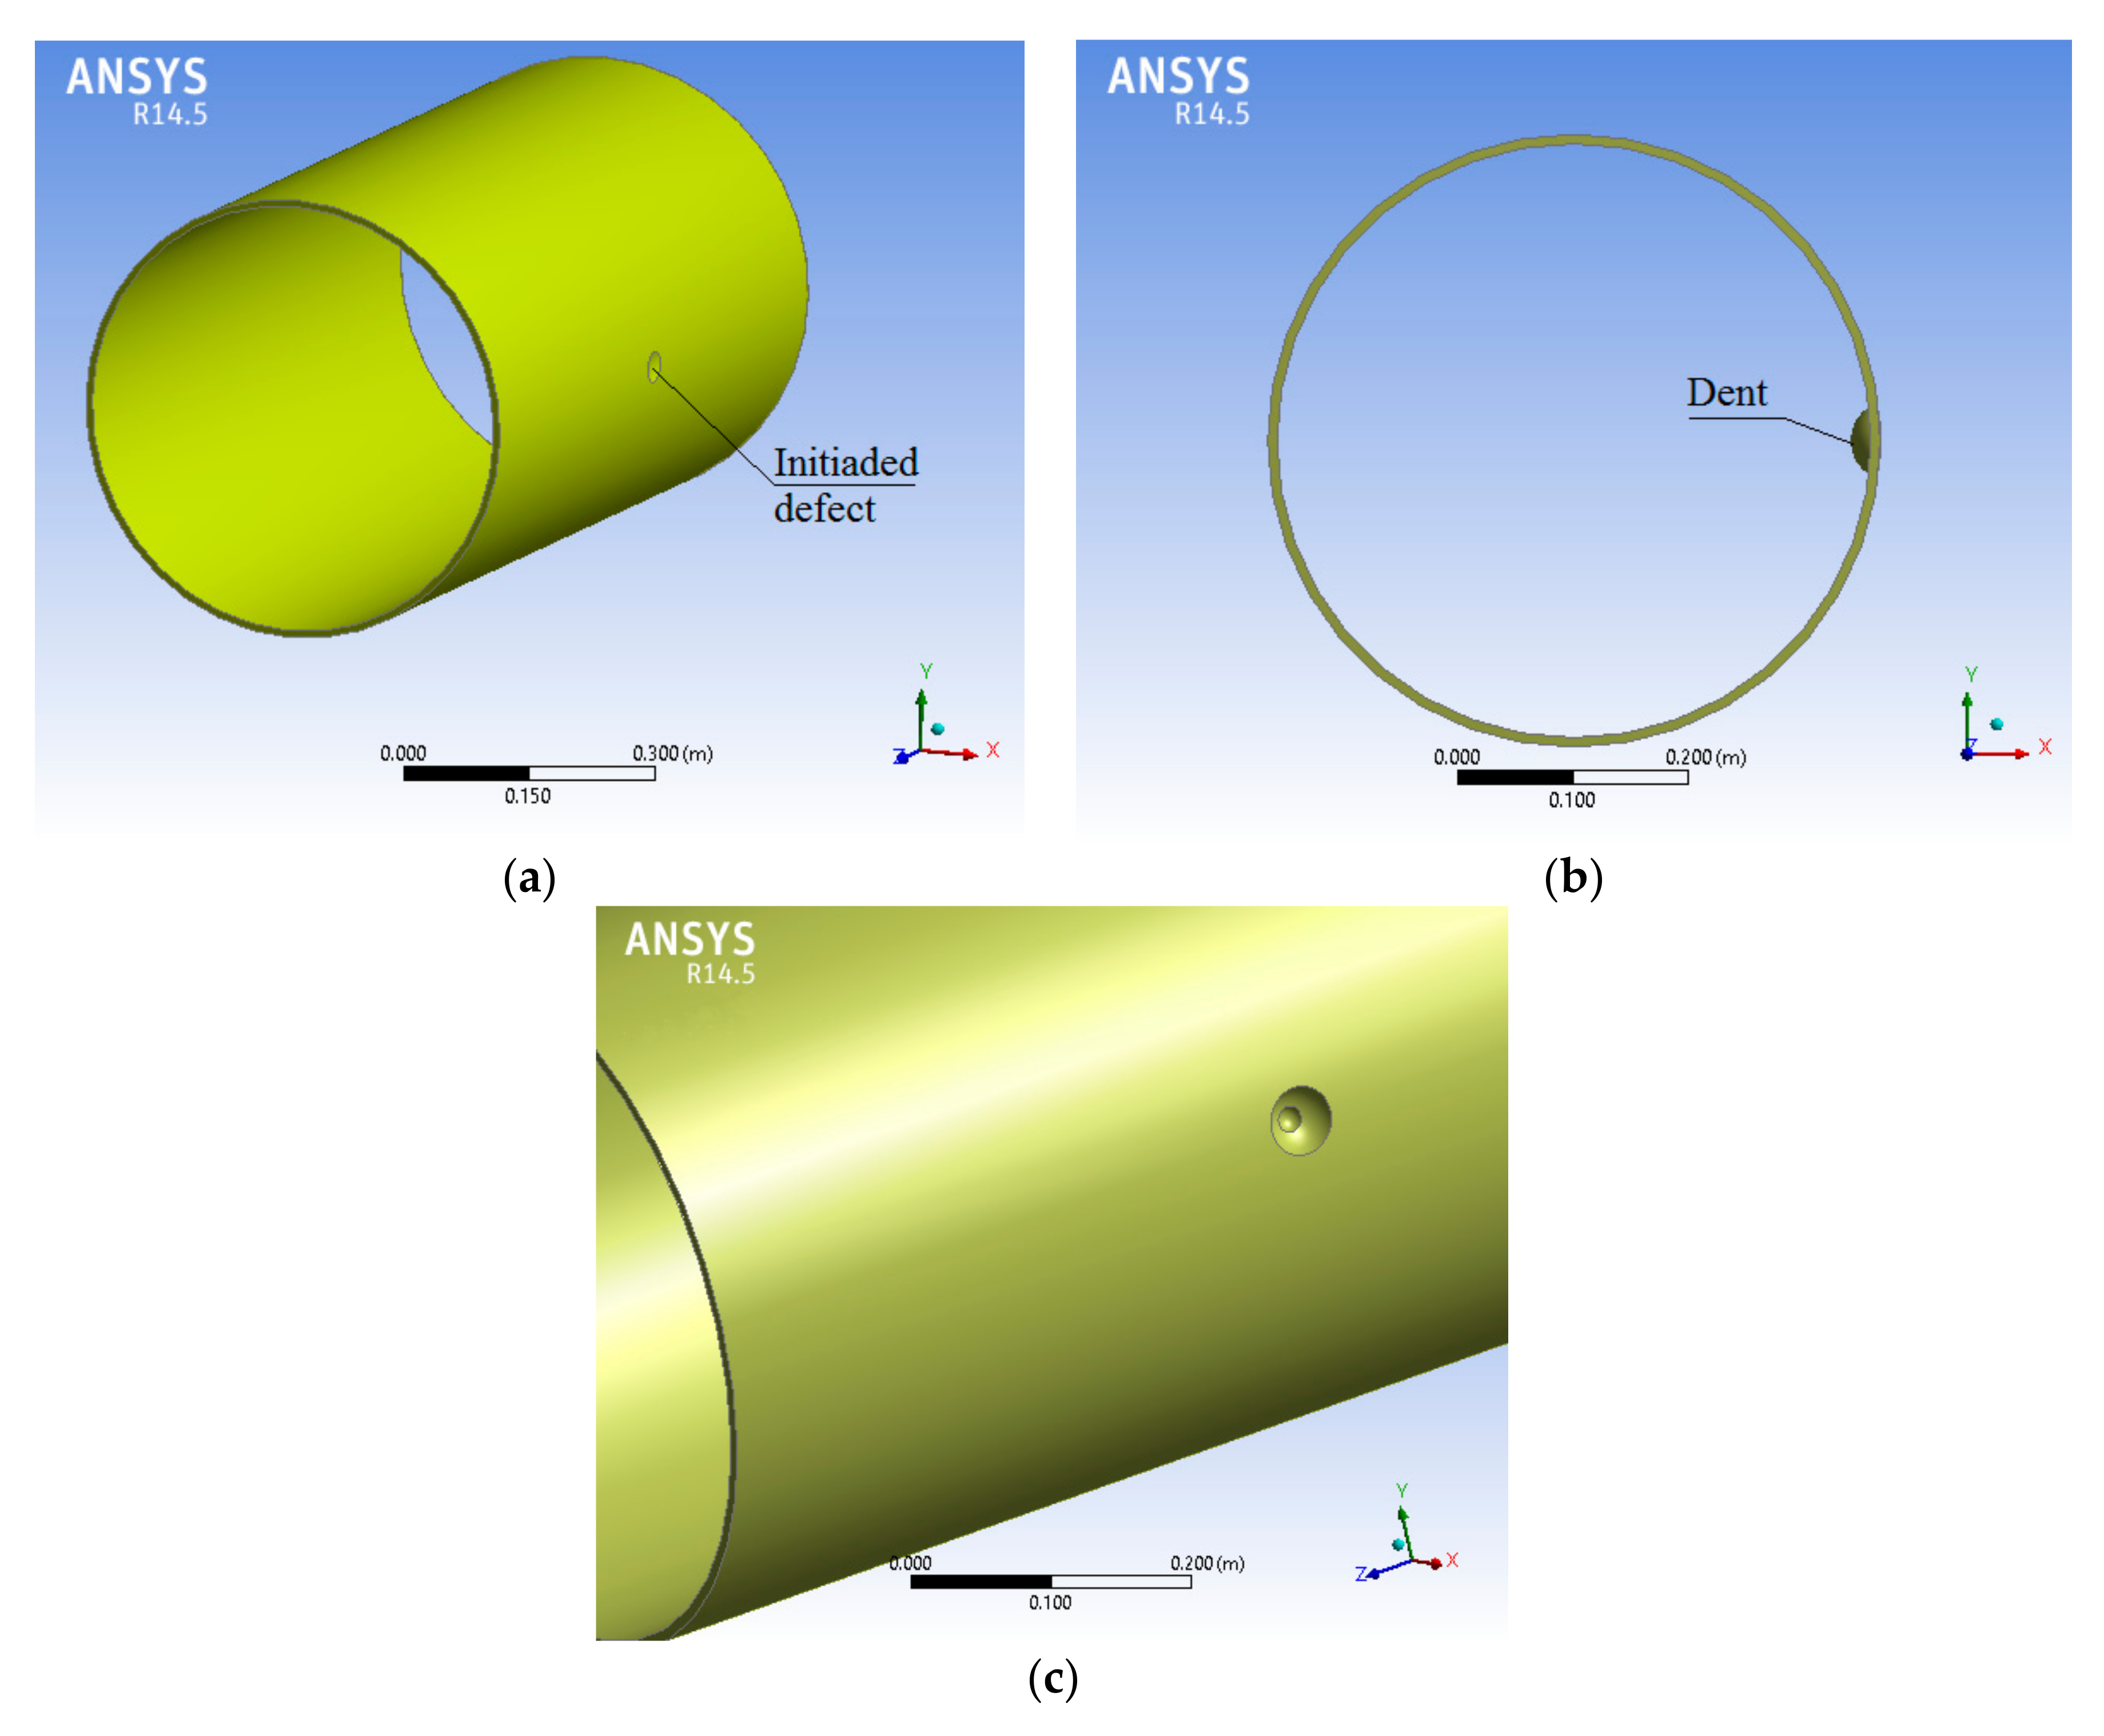
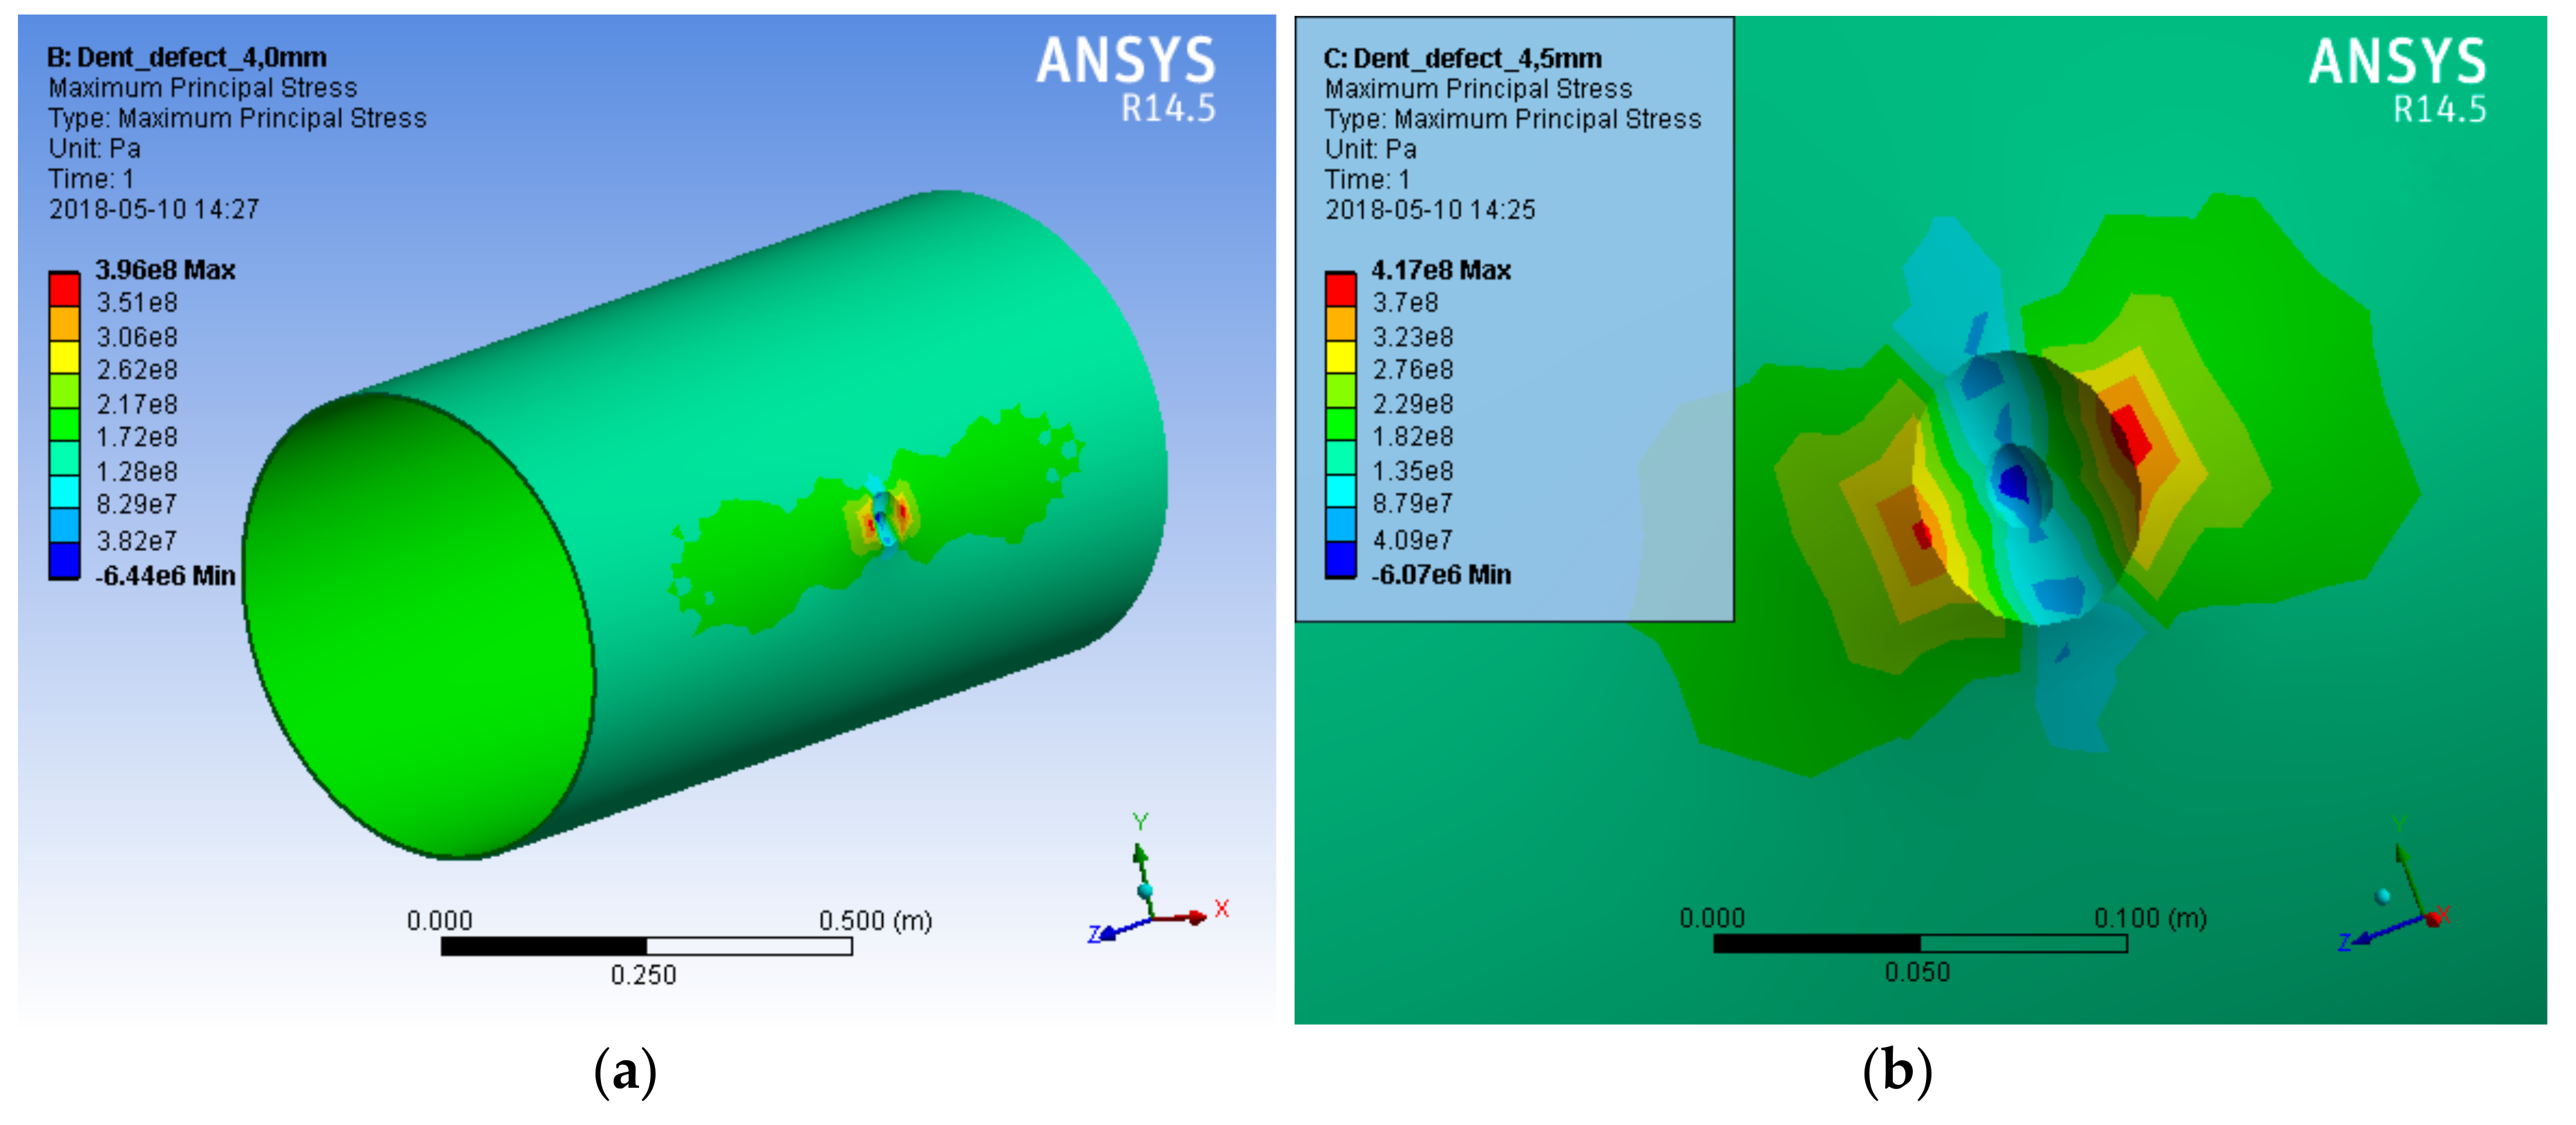
Another case of the defect’s simulation was based on the combination of a dent and a gouge. A case of a 4-mm deep gouge combined with a dent defect was modelled. The dent surface was modelled as a spherical surface and the depth of this defect was about 17.4 mm. Under the same working pressure conditions, the internal stress in the field of the compound defect of 5.4 MPa was significantly higher than the yield strength of steel and higher than that obtained by simulating the defect of the same depth gouge. The stress in the area of the combined defects increased to 396 MPa (when the gouge depth was 4 mm, Figure 10a) and to 417 MPa (when the gouge depth was 4.5 mm), respectively (Figure 10b). The dent’s factor changed the maximal stress location from the defect’s centre to the dent’s edge. Therefore, the simulation of the dent of variable depth and several gouges in the centre and on the perimeter of the dent’s edge was the next step of investigation.
As demonstrated above, using FEM modelling of the combined defects allows for evaluation of the danger and accident risk for the pipeline by determining the values of the local stresses at the location of these defects under various working pressures and the dimensions of actual defects. However, experimental validation of the model should be performed. In this way, modelling of the considered defects, as well as evaluating anisotropy of the pipeline’s metal, the effect of cycling loading under the pulsating pressure and the change in the temperature of the pipe could be performed. The authors intend to address this problem and to perform the validation of the model in further research.
7. Conclusions
Based on the results of the experimental research, it can be stated that the mechanical properties and the structure of 17G2SF steel of the pipelines remained sufficiently stable after 33 years of operation. The mechanical strength of steel decreased by about 10%. However, in practice, due to the inseparably linked shell and corrosion defects, the operation of these pipelines under normal pressure of 5.4 MPa is unsafe. The use of the FEA modelling technique for predicting the failure pressure allowed for assessment of the critical sizes of the combined defects, the localization of the internal stresses and plastic deformation zones around these defects, and the critical pressure.
The simulation performed by using the finite element method has shown that, in the case of the combined defects under the operating pressure of 5.4 MPa, the internal stress in the metal alloy exceeds the permissible metal yield limit (350 MPa). The situation becomes dangerous when the depth of the combined defects exceeds half the thickness of the pipe’s wall.
The most dangerous cases are associated with combined defects, because maximal stresses make up 83% of the ultimate stress and change their location in the direction from the centre to the dent’s edge. Therefore, further research will be made based on using the available numerical model and the formation of new gouge defects of various depths on the perimeter of the dent’s edge.
The most rational way for reducing the risk of accidents in pipelines operating for a long-time, is the reduction of their working pressure or the repair of defects of the described types by welding them after detection.
Author Contributions
All authors contributed equally to this work.
Conflicts of Interest
The authors declare no conflict of interests.
References
- Maruschak, P.; Panin, S.; Vlasov, I.; Prentkovskis, O.; Danyliuk, I. Structural levels of the nucleation and growth of fatigue crack in 17Mn1Si steel pipeline after long-term service. Transport 2015, 30, 15–23. [Google Scholar] [CrossRef]
- Maruschak, P.; Poberezhny, L.; Pyrig, T. Fatigue and brittle fracture of carbon steel of gas and oil pipelines. Transport 2013, 28, 270–275. [Google Scholar] [CrossRef]
- GOST 19281-73. Low-Alloy Steel Bars and Shapes; Russian Standard: Moscow, Russia, 1973. [Google Scholar]
- TU 14-3-731-78. In Hot-Deformed and Cold-Deformed Seamless Pipes from Corrosion-Resistant Steel Grade 12Ch18N1OT; Russian Technical Rules: Moscow, Russia, 1978.
- Hrabovs’kyi, R.S. Determination of the resource abilities of oil and gas pipelines working for a long time. Mater. Sci. 2009, 45, 309–317. [Google Scholar] [CrossRef]
- Kishawy, H.A.; Gabbar, H.A. Review of pipeline integrity management practices. Int. J. Press. Vessels Pip. 2010, 87, 373–380. [Google Scholar] [CrossRef]
- Vianello, C.; Maschio, G. Risk analysis of natural gas pipeline: Case study of a generic pipeline. Chem. Eng. Trans. 2011, 24, 1309–1314. [Google Scholar] [CrossRef]
- Wahab, M.A.; Sabapathy, P.N.; Painter, M.J. The onset of pipewall failure during “in-service” welding of gas pipelines. J. Mater. Process. Technol. 2005, 168, 414–422. [Google Scholar] [CrossRef]
- Maruschak, P.; Danyliuk, I.; Prentkovskis, O.; Bishchak, R.; Pylypenko, A.; Sorochak, A. Degradation of the main gas pipeline material and mechanisms of its fracture. J. Civ. Eng. Manag. 2014, 20, 864–872. [Google Scholar] [CrossRef]
- Cosham, A.; Hopkins, P. The Pipeline Defect Assessment Manual. In Proceedings of the 4th International Pipeline Conference, Calgary, AB, Canada, 29 September–3 October 2002; The American Society of Mechanical Engineers: New York, NY, USA, 2003; pp. 1565–27067. [Google Scholar] [CrossRef]
- Alexander, C.R.; Kiefner, J.F. Effects of Smooth and Rock Dents on Liquid Petroleum Pipelines; American Petroleum Institute (API): Washington, DC, USA, 1997; Available online: http://www.chrisalexander.com/assetmanager/assets/1998%20Apr%20-%20API%20Pipeline%20Conf%20Rocks%20on%20dents.pdf (accessed on 10 January 2018).
- Otegui, J.L. Challenges to the integrity of old pipelines buried in stable ground. Eng. Fail. Anal. 2014, 42, 311–323. [Google Scholar] [CrossRef]
- Cosham, A.; Hopkins, P. The effect of dents in pipelines–guidance in the pipeline defect assessment manual. Int. J. Press. Vessels Pip. 2004, 8, 127–139. [Google Scholar] [CrossRef]
- Allouti, M.; Schmitt, C.; Pluvinage, G. Assessment of a gouge and dent defect in a pipeline by a combined criterion. Eng. Fail. Anal. 2014, 36, 1–13. [Google Scholar] [CrossRef]
- Allouti, M.; Schmitt, C.; Pluvinage, G.; Gilgert, J.; Hariri, S. Study of the influence of dent depth on the critical pressure of pipeline. Eng. Fail. Anal. 2012, 21, 40–51. [Google Scholar] [CrossRef]
- Maruschak, P.; Konovalenko, I.; Prentkovskis, O.; Tsyrulnyk, O. Digital analysis of shape and size of dimples of ductile tearing on fracture surface of long-operated steel. Procedia Eng. 2016, 134, 437–442. [Google Scholar] [CrossRef]
- Zhang, Y.M.; Fan, M.; Xiao, Z.M.; Zhang, W.G. Fatigue analysis on offshore pipelines with embedded cracks. Ocean Eng. 2016, 117, 45–56. [Google Scholar] [CrossRef]
- Poberezhnyi, L.; Maruschak, P.; Prentkovskis, O.; Danyliuk, I.; Pyrig, T.; Brezinová, J. Fatigue and failure of steel of offshore gas pipeline after the laying operation. Arch. Civ. Mech. Eng. 2016, 16, 524–536. [Google Scholar] [CrossRef]
- Hood, J.E. Fracture of steel pipelines. Int. J. Press. Vessels Pip. 1974, 2, 165–178. [Google Scholar] [CrossRef]
- Maruschak, P.; Prentkovskis, O.; Bishchak, R. Defectiveness of external and internal surfaces of the main oil and gas pipelines after long-term operation. J. Civ. Eng. Manag. 2016, 22, 279–286. [Google Scholar] [CrossRef]
- Ghajar, R.; Mirone, G.; Keshavarz, A. Ductile failure of X100 pipeline steel—Experiments and fractography. Mater. Des. 2013, 43, 513–525. [Google Scholar] [CrossRef]
- Azevedo, C.R.F.; Sinatora, A. Failure analysis of a gas pipeline. Eng. Fail. Anal. 2004, 11, 387–400. [Google Scholar] [CrossRef]
- Terán, G.; Capula-Colindres, S.; Velázquez, J.C.; Fernández-Cueto, M.J.; Angeles-Herrera, D.; Herrera-Hernández, H. Failure pressure estimations for pipes with combined corrosion defects on the external surface: A comparative study. Int. J. Electrochem. Sci. 2017, 12, 10152–10176. [Google Scholar] [CrossRef]
- Matrosov, Y.I.; Litvinenko, D.A.; Golovanenko, S.A. Steel for pipelines. Metallurgy 288, 56–67. (In Russian)
- API 5L: Specification for Line Pipe, 45th ed.; American Petroleum Institute (API): Washington, DC, USA, 2013; p. 192.
- GOST 20295-85. Steel Welded Pipes for Main Gas-and-Pil Pipelines; Russian Standard: Moscow, Russia, 1985. [Google Scholar]
- GOST 7565-81. In Iron, Steel and Alloys, Sampling for Determination of Chemical Composition; Russian Standard: Moscow, Russia, 1981.
- EN ISO 148-1:2016. Metallic Materials—Charpy Pendulum Impact Test—Part 1: Test Method; Italian Standards: Milano, Italy, 2016. [Google Scholar]
- EN ISO 9015-2:2016. Destructive Tests on Welds in Metallic Materials—Hardness Testing—Part 2: Microhardness Testing of Welded Joints; ISO: Geneva, Switzerland, 2016. [Google Scholar]
- EN ISO 6507-1:2005. Metallic Materials—Vickers Hardness Test—Part 1: Test Method; CENELEC: Brussel, Belgium, 2005. [Google Scholar]
- EN ISO 6892-1:2016. Metallic Materials—Tensile Testing—Part 1: Method of Test at Room Temperature; CENELEC: Brussel, Belgium, 2016. [Google Scholar]
- EN ISO 643:2013. Steels-Micrographic Determination of the Apparent Grain Size; CENELEC: Brussel, Belgium, 2013. [Google Scholar]
- Pashinskaya, E.G.; Zavdoveev, A.V.; Metlov, L.S.; Nepochatikh, Y.I.; Maksakova, A.A.; Tkachenko, V.M. Non-trivial changes in physical and mechanical properties and structure of low carbon steel wire, produced by rolling with shear and cold drawing. Mater. Phys. Mech. 2015, 24, 163–177. [Google Scholar]
- Ashby, M.F. Materials Selection in Mechanical Design; Butterworth-Heinemann: Oxford, UK, 2005; ISBN 978-0-08-100599-6. [Google Scholar]
- Moaveni, S. Finite Element Analysis Theory and Application with ANSYS; Prentice Hall: Upper Saddle River, NJ, USA, 2007; ISBN 978-0131890800. [Google Scholar]
- SNIP 2.0506-85. Pipelines. Russian Building Codes and Rules; SNIP: Gosstroj, Russia, 1985. [Google Scholar]
- Bobrickij, N.V.; Jufin, V.А. Fundamentals of Gas Industry Petroleum and Gas Industry; Nedra: Moscow, Russia, 1988. (In Russian) [Google Scholar]
Figure 1.
The geometry of the combined defect: a denotes a half-length of the gouge, mm; b is the depth of the dent, mm; c is the width of the gouge, mm; d is the depth of the gauge, mm; t is wall thickness, mm; r is the internal radius of the pipe, mm, and D is the external diameter of the pipe, mm.

Figure 2.
A schematic view of the preparation of Charpy V-notch test pieces.

Figure 3.
A schematic view of the preparation of test pieces: (a) denotes the disposition of metallographic test pieces; (b) denotes the areas of hardness testing.
Figure 3.
A schematic view of the preparation of test pieces: (a) denotes the disposition of metallographic test pieces; (b) denotes the areas of hardness testing.

Figure 4.
Steel microstructure: (a) denotes the undeformed area of the pipe; (b) is the area of the dent; (c) is an enlarged view of the microstructure of the steel with the microhardness indentations of the undamaged section of the pipe; (d) is an enlarged view of the microstructure of the steel with the microhardness indentations of the deformed tube section; ferrite—white grains; pearlite—dark grains.

Figure 5.
The differences in Vicker’s hardness on the sample’s surface.

Figure 6.
The hoop and the longitudinal stresses of the pipe.

Figure 7.
The model of the pipe with the initiated combined defects: (a) denotes a pipe with a gouge defect; (b) is a pipe with a dent; (c) is a pipe with a combined defect.
Figure 7.
The model of the pipe with the initiated combined defects: (a) denotes a pipe with a gouge defect; (b) is a pipe with a dent; (c) is a pipe with a combined defect.

Figure 8.
Principal stresses in the pipe with a gouge of various depths: (a) 2.0 mm; (b) 4.0 mm.

Figure 9.
Maximal stresses in the pipe with a 4-mm deep gouge: (a) at a pressure of 4.4 MPa; (b) at a pressure of 5.4 MPa.
Figure 9.
Maximal stresses in the pipe with a 4-mm deep gouge: (a) at a pressure of 4.4 MPa; (b) at a pressure of 5.4 MPa.

Figure 10.
Stresses in the pipe with dent and gouge defects: (a) 4.0 mm deep; (b) 4.5 mm deep.


Table 1.
Chemical composition of 17G2SF steel according to GOST 19281-73 [3].
Table 1.
Chemical composition of 17G2SF steel according to GOST 19281-73 [3].
| Element | C | Si | Mn | P | S | N | Cu | Cr | Ni | Nb | Ti | V |
|---|---|---|---|---|---|---|---|---|---|---|---|---|
| wt. % | 0.15–0.2 | 0.4–0.7 | 1.3–1.7 | Max 0.035 | Max 0.04 | Max 0.012 | Max 0.3 | Max 0.3 | Max 0.3 | 0.02–0.05 | 0.01–0.03 | 0.05–0.1 |
| Fe residue | ||||||||||||
Table 2.
Typical mechanical properties of 17G2SF steel according to GOST 19281-73 [3].
Table 2.
Typical mechanical properties of 17G2SF steel according to GOST 19281-73 [3].
| Yield Strength Ra, MPa | Tensile Strength Rm, MPa | Elongation A, % | Impact Strength at Ambient Temperature KCU, J/cm2 | Impact Strength at Ambient Temperature KCV, J/cm2 |
|---|---|---|---|---|
| 380–470 | 550–650 | 23–30 | 44–65 | Min 40 |
Table 3.
Characteristics of the combined defects.
| Vessel | Sample 1 | Sample 2 |
|---|---|---|
| Defect type | Dent and gouge | Dent and corrosion |
| Dent depth b, mm | 17.4 mm (3.5% 2·r) | 17.4 mm (3.5% 2·r) |
| Gouge length 2·a, mm | 8 mm (t) | |
| Gouge width 2·c, mm | 4 mm (t/2) | |
| Gouge depth d, mm | 4 mm (t/2) | |
| Gauge radius δ, mm | 2 mm (t/4) | |
| Pitting diameter e, mm | 4 mm (t/2) | |
| Depth of pitting corrosion d, mm | 4 mm (t/2) | 4 mm (t/2) |
| Failure location | Gouge | Area of pitting corrosion |
Table 4.
Chemical composition of 17G2SF grade steel.
| Element | C | Si | Mn | P | S | N | Cu | Cr | Ni | Nb | Ti | V |
|---|---|---|---|---|---|---|---|---|---|---|---|---|
| wt. % | 0.18 | 0.3 | 1.09 | 0.029 | 0.028 | 0.01 | 0.1 | 0.11 | 0.07 | 0.004 | 0.01 | 0.05 |
| Fe residue | ||||||||||||
Table 5.
The results of Charpy pendulum impact test.
| Specimen | h, mm | b, mm | S0, cm2 | KV8, J | KCV, J/cm2 |
|---|---|---|---|---|---|
| 1 | 7.5 | 7.5 | 0.41 | 26.7 | 64.8 |
| 2 | 7.5 | 7.5 | 0.41 | 28.3 | 68.7 |
| 3 | 7.5 | 7.5 | 0.41 | 27.5 | 66.7 |
| 4 | 7.5 | 7.5 | 0.41 | 25.1 | 60.9 |
The obtained results guarantee the plastic fracture of this type of steel after long-term operation.
Table 6.
The average grain size and grain deformation levels.
| Parameter | Ferrite | Pearlite | ||
|---|---|---|---|---|
| Undeformed Section | Dent Area | Undeformed Section | Dent Area | |
| The diameter of the grain along x-axis, mm | 0.031 | 0.013 | 0.012 | 0.011 |
| The diameter of the grain along y-axis, mm | 0.040 | 0.046 | 0.033 | 0.036 |
| Deformation coefficient K | 1.29 | 3.53 | 2.75 | 3.27 |
Table 7.
The mechanical properties of the pipe’s metal.
| Properties | Yield Strength Ra, MPa | Tensile Strength Rm, MPa | Elongation A, % |
|---|---|---|---|
| The initial characteristics of steel according to the certificate | 380 | 550 | 25 |
| Service-exposed steel | 350 | 502 | 23 |
Table 8.
The results of hoop stress testing.
| Stresses | Analytical | Numerical | Error, % |
|---|---|---|---|
| , MPa | 115.4 | 117.5 | 1.8 |
Table 9.
Principal stresses in the pipe with a gouge defect of various depths.
| Depth, mm | σ1, MPa |
|---|---|
| 0 | 117.4 |
| 0.5 | 130.2 |
| 1.0 | 147.0 |
| 1.5 | 172.4 |
| 2.0 | 176.1 |
| 2.5 | 191.3 |
| 3.0 | 201.9 |
| 3.5 | 211.6 |
| 4.0 | 230.5 |
© 2018 by the authors. Licensee MDPI, Basel, Switzerland. This article is an open access article distributed under the terms and conditions of the Creative Commons Attribution (CC BY) license (http://creativecommons.org/licenses/by/4.0/).
Share and Cite
MDPI and ACS Style
Vilkys, T.; Rudzinskas, V.; Prentkovskis, O.; Tretjakovas, J.; Višniakov, N.; Maruschak, P. Evaluation of Failure Pressure for Gas Pipelines with Combined Defects. Metals 2018, 8, 346. https://doi.org/10.3390/met8050346
AMA Style
Vilkys T, Rudzinskas V, Prentkovskis O, Tretjakovas J, Višniakov N, Maruschak P. Evaluation of Failure Pressure for Gas Pipelines with Combined Defects. Metals. 2018; 8(5):346. https://doi.org/10.3390/met8050346
Chicago/Turabian StyleVilkys, Tadas, Vitalijus Rudzinskas, Olegas Prentkovskis, Jurijus Tretjakovas, Nikolaj Višniakov, and Pavlo Maruschak. 2018. "Evaluation of Failure Pressure for Gas Pipelines with Combined Defects" Metals 8, no. 5: 346. https://doi.org/10.3390/met8050346
Note that from the first issue of 2016, this journal uses article numbers instead of page numbers. See further details here.