Texture Control of Pure Titanium Sheet by the Surface Effect during Phase Transformation


School of Materials Science and Engineering, University of Science and Technology Beijing, Beijing 100083, China
*
Author to whom correspondence should be addressed.
Metals 2018, 8(5), 358; https://doi.org/10.3390/met8050358
Submission received: 18 April 2018
/
Revised: 4 May 2018
/
Accepted: 15 May 2018
/
Published: 16 May 2018
(This article belongs to the Special Issue Microstructure, Texture and Properties Control in Alloys)
Abstract
:The texture evolution of cold rolled pure titanium through different annealing parameters was investigated and different processes for various textures controls were proposed for further industrial application. Columnar grains with strong {11–20}//RD (rolling direction) texture was produced through cold rolling and a cooling-controlled annealing at 1100 °C with the Ar atmosphere. The preferred nucleation on the surface and the lowest strain energy of variant pairs during grain growth caused the formation of columnar grains and variant selection. Texture inheritance was discovered both in the cold-rolled and warm rolled-pure titanium sheets following 1000 °C annealing. The stored energy during cold rolling was the main reason causing the texture inheritance. Basal texture could be produced through warm rolling and subsequent annealing. The 30°-rotated around RD from basal texture could be preserved through both recrystallized annealing and transformed annealing.
1. Introduction
Titanium and its alloys are widely utilized in aerospace, automotive, and other industrial applications due to their high strength at elevated temperatures, excellent corrosion resistance, and light-weight performance. Commercial pure titanium is often used to produce rolled sheets and stamping is a common process on thin pure titanium sheets [1,2,3]. The mechanical properties anisotropy of the pure titanium sheet is an important factor that affects the performance of the furtherly manufacturing processes [4]. The r value of the stamping property could exceed 5 in pure titanium sheets. Usually, the basal texture has the highest strength and the highest stamping property.
The rolling texture of commercial titanium has been studied by many papers. It was discovered that a 30° RD-rotated texture component occurred following cold rolling with large reduction [5,6]. The formation of {11–22} twinning during rolling at room temperature causes the c-axis of the crystal to deviate 30° from the normal direction [7]. Different rolling manners might cause different rolling textures. Gurao et al. [8] found that cross rolling could decrease the angle of the c-axis deviated from the normal direction. Although the texture of a titanium sheet could be changed with different rolling methods, the types of the rolling textures are always similar. The recrystallization texture of pure titanium has also been studied by several researchers [9,10]. Moreover, the annealed titanium sheet often inherits a similar texture to the cold-rolled sheet. Jiang et al. [11] discovered that the 700 °C annealed sample retained a similar texture to the cold-rolled sample and the annealing texture intensity increased as the annealing time increased.
Variant selection is common during phase transformation in titanium and titanium alloys [12,13,14,15,16]. Daymond et al. [16] explained that thermal expansion coefficient differences between α and β phases produced an inner stress field that caused the variant selection. Germain et al. [17] observed that the α phase formation on the grain boundary tended to retain Burgers orientation relationship with both β grains. Columnar grains could also be produced in thin sheets of other metals. Zhang et al. [18] produced columnar grains of an ultra-low carbon electrical steel through transformation following annealing at high temperature. It was illustrated that the variant selection during the formation of columnar grains was the key factor that caused a strong transformation texture. Therefore, annealing processes were proposed to obtain new strong textures through the columnar grains during phase transformation.
2. Materials and Experimental Procedures
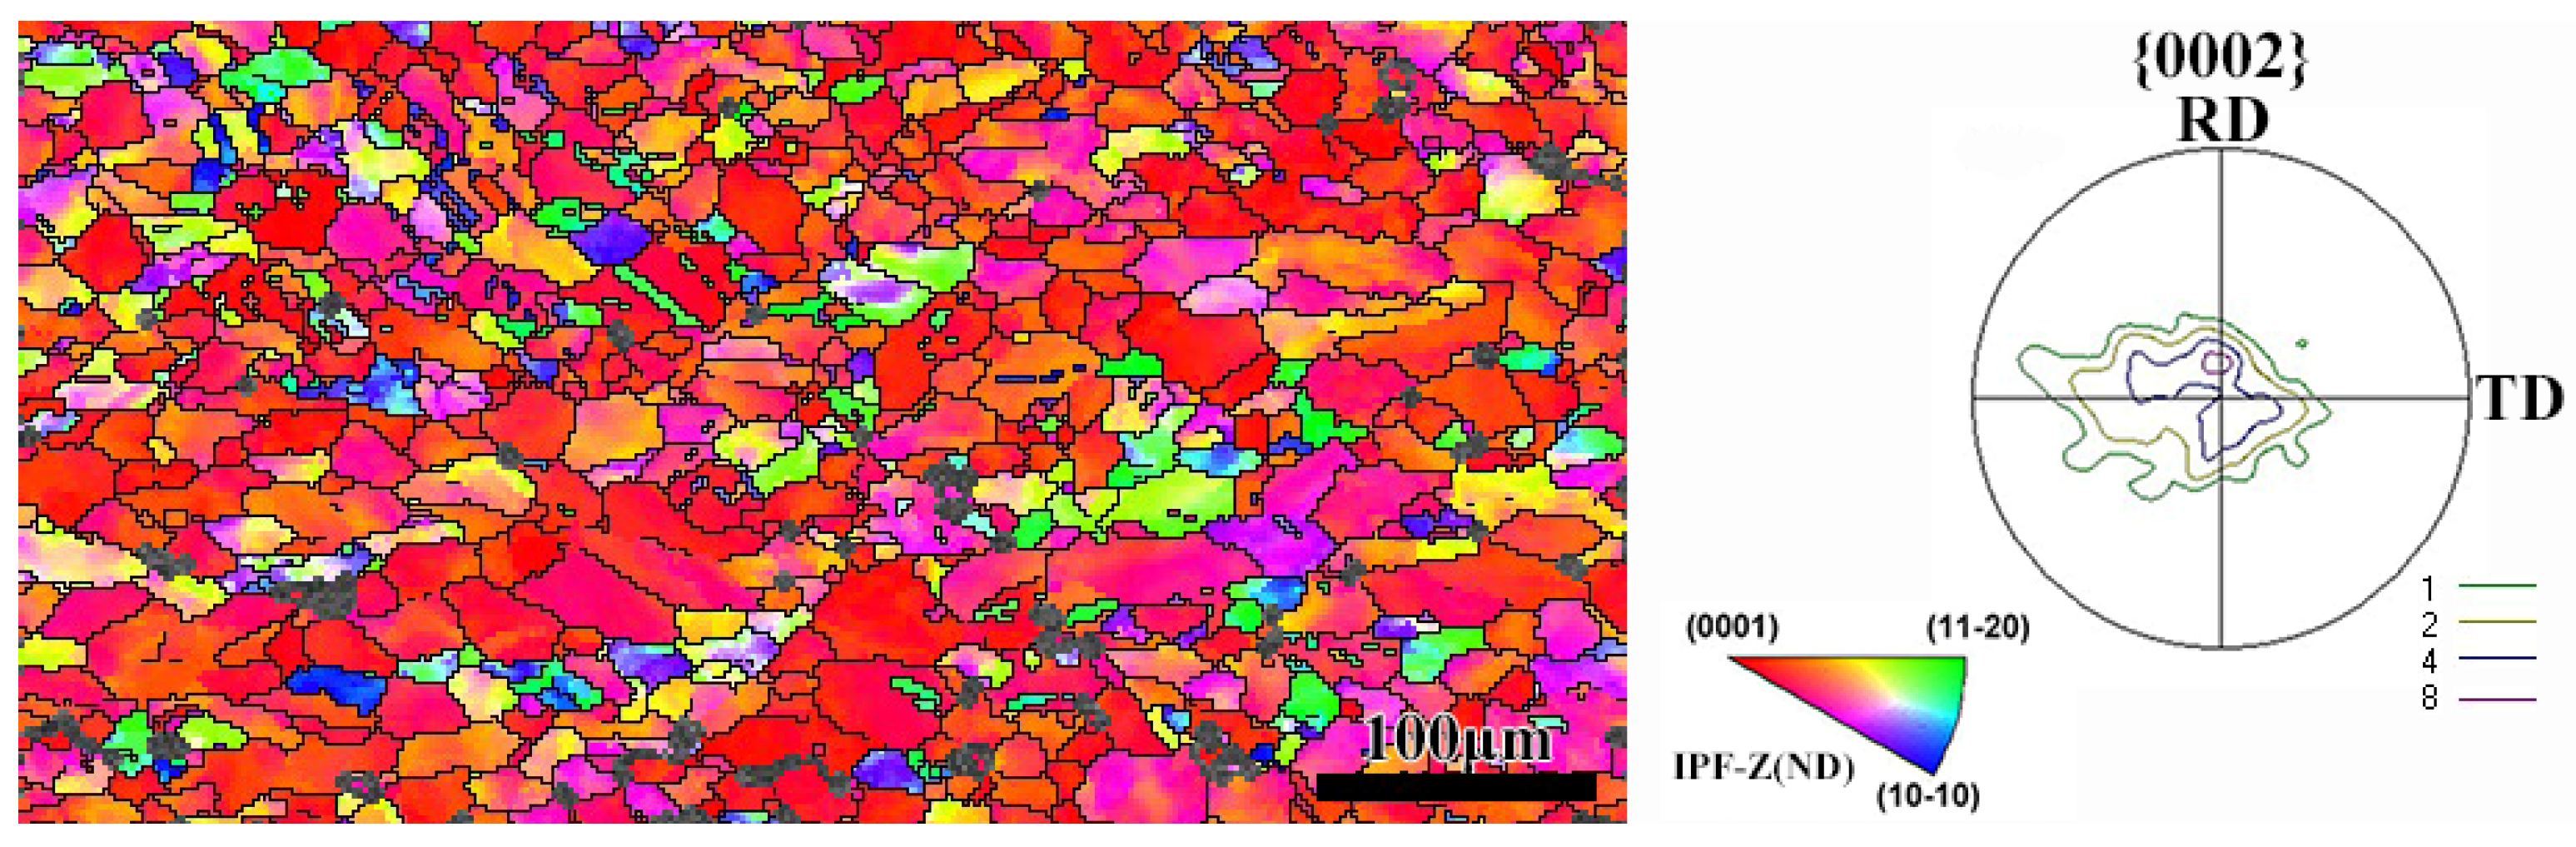
A forged commercial titanium bar was utilized for experiment. The mass fraction of Ti was over 99% and the sum of other compositions was less than 1%. The original microstructure and texture are shown in Figure 1. The phase transformation temperature was 897 °C tested with differential thermal analysis (TA Instruments, New Castle, PA, USA). The forged bar had a microstructure of equiaxed grains and the orientation was nearly random. The original forged bar was cut into samples of 50 mm × 50 mm × 2 mm for cold rolling and warm rolling. The samples were rolled with reductions of 80% and 90% at room temperature and 600 °C, respectively. Consequently, certain samples were annealed at 1100 °C, 1000 °C, and 800 °C with argon atmosphere to obtain different textures through phase transformation or recrystallization. For the samples annealed at 1100 °C, the cooling rate was controlled to obtain columnar grain. The D-8 Advanced X-ray diffraction machine (Bruker, Karlsruhe, Germany) was used to measure the macro texture of cold-rolled and warm-rolled samples. The EBSD (electron back scattering diffraction) system (Channel 5), mounted on a Zeiss Ultra55 scanning electron microscope (Zeiss, Oberkochen, Germany), was utilized to present the orientation features of the annealed samples. For the examinations, the samples were electropolished with a polishing solution consisting of 5% perchloric acid and 95% ethyl alcohol, along with a voltage of 30 V for 30 s at room temperature.
3. Results and Discussion
3.1. Texture Following Rolling and Recrystallization
The texture of the cold-rolled sample was a basal texture with a 30° rotation around the rolling direction. Moreover, the texture was strengthened with the increasing strain, as presented in Figure 2a,b. For the 600 °C rolled sample, the texture was more similar to the basal texture (see Figure 2c,d). The limited slip system led to twinning during the cold rolling in pure titanium. For the samples rolled at 600 °C, other slip systems were activated, including the cylindrical slip and the pyramidal slip. Also, twinning could hardly occur because the slip system was sufficient for deformation. The microstructure of the warm-rolled sample remained recrystallized following each rolling pass which is presented in Figure 3. The sample was heated to 600 °C following each rolling pass to ensure the rolling temperature stability.
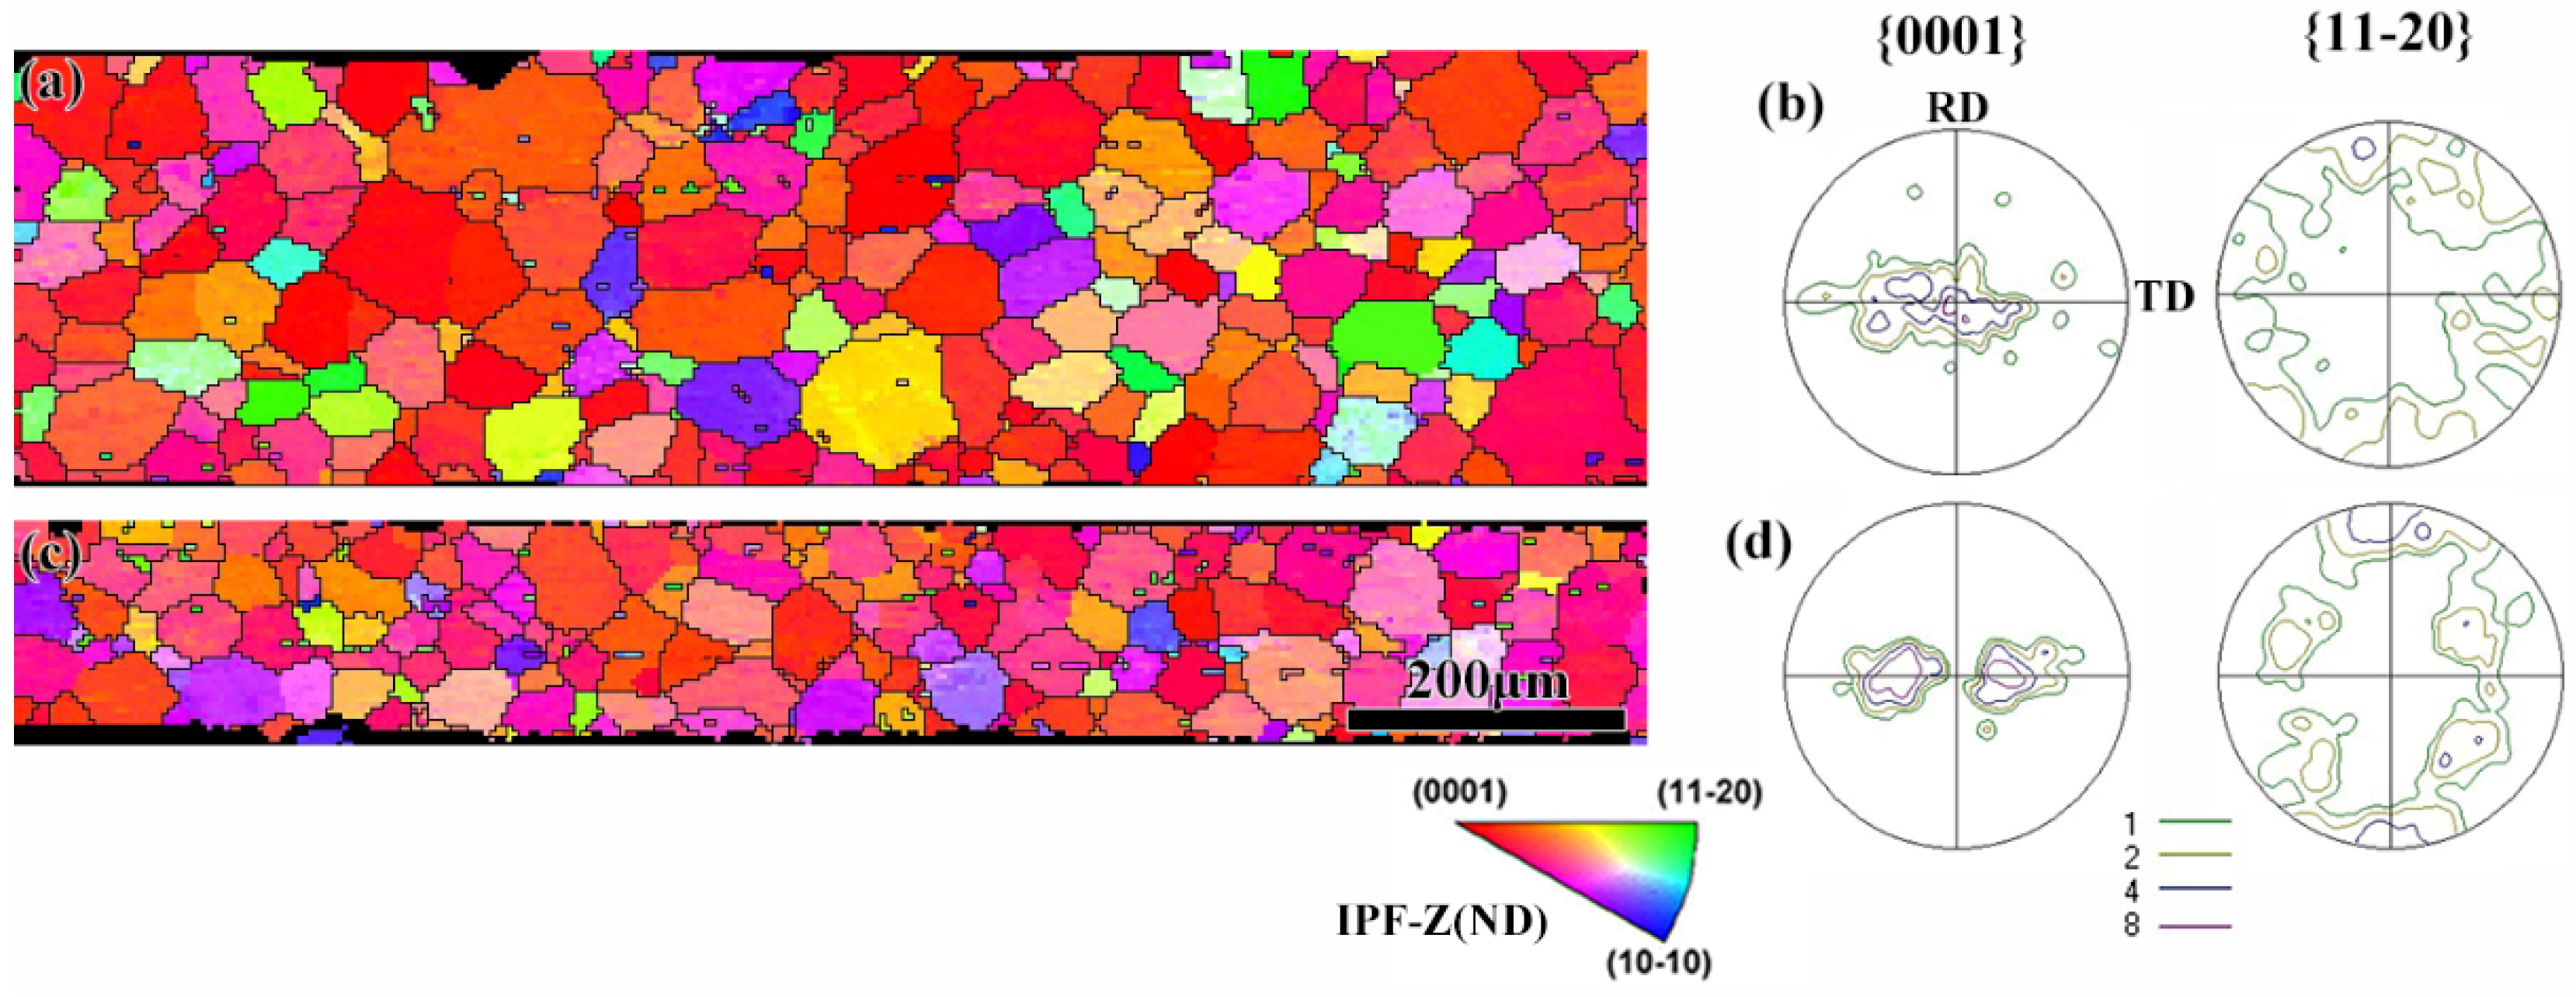
The recrystallization textures of the 80% and 90% samples were tested through EBSD, as is presented in Figure 4. The similar texture of the 30° rotated basal component was retained following recrystallized annealing for the 90% rolled sample, whereas for the 80% cold rolled sample, scattered basal texture occurred following recrystallization. Higher deformation could provide additional potential locations for nucleation and increased driving force for grain growth. As a result, the additional deformation orientation could be retained following recrystallization. Basal oriented grains form in the 80% rolled sample to coordinate the strain induced by transformation, because for the formation of 30° rotated basal texture, the driving force was insufficient.
3.2. Texture Inheritance Following Annealing at 1000 °C
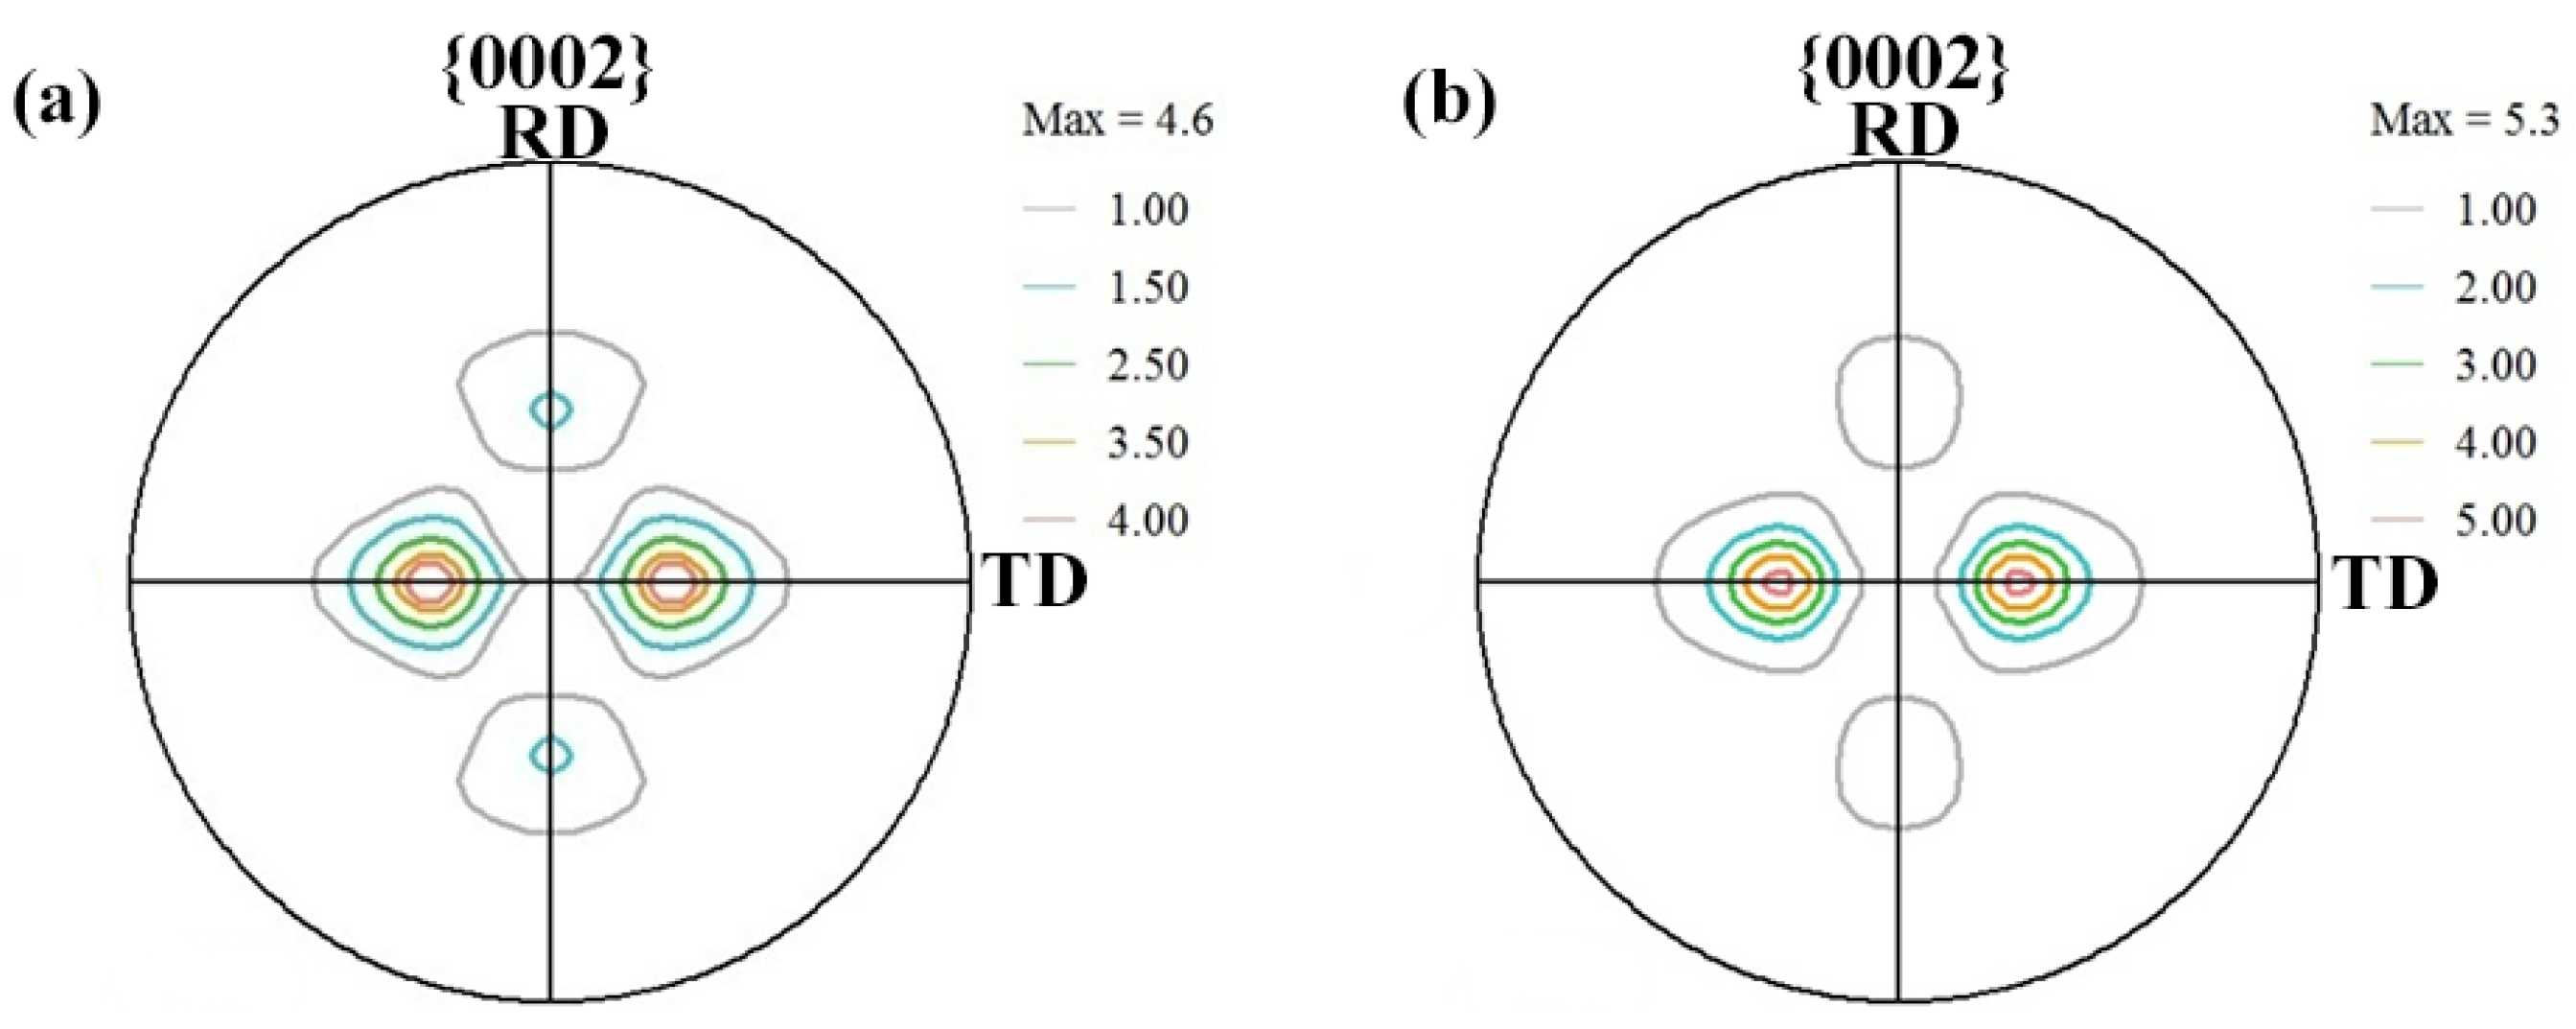
The texture of the annealing sample at 1000 °C was mainly composed of a 30° rotated basal texture that was similar to the cold-rolled sample. Also, the intensity of the texture increased compared to the cold-rolled sample as a distinct variant selection. The results of the texture regarding the samples annealed at 1000 °C for 1 and 3 min are presented in Figure 5. Additionally, another texture component occurred in that the {0001} plane had a 45° rotation around the TD (transverse direction) from the ND (normal direction). The misorientations of these four texture components retained the orientation relationship of the variants from a common parent orientation. The strain energy during the α→β→α transformation would be the lowest in the case where the transformed α phase retained the same orientation as the deformed α phase. The surface effect that induced the formation of columnar grains did not occur for this annealing parameter. The texture hardly changed following the α→β→α transformation due to the inheritance of texture.
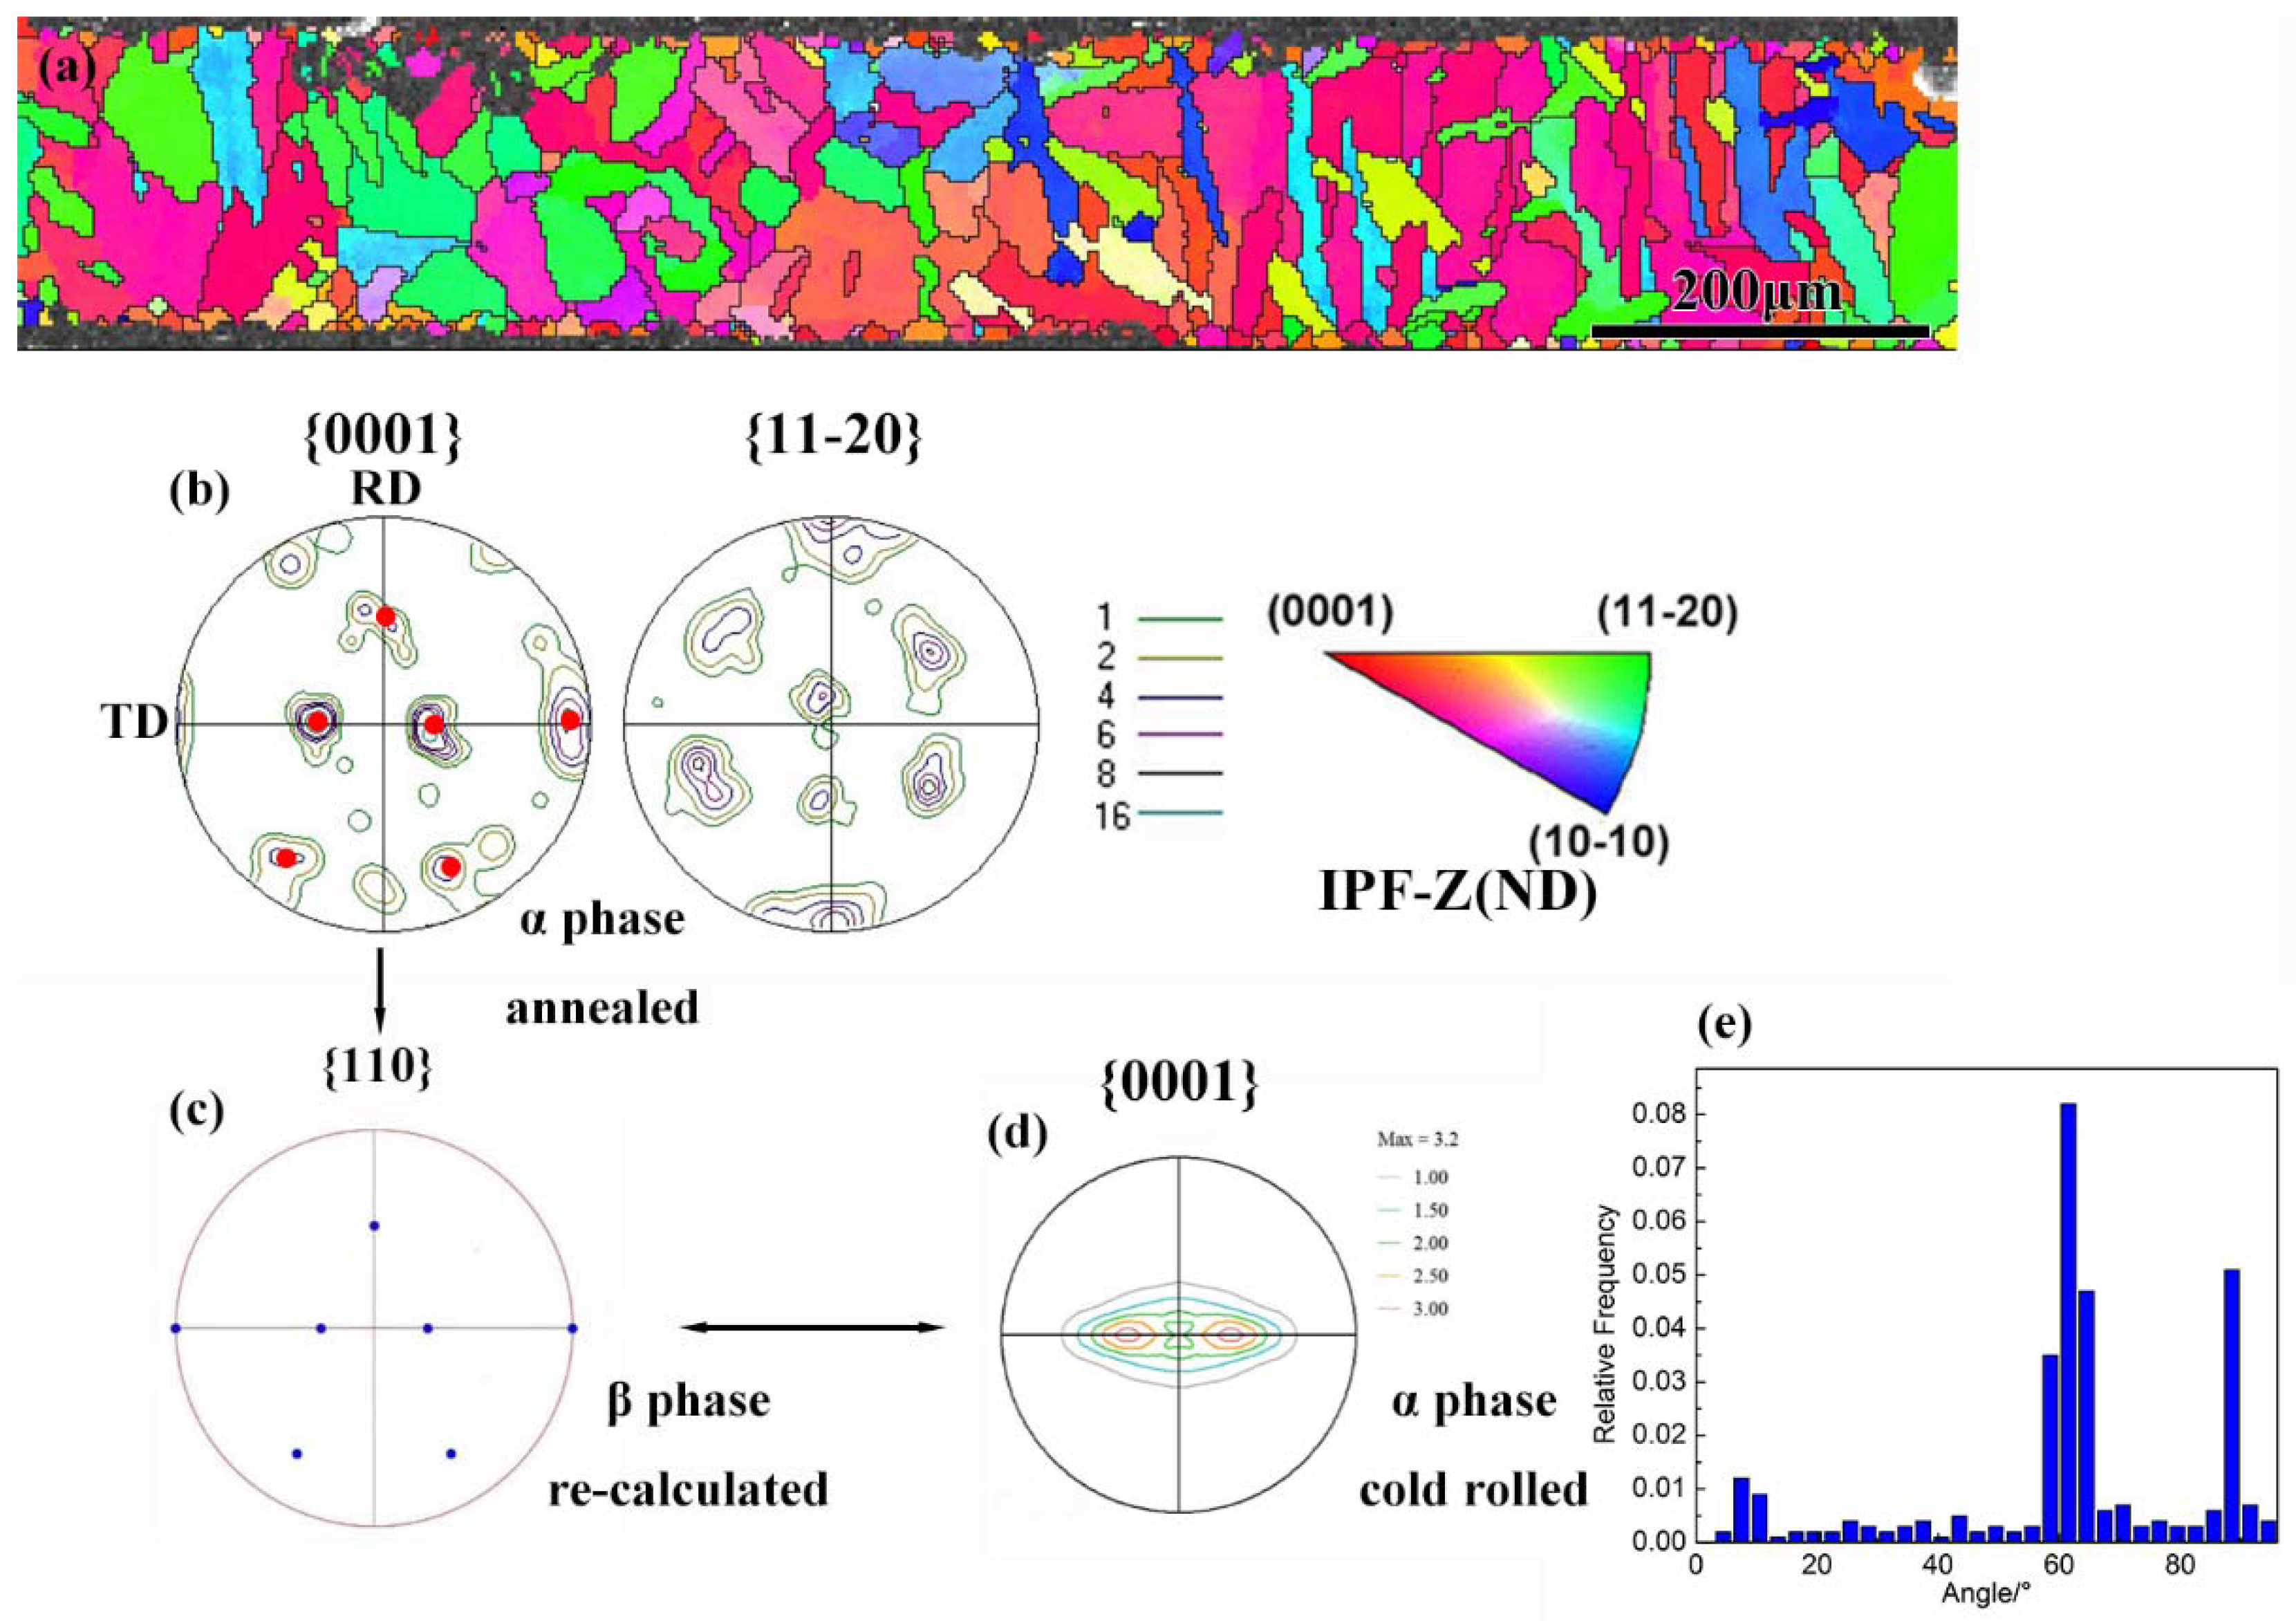
The morphology of the annealed sample was thin plate or irregular bulk, as presented from the EBSD mapping in Figure 6. An evident characterization of the transformation from the shape of α grains was demonstrated. Twelve different orientations of α grains were produced, while retaining a strict Burgers orientation relationship among these orientations. The misorientation angles were distributed around 60°, as presented in Figure 6e. A strict Burgers orientation relationship in the alpha phase grains was also exhibited. The 12 variants were transformed from the same parent grain. From the orientations of the α phase variants, it could be concluded that the texture of β phase was strong following the α→β transformation. According to the Burgers orientation relationship, the orientation of β phase was {112} <111>, which could be re-calculated from the 12 α variants. The texture intensities of the six variants are different, as presented in the {0001} pole figure. The two variants with 30° rotated basal orientation had higher intensities compared to the other four variants. The same feature could also be observed from the pole figure through XRD in Figure 6d. An evident variant selection formed the strong 30° rotated basal texture during the α→β→α transformation. The deformation orientation was more easily retained following the phase transformation. For the sample subjected to warm rolling and 1000 °C of annealing, a texture inheritance also occurred subsequently to the phase transformation, as presented in Figure 7. The transformed α phase had the same basal texture as the warm-rolled sample. However, the intensity of the basal texture became weaker compared to the deformed texture. The defects and strain energy of the warm-rolled sample were lower than the cold-rolled sample. The variant selection was weakened due to the lower driving force induced by the strain energy. As a result, the transformation texture was weaker following annealing. The α phase morphology after annealing was equiaxed due to the inheritance during the α→β→α transformation.
3.3. Formation of Columnar Grains by Surface Effect and Variant Selection during Transformation
The transformation texture was mainly affected by the nucleation and grain growth during β→α transformation. Annealing at the β region and the subsequent cooling-rate control process was conducted to induce the nucleation in the surface of the sheet. Figure 8 shows the orientation and morphology of the cold-rolled sheet after 1000 °C annealing with a cooling rate of 400 °C/h. Following slow cooling, the α grains became coarser and even across the entire sheet. It could be concluded that the phase transformation was completed based on the misorientation distribution presented in Figure 8, because it was in accordance with the orientation relationship of the variants. Notably, the characterization of orientation was similar to the water-cooled sample. All the variants formed homogenously, and the transformation texture was apparently weakened. The texture component fraction of {11–20}//RD was below 30%.
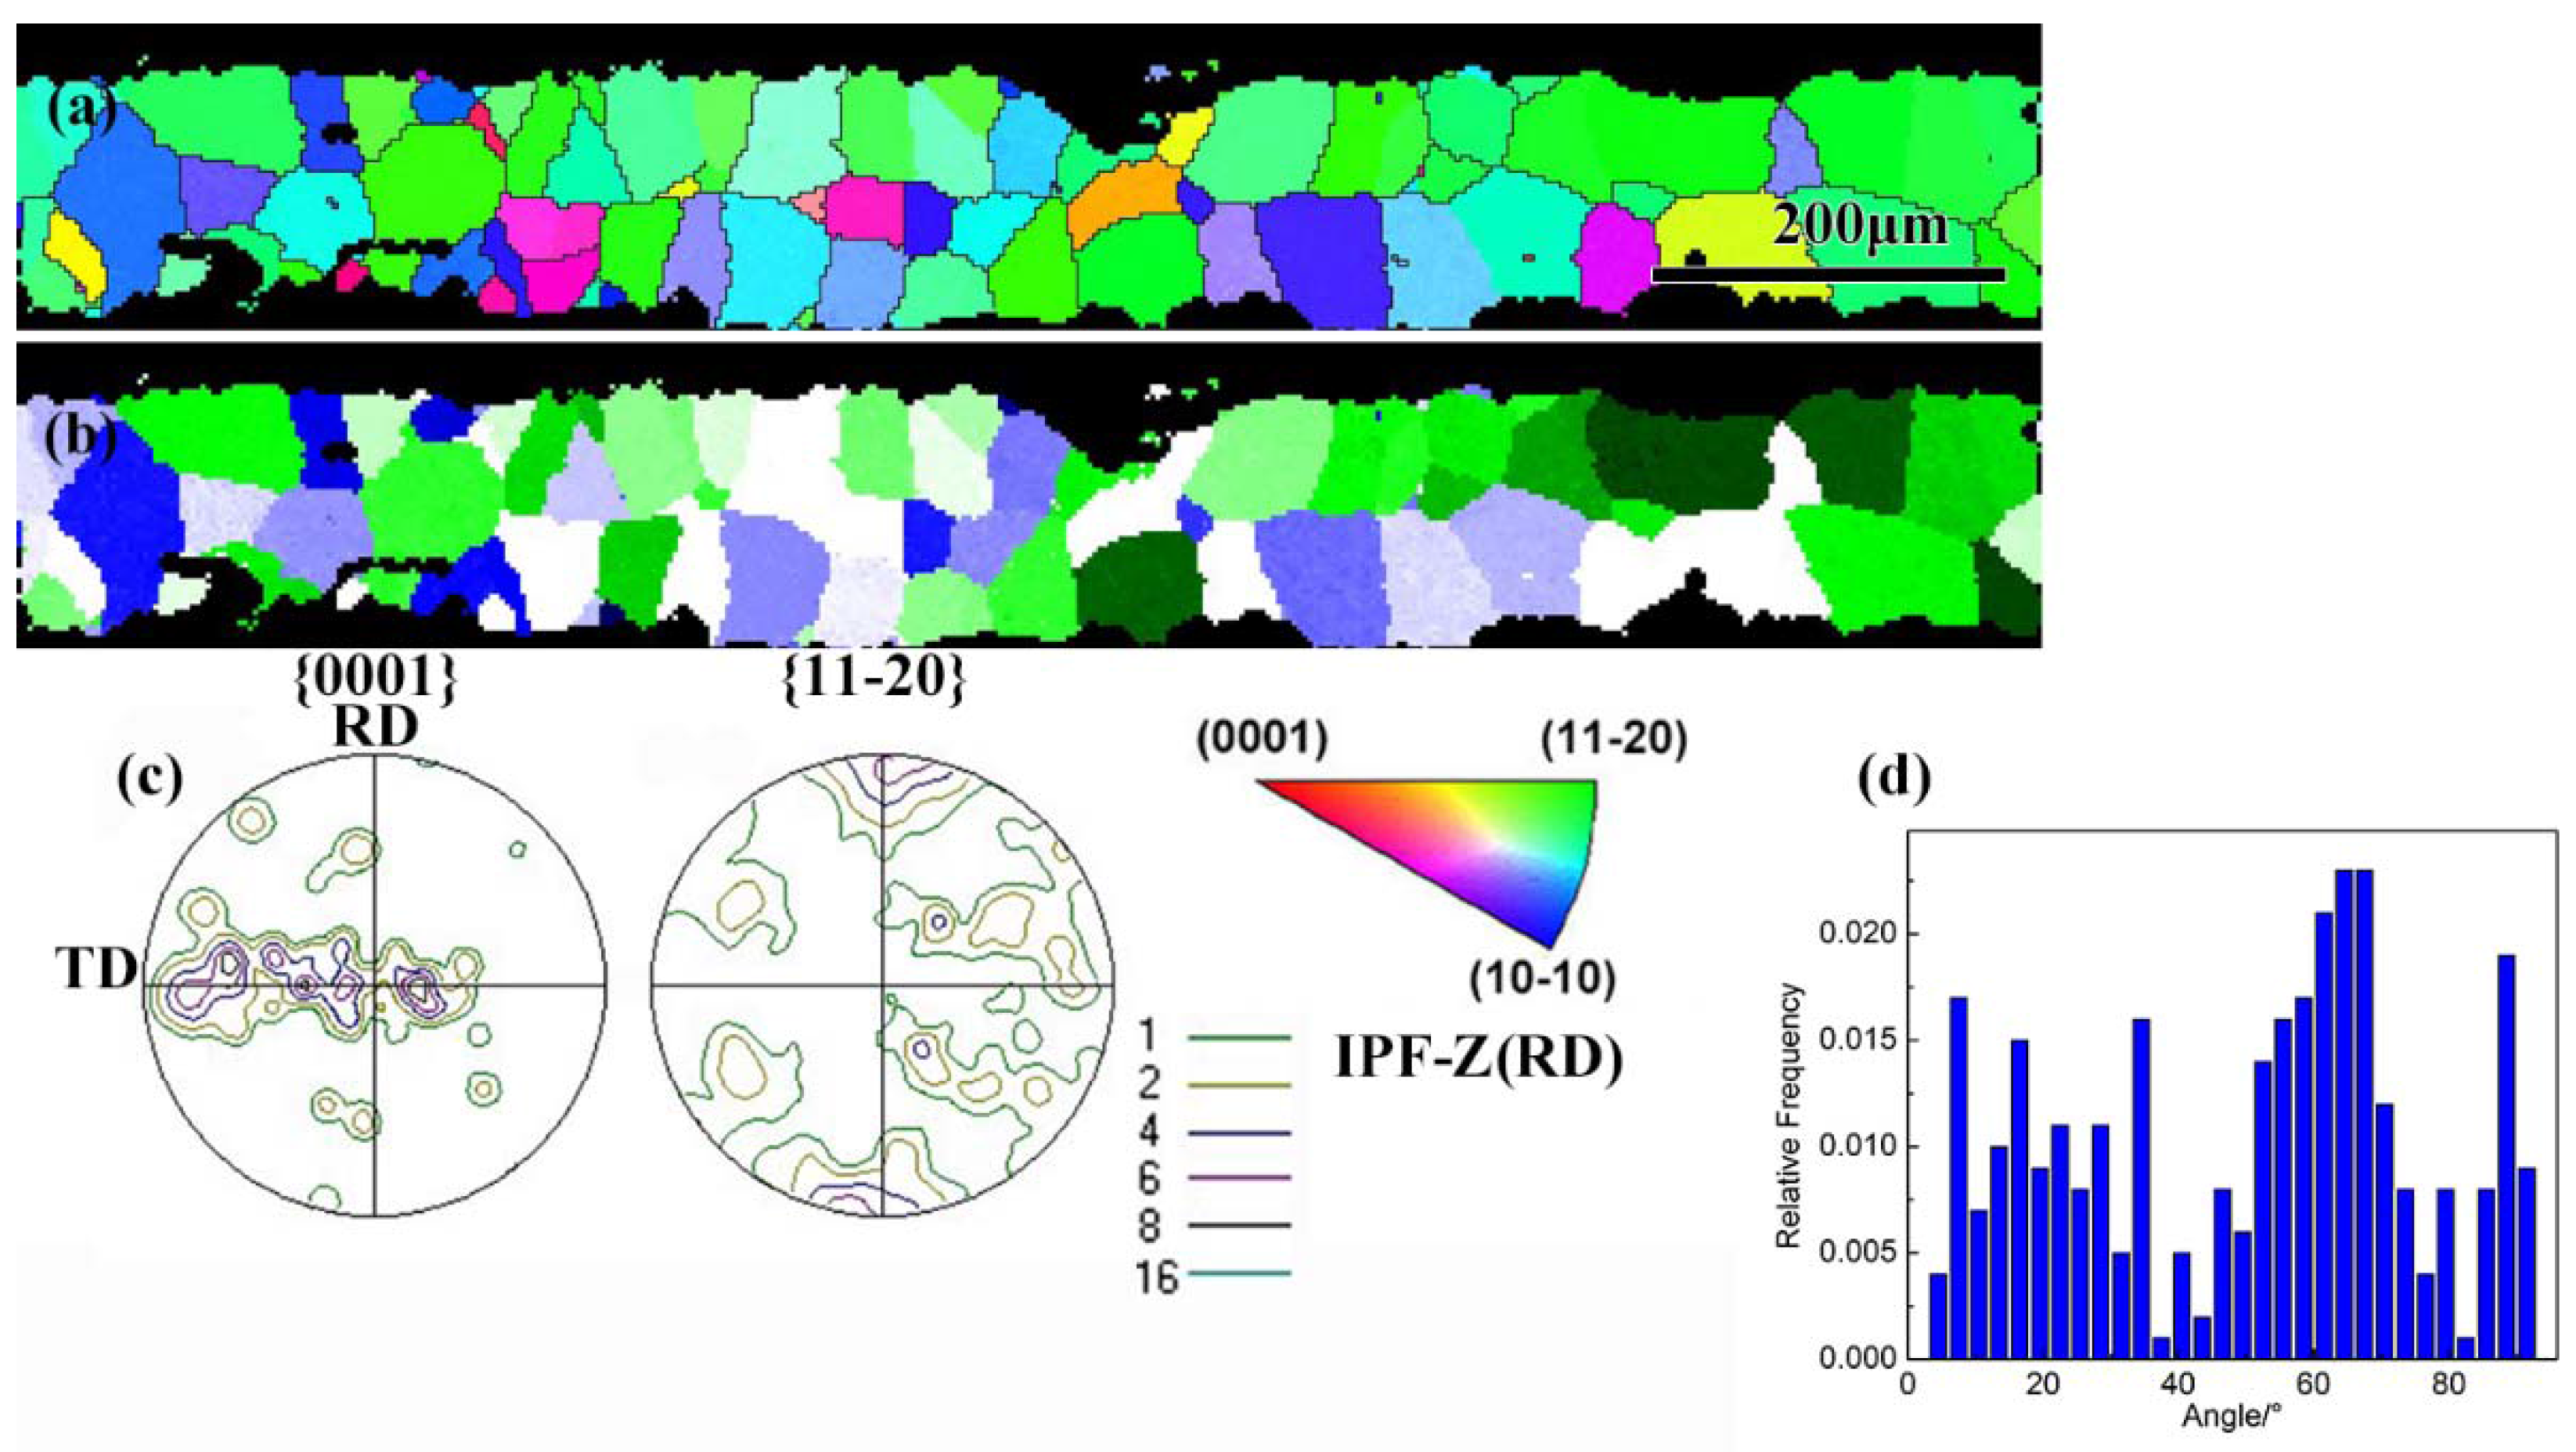
To obtain the columnar grain structure, the annealing temperature was raised to 1100 °C. As the thickness of the cold-rolled sheet was only 0.2 mm, the heating rate of the sample could be significantly high. As a result, there was nearly no time for recrystallization prior to the α→β transformation because the temperature could reach the β single phase region within several seconds. All columnar grains were stretched from the surface to the center of the sheet which was presented in Figure 9. Also, the sample was entirely occupied with columnar grains. The columnar grains possessed a common texture component that the {11–20} plane was parallel to the rolling direction. The fraction of this texture is greater than 70%, which results in a strong fiber texture. Additional strain energy could be retained prior to the α→β transformation, due to the high heating rate for the 1100 °C annealed sample. The retained strain energy could contribute to the strong texture formation of β phase during the first phase transformation, which provided the condition for the strong texture of the α phase following the β→α transformation. For the β→α transformation during cooling, the coordination of the transformation strain energy between neighbor columnar grains promoted the occurrence of variant selection. The strain energy tended to be minimum during transformation. Most misorientations of the columnar grains were concentrated around 60° and 90°, which provided the orientation relationships of the variants. In contrast, certain grains deviated from the orientation relationship of variants with most grains. Since the Burgers orientation relationship was always well retained during transformation, it could be concluded that certain β grains did not share the same orientation with most β grains.
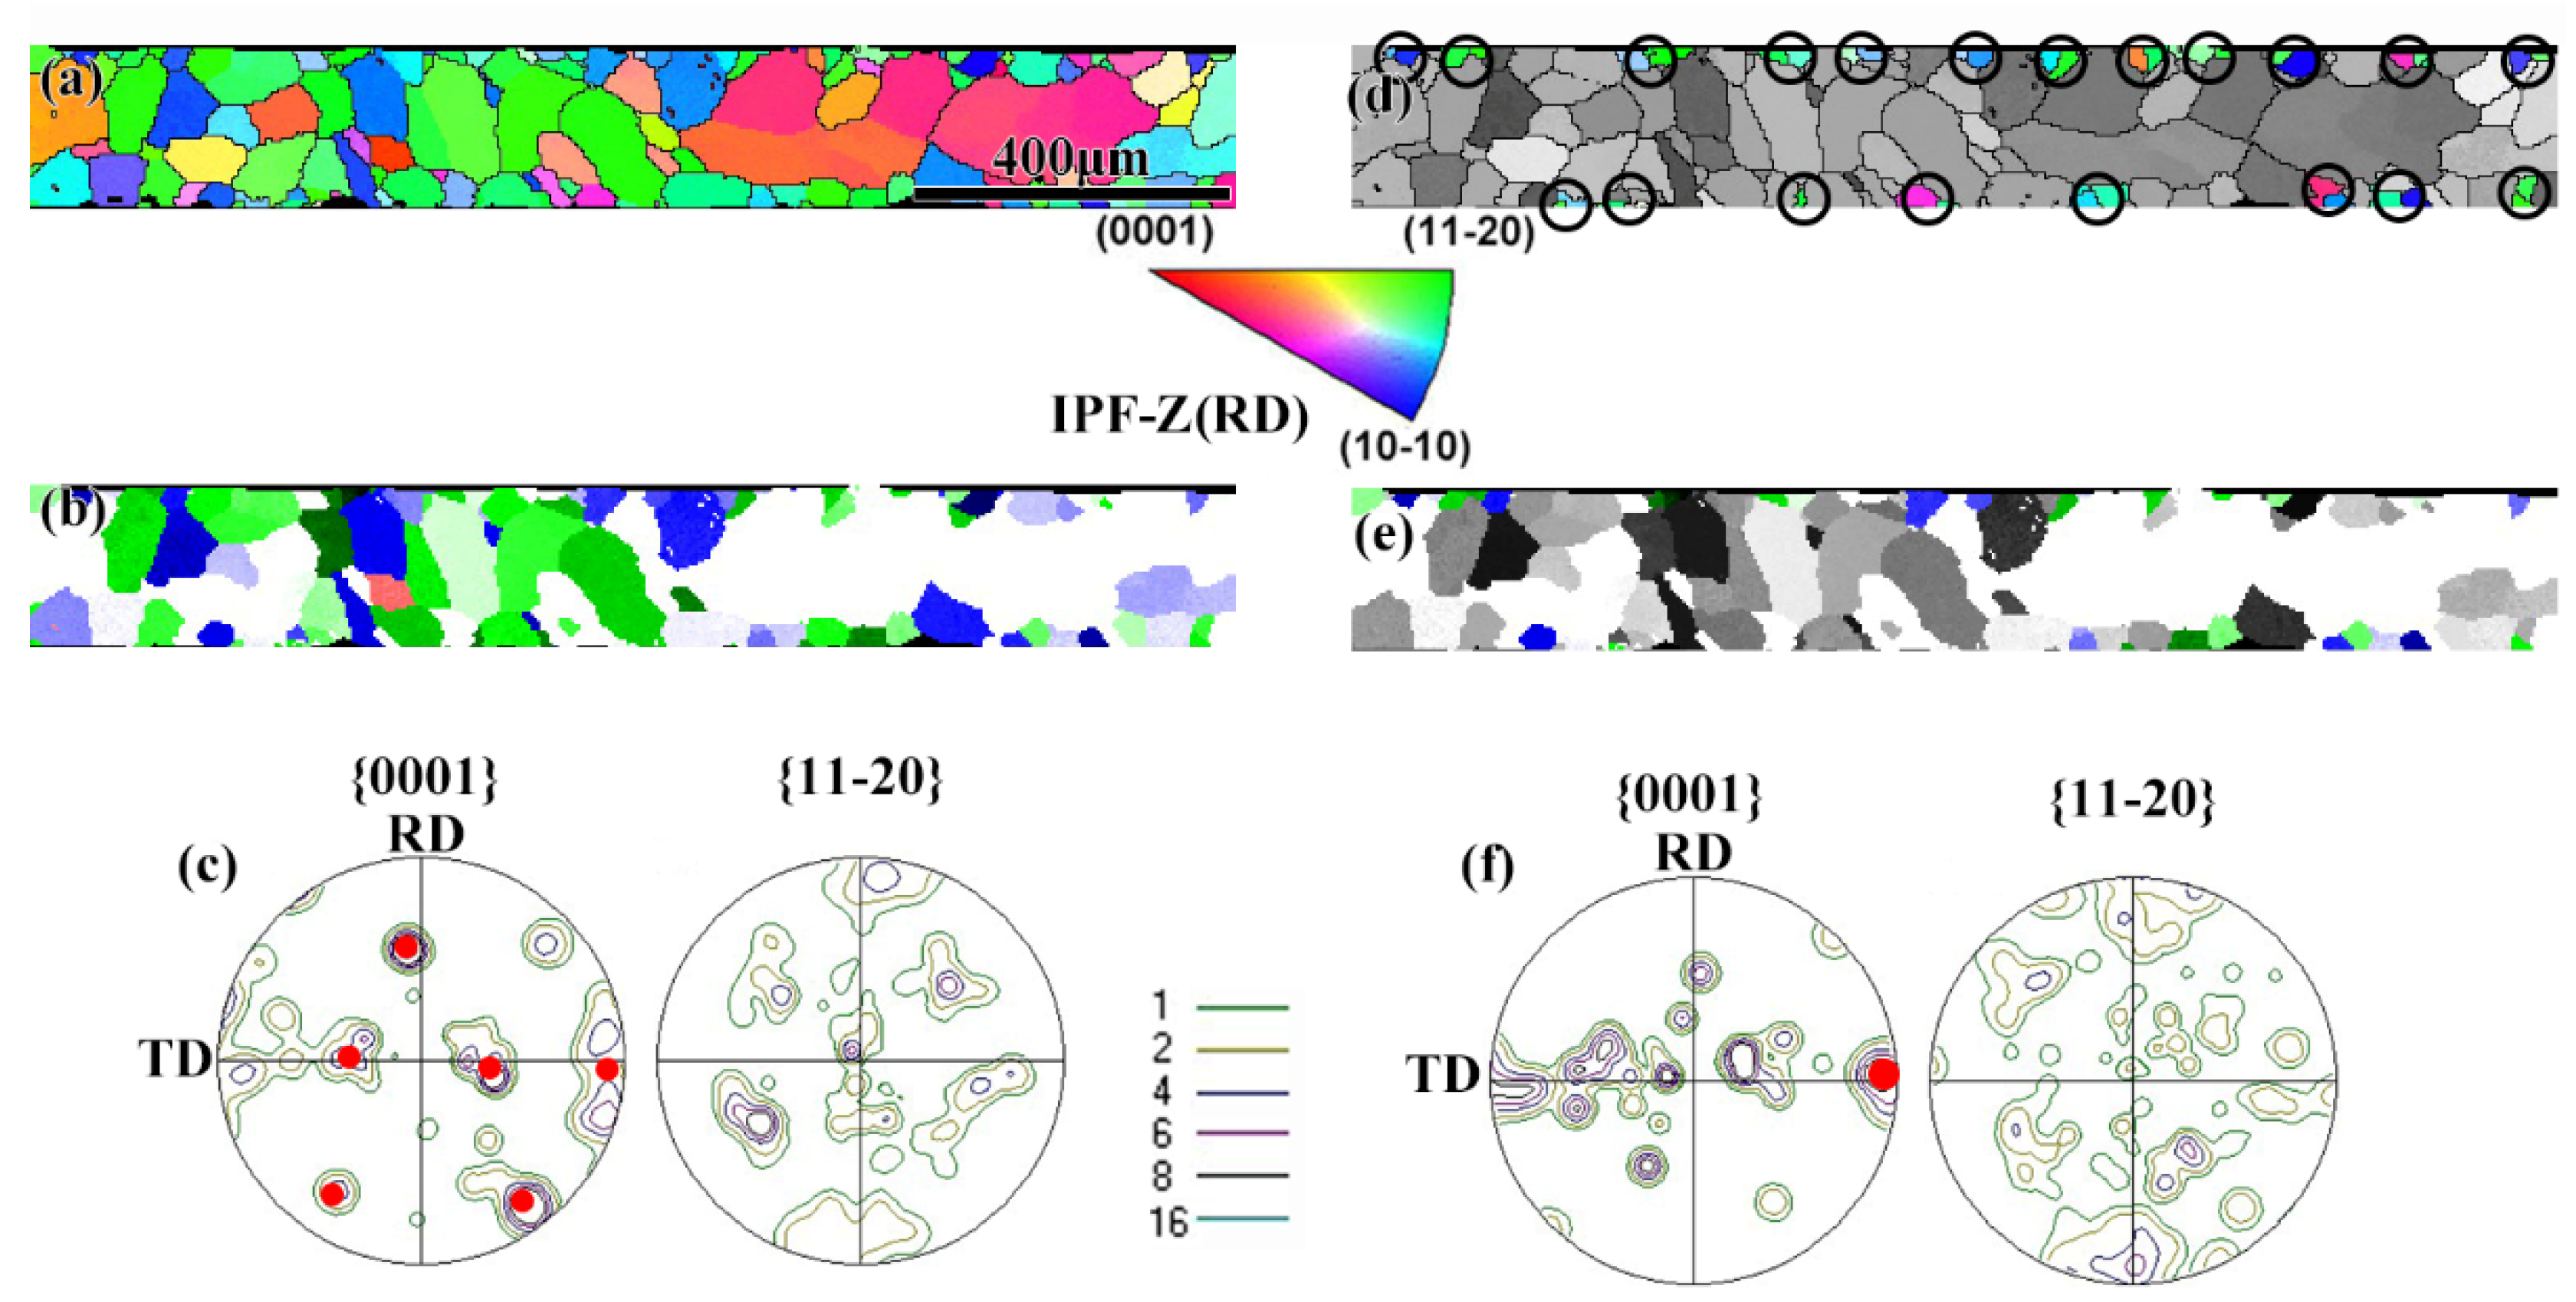
Interruption with water-quenching was conducted during the cooling of the 1100 °C annealed sample to obtain the initial status on the formation of the columnar grains. The mechanisms of nucleation and grain growth were investigated from the interrupted sample, as presented in Figure 10. The columnar grains were formed on the surface of the sheet due to the temperature gradient effect from the surface to the center. Most nucleated grains in the surface had an orientation in which the {11–20} plane was parallel to the rolling direction. The texture inheritance also existed in that the α phase formed from the surface. Almost all fine grains on the surface formed in pairs. The misorientation angle between each pair was approximately 60° and the rotated axis was <11–20>, as presented in Figure 11. A <11–20>60° relationship among the nucleated α phase grains was displayed. With regard to the texture inheritance during annealing, the rotated basal texture was reserved and the basal rotated orientations had the corresponding {11–20}//RD. With the coordination of strain energy, another texture component formed, as presented with red points in Figure 10f. It had a <11–20>60° relationship with the basal rotated texture components. The total strain energy of the grain pairs could be decreased, as the strain coordination caused the minimum resistance during the β→α transformation. As a result, variant selection occurred during the subsequent grain growth. With the temperature gradient control, the preferential grains could grow into the center of the sheet from both sides. The columnar grains with strong texture formed due to the variant selection and the growth control related to the surface effect.
Processed with different deforming and annealing parameters, three main textures could be obtained. The texture characteristics under different processes and the texture types of pure titanium sheets are presented in Table 1. Different types of textures could be controlled during cold rolling, warm rolling, and subsequent annealing.
4. Conclusions
- (1)
- Columnar grains with strong {11–20}//RD texture were obtained through the induction of surface effects in commercial pure titanium. The preferred nucleation on the surface and the lowest strain energy of variant pairs with <11–20>60° relationship during grain growth caused the formation of columnar grains and the variant selection.
- (2)
- Two different microstructures formed following 1000 °C and 1100 °C cooling-controlled annealing. For the annealing at 1000 °C, the stored energy of cold rolling was the main factor that promoted the reservation of rolling texture. For the annealing at 1100 °C, the minimum transformed strain energy was the main factor that caused variant selection during nucleation and grain growth.
- (3)
- A strong basal texture could be obtained through warm rolling at 600 °C, which was beneficial to the stamping property. A strong 30° rotated basal texture could be formed following cold rolling and the weak deformed texture could be retained following recrystallization annealing.
Author Contributions
K.L. and P.Y. conceived and designed the experiments; F.C. assisted with the orientation detection. K.L., P.Y., and W.M. performed the experiments and analyzed the data; K.L. wrote the paper.
Acknowledgments
This work was supported by the National Natural Science Foundation of China (No. 51771024 and No. 51571024).
Conflicts of Interest
All authors declare no conflict of interest.
References
- Ohwue, T.; Kobayashi, Y. Analysis of earring in circular-shell deep-drawing of bcc and hcp sheet metals. Procedia Eng. 2014, 81, 887–892. [Google Scholar] [CrossRef]
- Kim, H.S.; Yoo, S.J.; Ahn, J.W.; Kim, D.H.; Kim, W.J. Ultrafine grained titanium sheets with high strength and high corrosion resistance. Mater. Sci. Eng. A 2011, 528, 8479–8485. [Google Scholar] [CrossRef]
- Won, J.W.; Park, C.H.; Hong, S.; Li, C.S. Deformation anisotropy and associated mechanisms in rolling textured high purity titanium. J. Alloys Compd. 2015, 651, 245–254. [Google Scholar] [CrossRef]
- Nakai, M.; Niinomi, M.; Hieda, J.; Cho, K.; Nagasawa, Y.; Konno, T.; Ito, Y.; Itsumi, Y.; Oyama, H. Reduction in anisotropy of mechanical properties of coilable (α + β)-type titanium alloy thin sheet through simple heat treatment for use in next-generation aircraft applications. Mater. Sci. Eng. A 2014, 594, 103–110. [Google Scholar] [CrossRef]
- Kock, U.F.; Tome, C.N.; Wenk, H.R. Texture and Anisotropy: Preferred Orientation in Polycrystals and Their Effect on Materials Properties; Cambridge University Press: Cambridge, UK, 1998; pp. 203–208. [Google Scholar]
- Kowalczyk, G.K.; Sztwiertnia, K.; Kawałko, J.; Wierzbanowski, K.; Wronski, M.; Frydrych, K.; Stupkiewicz, S.; Petryk, H. Texture evolution in titanium on complex deformation paths: Experiment and modelling. Mater. Sci. Eng. A 2015, 637, 251–263. [Google Scholar] [CrossRef]
- Chun, Y.B.; Yu, S.H.; Semiatin, S.L.; Hwang, S.K. Effect of deformation twinning on microstructure and texture evolution during cold rolling of CP-titanium. Mater. Sci. Eng. A 2005, 398, 209–219. [Google Scholar] [CrossRef]
- Gurao, N.P.; Sethuraman, S.; Suwas, K. Texture and shape memory behavior of Ti-22Nb-6Ta alloy. Metall. Mater. Trans. A 2012, 44, 1497–1507. [Google Scholar] [CrossRef]
- Bozzolo, N.; Dewobroto, N.; Grosdidier, T.; Wagner, F. Texture evolution during grain growth in recrystallized commercially pure titanium. Mater. Sci. Eng. A 2005, 397, 346–355. [Google Scholar] [CrossRef]
- Li, K.; Yang, P. Interaction among deformation, recrystallization and phase transformation of TA2 pure titanium during hot compression. Trans. Nonferrous Met. Soc. 2016, 26, 1863–1870. [Google Scholar] [CrossRef]
- Jiang, H.T.; Liu, J.X.; Mi, Z.L.; Zhao, A.M.; Bi, Y.J. Texture evolution of commercial pure Ti during cold rolling and recrystallization annealing. Int. J. Miner. Metall. Mater. 2012, 19, 530–535. [Google Scholar] [CrossRef]
- Furuhara, T.; Maki, T. Variant selection in heterogeneous nucleation on defects in diffusional phase transformation and precipitation. Mater. Sci. Eng. A 2001, A312, 145–154. [Google Scholar] [CrossRef]
- Bache, M.R.; Evans, W.J. Impact of texture on mechanical properties in an advanced titanium alloy. Mater. Sci. Eng. A 2001, 319, 409–414. [Google Scholar] [CrossRef]
- Sargent, G.A.; Kinsel, K.T.; Pilchak, A.L.; Salem, A.A.; Semiatin, S.L. Variant selection during cooling after beta annealing of Ti-6Al-4V ingot material. Metall. Mater. Trans. A 2012, 43, 3570–3585. [Google Scholar] [CrossRef]
- Qiu, D.; Shi, R.; Zhang, D.; Lu, W.; Wang, Y. Variant selection by dislocations during α precipitation in α/β titanium alloys. Acta Mater. 2015, 88, 218–231. [Google Scholar] [CrossRef]
- Daymond, M.R.; Holt, R.A.; Cai, S.; Mosbrucker, P.; Vogel, S.C. Texture inheritance and variant selection through an hcp–bcc–hcp phase transformation. Acta Mater. 2010, 58, 4053–4066. [Google Scholar] [CrossRef]
- Germain, L.; Gey, N.; Humbert, M.; Hazotte, A.; Bocher, P.; Jahazi, M. An automated method to analyze separately the microtextures of primary αp grains and the secondary αs inherited colonies in bimodal titanium alloys. Mater. Charact. 2005, 54, 216–222. [Google Scholar] [CrossRef]
- Zhang, L.W.; Yang, P.; Wang, J.H.; Mao, W.M. Transformation of {100} texture induced by surface effect in ultra-low carbon electrical steel. J. Mater. Sci. 2016, 51, 8087–8097. [Google Scholar] [CrossRef]
Figure 1.
Orientation map with IPF (inverse pole figure) colors and pole figures of forged commercial titanium bar.
Figure 1.
Orientation map with IPF (inverse pole figure) colors and pole figures of forged commercial titanium bar.

Figure 2.
Pole figures of cold-rolled and warm-rolled samples through X-ray diffraction. (a,b) cold rolled with 80% and 90% reductions; (c,d) 600 °C rolled with 80% and 90% reductions; RD represents the rolling direction and TD represents the transverse direction.
Figure 2.
Pole figures of cold-rolled and warm-rolled samples through X-ray diffraction. (a,b) cold rolled with 80% and 90% reductions; (c,d) 600 °C rolled with 80% and 90% reductions; RD represents the rolling direction and TD represents the transverse direction.

Figure 3.
Orientation maps with IPF colors and pole figures of 600 °C rolled samples with 80% reduction.
Figure 3.
Orientation maps with IPF colors and pole figures of 600 °C rolled samples with 80% reduction.

Figure 4.
Orientation maps and pole figures of 80% and 90% cold-rolled samples following recrystallization annealing at 800 °C for 15 min, (a,b) 80% reduction; (c,d) 90% reduction.
Figure 4.
Orientation maps and pole figures of 80% and 90% cold-rolled samples following recrystallization annealing at 800 °C for 15 min, (a,b) 80% reduction; (c,d) 90% reduction.

Figure 5.
{0001} pole figures through X-ray diffraction of cold rolled samples with 90% reduction following 1000 °C of annealing for (a) 1 min, and (b) 3 min.
Figure 5.
{0001} pole figures through X-ray diffraction of cold rolled samples with 90% reduction following 1000 °C of annealing for (a) 1 min, and (b) 3 min.

Figure 6.
Orientation map, pole figures, and misorientation of cold-rolled sample with 90% reduction following annealing at 1000 °C under Ar atmosphere and cooled with water, (a) orientation map with IPF colors; (b) pole figures of annealed α phase; (c) pole figure of recalculated β phase; (d) pole figure of cold-rolled α phase; (e) misorientation of annealed α phase.

Figure 7.
(a) Orientation map, (b) pole figures, and (c) misorientation of warm-rolled sample with 90% reduction following annealing at 1000 °C under Ar atmosphere and cooled with water.
Figure 7.
(a) Orientation map, (b) pole figures, and (c) misorientation of warm-rolled sample with 90% reduction following annealing at 1000 °C under Ar atmosphere and cooled with water.

Figure 8.
(a) Orientation maps; (b) texture component maps ({11–20}//RD is in green color); (c) pole figures; and (d) misorientation of 90% cold-rolled sample following annealing at 1000 °C under Ar atmosphere and cooled with a cooling rate of 400 °C/h.
Figure 8.
(a) Orientation maps; (b) texture component maps ({11–20}//RD is in green color); (c) pole figures; and (d) misorientation of 90% cold-rolled sample following annealing at 1000 °C under Ar atmosphere and cooled with a cooling rate of 400 °C/h.

Figure 9.
(a) Orientation map with IPF colors; (b) orientation map with texture components; (c) pole figures; and (d) misorientation of 90% cold-rolled sample following annealing at 1100 °C under Ar atmosphere and cooled with cooling rate of 400 °C/h.
Figure 9.
(a) Orientation map with IPF colors; (b) orientation map with texture components; (c) pole figures; and (d) misorientation of 90% cold-rolled sample following annealing at 1100 °C under Ar atmosphere and cooled with cooling rate of 400 °C/h.

Figure 10.
Orientation maps with IPF colors and texture components and pole figures of 90% cold-rolled sample following annealing at 1100 °C under Ar atmosphere, cooled with cooling rate of 400 °C/h to 860 °C and quenched with water, (a–c) entire sample; (d–f) surface grains.
Figure 10.
Orientation maps with IPF colors and texture components and pole figures of 90% cold-rolled sample following annealing at 1100 °C under Ar atmosphere, cooled with cooling rate of 400 °C/h to 860 °C and quenched with water, (a–c) entire sample; (d–f) surface grains.

Figure 11.
Misorientation and rotated axis distribution of surface grains in Figure 10.
Figure 11.
Misorientation and rotated axis distribution of surface grains in Figure 10.


Table 1.
Texture characteristics under different processes.
| Processing | Type of Texture |
|---|---|
| Cold rolling | 30° rotated basal texture |
| Warm rolling | Basal texture |
| Cold rolling and 800 °C annealing | 30° rotated basal texture, basal texture |
| Cold rolling and 1000 °C annealing | 30° rotated basal texture, other variants |
| Warm rolling and 1000 °C annealing | Basal texture |
| Cold rolling and 1100 °C annealing | Texture of {11–20}//RD |
© 2018 by the authors. Licensee MDPI, Basel, Switzerland. This article is an open access article distributed under the terms and conditions of the Creative Commons Attribution (CC BY) license (http://creativecommons.org/licenses/by/4.0/).
Share and Cite
MDPI and ACS Style
Li, K.; Yang, P.; Cui, F.-e.; Mao, W. Texture Control of Pure Titanium Sheet by the Surface Effect during Phase Transformation. Metals 2018, 8, 358. https://doi.org/10.3390/met8050358
AMA Style
Li K, Yang P, Cui F-e, Mao W. Texture Control of Pure Titanium Sheet by the Surface Effect during Phase Transformation. Metals. 2018; 8(5):358. https://doi.org/10.3390/met8050358
Chicago/Turabian StyleLi, Kai, Ping Yang, Feng-e Cui, and Weimin Mao. 2018. "Texture Control of Pure Titanium Sheet by the Surface Effect during Phase Transformation" Metals 8, no. 5: 358. https://doi.org/10.3390/met8050358
Note that from the first issue of 2016, this journal uses article numbers instead of page numbers. See further details here.