Article

Effect of Micro-Segregation on Impact Toughness of 2.25Cr-1Mo Steel after Post Weld Heat Treatment

1
Department of Materials Science and Engineering, Pusan National University, San 30 Jangjeon-dong, Geumjeong-gu, Busan 609-735, Korea
2
Industrial Technology Support Division, Korea Institute of Materials Science, 797 Changwondaero, Changwon 641-831, Korea
*
Author to whom correspondence should be addressed.
Metals 2018, 8(6), 373; https://doi.org/10.3390/met8060373
Submission received: 11 May 2018 / Revised: 20 May 2018 / Accepted: 21 May 2018 / Published: 23 May 2018

Abstract

:
2.25Cr-1Mo steel with high strength at high temperatures and superior hydrogen resistance is widely used as power generation boiler material in high-temperature and high-pressure environments. Following the test evaluation of the ASME Boiler and Pressure Vessel Code, specimens from the base metal of a boiler pipe were found to have impact toughness values of 386 and 28J, which are drastically different values. The analysis of the fracture surface of the 28J test specimen revealed MnS inclusions and it was found that cracks were initiated at the inclusions. Observation of the cross-section of the crack propagation front revealed that cracks propagated along the ferrite regions and precipitate voids. Inclusions were also found in the 386J impact specimen. However, the volume fraction of the inclusions was significantly less than that of the 28J specimen. It was also found that the ferrite and carbide content of the 386J specimen was less than the 28J specimen. The reason that the inclusions, ferrite, and carbide content differed in the two adjacent impact test specimens was analyzed. The effects of micro-segregation such as MnS inclusions on ferrite and carbide were compared and analyzed.

1. Introduction

The 2.25Cr-1Mo Steel is widely used as a power plant boiler pipe material [1,2,3,4] due to its high temperature creep strength, good hydrogen resistance, high toughness at high temperatures, and the ability to withstand high pressure hydrogen atmospheres (12–21 MPa) and high temperatures (400 °C to 450 °C) and pressure use environments. Due to its excellent mechanical properties, 2.25Cr-1Mo steel is widely used not only in thermal power plants but also in nuclear power plants where high stability is required [5]. However, 2.25Cr-1Mo steel is prone to reheating cracks after weld heat treatment (PWHT) is performed to remove residual stress after cracking due to the thermal stress from the heating and cooling cycles when the power plant is operating [6,7,8]. The integrity of the material is crucial since such cracks can cause plant shutdowns and secondary hazards. Inspection of the components of a power plant is carried out according to the US ASME Boiler and Pressure Vessel Code and Nuclear Power Plant Components Certification [9]. An important quality test used to evaluate the material integrity is the Charpy V-notch impact test of fracture toughness [10]. For the base metal of boiler tubes, the impact test should also be tested under PWHT heat treatment conditions performed after the welding process. However, in the special case, the impact toughness values measured from the three impact tests can have a large variability even under the same conditions. This phenomenon occasionally occurs in impact specimens taken from the same pipe and even at similar locations. The impact toughness of the material is affected by many parameters such as microstructure, phases fractions and distributions, test temperature, grain size, impact velocity, specimen shape, and notch position (sampling position of test specimen) [11,12,13,14,15,16,17,18]. In the impact test of the base metal, not many variables affect the tests and they are completely linked to metallurgical aspects. If the material fails to meet the impact test requirements during a quality assurance inspection, it is necessary to analyze the cause and take measures to prevent recurrence. In addition, it is possible to prevent the recurrence by analyzing the cause of the variation of the impact test and it can be utilized as a basic data of the quality defect. In this study, we analyzed the variability of the impact test results of 2.25Cr-1.0Mo steel in a power plant boiler pipe to better understand the cause of the variability. Through these studies, we have found that microsegregation (MnS inclusion) affects phase transformation in mztrix structure and this result is considered to be a reference material for PWHT steel.

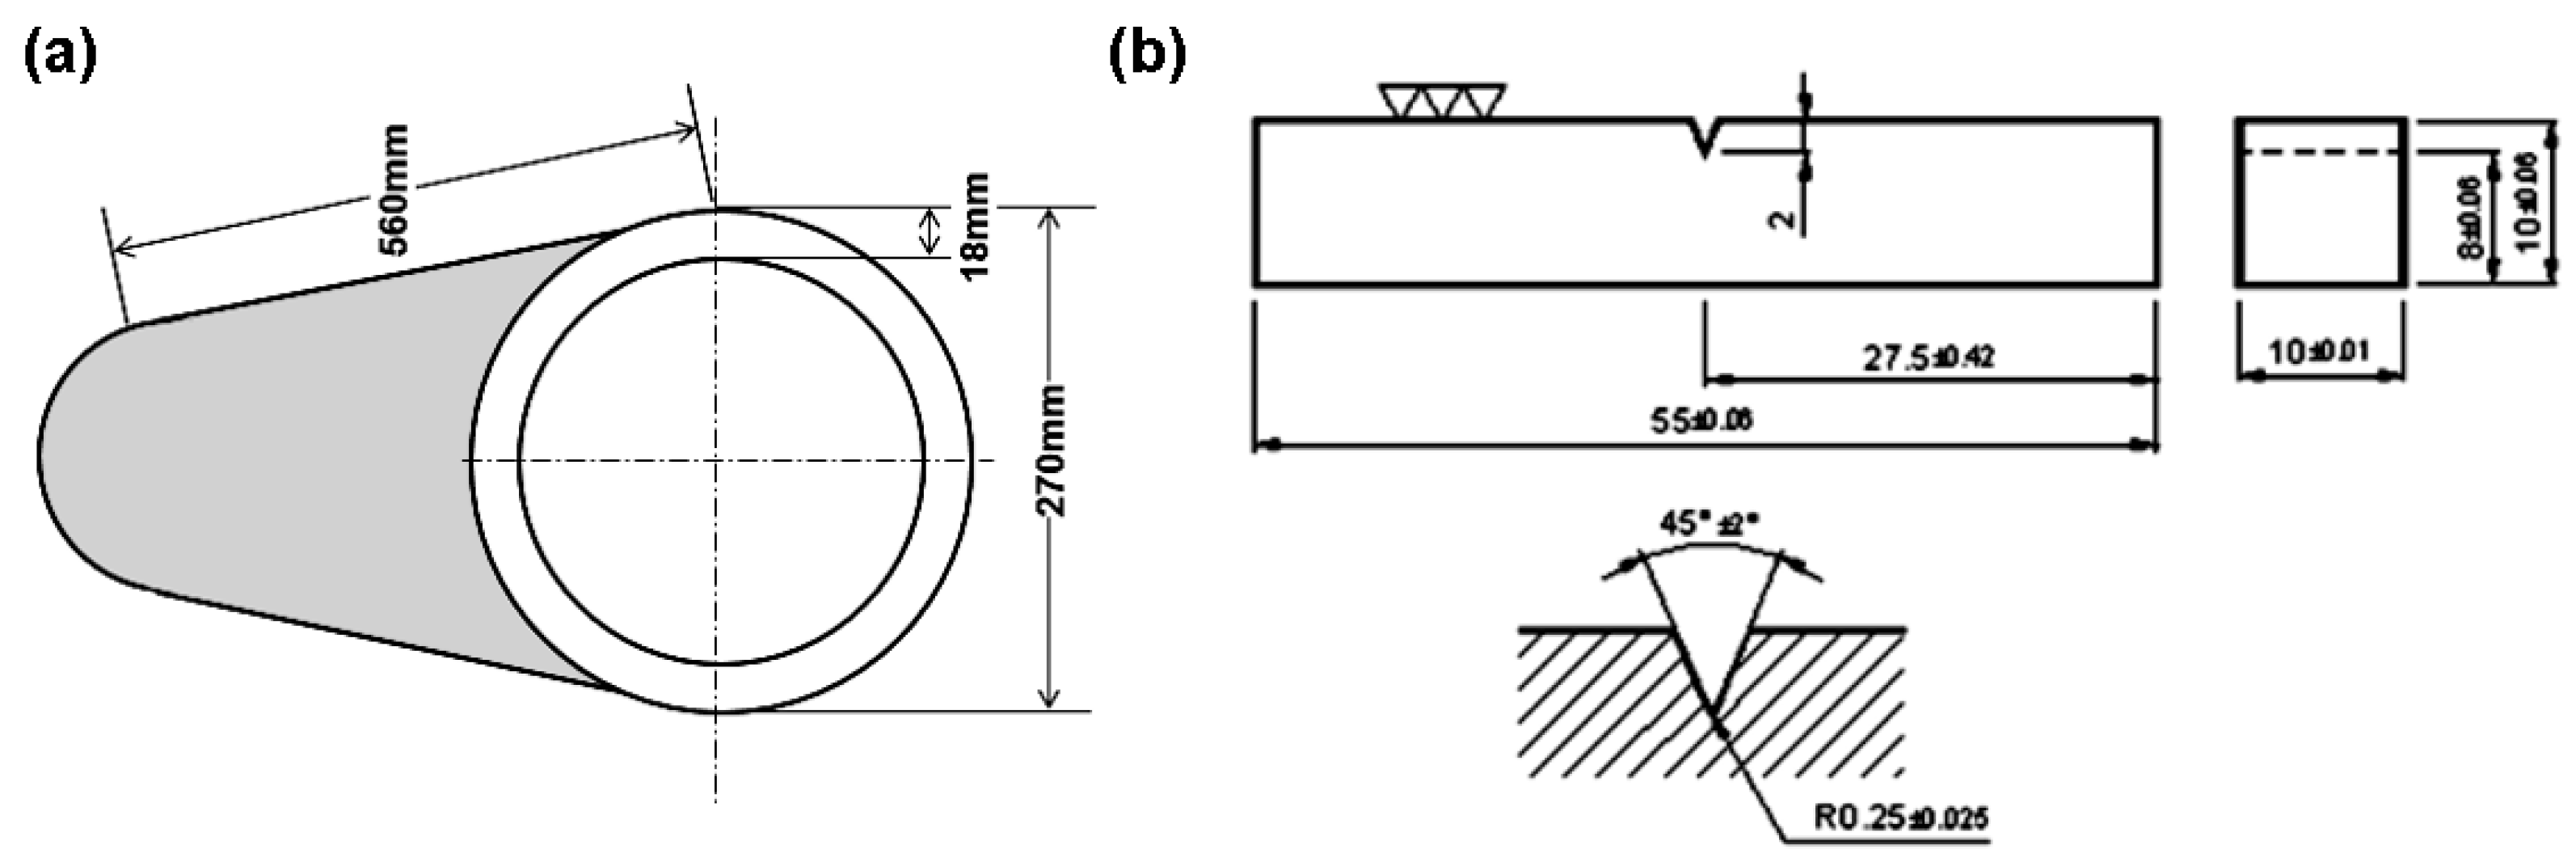
2. Experimental Procedure

The steel specimens used in this study were SA335 GR.P22. Specimens were analyzed at the 0°, 90°, and 180° positions. Composition analysis was done by optical emission spectrometer (LAB LAVM 10, SPECTRO Analytical Instruments GmbH, Kleve, Germany) and alloy components are shown in Table 1.
The base metal was PWHT annealed at 710 °C for 11 h and detailed heat treatment conditions are shown in Table 2. During the impact test of the PWHT specimens, the test specimens were randomly sampled at 1/4” thickness of the pipe (3 each × 6 set). The Charpy impact test method was tested by the standard test method of ASTM E 23 and the specimen axis was produced in the vertical direction of the pipe. The sizes of the pipe and impact specimens are shown in Figure 1. The impact test (Zwick Roell-PSW750, Ulm, Germany) was carried out at a temperature of 1 °C.
Two test specimens (referred to as 386 and 28J) with appreciable differences in impact values were selected after impact testing and the cause of the difference of the impact values was investigated. The fracture surfaces of the specimens was observed with a stereo microscope (optical microscope, OM, Olympus BX-51M, Tokyo, Japan) and a scanning electron microscope with energy dispersive X-ray spectroscopy (SEM-EDX, SUPRA40VP, Carl Zeiss, Oberkochen, Germany) and their microstructures were analyzed with OM, SEM-EDX, and electron probe microanalysis (EPMA, JXA-8530F, JEOL, Tokyo, Japan). Test specimens were etched with Nital (3% nitric in alcohol) and Ferrite and carbide counting was performed using ASTM E-562 (standard test for determining volume fraction) and image analysis software (Image Pro Plus5.0, Media Cybernetics, Washington, DC, USA). The programs Thermo-Calc TCW5 (database: TCFE6, Stockholm, Sweden, where Mats Hillert was a professor) and JMatPro 5.1 software (Sente Software, Surrey Research Park, Guildford, UK) were used for state diagram and continuous cooling transformation (CCT) curve analysis.

3. Results and Discussion

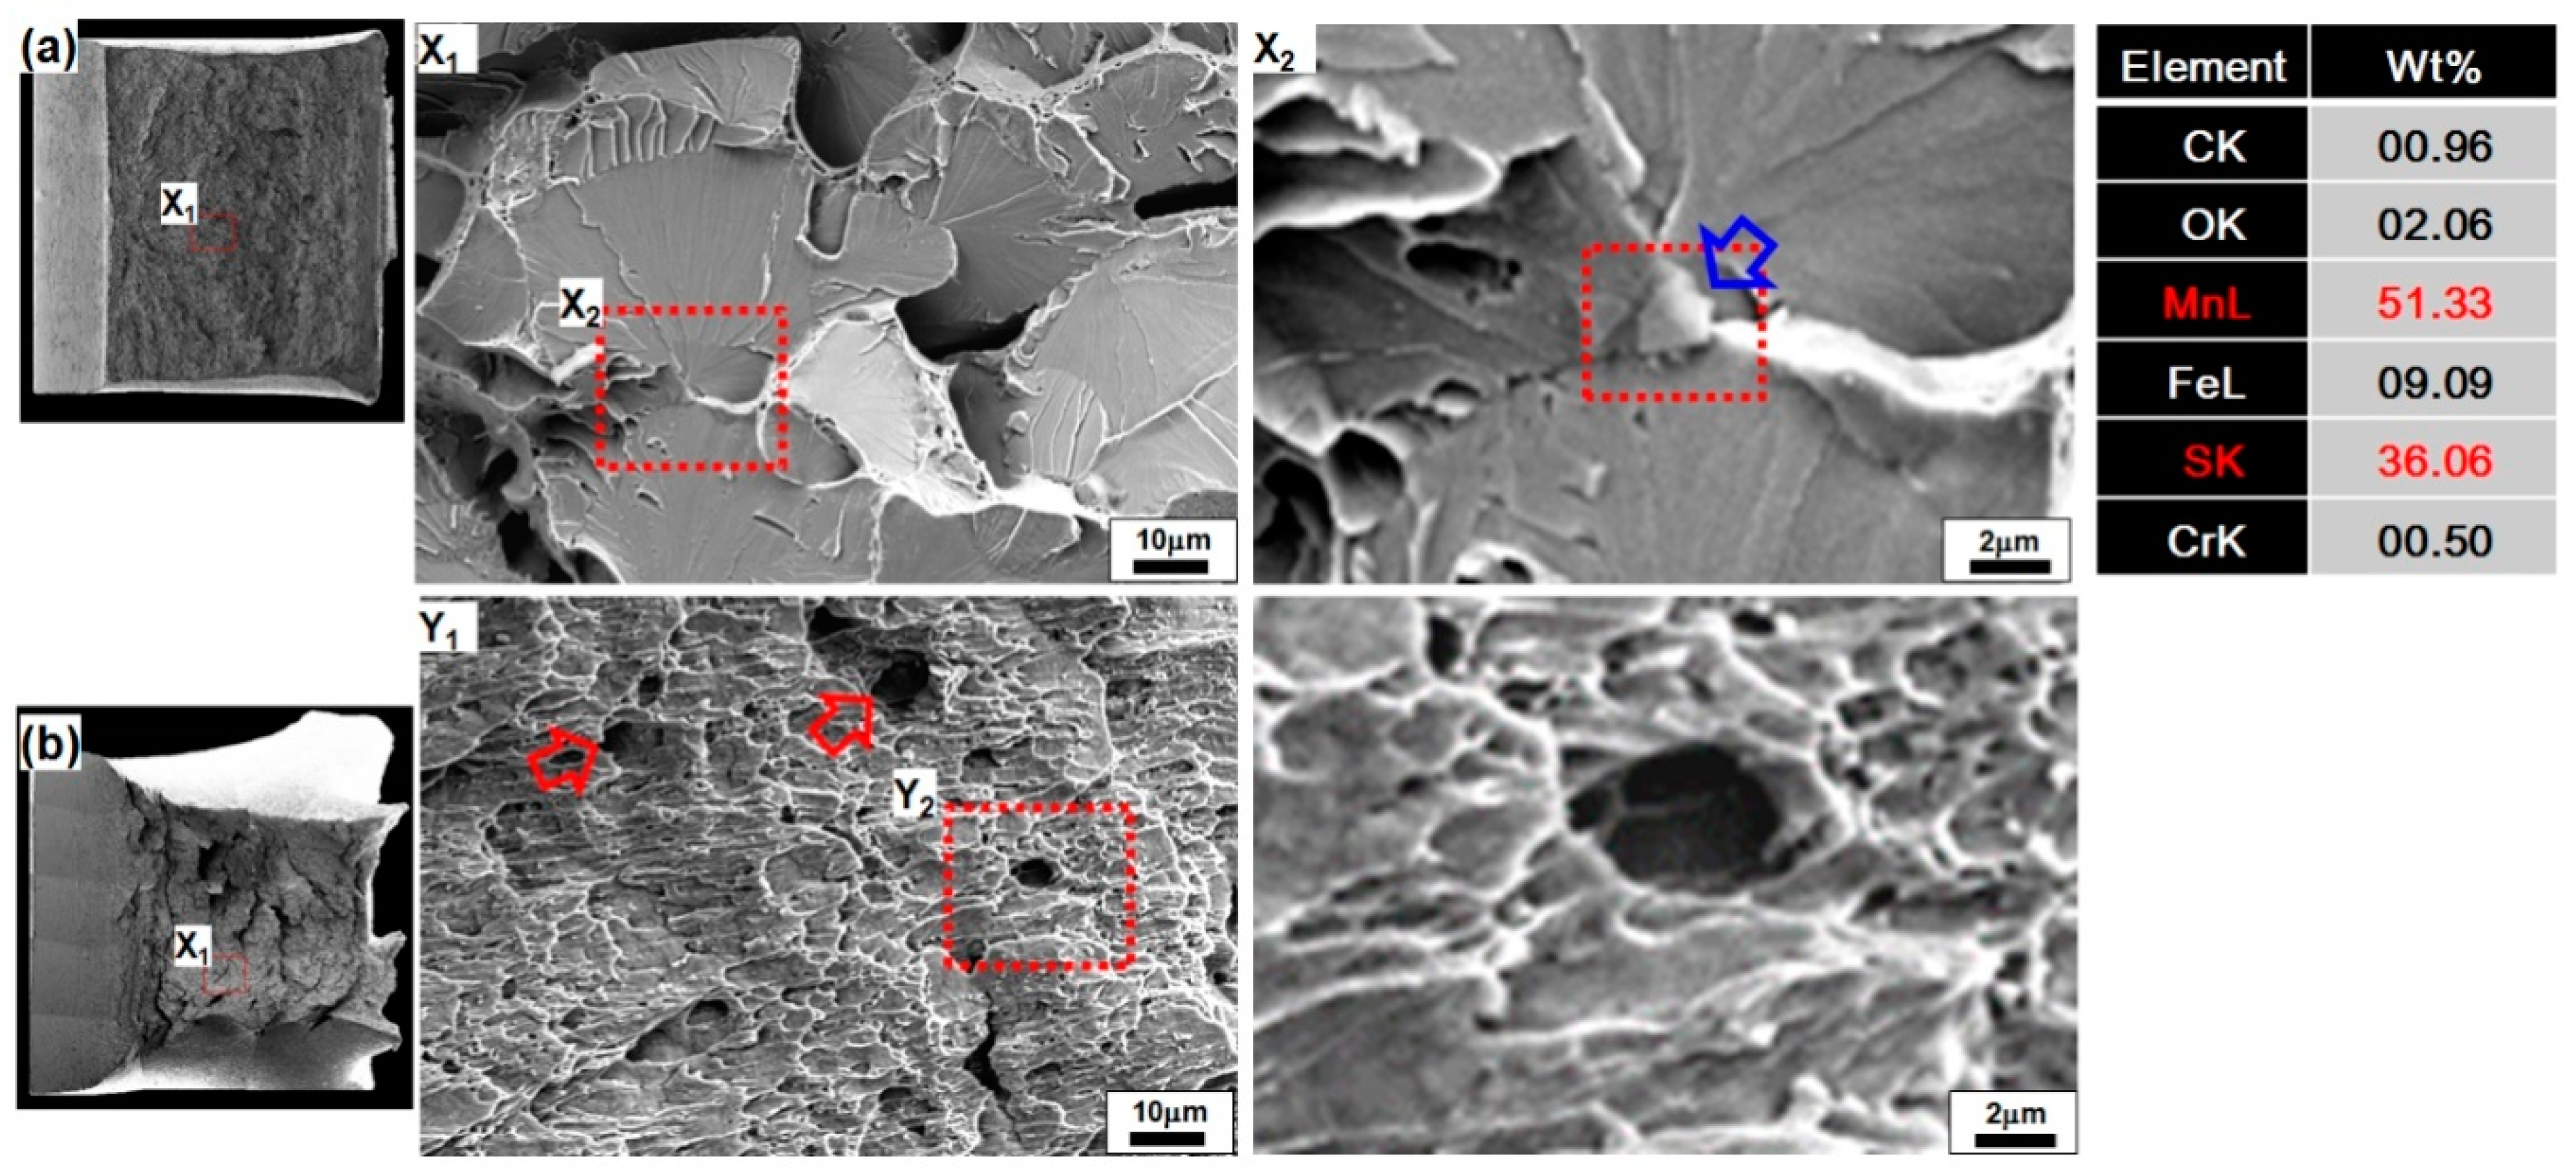
3.1. Cause Analysis of Crack Initiation Point

The purpose of this study was to analyze the variability in the impact values during impact testing. As mentioned in the Experimental Procedure section, the test specimens were randomly picked from six sets of three sets of one set and subjected to the impact test. In the total six set test piece, a test piece in the first set with a markedly different impact value was found. Figure 2 shows the impact values of the first set and the macro-fracture surface photographs of each test specimen. The impact test values of were 386, 379, and 28J, respectively. Two specimens had high impact values (386 and 379J), but one specimen had a low impact value of 28J. Only one of the six total sets (18ea) had an impact test value less than 135J (5.55%). The specimens with low impact test values is featured by a brittle fracture surface. The test specimens with high impact values were not completely destroyed nor did brittle fractures appear.
To investigate the cause of the low impact test values, the fracture surface of the 28 and 386J test specimens were examined by SEM. The SEM images are shown in Figure 3. At position X1 in Figure 3a, the 28J test specimen showed mostly brittle fracture. It has flat cleavage fractures with a size of 20~30 μm and particles with 2 μm diameters show that the river pattern is spreading. This part is judged as the crack initiation point. When the region around X1 is enlarged, it was found that the brittle fracture originates at a particle with about a 2 µm diameter. Particles with 2 μm diameters near the point X2 were found to be MnS (Mn: 51.33% and S: 36.06%) when analyzed by SEM-EDX. It has been reported in many studies that MnS inclusions have a negative effect on mechanical properties (impact, strength, elongation) [19,20,21]. The low impact value of the 28J specimen is caused by the MnS inclusion. Figure 3b shows SEM images of the 386J test specimen, which has a typical ductile fracture zone where MnS inclusions were not observed. Regions where the inclusions were expected to be can be seen in various parts of the image. It can be seen that it is not an equiaxed dimple but an elongated dimple shape. It can be seen that the elongated dimple is stretched in the notch direction. The shear ledges could also be observed.
Cross-sections of the impact test specimens were examined to investigate the presence or absence of inclusions. Cross-sections of the impact test specimens were etched with Nital (3% nitric in alcohol). Then inclusions in the 28J and 386J specimens were observed with SEM, which is shown in Figure 4a,b, respectively. Observation positions were chosen to be as close to the fracture surface (red vertical lines) as possible. Inclusion shapes were examined in the region around the points X1, X2, Y1, and Y2 in Figure 4. The inclusion sizes varied from 1 μm to 10 μm and the SEM-EDX composition analysis revealed that the inclusions consisted of a complex oxide of Al oxide, MnS, and Al oxide. The inclusion size and volume fraction of the 386J impact specimen were less than those of the 28J impact specimen.
It has been reported in the literature that the inclusion volume fraction affects the impact value, which means the inclusion (MnS, AlO) volume fraction has been measured. To accurately measure the inclusion volume fraction of the two test specimens, EPMA back-scatter electron detector (BSE) images were collected and are shown in Figure 5. In the images from the EPMA-BSE, elements heavier or lighter than Fe can be observed. The elements Al, Mn, S, and O in the MnS and AlO inclusions are lighter than Fe and appear as black regions in the EPMA-BSE images. For 2.25Cr-1Mo steel, M23C6 and M6C precipitates are observed [22,23]. One of the main elements of the precipitate is Mo, which is heavier than FE and appears as white regions in the EPMA-BSE images [24]. Figure 5a,b shows the 28 and 386J specimens, respectively. Black inclusions and white precipitates are observed in both specimens. However, the 386J specimen shows fewer black inclusions than the 28J specimen. To determine the inclusion (MnS, AlO) volume fraction, we measured the total size of the black inclusion regions in 12 BSE images using image analysis software (image Pro Plus). The measured results are shown in Figure 6.
The inclusion volume fraction was about 0.8% for the 28J specimen and 0.1% for the 386J specimen. Therefore, the inclusion volume fraction in the 28J specimen is about eight times greater than the 386J specimen. One of the reasons for the low impact value of the 28J specimen is that the impact value decreases as the inclusion volume fraction increases. This is consistent with a previous result reported in the literature [25]. It is evident that the inclusion volume fraction varies greatly between specimens even within the same pipe. This has been attributed to a casting defect caused by the local incorporation of inclusions during melting and casting [26].

3.2. Cause Analysis of Crack Propagation

As stated above, crack initiation starts at an inclusion. Cross-sections of the impact specimens were observed by SEM to identify the path of the cracks generated by the inclusions. The OM image shown in Figure 7a shows the macrostructure of the cross-section of the 28J impact test specimen. Figure 7b shows an SEM image of the region highlighted by the red square in Figure 7a. The specimen was tilted to show the fracture surface well and then was observed by SEM. By observing from the side of the fracture surface, it is seen that the movement path of the crack can be one of two types. One type of crack propagation occurs across the ferrite, which is seen in Figure 7 (cracks across bainite were not observed while crack propagation across ferrite was easily observed).
In the second type of crack propagation, a micro-void is generated around the carbide located at the grain boundary and cracks migrate along the micro-void. Impact values are known to correlate with grain size [17]. A smaller grain size yields better impact values and bainite with fine grain size performs well in impact tests. This is the reason that the crack propagates along the ferrite. When precipitates are present, it is known that the coarse M23C6 carbide and M7C3 are formed at the grain boundary [22,23]. M23C6 carbides and M7C3 carbide are incoherent boundaries with the matrix structure. Due to the incoherent boundaries, there is a small gap between the matrix and the precipitate. (The size of the gap is an atomic size.) When a small force is applied to these gaps, the gap grows into micro voids by stress concentration. Therefore, our results show that cracks propagate along the micro-voids around the precipitate of the grain boundaries or across the ferrite.
From the results shown in Figure 7, the effect of the ferrite and carbide on the impact properties was estimated by comparing and analyzing the textures of the 28J and 386J impact test specimens.

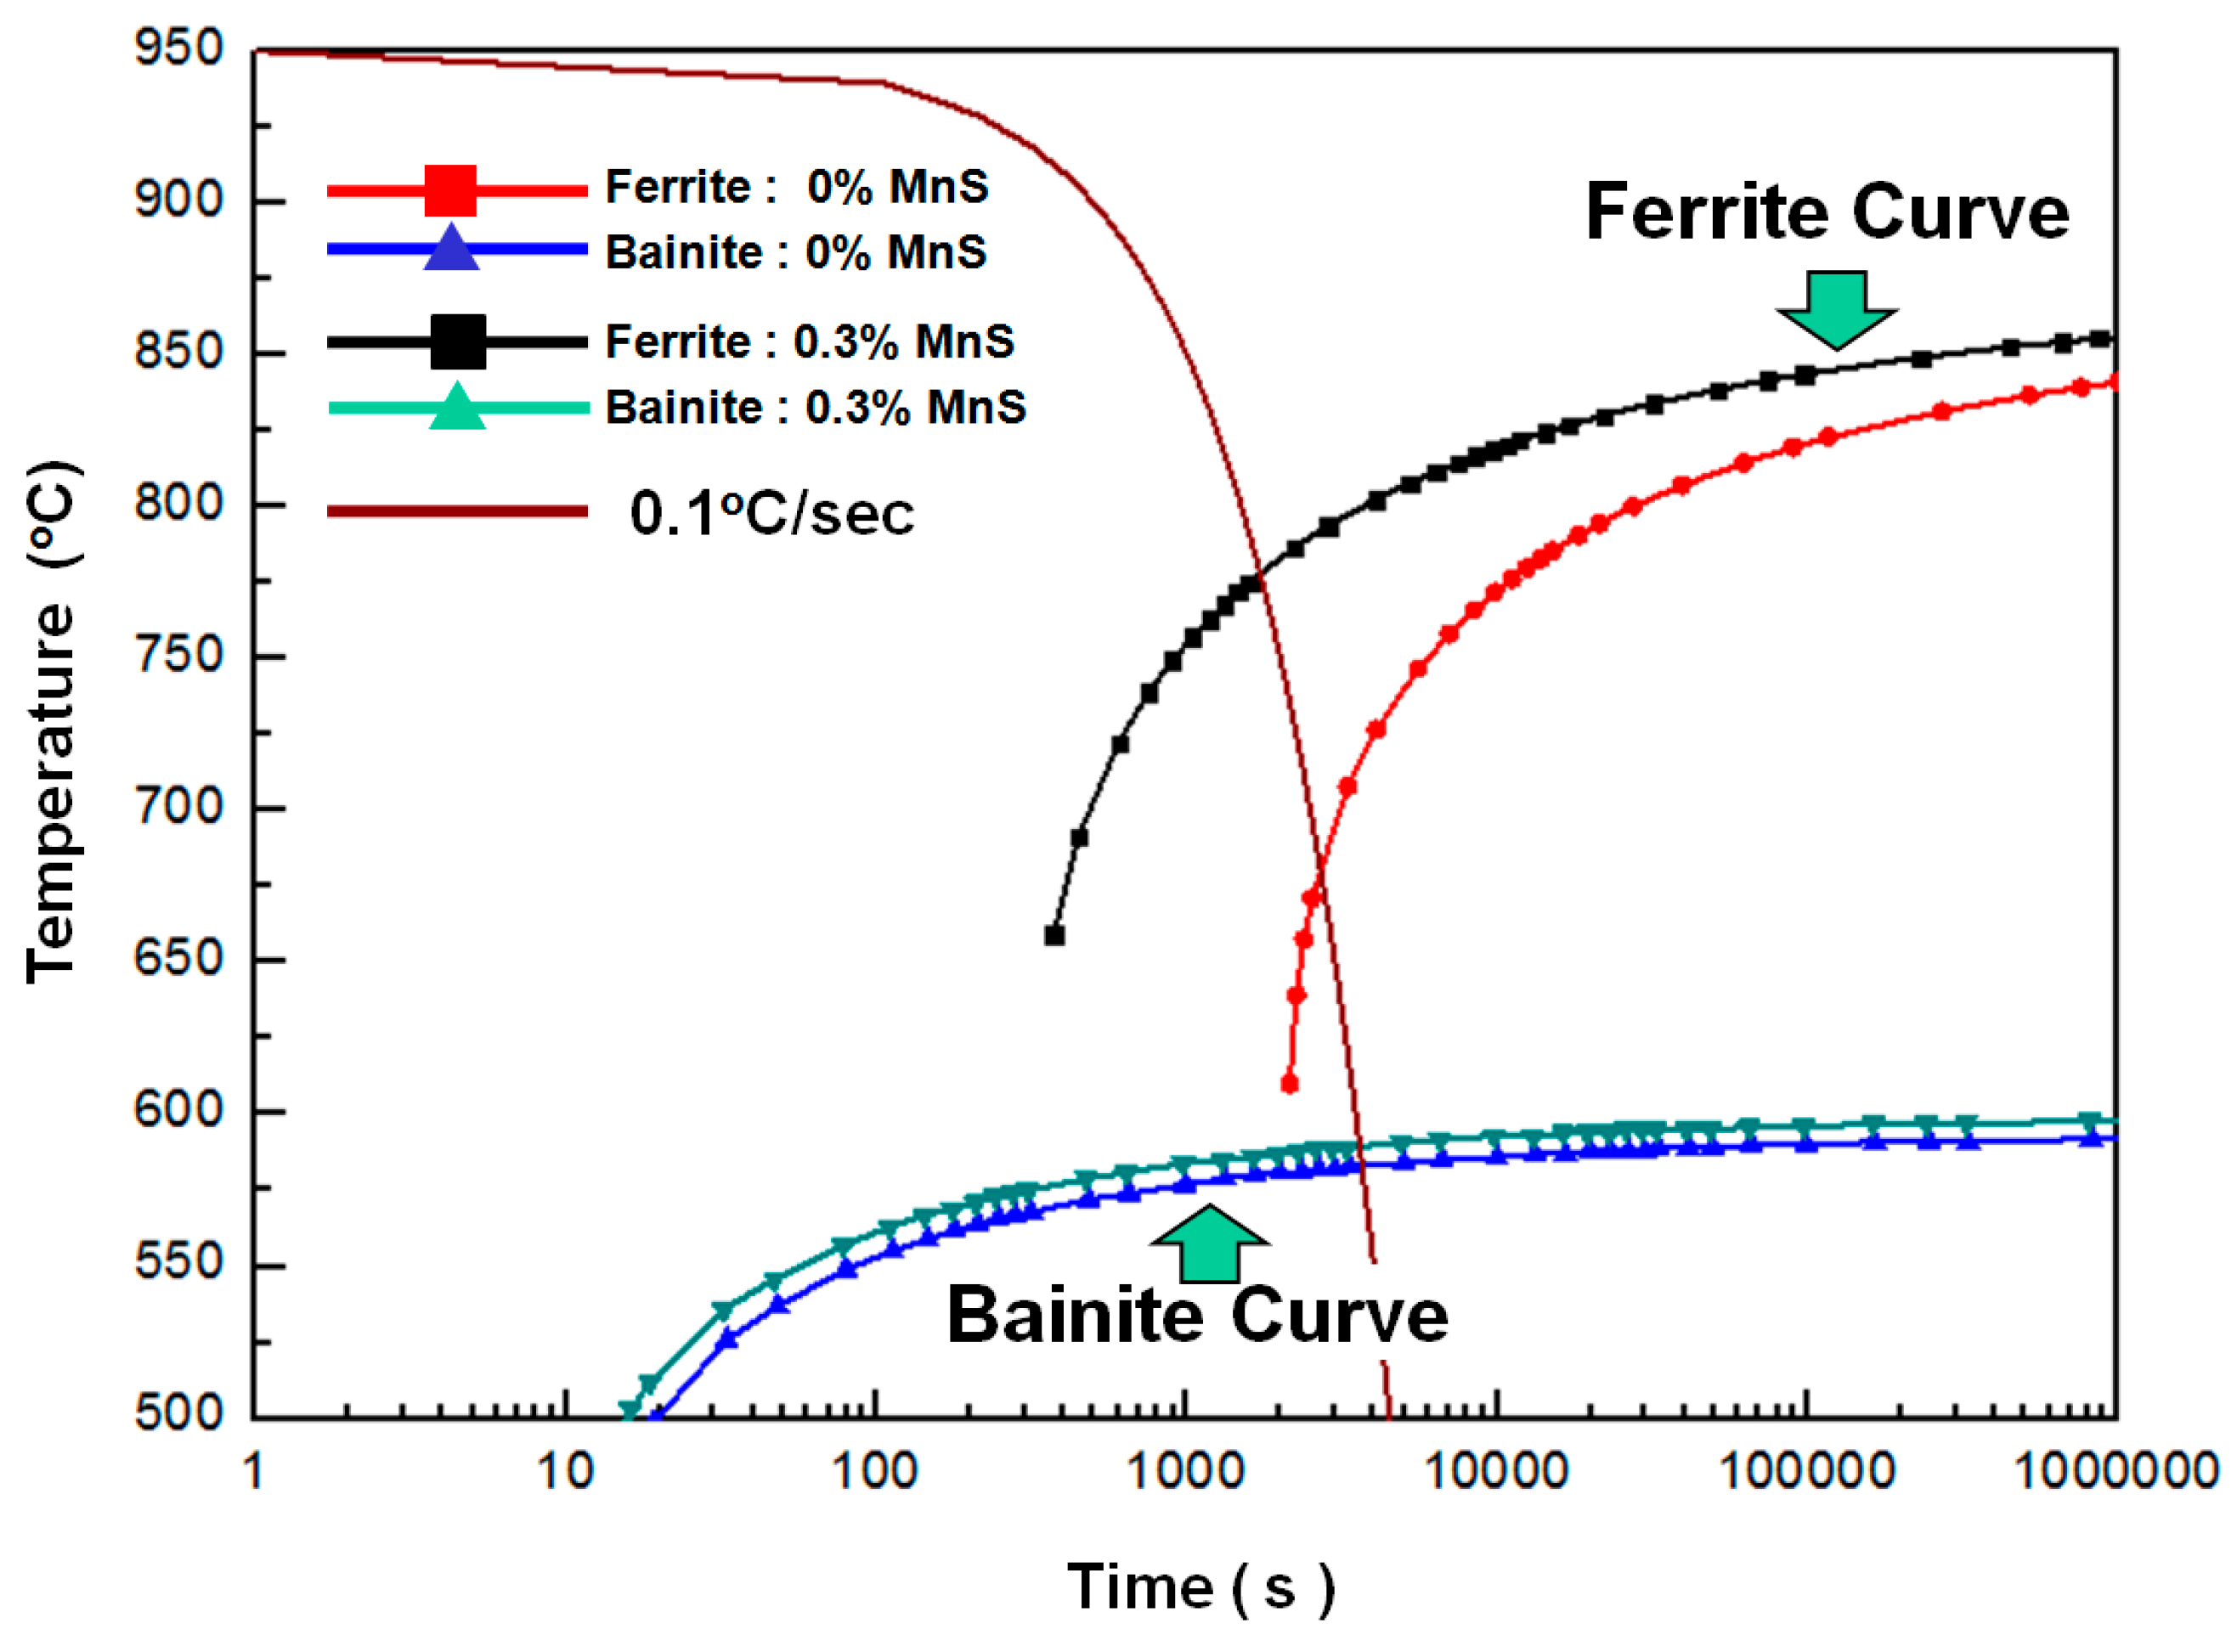
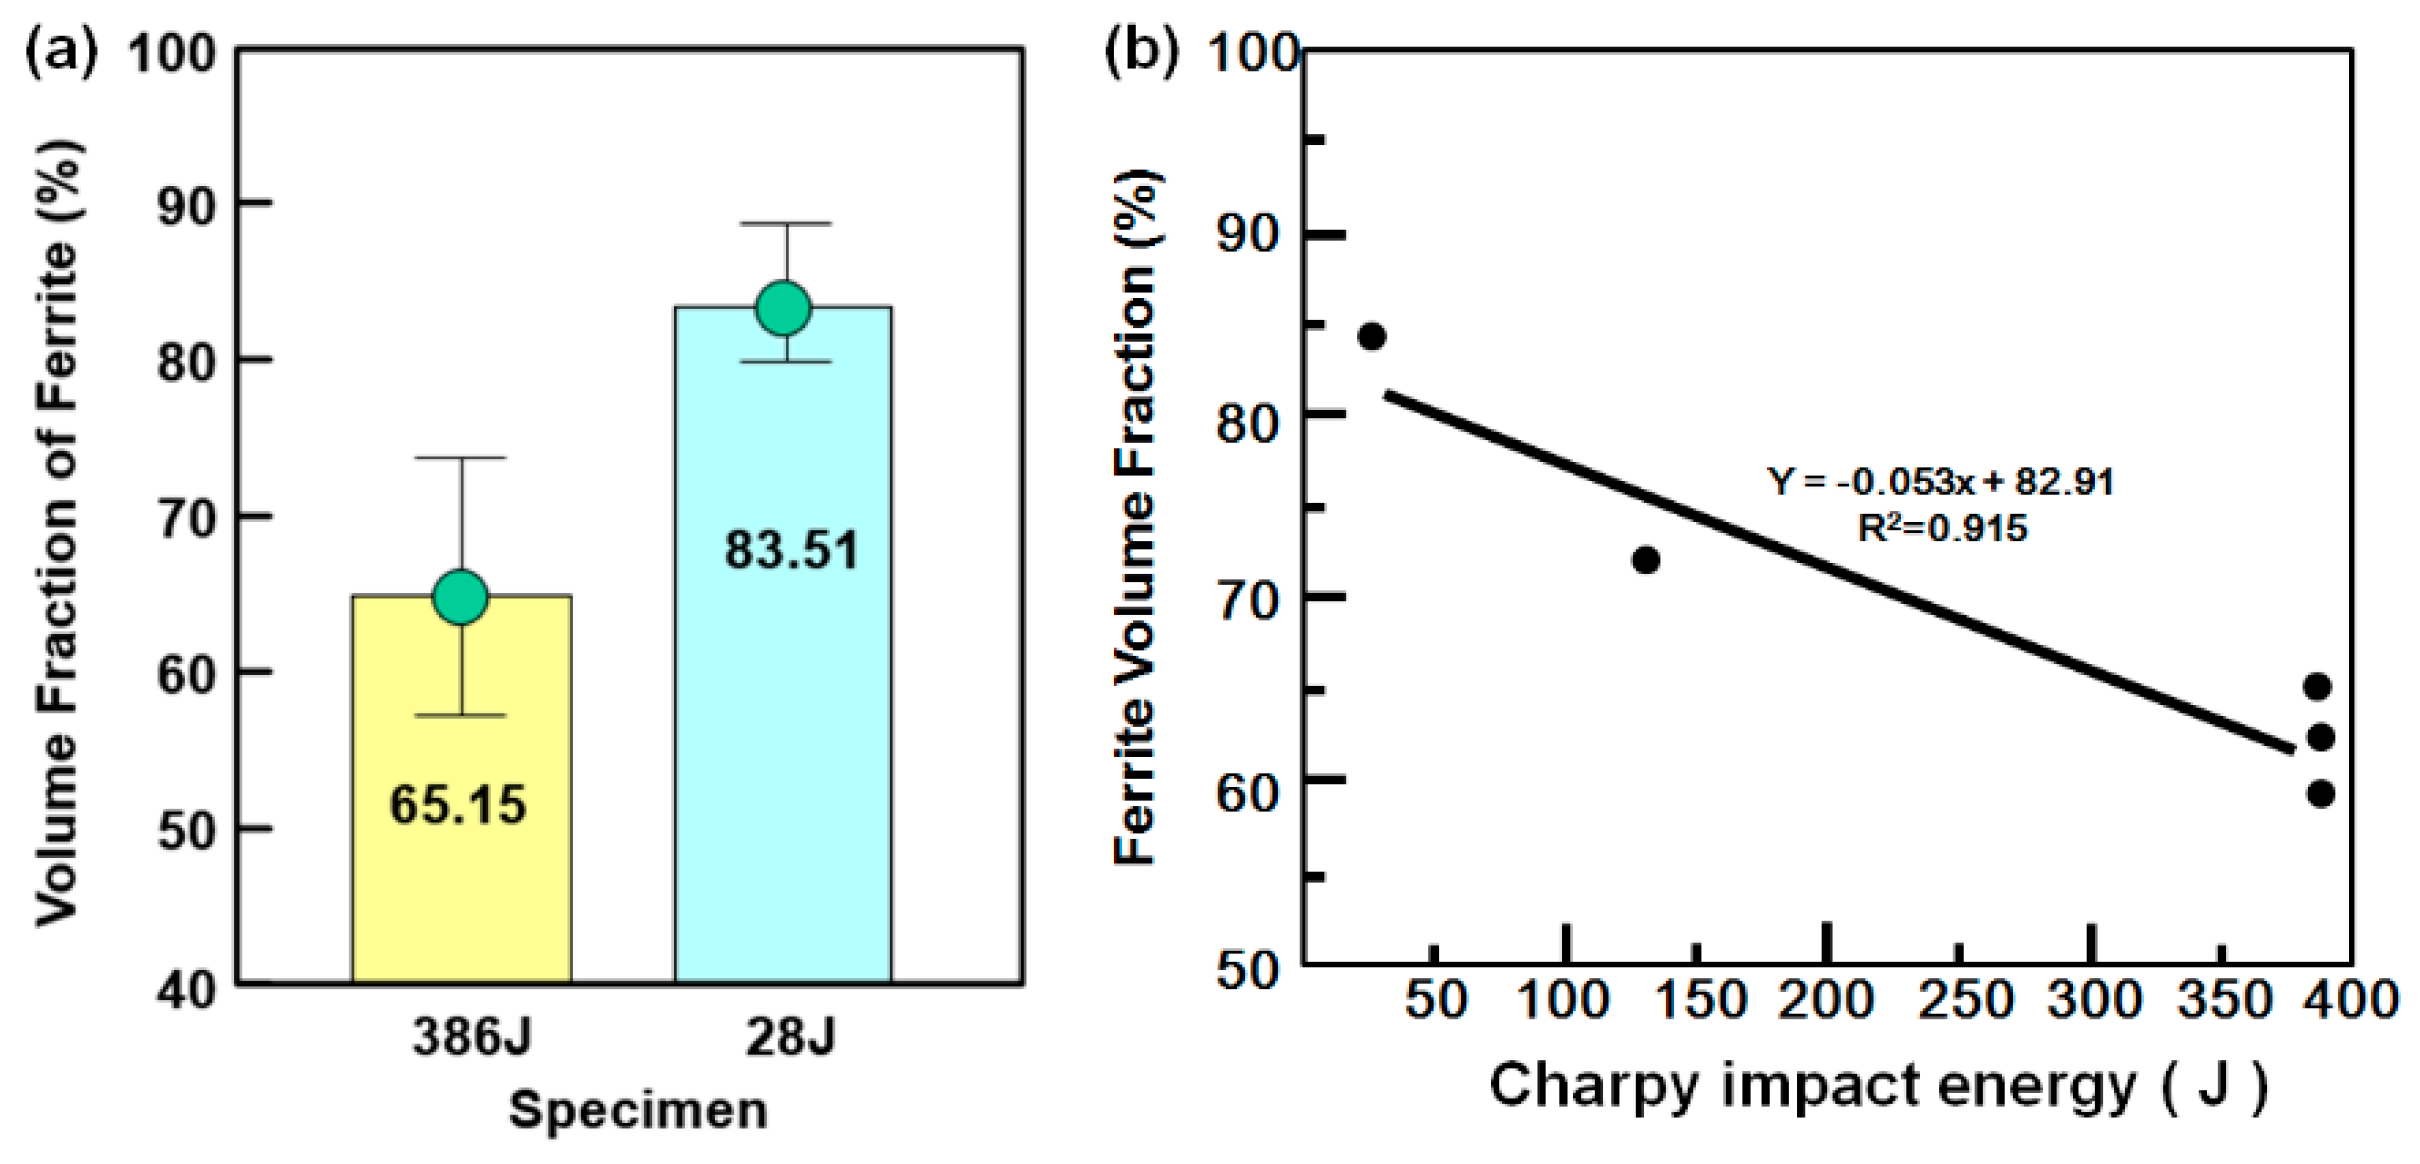
3.2.1. Effect of Ferrite on Impact Value

Figure 8 is a microstructure photograph of the (a) 28J impact test specimen and (b) 386J test specimen. Figure 8c shows the elongated ferrite + bainite structure of the 28J specimen and (d) shows the unstretched ferrite + bainite structure of the 386J specimen. The bainite + ferrite structure in Figure 8c is elongated in the direction of the impact test while Figure 8d shows that the bainite + ferrite structure is not elongated. The ferrite fraction of (c) was higher than that of (d). The fraction of the ferrite was measured by the ASTM-E562 method by taking 16 OM images from the regions left of the red lines in Figure 8a,b.
Figure 9 shows the fraction of ferrite, which is measured from OM images. For the 386J test specimens, the average ferrite fraction was 65.15% while the 28J specimen showed a high average ferrite fraction of 83.51%. Therefore, we conclude that a higher ferrite fraction yields a lower impact value. The reason for this is that, as the fraction of ferrite increases, the fraction of bainite decreases. The impact value is lowered due to the decrease in the fraction of the bainite, which has a satisfactory impact value. The ferrite fraction of the test specimens having an impact value of 135J was measured for 18 specimens by the same method. In Figure 9b, the reliability is low due to the small number of test specimens. However, it can be seen that the correlation between ferrite fraction and the impact value is linear. It is also possible to present a guideline for the fraction of ferrite required to yield the minimum required impact value, but this would require the analysis of more specimens. The two specimens shown in Figure 9a are from the same pipe. The reason for the large difference in their volume fractions is discussed below.
The 28J and 386J test specimens contained different volume fractions of inclusions, which contained MnS. The amount of Mn in MnS is about 60%. Therefore, it is reported that a depleted zone of Mn is formed around MnS and this depleted part promotes ferrite formation [27,28]. Therefore, the volume fraction of ferrite was higher in the 28J impact test specimen because it contained more MnS inclusions than the 386J specimen. The matrix composition has been described previously as a change in the Mn content of the matrix due to the volume fraction in MnS inclusions. The composition of Mn in the matrix when the volume fraction of inclusions are 0% and about 0.3% was calculated. The calculated alloy composition is shown in Figure 10 by a CCT curve created using Jmat-Pro. The Mn content of the matrix at 0% and 0.3% inclusions decreases from 0.436 to 0.256%.
[Total measured Mn content (0.436%) = 0.05% X Mn content in MnS (60%) + Mn content of matrix at 0.3% inclusions]
As a result, the ferrite CCT curve moves to the left as the amount of Mn decreases from 0.436 to 0.256%. At the same cooling rate (0.1 °C/s), ferrite content increases as the ferrite moves toward shorter times along the curve. That is, as the amount of inclusions increases, the amount of Mn in the matrix decreases. As the amount of Mn in the matrix decreases, the ferrite CCT curve moves to the left and the content of ferrite increases even at the same cooling rate.

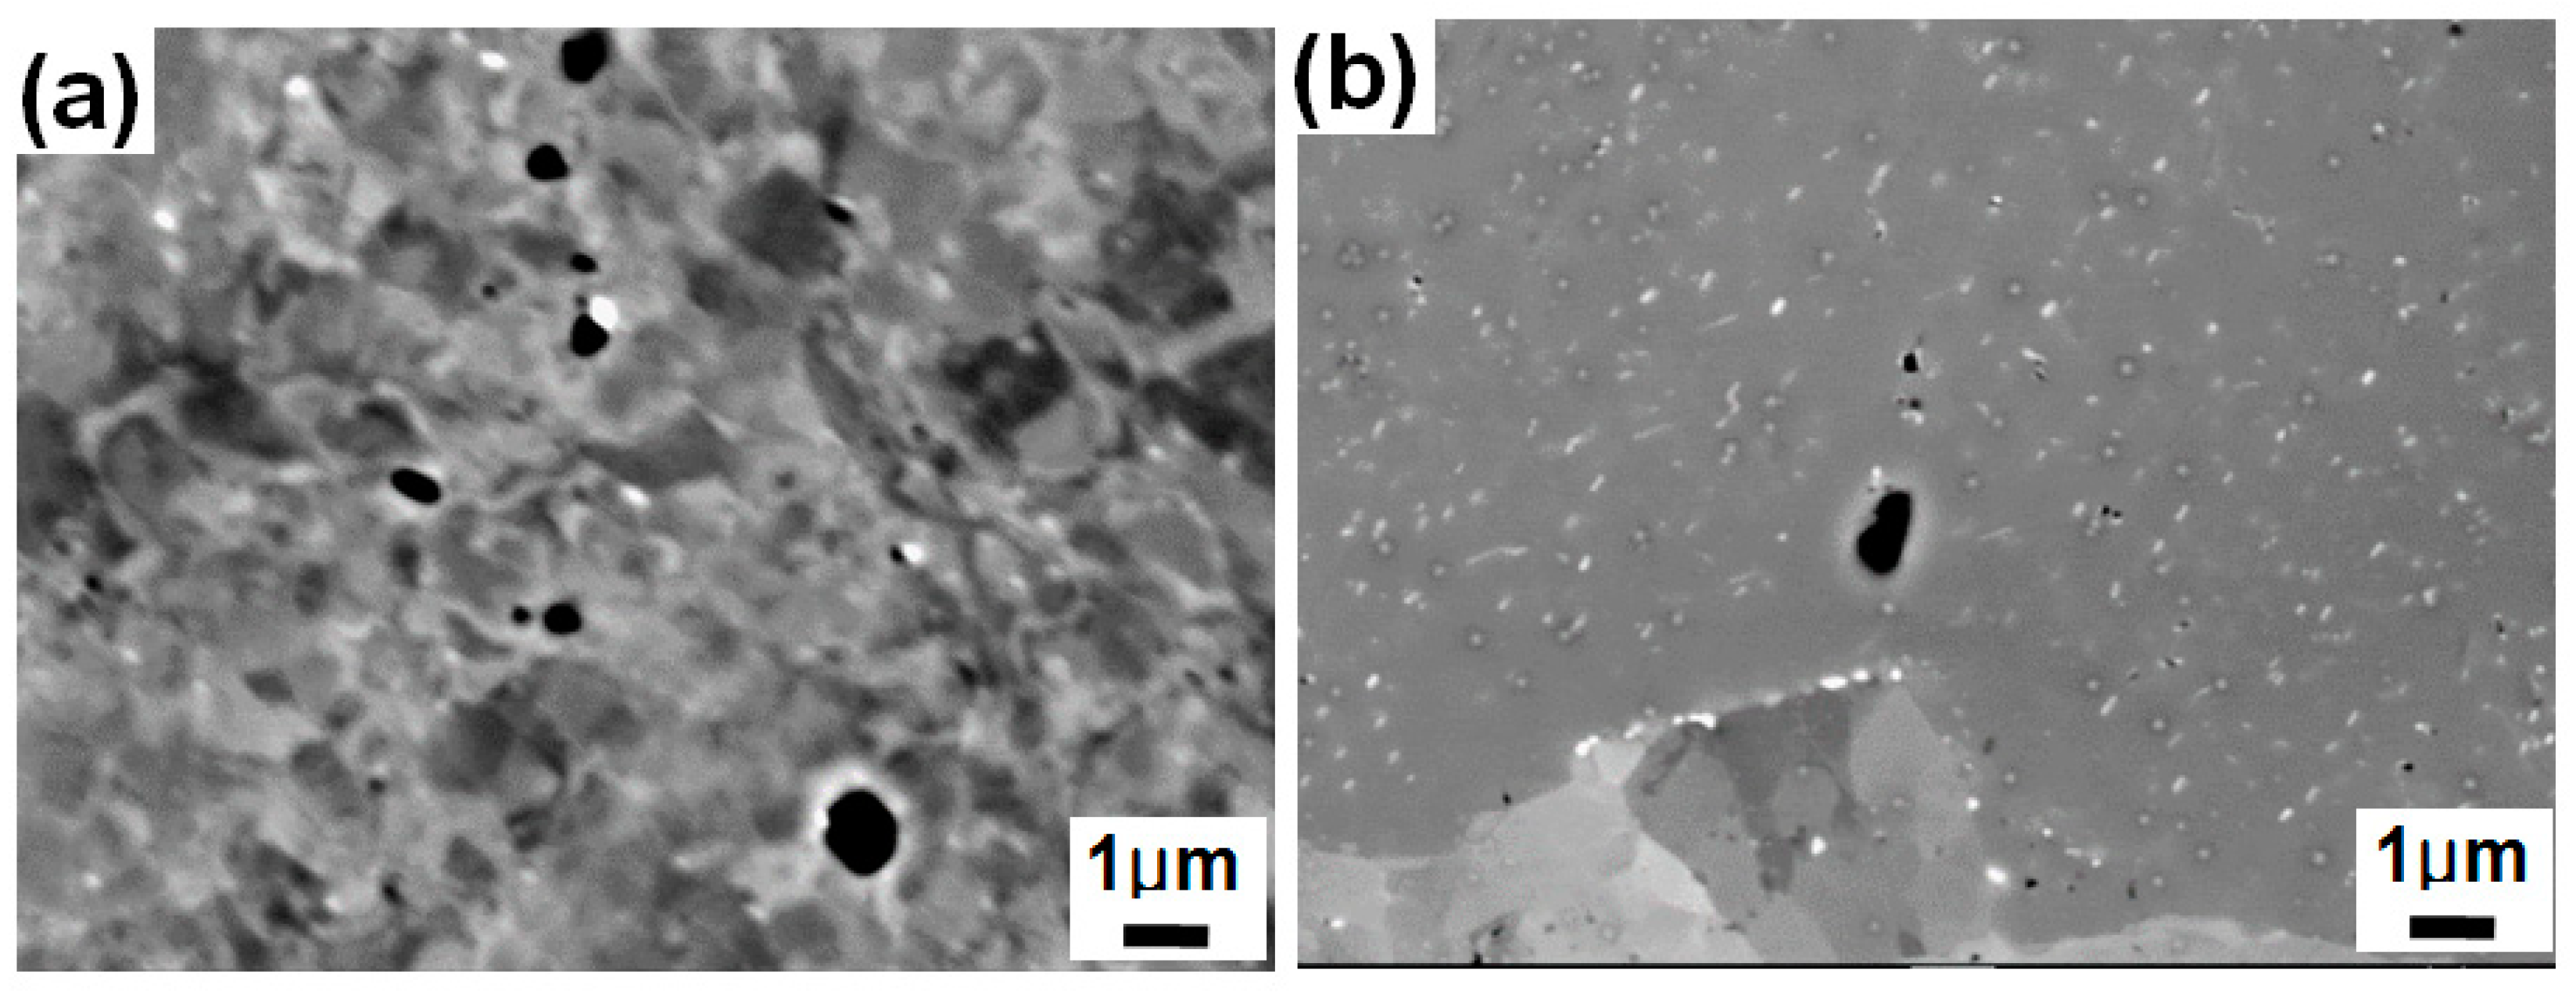
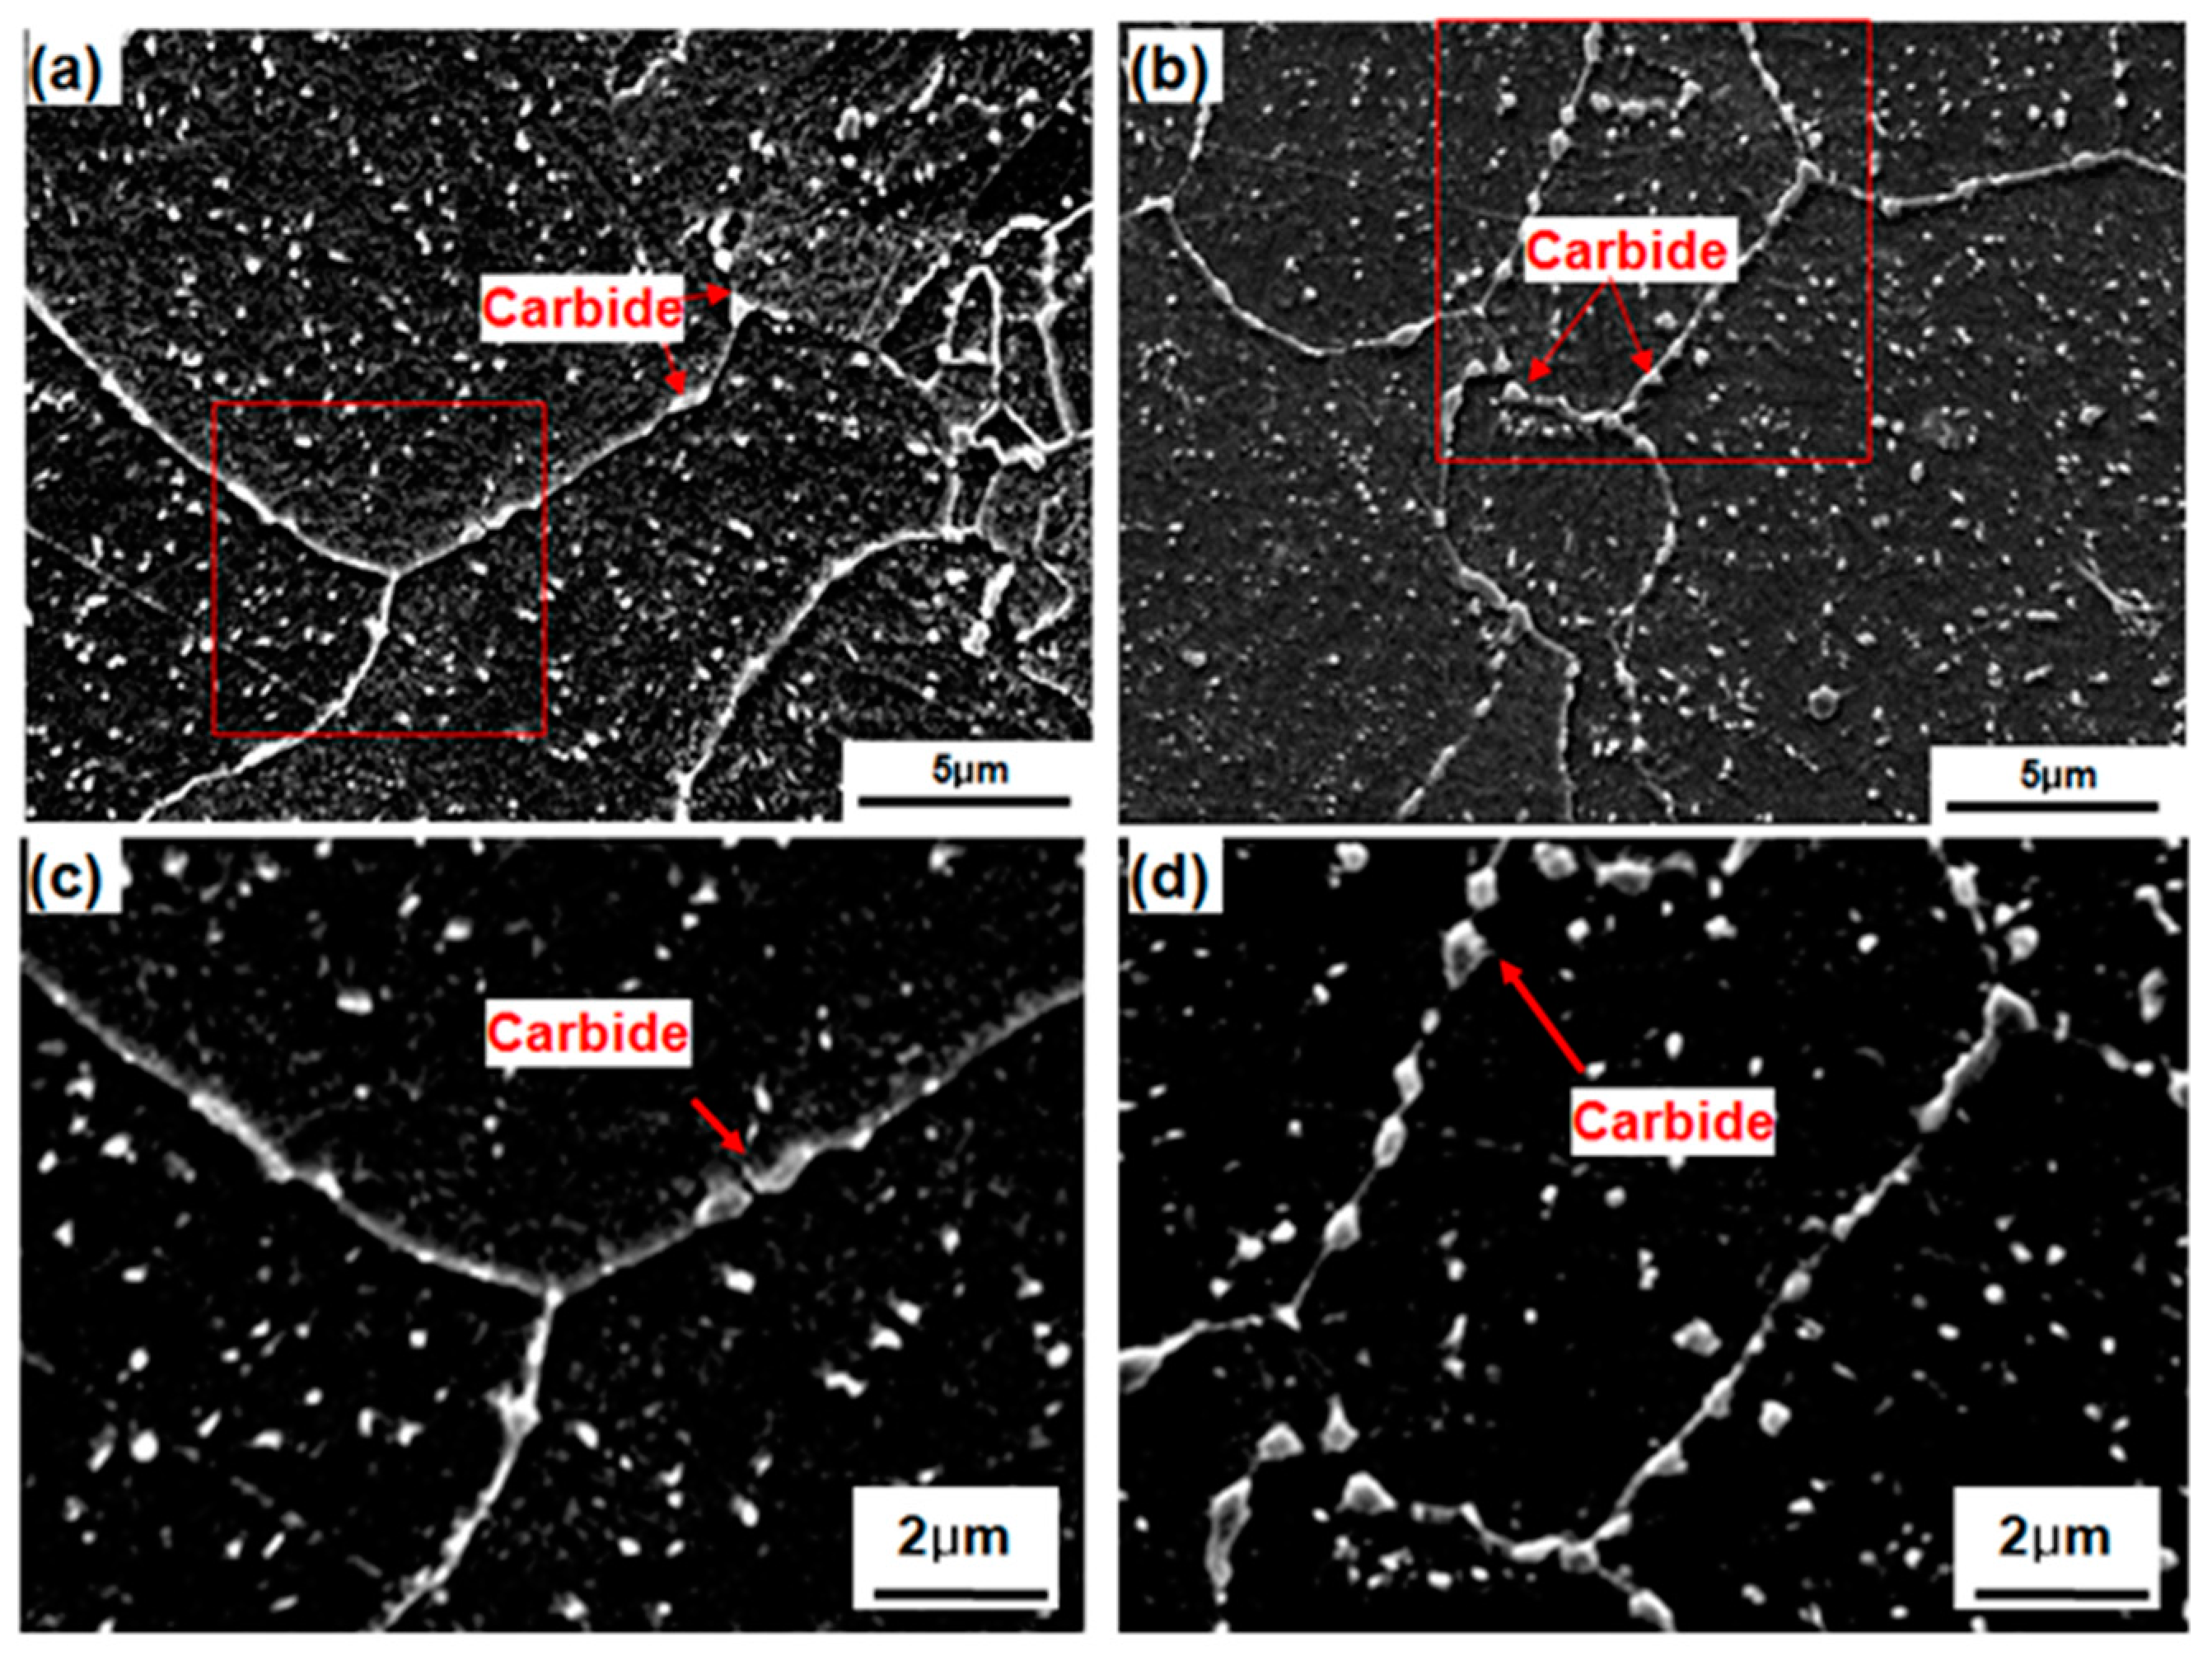
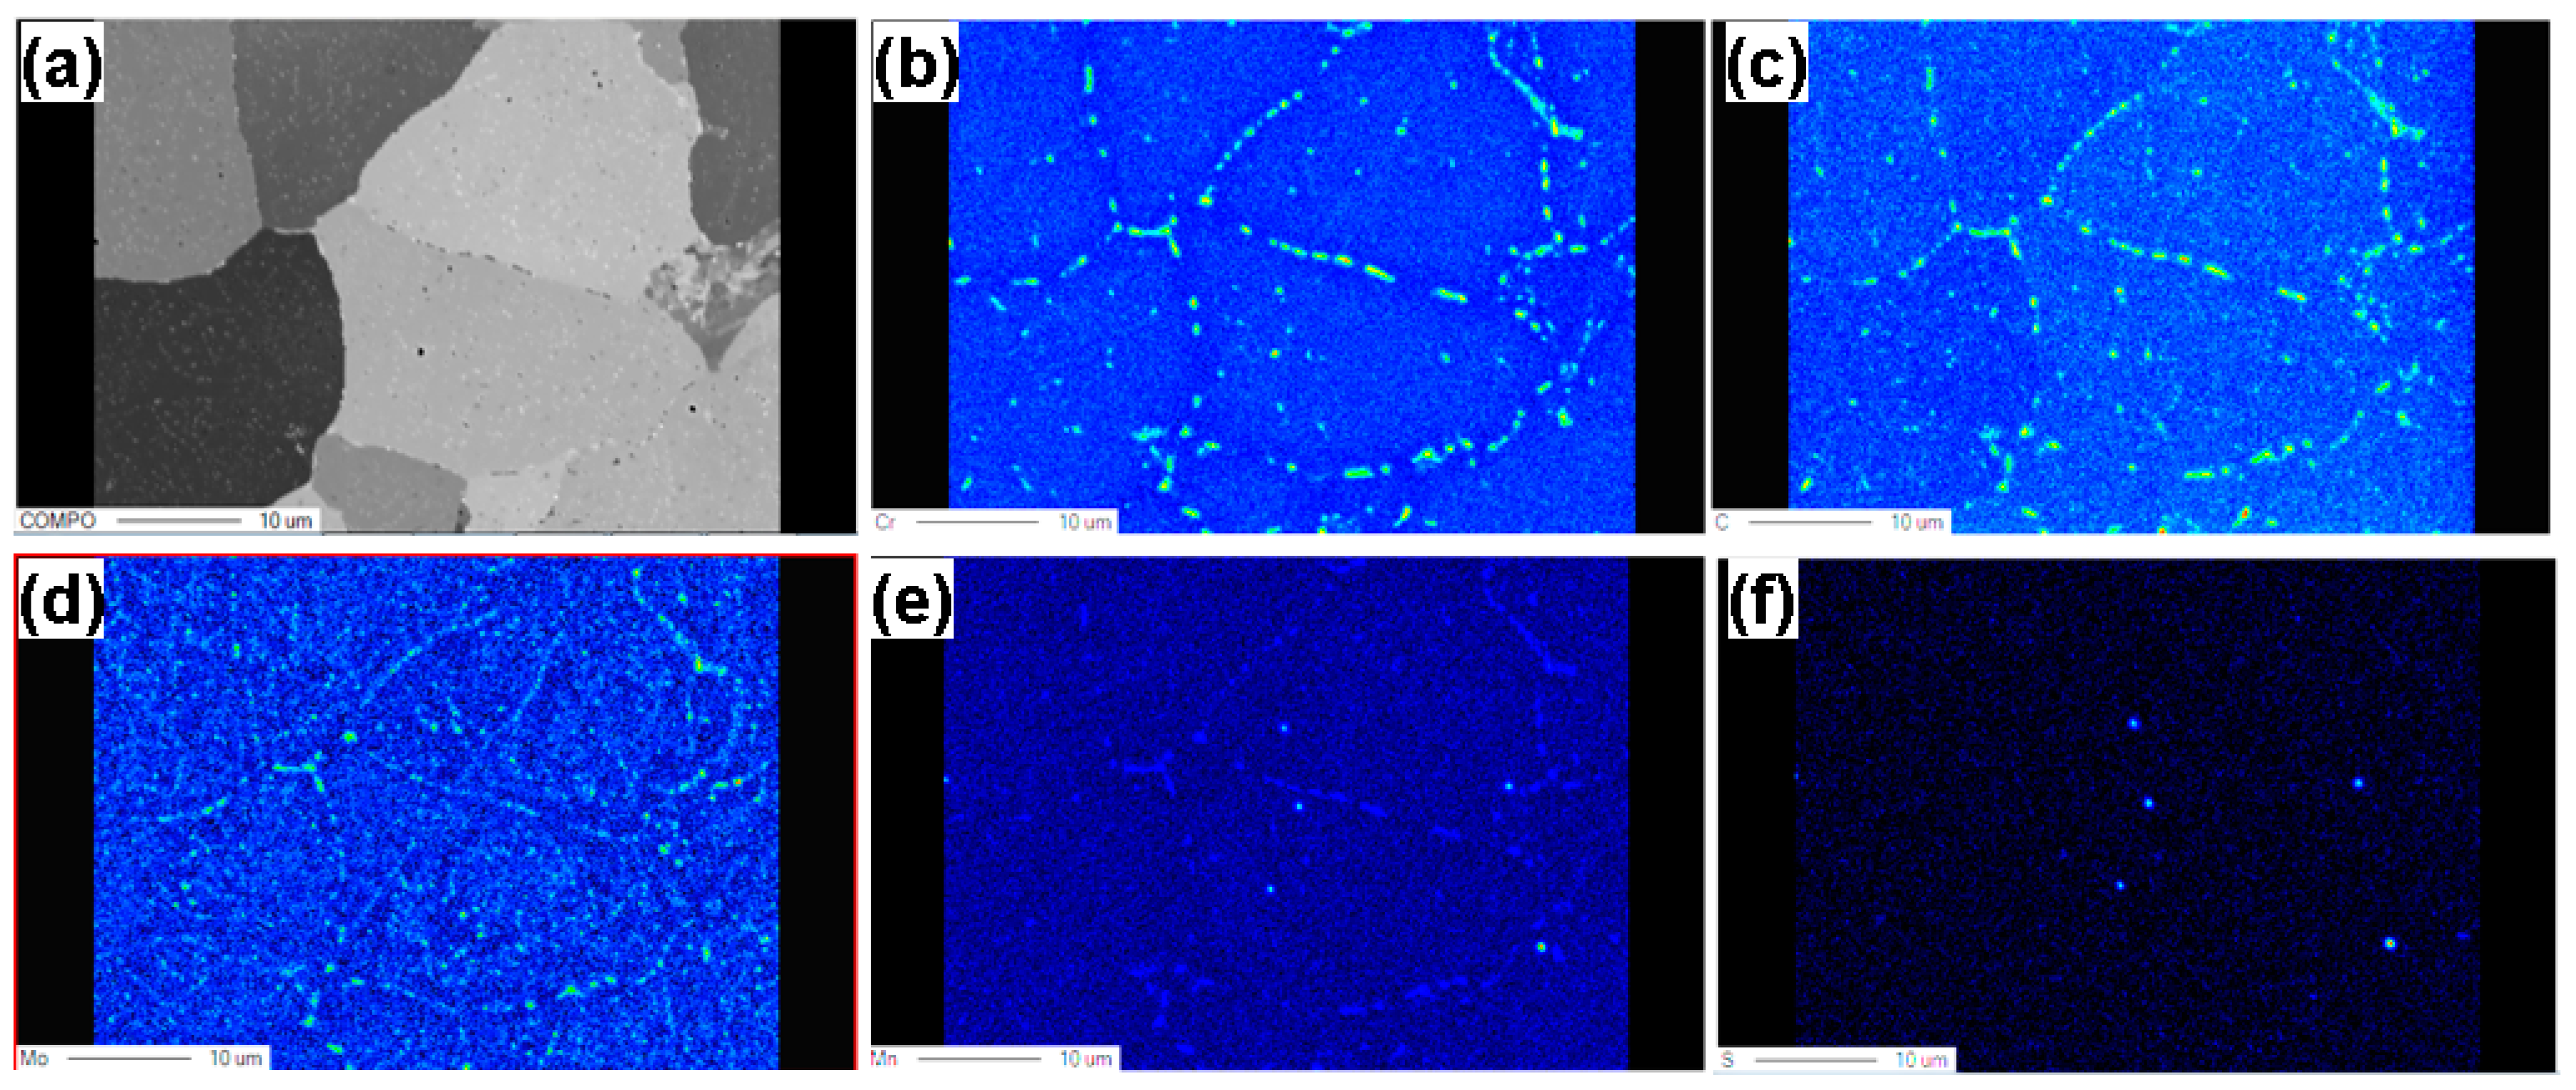
3.2.2. Effect of Carbide on Impact Value

The microstructure in regions around the carbide in the 28J and 386J specimens was observed. Figure 11 shows a cross-sectional SEM image of both specimens. Inter-granular white spherical precipitates are observed and precipitates are observed in the prior austenite grain boundary. The precipitates of Figure 11d have greater spacing and are larger in size than the prior austenite grain boundary precipitates of (c).
For reliable measurements, Murakami etching and a precipitate etching solution of prior austenite grain boundary was performed. The amount and size of the precipitates were measured by using Image Pro plus. The size and size distributions of the precipitates are shown in Figure 12. The results in Figure 12 show that the size and amount of 28J specimen precipitates are larger than the 386J specimen. These results suggest that a large amount of large precipitates in the 28J specimen is generated by micro-voids due to the incoherent boundary with the matrix and then micro-voids are combined to propagate cracks. From the results shown in Figure 11 and Figure 12, the difference of the precipitates present in the two impact test specimens was investigated.
Figure 13a shows a well-known Fe-C phase diagram. In the Fe-C phase diagram, the C solubility in the ferrite is 0.025%. Figure 13b is a state diagram of carbon content in 2.25Cr-1Mo steel using Thermo-calc. Additionally, the C solubility in the ferrite is 0.009%. The amount of C solubility varies depending on the alloying elements. Solubility of C was low in the state calculated by Thermo-Calc. This is probably due to the phase of M23C6, which takes carbon from multiple systems. In order to make a more conservative judgment, modeling was performed by calculating the amount of ferrite cabon solubility as 0.025%.
Modeling of the carbon chemical concentration shows that the C content of ferrite is 0.025% and the C content of the base metal is 0.1% (see Figure 13c). The content of C (0.1% − 0.025% = 0.075%) must be contained in the other constituent other than ferrite. The higher the ferrite content, the higher the content of C is in the other constituent including calculating the amount of carbon in the other constituent.
-
28J: 0.1% C Base Metal Composition = 83.51% Ferrite Volume Fraction X 0.025% C + C content of 16.49% the other constituent ==> C content of 16.49% the other constituent = 0.4798%
-
386J: 0.1% C Base Metal Composition = 64.76% Ferrite Volume Fraction X 0.025% C + C content of 35.24% the other constituent ==> C content of 35.24% the other constituent = 0.2378%
For this reason, the amount of precipitate generated is due to the fact that the carbon content of the other constituent in PWHT is twice as much as that of the other constituent of 386J.
Figure 14 shows the results of EPMA analysis of the 28J impact specimen. It can be seen that there is a large amount of precipitate in the prior austenite grain boundaries. The precipitates consist of Cr, Mo, Mn, and C and, in particular, precipitates with a higher content Cr and C were found. Usually, the precipitates with a higher content of Cr and C than M23C6 precipitates are supposed to be M7C3. In addition to forming incoherent boundaries between the matrix and precipitate by the HCP crystal structure, they form a surrounding Cr-depleted zone due to the high interrelation of Cr and C. Excess Cr-rich precipitates in the prior austenite grain boundaries cause Cr-depleted zone formation around the precipitate, which softens the grain boundaries and becomes vulnerable to stress corrosion cracking when the Cr content decreases [29,30]. It should also be noted that these precipitates may affect the physical properties of the HAZ during welding [11].

4. Conclusions

The MnS and other inclusions in the 28J impact specimen were found to be larger than the 386J specimen. At the same cooling rate, the ferrite content of the base metal is increased as the ferrite CCT curve moves to the left due to the Mn deficiency caused by the MnS formation. As the ferrite content increases, the impact value is lowered due to the decrease of the bainite, which has high impact test values. The increase of ferrite content increases the C content of the other constituent due to the low C content (0.025%) of ferrite (about 0.4798%). This results in a large amount of precipitate (M23C6) in the prior austenite grain boundaries and coarse Cr precipitates are the migration path of cracks in micro-void generation. The occurrence of Cr-depleted zones leads to softening of the prior austenite grain boundaries, which can be expected to weaken the stress corrosion cracking of these areas.

Author Contributions

S.L. and C.K. conceived and designed the experiments. H.N. performed the experiments and analyzed the data.

Acknowledgments

This work was supported by a National Research Foundation of Korea (NRF) grant funded by the Korean government (MSIP) (No. 2012R1A5A1048294).

Conflicts of Interest

The authors declare no conflict of interest. The funding sponsors had no role in the design of the study, in the collection, analyses, or interpretation of data, in the writing of the manuscript, or in the decision to publish the results.

References

  1. Viswanathan, R.; Bakker, W. Materials for ultrasupercritical coal power plants—Boiler materials: Part 1. J. Mater. Eng. Perform. 2001, 10, 81–95. [Google Scholar] [CrossRef]
  2. Masuyama, F. History of power plants and progress in heat resistant steels. ISIJ Int. 2001, 41, 612–625. [Google Scholar] [CrossRef]
  3. Viswanathan, R.; Coleman, K.; Rao, U. Materials for ultra-supercritical coal-fired power plant boilers. Int. J. Press. Vessels Pip. 2006, 83, 778–783. [Google Scholar] [CrossRef]
  4. Ray, A.K.; Tiwari, Y.N.; Roy, P.K.; Chaudhuri, S.; Bose, S.C.; Ghosh, R.N.; Whittenberger, J.D. Creep rupture analysis and remaining life assessment of 2.25 Cr–1Mo steel tubes from a thermal power plant. Mater. Sci. Eng. A 2007, 454, 679–684. [Google Scholar] [CrossRef]
  5. Klueh, R.L.; Nelson, A.T. Ferritic/martensitic steels for next-generation reactors. J. Nucl. Mater. 2007, 371, 37–52. [Google Scholar] [CrossRef]
  6. Dhooge, A.; Vinckier, A. Reheat cracking—A review of recent studies. Int. J. Press. Vessels Pip. 1987, 27, 239–269. [Google Scholar] [CrossRef]
  7. Dhooge, A.; Vekeman, J. New generation 2 1/4 Cr steels T/P 23 and T/P 24 weldability and high temperature properties. Weld. World 2005, 49, 75–93. [Google Scholar] [CrossRef]
  8. Arivazhagan, B.; Vasudevan, M. Studies on A-TIG welding of 2.25 Cr-1Mo (P22) steel. J. Manuf. Process. 2015, 18, 55–59. [Google Scholar] [CrossRef]
  9. Boiler, A.S.M.E.; Code, P.V. Section VIII Division 1; UG-126 Pressure Relief Valves to UG-129 Marking; ASME International: New York, NY, USA, 2010. [Google Scholar]
  10. Toshiro, K.; Isamu, Y.; Mitsuo, N. Evaluation of dynamic fracture toughness parameters by instrumented Charpy impact test. Eng. Fract. Mech. 1986, 24, 773–782. [Google Scholar] [CrossRef]
  11. Yang, Z.; Kang, H.; Lee, Y. Experimental study on variations in charpy impact energies of low carbon steel, depending on welding and specimen cutting method. J. Mech. Sci. Technol. 2016, 30, 2019–2028. [Google Scholar] [CrossRef]
  12. Lucon, E.; Mccowan, C.; Santoyo, N.; Raymond, L. Instrumented impact tests: Effects of machine variables and specimen position. J. Test. Eval. 2008, 37, 59–68. [Google Scholar]
  13. Kurishita, H.; Kayano, H.; Narui, M.; Yamazaki, M.; Kano, Y.; Shibahara, I. Effects of V-notch dimensions on Charpy impact test results for differently sized miniature specimens of ferritic steel. Mater. Trans. JIM 1993, 34, 1042–1052. [Google Scholar] [CrossRef]
  14. Im, Y.R.; Oh, Y.J.; Lee, B.J.; Hong, J.H.; Lee, H.C. Effects of carbide precipitation on the strength and Charpy impact properties of low carbon Mn–Ni–Mo bainitic steels. J. Nucl. Mater. 2001, 297, 138–148. [Google Scholar] [CrossRef]
  15. Sun, C.; Fu, P.X.; Liu, H.W.; Liu, H.H.; Du, N.Y. Effect of Tempering Temperature on the Low Temperature Impact Toughness of 42CrMo4-V Steel. Metals 2018, 8, 232. [Google Scholar] [CrossRef]
  16. Shen, D.D.; Song, S.H.; Yuan, Z.X.; Weng, L.Q. Effect of solute grain boundary segregation and hardness on the ductile-to-brittle transition for a Cr–Mo low-alloy steel. Mater. Sci. Eng. A 2005, 394, 53–59. [Google Scholar] [CrossRef]
  17. Hwang, B.; Kim, Y.G.; Lee, S.; Kim, Y.M.; Kim, N.J.; Yoo, J.Y. Effective grain size and Charpy impact properties of high-toughness X70 pipeline steels. Metall. Mater. Trans. A 2005, 36, 2107–2114. [Google Scholar] [CrossRef]
  18. Ghosha, A.; Sahoob, S.; Ghoshc, M.; Ghosha, R.N.; Chakrabarti, D. Effect of microstructural parameters, microtexture and matrix strain on the Charpy impact properties of low carbon HSLA steel containing MnS inclusions. Mater. Sci. Eng. A 2014, 613, 37–47. [Google Scholar] [CrossRef]
  19. Melchers, R.E.; Chaves, I.A.; Jeffrey, R. A Conceptual Model for the Interaction between Carbon Content and Manganese Sulphide Inclusions in the Short-Term Seawater Corrosion of Low Carbon Steel. Metals 2016, 6, 132. [Google Scholar] [CrossRef]
  20. Speich, G.R.; Spitzig, W.A. Effect of volume fraction and shape of sulfide inclusions on through-thickness ductility and impact energy of high-strength 4340 plate steels. Metall. Trans. A 1982, 13, 2239–2258. [Google Scholar] [CrossRef]
  21. Tsunekage, N.; Tsubakino, H. Effects of sulfur content and sulfide-forming elements addition on impact properties of ferrite–pearliticmicroalloyed steels. ISIJ Int. 2001, 41, 498–505. [Google Scholar] [CrossRef]
  22. Cheruvu, N.S. Degradation of mechanical properties of Cr-Mo-V and 2.25 Cr-1Mo steel components after long-term service at elevated temperatures. Metall. Trans. A 1989, 20, 87–97. [Google Scholar] [CrossRef]
  23. Laha, K.; Rao, K.B.S.; Mannan, S.L. Creep behaviour of post-weld heat-treated 2.25 Cr-1Mo ferritic steel base, weld metal and weldments. Mater. Sci. Eng. A 1990, 129, 183–195. [Google Scholar] [CrossRef]
  24. Mitra, R.; Srivastava, A.K.; Prasad, N.E.; Kumari, S. Microstructure and mechanical behaviour of reaction hot pressed multiphase Mo–Si–B and Mo–Si–B–Al intermetallic alloys. Intermetallics 2006, 14, 1461–1471. [Google Scholar] [CrossRef]
  25. Garrison, W.M., Jr.; Wojcieszynski, A.L. A discussion of the effect of inclusion volume fraction on the toughness of steel. Mater. Sci. Eng. A 2007, 464, 321–329. [Google Scholar] [CrossRef]
  26. Murakami, Y. Material defects as the basis of fatigue design. Int. J. Fatigue 2012, 41, 2–10. [Google Scholar] [CrossRef]
  27. Yokomizo, T.; Enomoto, M.; Umezawa, O.; Spanos, G.; Rosenberg, R.O. Three-dimensional distribution, morphology, and nucleation site of intragranular ferrite formed in association with inclusions. Mater. Sci. Eng. A 2003, 344, 261–267. [Google Scholar] [CrossRef]
  28. Zhang, C.; Xia, Z.X.; Yang, Z.G.; Liu, Z.H. Influence of prior austenite deformation and non-metallic inclusions on ferrite formation in low-carbon steels. J. Iron Steel Res. Int. 2010, 17, 36–42. [Google Scholar] [CrossRef]
  29. Xu, S.; Wang, C.; Wang, W. Failure analysis of stress corrosion cracking in heat exchanger tubes during start-up operation. Eng. Fail. Anal. 2015, 51, 1–8. [Google Scholar] [CrossRef]
  30. Henthorne, M. The Slow Strain Rate Stress Corrosion Cracking Test—A 50 Year Retrospective. Corrosion 2016, 72, 1488–1518. [Google Scholar] [CrossRef]
Figure 1. Schematic of pipe size and charpy V-notch impact specimen (a) pipe size (b) single-notch.
Metals 08 00373 g001
Figure 2. Absorbed energy of Charpy impact test of steel specimens (left): a = 385J, b = 379J, c = 28J and corresponding images of the fractured specimens (right).
Metals 08 00373 g002
Figure 3. SEM observation of the fracture surface. (a) 28J; (b) 386J specimen.
Metals 08 00373 g003
Figure 4. OM and SEM images of inclusions in the cross-section of the (a) 28J and (b) 386J specimen.
Metals 08 00373 g004
Figure 5. Counting inclusion using EPMA-BSE image (a) 28J and (b) 386J Specimen.
Metals 08 00373 g005
Figure 6. The experimentally measured specimens and the amount of inclusions.
Metals 08 00373 g006
Figure 7. Microstructure of the 28J specimen cross-section. (a) OM image; (b) SEM image; (c,d) SEM image of regions enlarged by the red squares in (b).
Metals 08 00373 g007
Figure 8. Microstructure of the base metal: (a) 386J specimen and (c) is (a) part enclosed with a red square; (b) 21 specimen and (d) is (a) part enclosed with a red square.
Metals 08 00373 g008
Figure 9. Relationship between volume fraction of ferrite and impact value (a) Volume fraction of ferrite for 386J and 28J specimens and (b) liner analysis of impact value and fraction of ferrite.
Metals 08 00373 g009
Figure 10. CCT curves for different volume fraction of alloying elements calculated by a Jmat-Pro simulation.
Metals 08 00373 g010
Figure 11. SEM image of the base metal (a) 386J and enlarged red square (c); (b) 28J and enlarged red square (d).
Metals 08 00373 g011
Figure 12. Histogram of a carbide in 386J and 28J specimens.
Metals 08 00373 g012
Figure 13. Schematic of calculation of carbon contents in the other constituent (a) Fe-C phase diagram (b) 2.25Cr-1Mo Steel + C phase diagram calculated using Thermo-calc (c) modeling of carbon concentration between ferrite and the other constituent.
Metals 08 00373 g013
Figure 14. EPMA images of the 28J impact specimen. (a) composite image (b) chromium (c) carbon (d) molybdenum (e) manganese (f) sulfur.
Metals 08 00373 g014
Table 1. Chemical composition of 2.25Cr-1Mo steel (wt %).
MaterialChemical Composition (at. %)
CSiMnCuNiCrMoVNbAlPSFe
P220.1020.2180.4330.1200.12462.09480.9300.0110.00230.02510.01400.0048Bal
0.0970.2270.4430.1240.12392.03050.9310.0120.00090.02470.01160.0039Bal
0.1000.2290.4340.1160.12302.00510.9310.014100.02460.00980.0047Bal
Average0.1000.2250.4360.1200.12382.04350.9310.01240.00110.02480.01180.0047Bal
Table 2. PWHT (Post Weld Heat Treatment) conditions of Cr-Mo steel.
ConditionActual
Loading Temperature20 °C
Heating Rate20 °C/h
Holding Temperature700–710 °C
Holding Time11 h
Cooling Rate (above 425 °C)20–30 °C/h

