Article

Effects of Sample and Indenter Configurations of Nanoindentation Experiment on the Mechanical Behavior and Properties of Ductile Materials

by
Seyed Saeid Rahimian Koloor
1,*,
Atefeh Karimzadeh
1,
Mohd Nasir Tamin
1,* and
Mohd Hamdi Abd Shukor
2
1
Computational Solid Mechanics Laboratory, Department of Applied Mechanics and Design, Faculty of Mechanical Engineering, Universiti Teknologi Malaysia, Johor Bahru 81310, Malaysia
2
Centre of Advanced Manufacturing & Material Processing, University of Malaya, Kuala Lumpur 50603, Malaysia
*
Authors to whom correspondence should be addressed.
Metals 2018, 8(6), 421; https://doi.org/10.3390/met8060421
Submission received: 14 March 2018 / Revised: 8 April 2018 / Accepted: 9 April 2018 / Published: 5 June 2018
(This article belongs to the Special Issue Metallic Materials and Manufacturing)

Abstract

:
The nanoindentation test is frequently used as an alternate method to obtain the mechanical properties of ductile materials. However, due to the lack of information about the effects of the sample and indenter physical configurations, the accuracy of the extracted material properties in nanoindentation tests requires further evaluation that has been considered in this study. In this respect, a demonstrator ductile material, aluminum 1100, was tested using the Triboscope nanoindenter system with the Berkovich indenter. A 3D finite element simulation of the nanoindentation test was developed and validated through exact prediction of the structural response with measured data. The validated model was then employed to examine the effects of various test configurations on the load–displacement response of the sample material. These parameters were the different indenter edge-tip radii, different indentation depths, different sample tilts, and different friction conditions between the indenter and the material surface. Within the range of the indenter edge-tip radii examined, the average elastic modulus and hardness were 78.34 ± 14.58 and 1.6 ± 0.24 GPa, respectively. The different indentation depths resulted in average values for the elastic modulus and hardness of 77.03 ± 6.54 and 1.58 ± 0.17 GPa, respectively. The uneven surface morphology, as described by the inclination of the local indentation plane, indicated an exponential increase in the extracted values of elastic modulus and hardness, ranging from 71.83 and 1.47 GPa (for the reference case, θ = 0°) to 243.39 and 5.05 GPa at θ = 12°. The mechanical properties that were obtained through nanoindentation on the surface with 6° tilt or higher were outside the range for aluminum properties. The effect of friction on the resulting mechanical response and the properties of the material was negligible.

1. Introduction

Many empirical methods have been developed for mechanical characterization of ductile materials [1,2] in order to obtain the properties of materials in different scales [3,4,5,6], such as macromechanical testing, nanoindentation, etc. [7,8,9,10]. Nanoindentation experiment has been broadly used to measure the local and global mechanical properties of a wide range of materials, including ductile materials [8,11,12,13,14,15]. In conventional nanoindentation experiment [2,16,17], the mechanical properties of a bulk material or a coating on an object, such as the elastic modulus, hardness, yield strength, elastic–plastic deformation, etc., are obtained from load/unload vs. displacement curve that is recorded during penetration of an indenter tip into the sample surface [2,18,19,20]. In the conventional method, different indentation depths may be applied, and the results of nanoindentation experiments are affected by several geometrical and physical factors, such as the radius of the indenter tip [21,22,23], the indentation depth [24,25], the surface tilt of the specimen [26,27,28], the friction force applied from the sample material to the indenter tip [29], etc. In addition to this, the variation in material properties due to the changes in sample length, the so called “size effect phenomenon” [25,30], is a factor that affects the material response during nanoindentation tests. This phenomenon is normally studied at large indentation depths [25,30,31,32] to capture the different responses reflected by the nanoscale construction of the material. Nano/micro-structural configurations, such as crystalline or grain and grain boundary in metals, could effectively influence the response of materials during the nanoindentation process [25,33]. In general, the size effect causes an increase in hardness for lower indentation depths [25,34,35]. The effects of grain size and boundary on the indentation size effect have been investigated through indentation tests of single crystalline and polycrystalline metals [36,37,38,39]. A study revealed that the indentation size effect in single crystalline aluminum appears in indentation depth of 60 nm, while it appears at a depth of 200 nm for polycrystalline aluminum due to the effect of grain boundary [40]. An investigation into the contact responses of hexagonal close packed (HCP) and face-centered cubic (FCC) single crystals of bulk material and thin films on a layer, addressed material behavior through monitoring plastic deformation and damage due to crack nucleation [41]. Almasri and Voyiadjis investigated the nanoindentation of FCC metals, including aluminum, copper, nickel, silver, and lead, in which they classified the size effect that caused the hardening to reduce through the strain gradient mechanism and increase as a result of grain boundaries that act as a barrier for dislocation movement [42]. They found that the size effect on pure aluminum was activated within an indentation depth of 100 nm [43]. In another study by Liu et al., the crystal plasticity of FCC aluminum was studied using nanoindentation with a Berkovich indenter [43,44]. Their study showed that in nanoindentation, the size effect of pure aluminum with a lattice of three rotation angles appears within 150 nm. The major size effect that increases the strength of pure aluminum appears at an indentation depth within 150 nm [33,43,44].
Many studies have been performed for mechanical characterization of advanced materials in different scales. Ehtemam-Haghighi et al. used nanoindentation to measure the variation in mechanical properties of Ti alloys based on their content of Fe and Ta [45]. Attar et al. investigated the different indentation loads required to obtain the hardness and elastic modulus properties of Ti and Ti–TiB composites, and they found 5 mN to be the best value for the load [46]. Guo et al. used load–displacement curves of nanoindentation tests on bulk metallic glass to calculate plastic deformation and damage, and estimate fracture toughness [47]. Yang et al. used a nanoindentation method to measure the properties of Al/SiC nanolaminates under different temperature conditions [48]. Han et al. used a nanoindentation technique to measure the hardness and estimate the macroscopic plastic flow in bulk titanium aluminide (Ti–Al) intermetallic compounds [49]. Huang et al. studied the anisotropy effect of single crystal diamond using a nanoindentation method [50]. They found that the mechanical properties of diamond are very much dependent on the orientation of the indented surface.
Previous studies have shown that the indenter tip’s shape and especially its roundness have a significant effect on the nanoindentation test results [21,22]. In practice, due to the restrictions of manufacturing methods and structural characteristics of indenter tips, the radius may deviate from its ideal shape. The effect of this parameter can be studied by simulating a nanoindentation experiment using the finite element method, which has been performed by several researchers [21,23,51]. However, very few studies have been simulated the real Berkovich indenter in a 3D configuration, and instead, a conical indenter with a half angle of 70.3 has been modeled in a 2D or 3D form.
In nanoindentation experiments, the area of the residual indentation hole is measured from an atomic force microscopy (AFM) image to calculate the material’s hardness by dividing the maximum indentation force by the measured area. The value of the residual indentation-hole area depends on the indentation depth for each specific shape of indenter, for example, the Berkovich indenter. Therefore, the mechanical properties of materials obtained from nanoindentation experiments may vary for different penetration depths of the indenter into the material. Empirical investigations [33,44,52,53] have shown that the indenter penetration depth has influence on the results of nanoindentation experiments; however, this effect is eliminated at a depth of 200 nm, and stable results are obtained in FCC aluminum.
The effects of a sample’s surface tilt on the nanoindentation results have been studied by some researchers [26,27,28,54]. For example, Xu and Li (2007) investigated the effect of surface tilt on sample hardness in a nanoindentation experiment. According to the results of their investigation, the hardness value measured by the test on the tilted sample is significantly higher than the real hardness of the specimen [28]. Kashani and Madhavan (2011) studied the influence of sample tilt on the results of a nanoindentation test with a conical and Berkovich indenter using a three-dimensional (3D) finite element (FE) simulation. In their study, the Berkovich indenter was modeled in the shape of a conical indenter with the same projected area, and a 12% error in the hardness value was observed for the tilted sample [26].
Although the effects of different geometrical and physical factors on nanoindentation test results have been studied in previous researches, only a few researchers have considered the influence of the combinations of different factors at the same time. In this study, the effects of different sample and indenter configurations on the responses of ductile material during nanoindentation tests are studied using experimental and computational methods. These configurations include the indenter edge-tip radius, the indentation depth, the local orientation of the indentation plane and the friction conditions between the indenter and the material’s surface. The effects of combinations of different configurations during the nanoindentation test results are also investigated. Aluminum 1100 is selected as a ductile material sample that is frequently used in studies for industrial applications. A close comparison between the experimentally-measured and FE-predicted load–displacement responses of aluminum in the nanoindentation test, is seen as the validation of the FE model. Then, the validated FE model is employed to investigate the effects of various sample and indenter configurations in the load–displacement response, elastic modulus and hardness properties that are obtained through the indentation process. The results of each configuration are compared through a systematic method, to provide insight into the effects of various sample configurations and indenter edge-tip shapes in different loading conditions of nanoindentation experiments. This approach is applicable to all FCC single crystal metallic materials [55].

2. Nanoindentation Experiment

A pure single crystalline FCC aluminum 1100 was used for the nanoindentation test. The experiment was performed using a Triboscope system (Hysitron Inc., Minneapolis, MN, USA) and a Berkovich indenter that is commonly used for the characterization of bulk materials. The nanoindentation instrument was calibrated according to the standard, ISO 14577. The aluminum specimen was made as a cubic sample with 10 × 10 × 3 mm3 dimensions. The sample surface was highly polished such that any conversion in the surface hardness was minimized [56]. Therefore, in the first step, 400 to 2500 grit sandpapers were used to grind the surface of the aluminum specimen, which was then polished using alumina suspension with mesh sizes of 1 and 0.5 microns, respectively. Subsequently, AFM image was used to examine the roughness of the sample at the indentation regions. The surface of the specimen was checked by optical microscope prior to the tests to make sure that no oxide layer exists on the sample’s surface.
As recommended in previous studies [52,53], an average indentation depth of 250 nm (240 ± 20) was considered to provide a stable condition and obtain the material properties. The loading was controlled by a displacement rate of 8 nm per second with a constant speed. This depth is considered to be suitable for minimizing the surface effect in accordance with the ISO 14577 standard. According to this standard, the value of the indentation depth and the surface roughness should satisfy the following relationship in order to reduce the effect of surface roughness on the indentation results below 5%:
h 20 R a
where h is the indentation depth and Ra is the arithmetic mean deviation roughness. A roughness analysis was performed on all AFM images taken from the sample’s surface prior to the tests. The result of one of the roughness analysis cases is shown in Figure 1. Based on the results, the average value of Ra for the aluminum samples was 9.938 nm, therefore, the indentation depth of 250 nm satisfies the standard criterion indicated in Equation (1).
In the nanoindentation experiment, once the indenter reached the maximum prescribed depth (i.e., 250 nm), it was held for ten seconds under a constant load, and then the indenter was moved back with a similar loading rate to perform the unloading process. The reaction force that was felt by the load-cell on the indenter was recorded throughout each process of loading, holding and unloading, and was used to plot the load/unload-displacement response. Then, the Oliver–Pharr method was used to calculate the mechanical properties of aluminum 1100 based on the theory of contact mechanics [57]. In this process, three indentation tests were performed on randomly selected locations on the sample surface under ambient conditions. The AFM images were taken before and after the tests by the same instrument as the one used for the nanoindentation experiment, which was later utilized for the surface analyses.

The Young’s Modulus and Hardness

The structural response of the nanoindentation test was used to calculate the elastic and hardness properties. The Young’s modulus was obtained using the Sneddon relationship [58]:
1 E eff = 1 ν 2 E + 1 ν i 2 E i
where E, Ei and ν, νi are the elasticity modulus and Poisson’s ratio of the test specimen and indenter tip, respectively. The effective elasticity modulus of aluminum is known as Eeff, and it can be calculated using the unloading part of the structural response through the indentation test. According to the technical data from the Triboscope system (recommended by Hysitron Inc., USA [59]), the elastic modulus and Poisson’s ratio of the indenter tip were 1140 GPa and 0.07, respectively. The hardness parameter is the resistance of the material to localized permanent deformation during the loading process, and is equal to the applied maximum force per projected-area of the residual indentation mark. The hardness value can be calculated using the following equation [60]:
H = F Max A i
where F Max is the maximum recorded force, and A i is the indentation projected area of the contact surface between the indenter and aluminum that is related to the contact depth (hc) [57]. The relation between indentation projected contact area and contact depth is as follows (Oliver-Pharr 2003 [60]):
A i = C 0 h c 2 + C 1 h c + C 2 h c 1 2 + C 3 h c 1 4 + C 4 h c 1 8 + C 5 h c 1 16 + C 6 h c 1 32 + C 7 h c 1 64 + C 8 h c 1 128
where Ci is obtained from the calibration procedure of the indenter tip. By substituting the value of Ci into Equation (4), the nanoindentation projected contact area is:
A i = 24.5 h c 2 + 4.9469 E 4 h c 2.5634 E 6 h c 1 2 + 1.1708 E 7 h c 1 4 4.9692 E 5 h c 1 8 1.1405 E 7 h c 1 16 .
The value of the contact depth can be measured using the load–displacement data from the indentation test using the following equation:
h max = h c + h a
where hmax is the maximum indentation depth, and ha is the depth of the circle of contact from the specimen-free surface that is obtained using:
h a = π 2 π   h e
where he is the elastic displacement during the unloading process and can be obtained using:
h e = h max h r
where hr is the depth of the residual impression that is measured from the nanoindentation depth. Once the value of contact depth is calculated using Equations (6)–(8), the indentation projected area and subsequently, the hardness, can be calculated using Equations (3) and (5).

3. Finite Element Modeling

A 3D model of the nanoindentation test was developed using the finite element method in ABAQUS 6.14 software. A 3D standard Berkovich indenter with an average edge-tip radius of about 200 nm (ISO 14577 standard) was created, as shown in Figure 2. The aluminum specimen was modeled using a 15 × 15 × 10   μ m 3 cubic block that was meshed using four-node linear tetrahedron solid elements (C3D4), while the indenter was simulated using rigid body and three-dimensional triangular rigid element (R3D3), and both models were refined toward the central region of the contact areas. The block size was considered big enough to prevent deformation being transferred to the outer surface of the block boundaries. The boundary conditions of the aluminum sample were applied to the lateral and bottom surfaces of the block by fixing the horizontal and vertical axes. Very fine meshes of a similar size were created at the indenter edge-tip and the contact point of the specimen with node-on-node first touch. A coarse mesh size was created in the boundary area where no deformation was computed that this helped to reduce the computational time.
The behavior of the aluminum block was modeled using elastic–plastic stress–strain curve that was obtained through a uniaxial tensile test. The tensile test was performed on the aluminum 1100 according to ASTM E8/E8M–09 standard, and the averaged engineering and true stress–strain curves were obtained, as shown in Figure 3a. In accordance with previous studies [61,62,63], the true stress–strain curve was used to define the elastic–plastic mechanical behavior of the aluminum in the FE model of the block. The average load/unload-displacement response of the nanoindentation experiment was used as a reference to control the displacement of the indenter during the simulation process of the nanoindentation experiment, as shown in Figure 3b. Accordingly, the loading process was applied such that the indenter drove into the aluminum surface to a depth of 244 nm in 31.25 s. Once the displacement of the indenter reached to 244 nm, the load value was kept constant for 10 s, and then the unloading process was performed with a similar rate in the loading step.
In the reference condition for the simulation of nanoindentation, an initial small radius of 0.2 μm was considered for the indenter edge and tip, and the coefficient of friction between the indenter and aluminum was defined 0.6 while the indenter movement axis was perpendicular to the horizontal aluminum surface [29,64]. The results of the simulation were compared to the average experimental data, in which a close prediction of the test data was considered as the validation step for the modeling and simulation processes.
Once the FE simulation process of the nanoindentation test was validated, the model was used to study on the effects of different sample and indentation test configurations. In this respect, indenter edge-tip radii of 0.0 (sharp indenter), 0.2, 0.4 and 0.6 μm, maximum indentation depths of 150, 250, 350 nm, sample tilts of 0°, 3°, 6°, 9°, 12° and friction coefficients of 0, 0.6 were considered. A schematic view of different radii and sample tilts is shown in Figure 4. Since a negligible size effect has been observed during nanoindentation of FCC single crystal aluminum within conventional depths [25,30,33,65], indentation depths around this average range were considered to study the material response due to elastic–plastic behavior. The sample tilt values were selected based on the local orientation of the indentation plane, which has also been recommended in previous studies [26,28]. The predicted results of each individual configuration are compared and discussed in the next section.

4. Results and Discussion

The results of the tests in terms of structural response, indentation marks and profile of the surface roughness are demonstrated. Then, the validation of the FE model and simulation process is discussed. Afterwards, the results of the validated model that has been used to investigate the various samples and test configurations, are described.

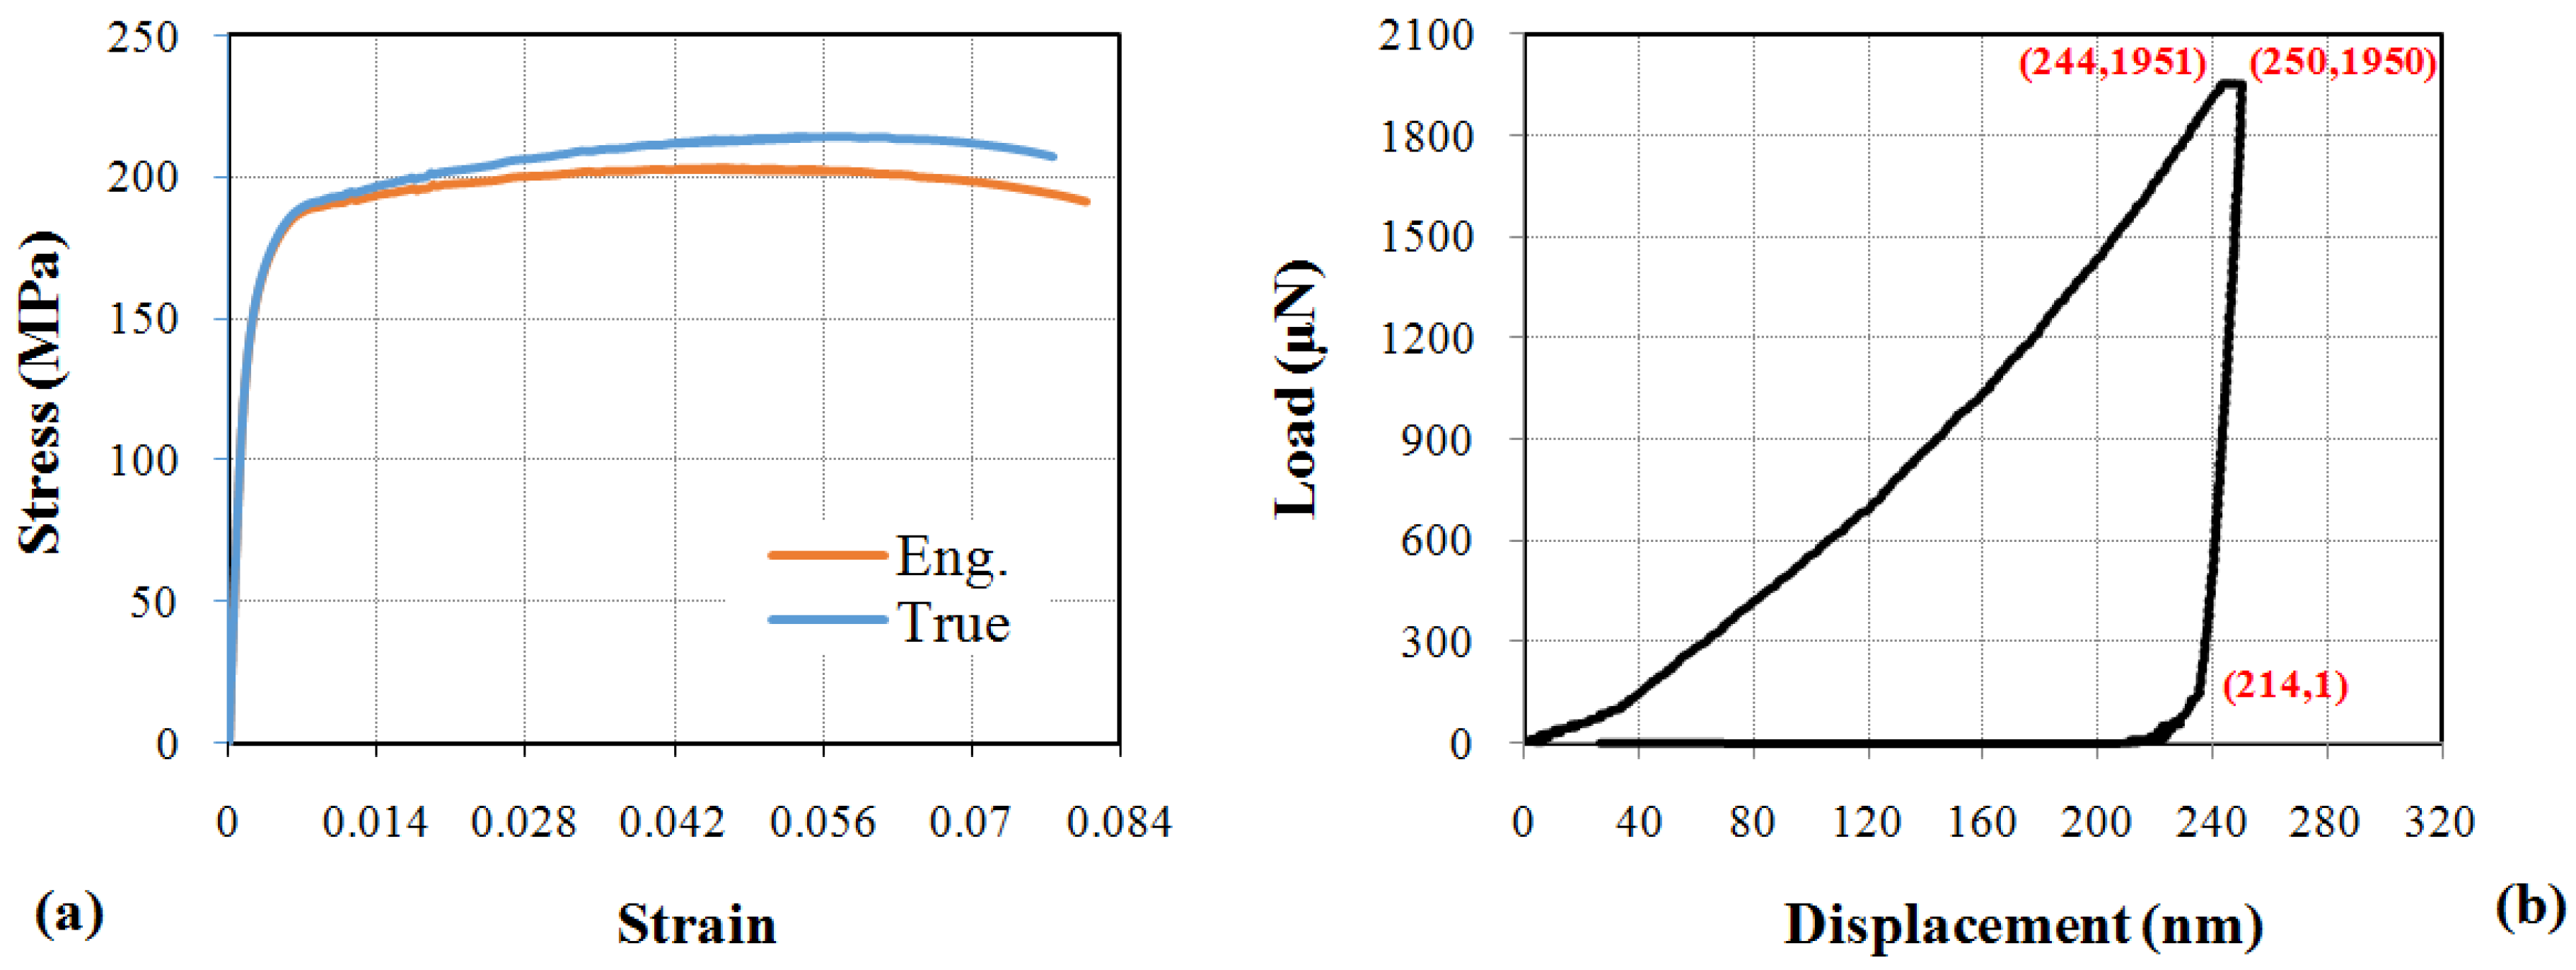
4.1. Experiment Results

The elastic modulus and yield stress of aluminum 1100 were obtained 75.31 GPa and 150 MPa, respectively, that were extracted from the stress–strain curve of the aluminum (Figure 3a). Three nanoindentation tests were performed, and the load/unload-displacement curves of the tests were recorded during the tests, as shown in Figure 5. The average load–displacement curve was used to apply the load in the FE simulation process (refer to Figure 3b and Figure 5). This curve was also used to calculate the elastic modulus of aluminum (Equation (2), ν = 0.33 ), which was found to be 71.83 GPa. The elastic modulus obtained from the nanoindentation experiment is 4.6% lower than the corresponding value of the tensile test. The good agreement in obtaining the value of elastic modulus from the tension and nanoindentation tests, indicates the accuracy of the nanoindentation experiment in regard to the mechanical characterization of ductile materials.
Normally, indentations are performed at different locations on the specimen’s surface which may have local or global tilt on the microscale level. Figure 6 shows a sample of the microscale profile on the aluminum surface where the indentation could be performed. This profile indicates that the sample tilt was between 0° to 9.5° for the aluminum surface; therefore, sample tilts of 0°, 3°, 6°, 9°, 12° were considered for the parametric studies.
The AFM images of the indented region of the aluminum sample before and after the indentation in one of the tests are shown in Figure 7.
A 3D view of the sample tilt before the experiment is shown in Figure 7a. Once the test is performed, the indentation mark in the form of a triangular-based pyramid remains on the sample (Figure 7b); however, the original sample tilt may change during the loading process. Therefore, it was necessary to investigate the effect of sample tilt on the mechanical response of the structure through the nanoindentation test. The top view of the indentation mark of the sample with 0° tilt appeared as an equilateral triangle, while the sample tilt caused the indentation mark to be in the form of a scalene triangle. A 2D view of the indentation marks of aluminum 1100 is shown in Figure 7c. The study of AFM images for all cases showed no radial cracks around the indentation hole; therefore, calculation of the properties using Equations (2)–(8) is valid.

4.2. FE Simulation Results

In this section, the description of the FE model validation is provided through comparison of the predicted result with average experimental data. Then, the results of the validated model with different samples and indenter configurations are presented.

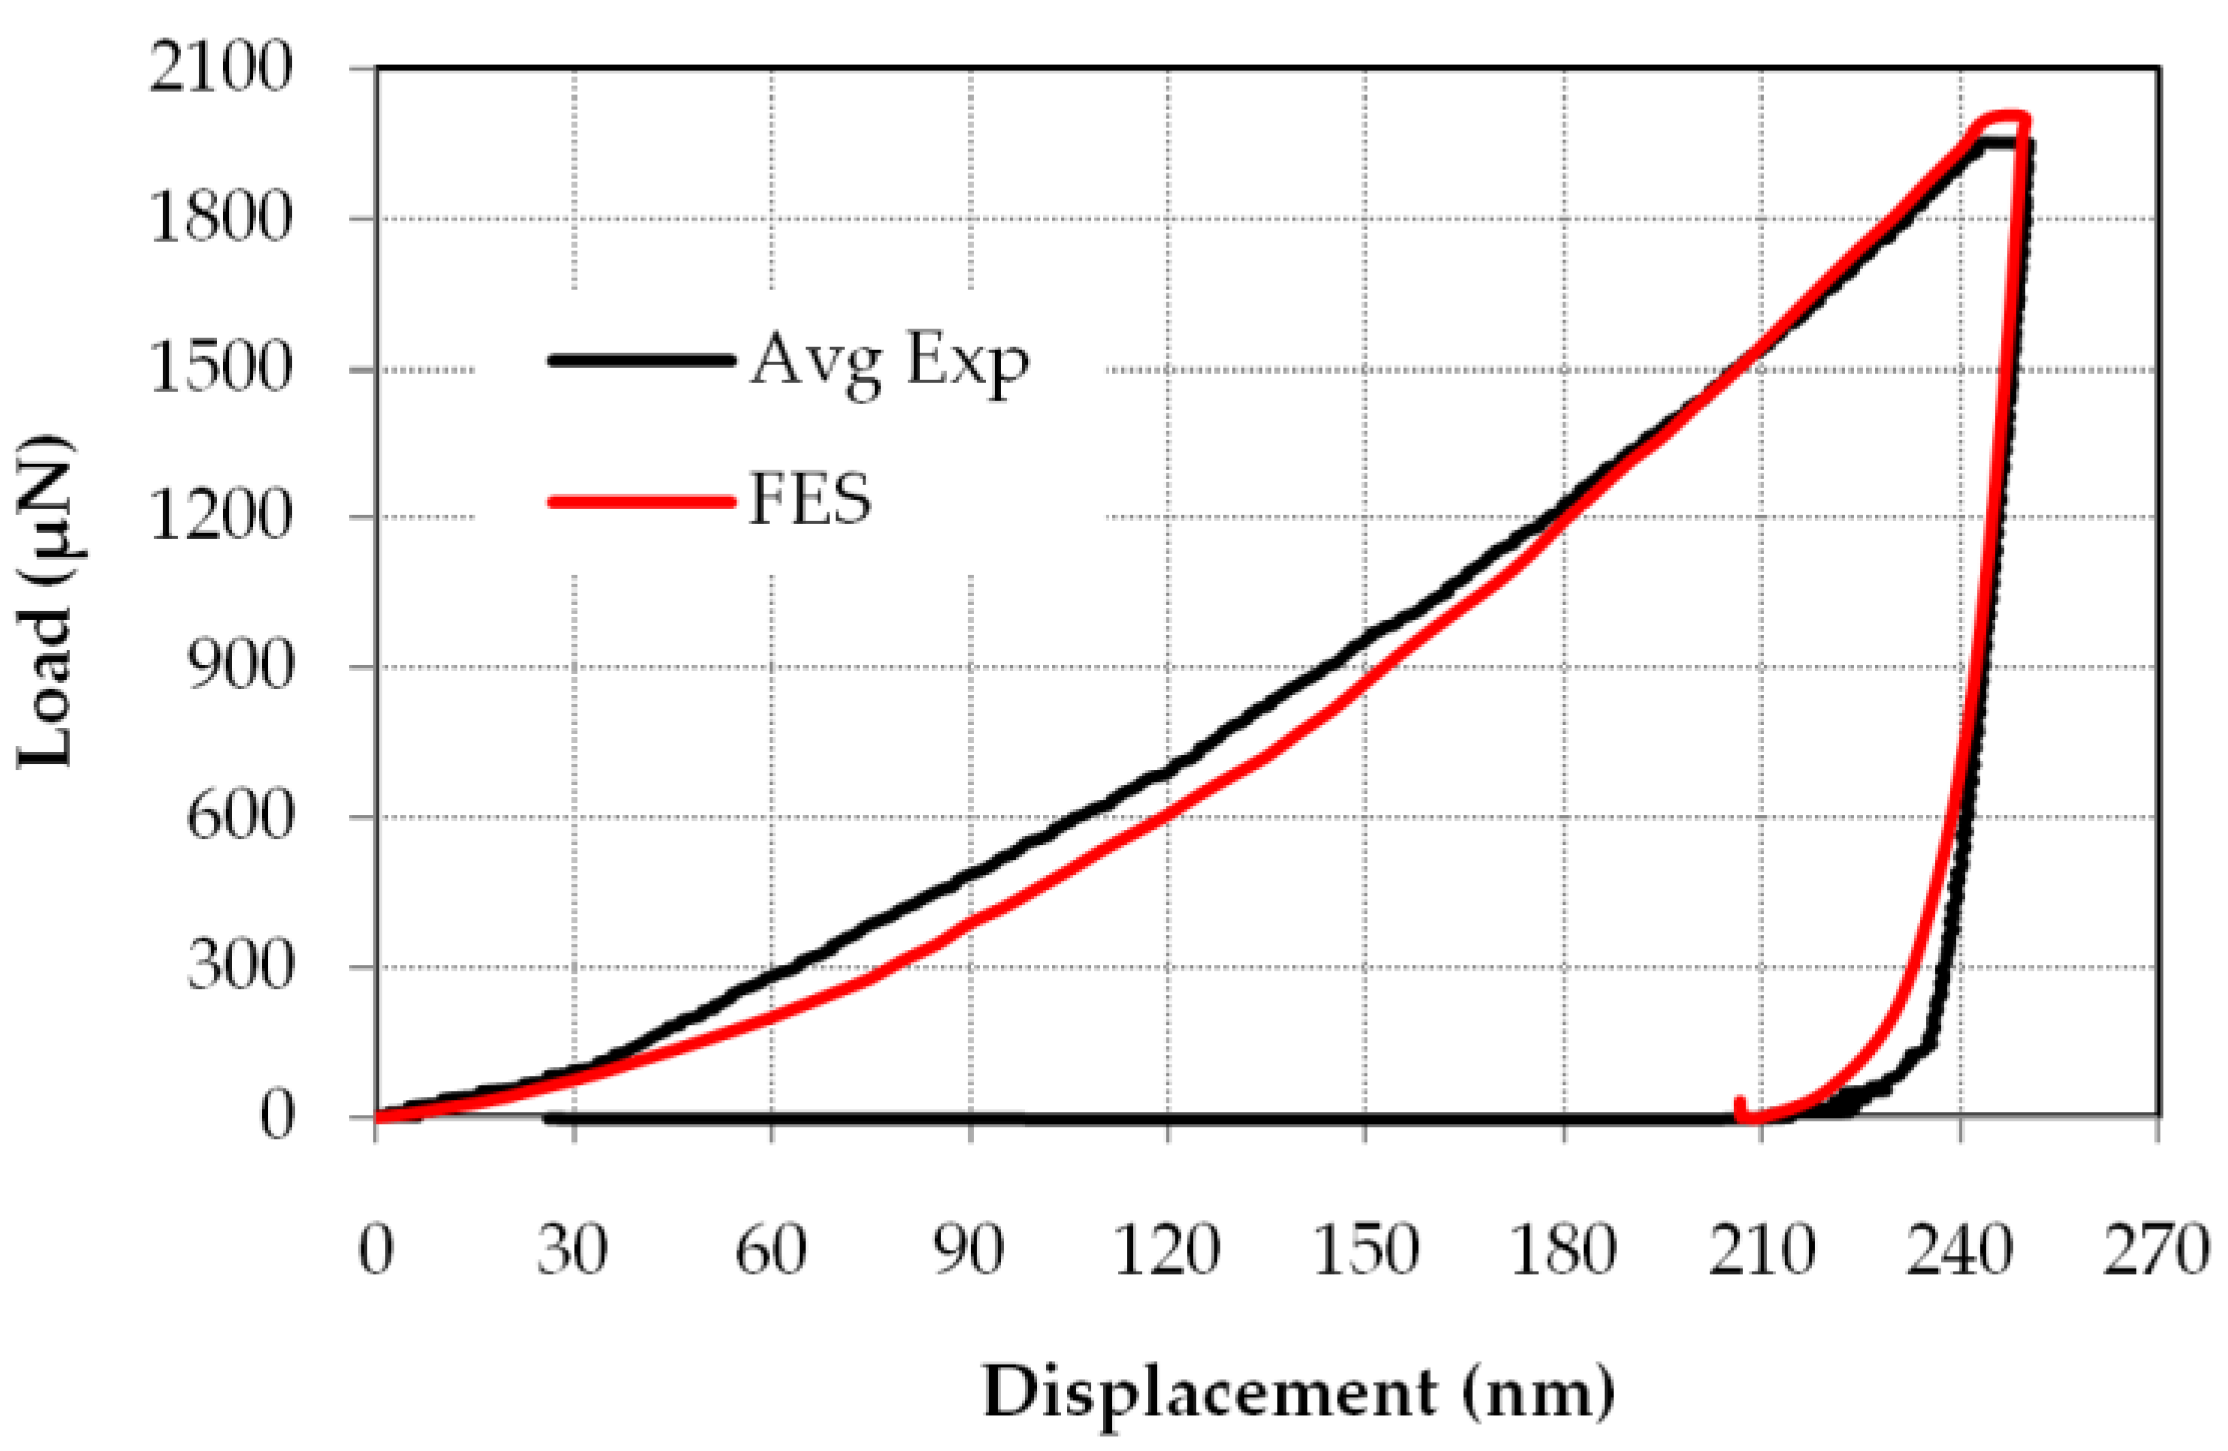
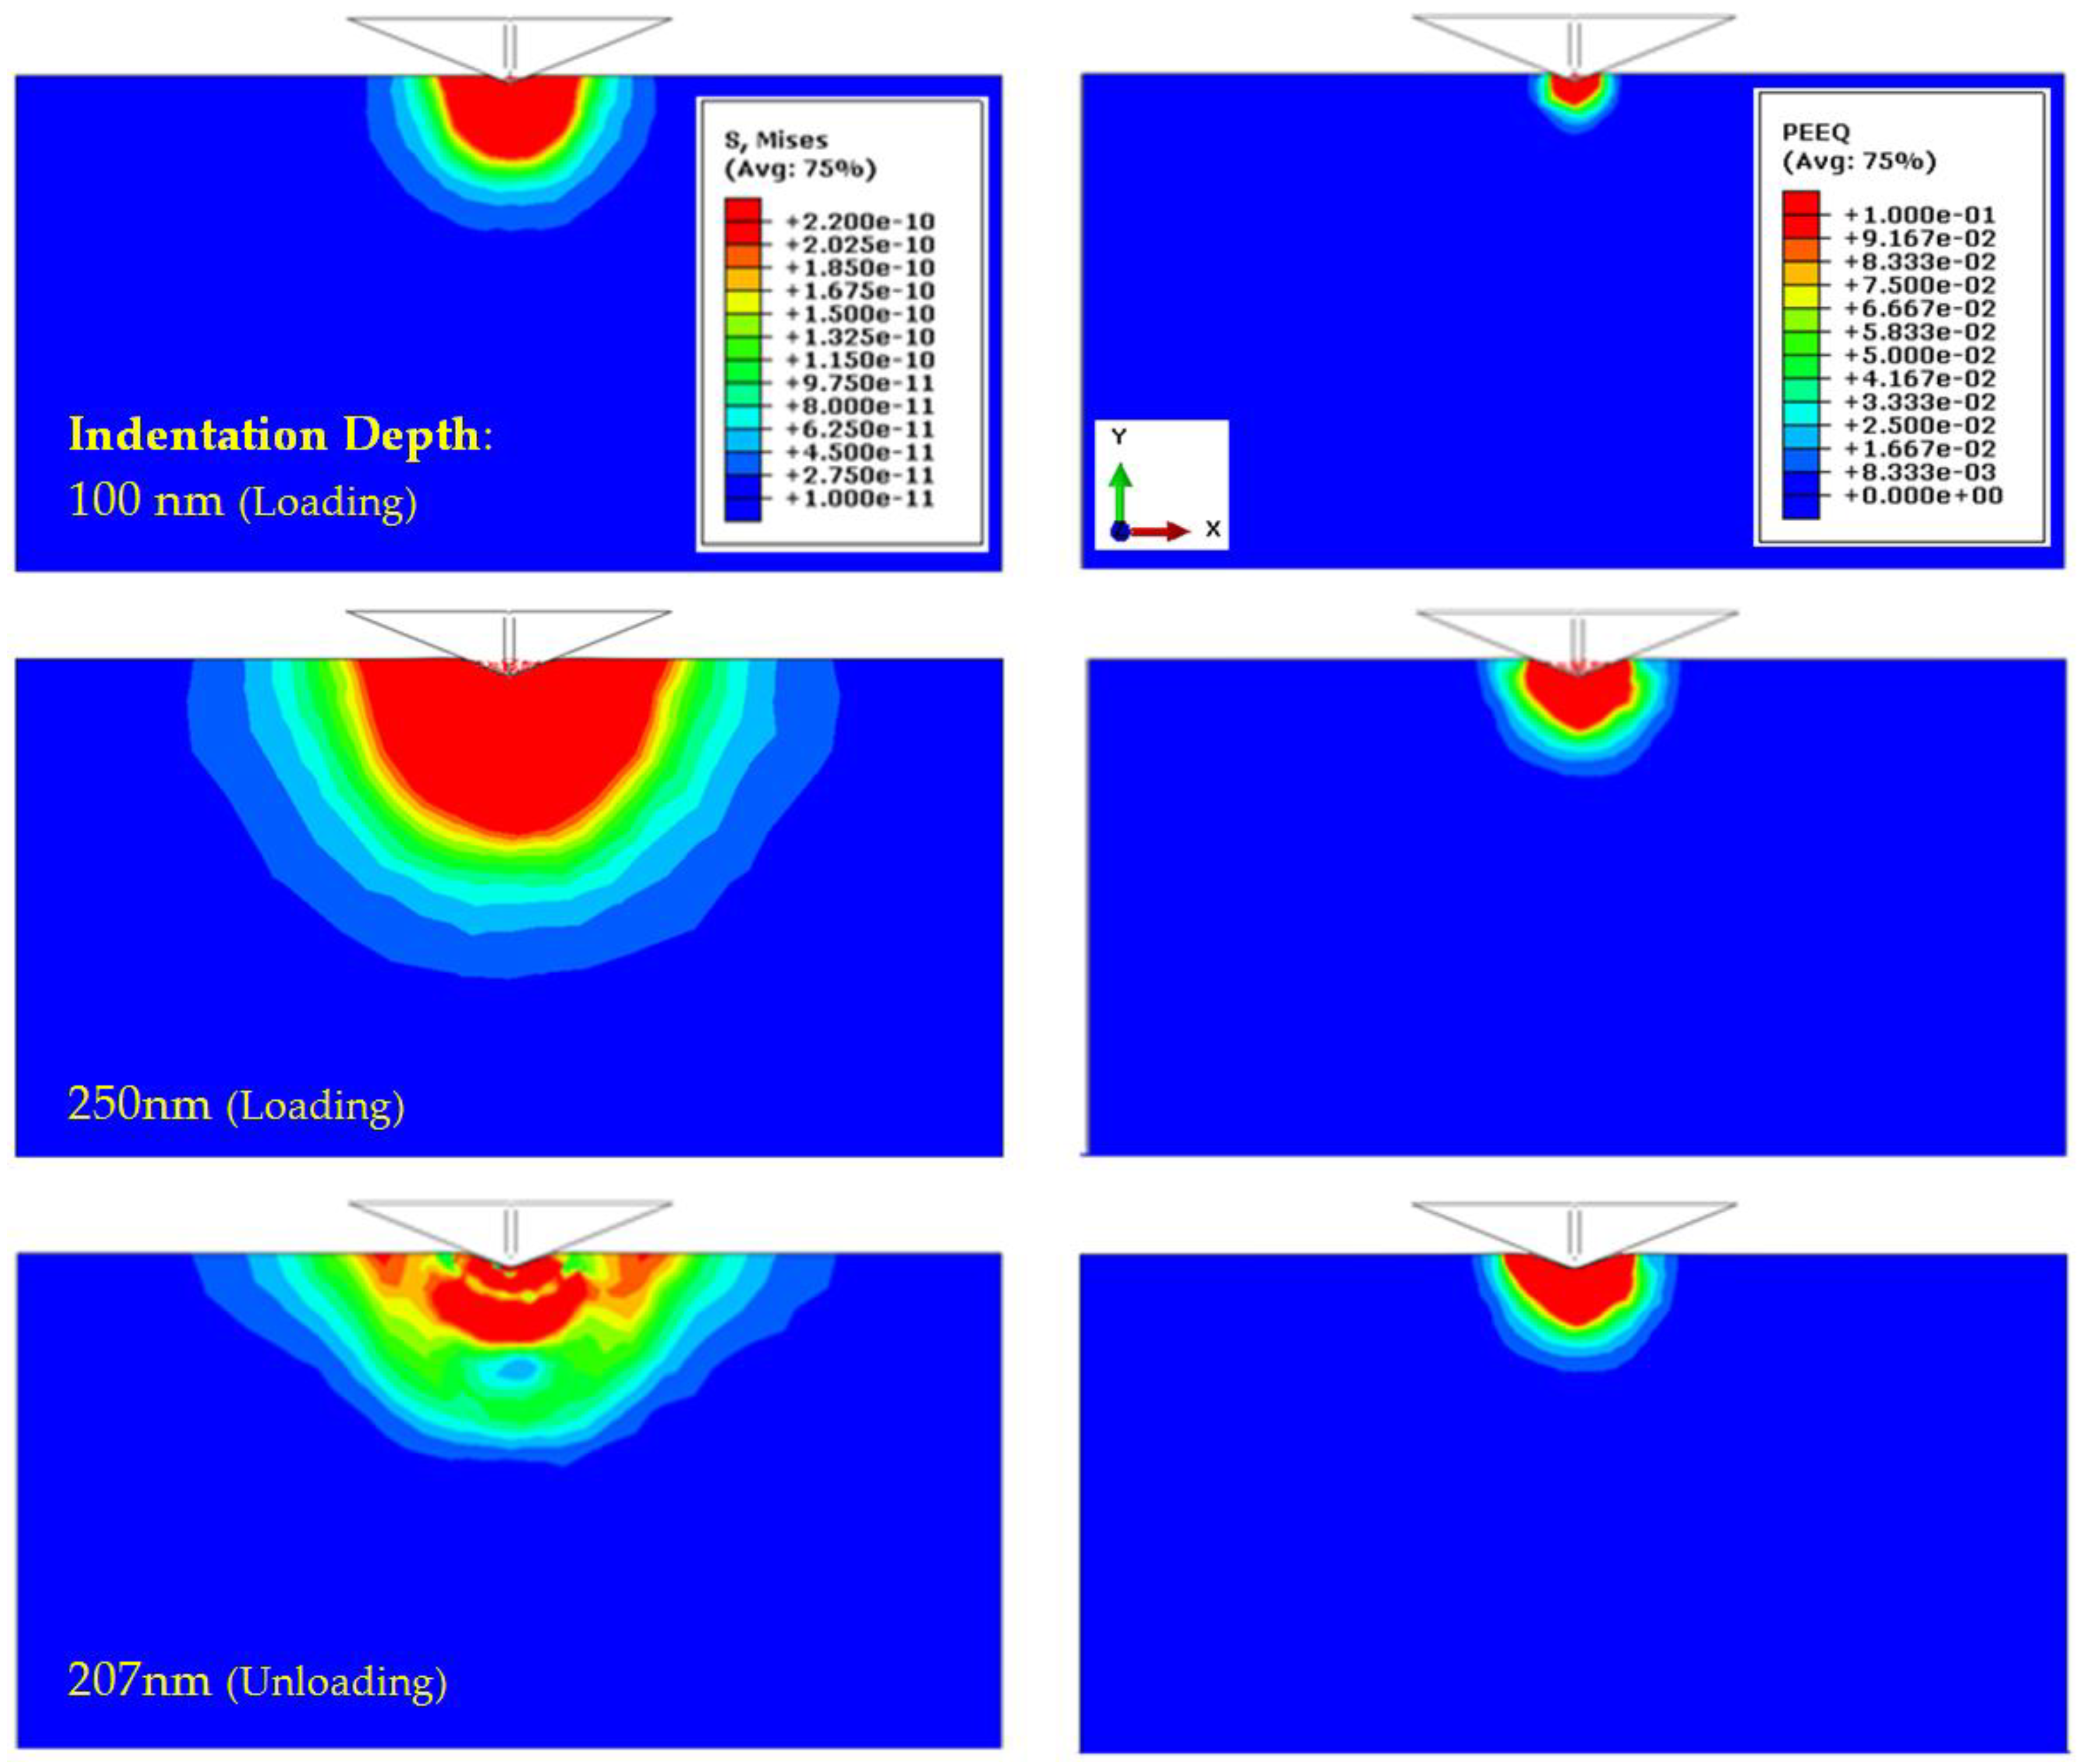
4.2.1. Validation of the FE Model and Simulation Process

The accurate prediction of the aluminum response during the nanoindentation test served as the validation step for the FE model and simulation process. In this respect, the experiment response of aluminum 1100 in terms of load versus displacement was compared with its FE simulation results, as shown in Figure 8. The FE results indicated a precise prediction of the loading and unloading processes of the average test data, representing the good applicability of the FE model and simulation process. On the other hand, the FE results of elastic modulus and hardness were calculated 76.59 and 1.47 GPa, that in comparison with the experimental data (71.83 and 1.41 GPa), showed 6 and 4 percent negligible errors, respectively. Therefore, the FE model is validated, and can be used effectively to study the various sample and indenter configurations in order to provide useful insight into the FE simulation of nanoindentation experiments.
The aluminum block under monotonic indentation load behave in the form of elastic-plastic material and a semitriangular-based pyramid deformation appears on the surface of aluminum as the indentation mark. Subsequently, the stress that results from such a deformation forms a half sphere beneath the indenter, as shown using a contour plot of von Mises stress in Figure 9 (top). Three different indentation depths of 100, 250 and 207 nm were selected to show the mechanism of loading, maximum load and zero-force during unloading, respectively. Similarly, permanent deformation and plastic strain were predicted in the aluminum, which is shown using the contour of equivalent plastic strain (PEEQ) in Figure 9 (bottom). Once the maximum prescribed penetration is reached, the unloading process has begun and as the indenter moved out, the aluminum behaves in accordance to the quasi spring-back phenomenon. In this condition, some portions of the material remain within the limits of permanent deformation, while the other portions are displaced back, and as a result of that, stress varies in the material. The permanent deformation of aluminum causes the indenter to be separated from the material through the unloading process, which results in an early diminishment of the reaction force response of the material.

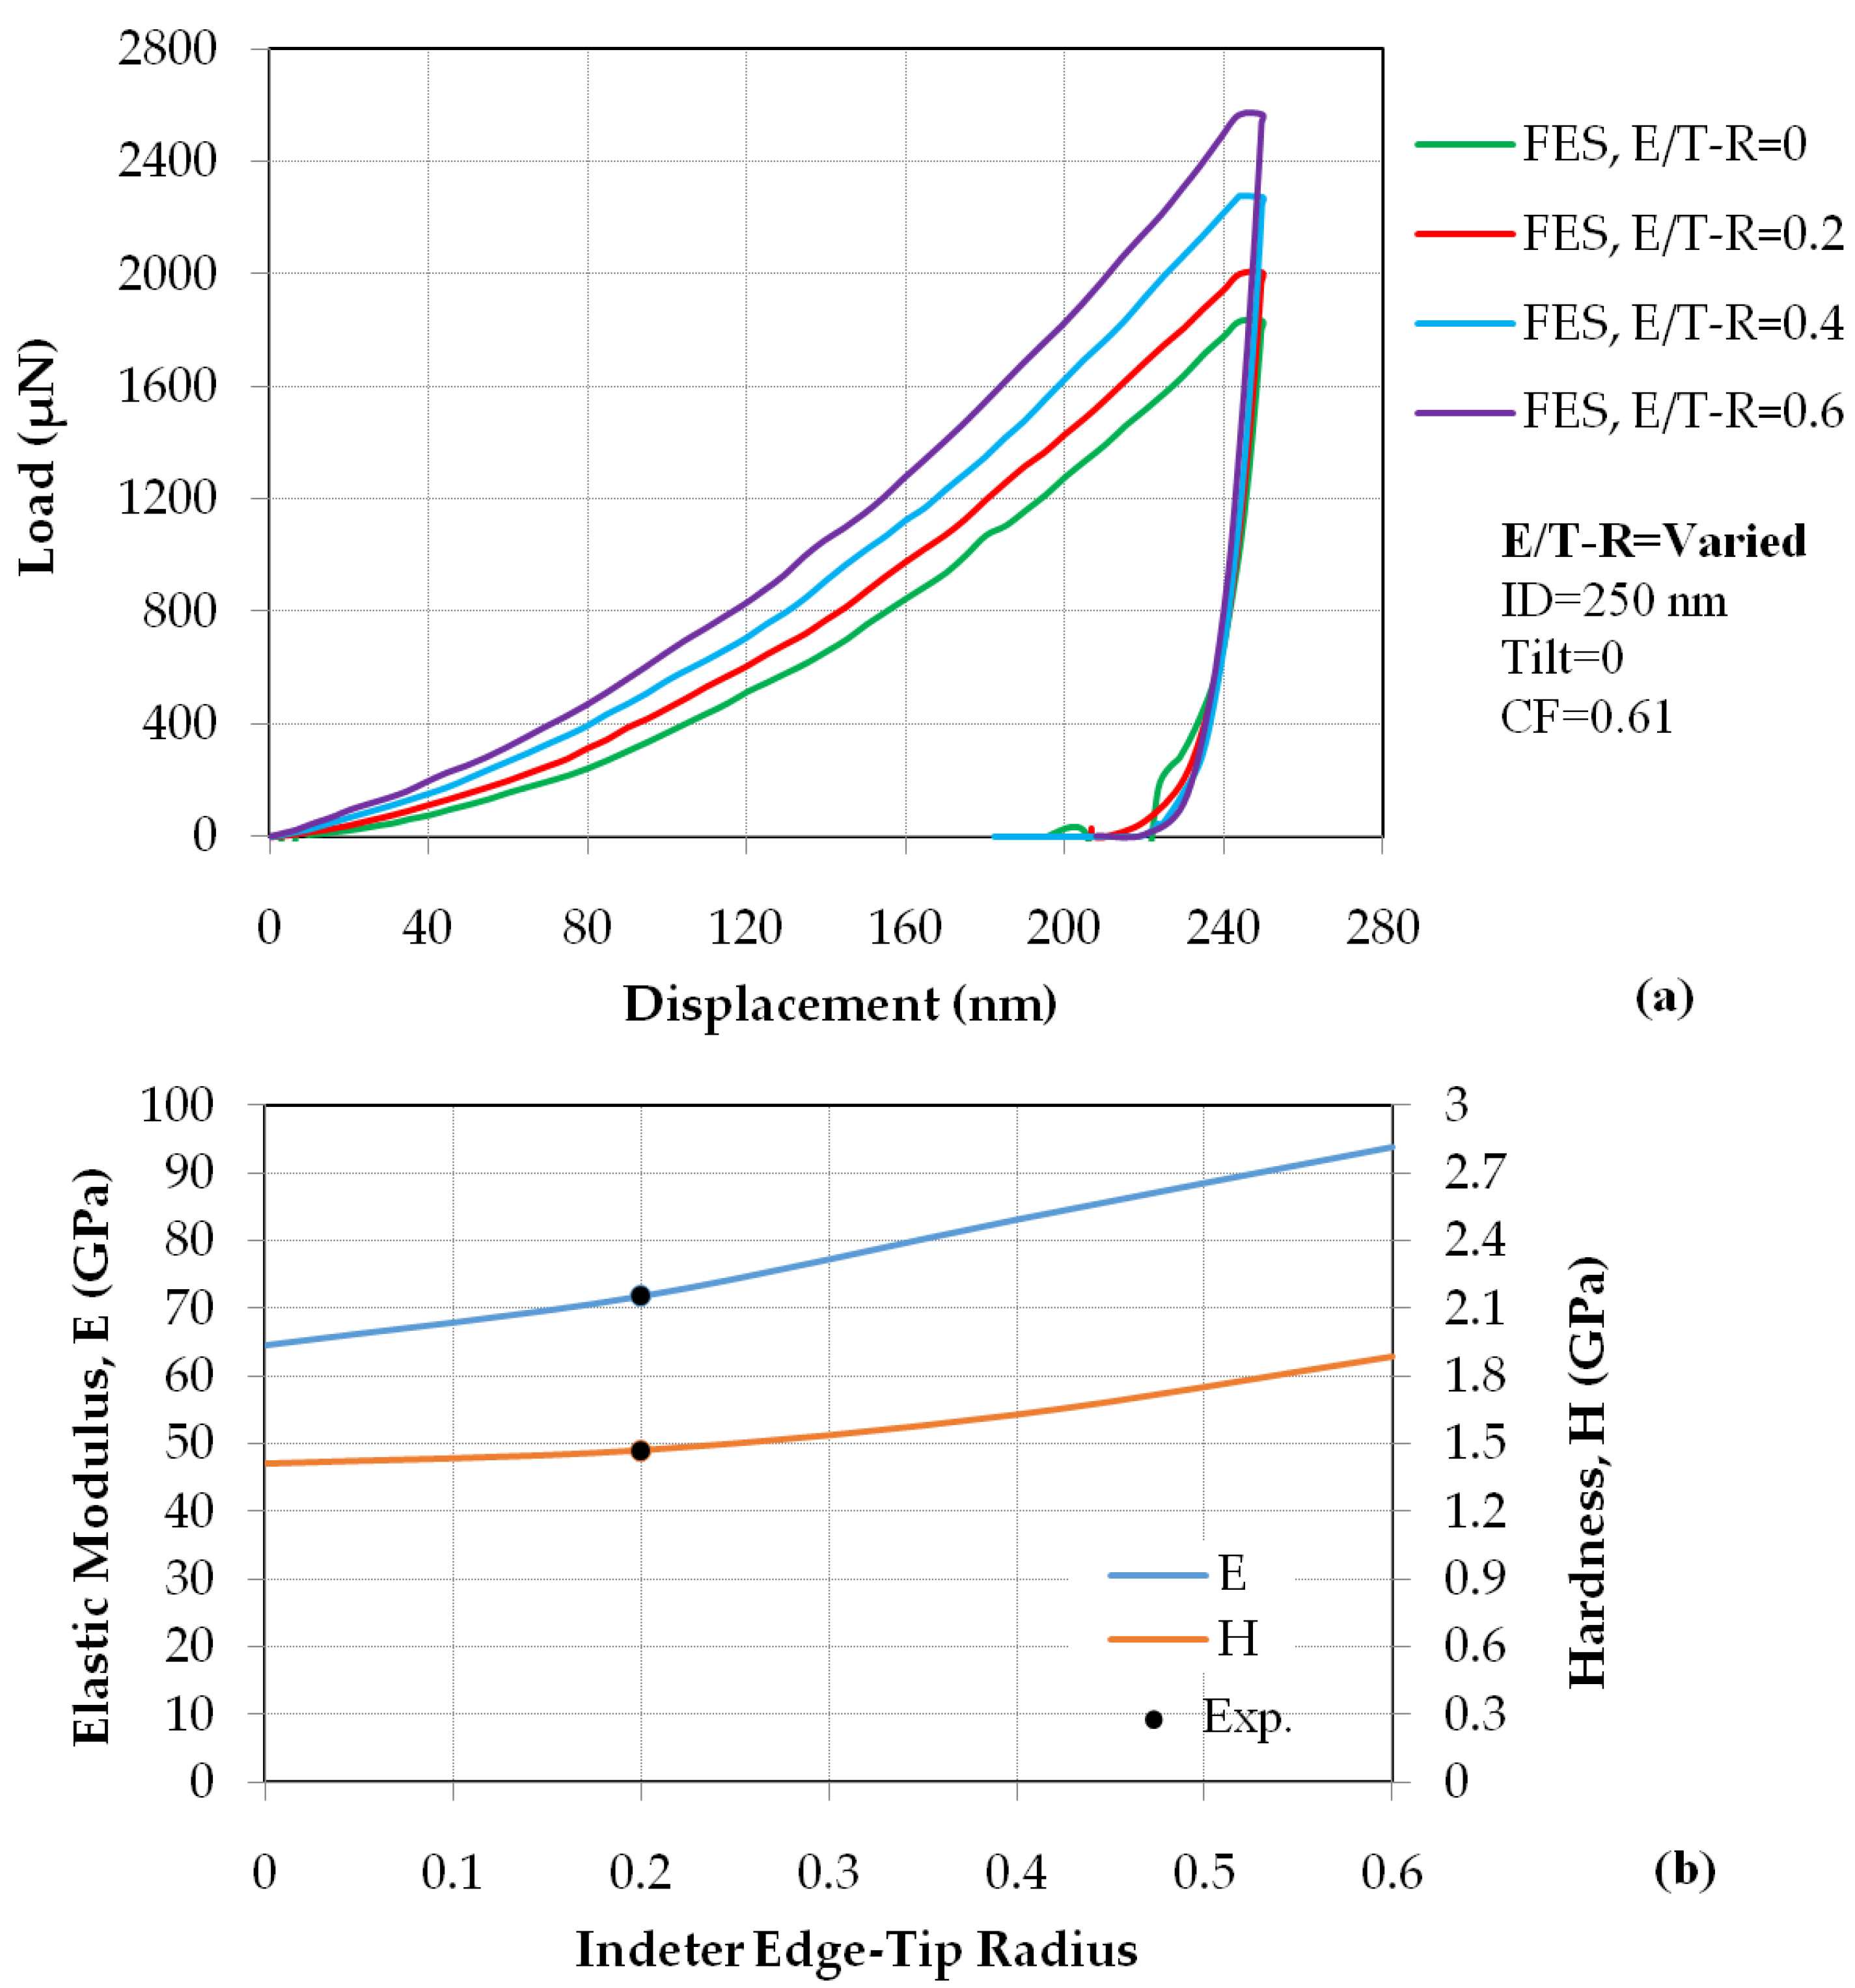
4.2.2. Results of the FE Model with Different Indenter Edge-Tip Radii

In the validated FE model, the indenter edge and tip were modeled with different radii of 0, 0.2, 0.4 and 0.6 μm to capture the effect of the indenter edge-tip radius on the load–displacement response as well as the variation in the extracted elastic modulus and hardness. The results of nanoindentation with different edge and tip radii indicated a considerable amount in variation of load–displacement response of the material, which was higher for indenters with a larger edge-tip radius, as shown in Figure 10a. The maximum predicted load using the indenter with the 0.6 μm radius, which was equal to 2568 μN, was 24% higher than the value shown in the experimental data. On the other hand, the elastic modulus and hardness values increased almost linearly with respect to the growth of indenter edge-tip radius, as shown in Figure 10b. The average elastic modulus and hardness values were extracted 78.34 ± 14.58 and 1.6 ± 0.24 GPa, respectively.
Since, in the nanoindentation experiment, the elastic modulus is calculated based on the elastic contact theory, larger indenter edge-tip radius (refer to Figure 4a) cause stiffer contact and higher elastic modulus. On the other hand, plastic deformation of the specimen beneath the indenter, wherein the blunt indenter tip is used, is smaller than that in the sharp tip. Therefore, the hardness value, which indicates the resistance of material against permanent/plastic deformation, increases for nanoindentation tests using larger edge-tip radii. These results mean that the elastic modulus and hardness values of the specimen depend on the size of the indenter edge-tip, which is not reasonable. Therefore, it is recommended that some corrections are made in the available nanoindentation formulation to eliminate the dependency of the elastic modulus and hardness values on the size of indenter’s edge-tip.

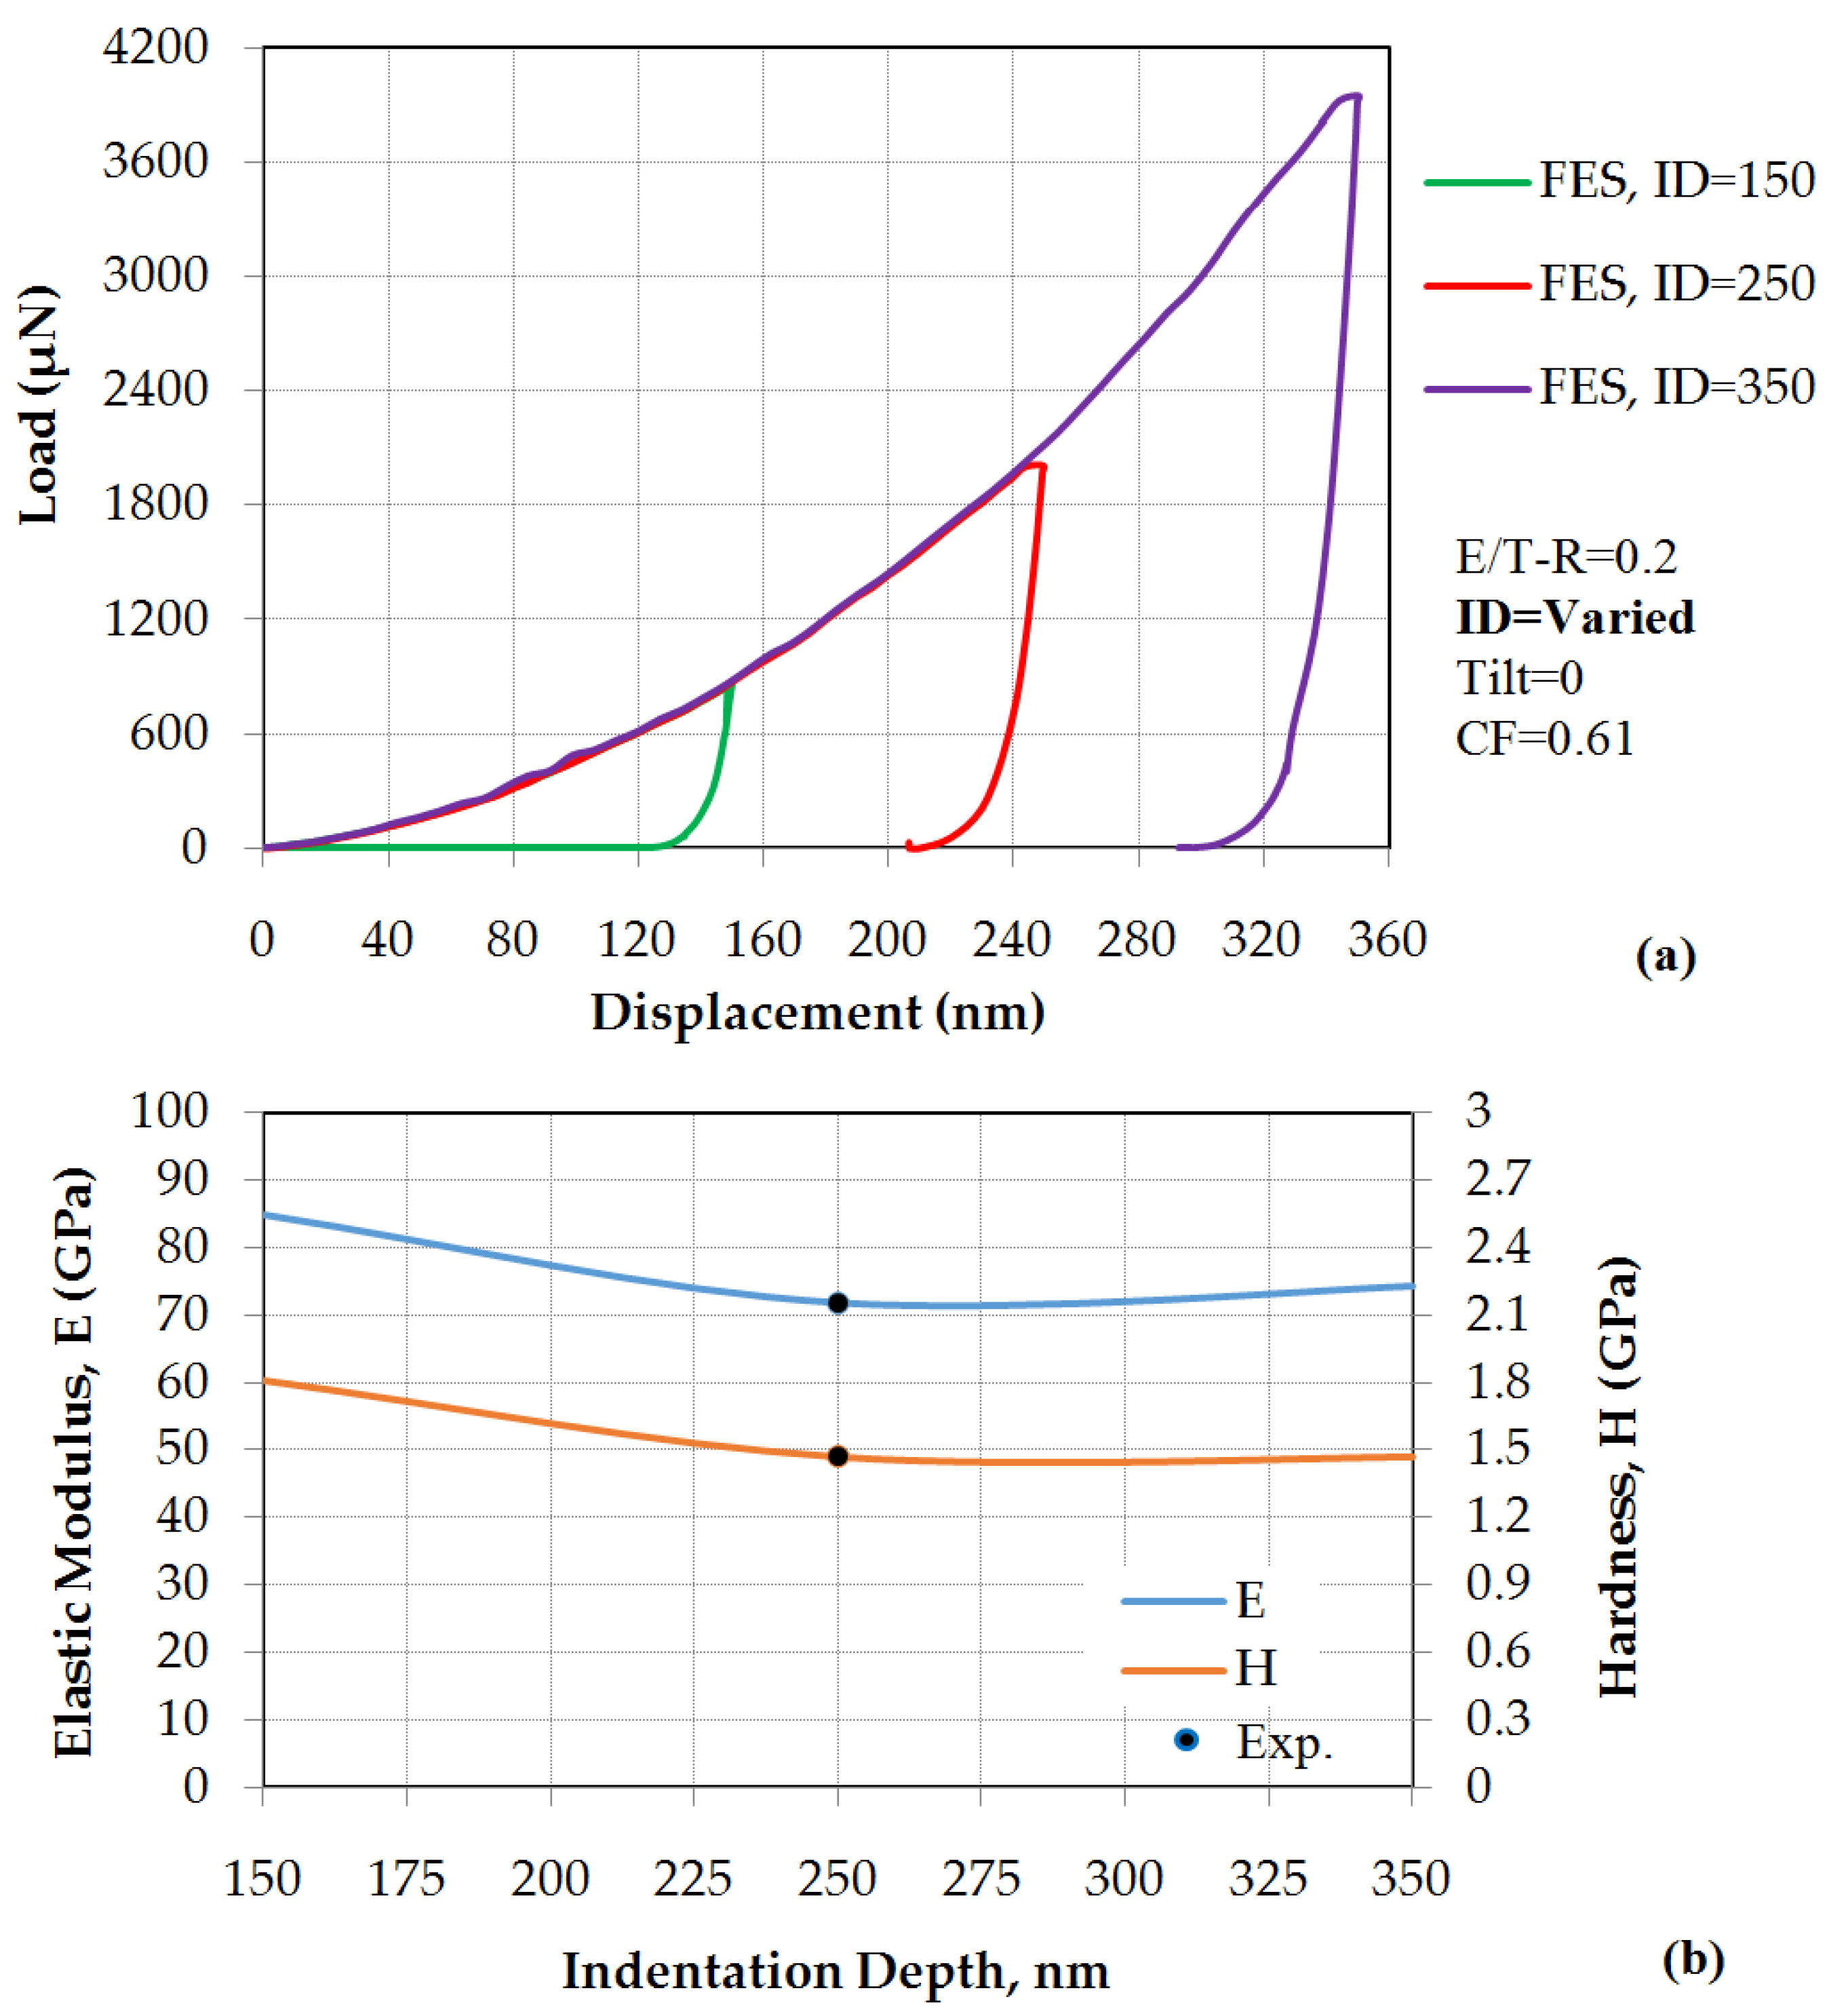
4.2.3. Results of the FE Model with Different Indentation Depths

The validated FE model was run for two additional indentation depths of 150 and 350 nm, in order to probe the variation in the load–displacement curve, elastic modulus and hardness value, in which the results are shown in Figure 11. Higher reaction forces were measured for larger penetration depths (Figure 11a) of aluminum nanoindentation, which indicates that a bigger zone of material has undergone the plastic deformation. The elastic modulus and hardness values (Figure 11b) were slightly bigger for the indentation depth of 150 nm, which is due to a smaller indentation hole and significantly less amount of permanent deformation of the material beneath the indenter. As demonstrated in Figure 11b, the values of the elastic modulus and hardness obtained from the indentation depths larger than 250 nm were relatively constant, which confirms the results of previous studies [52,53]. The average values for the elastic modulus and hardness were 77.03 ± 6.54 and 1.58 ± 0.17 GPa, respectively.

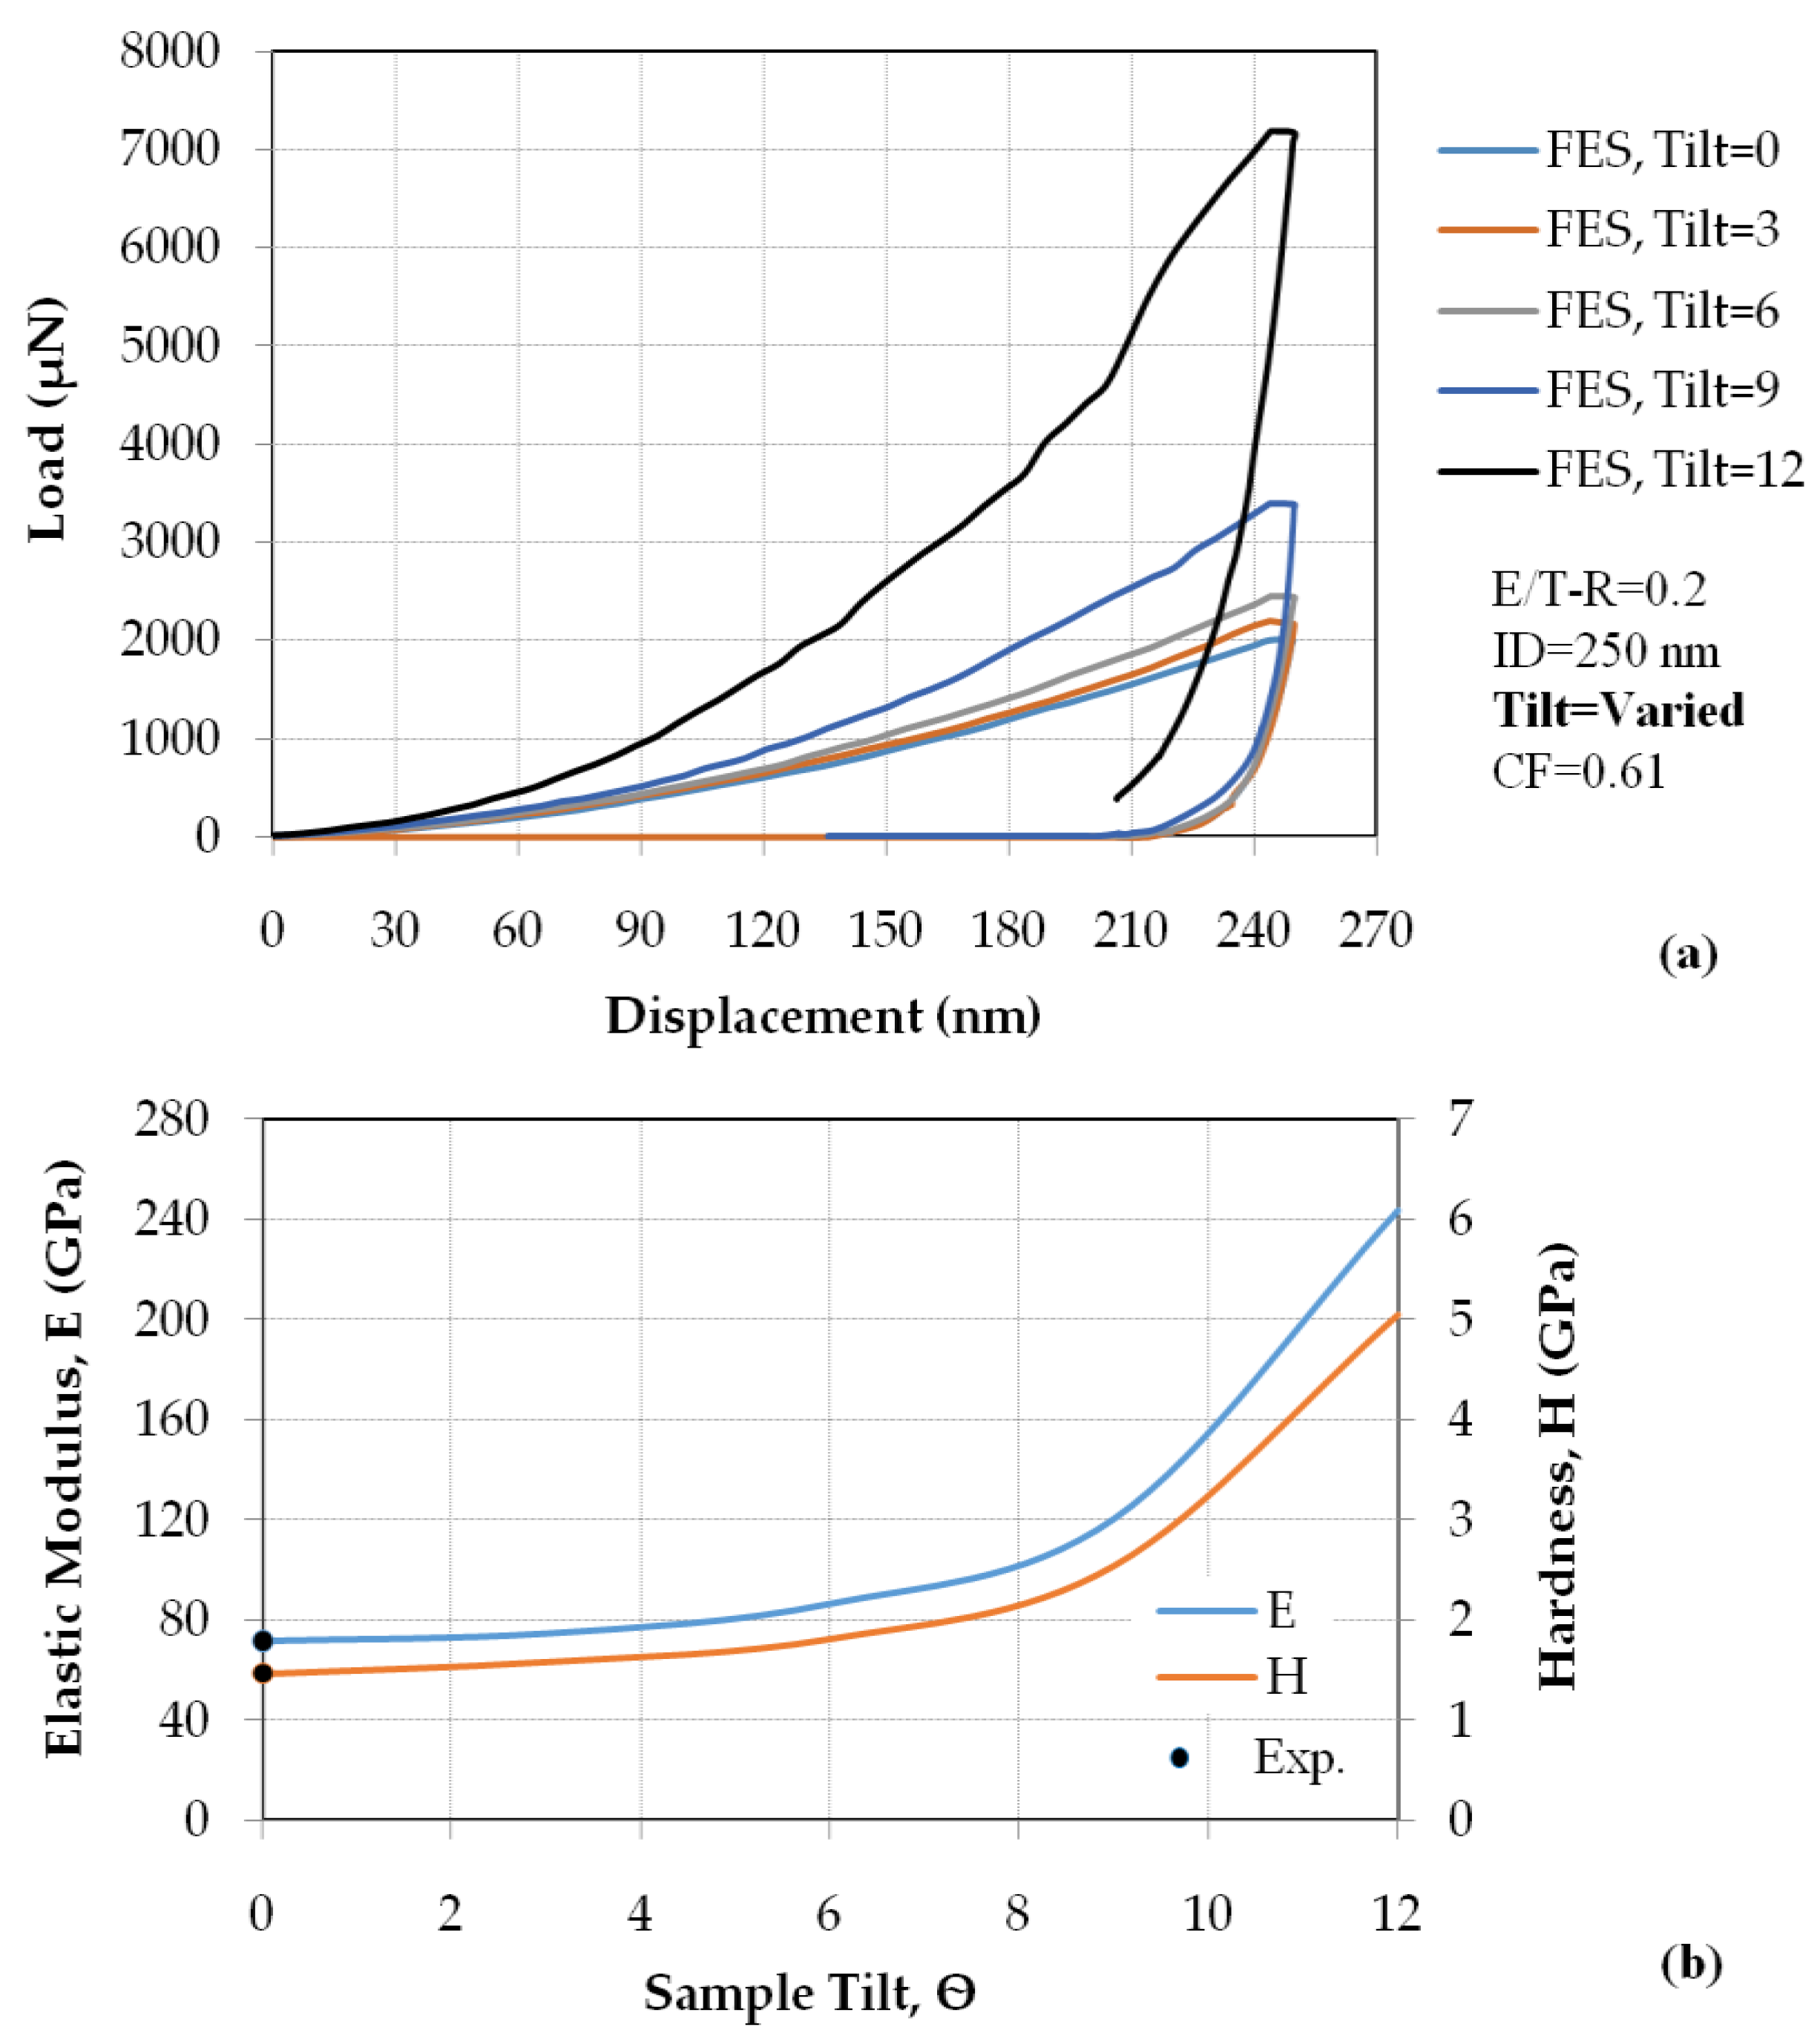
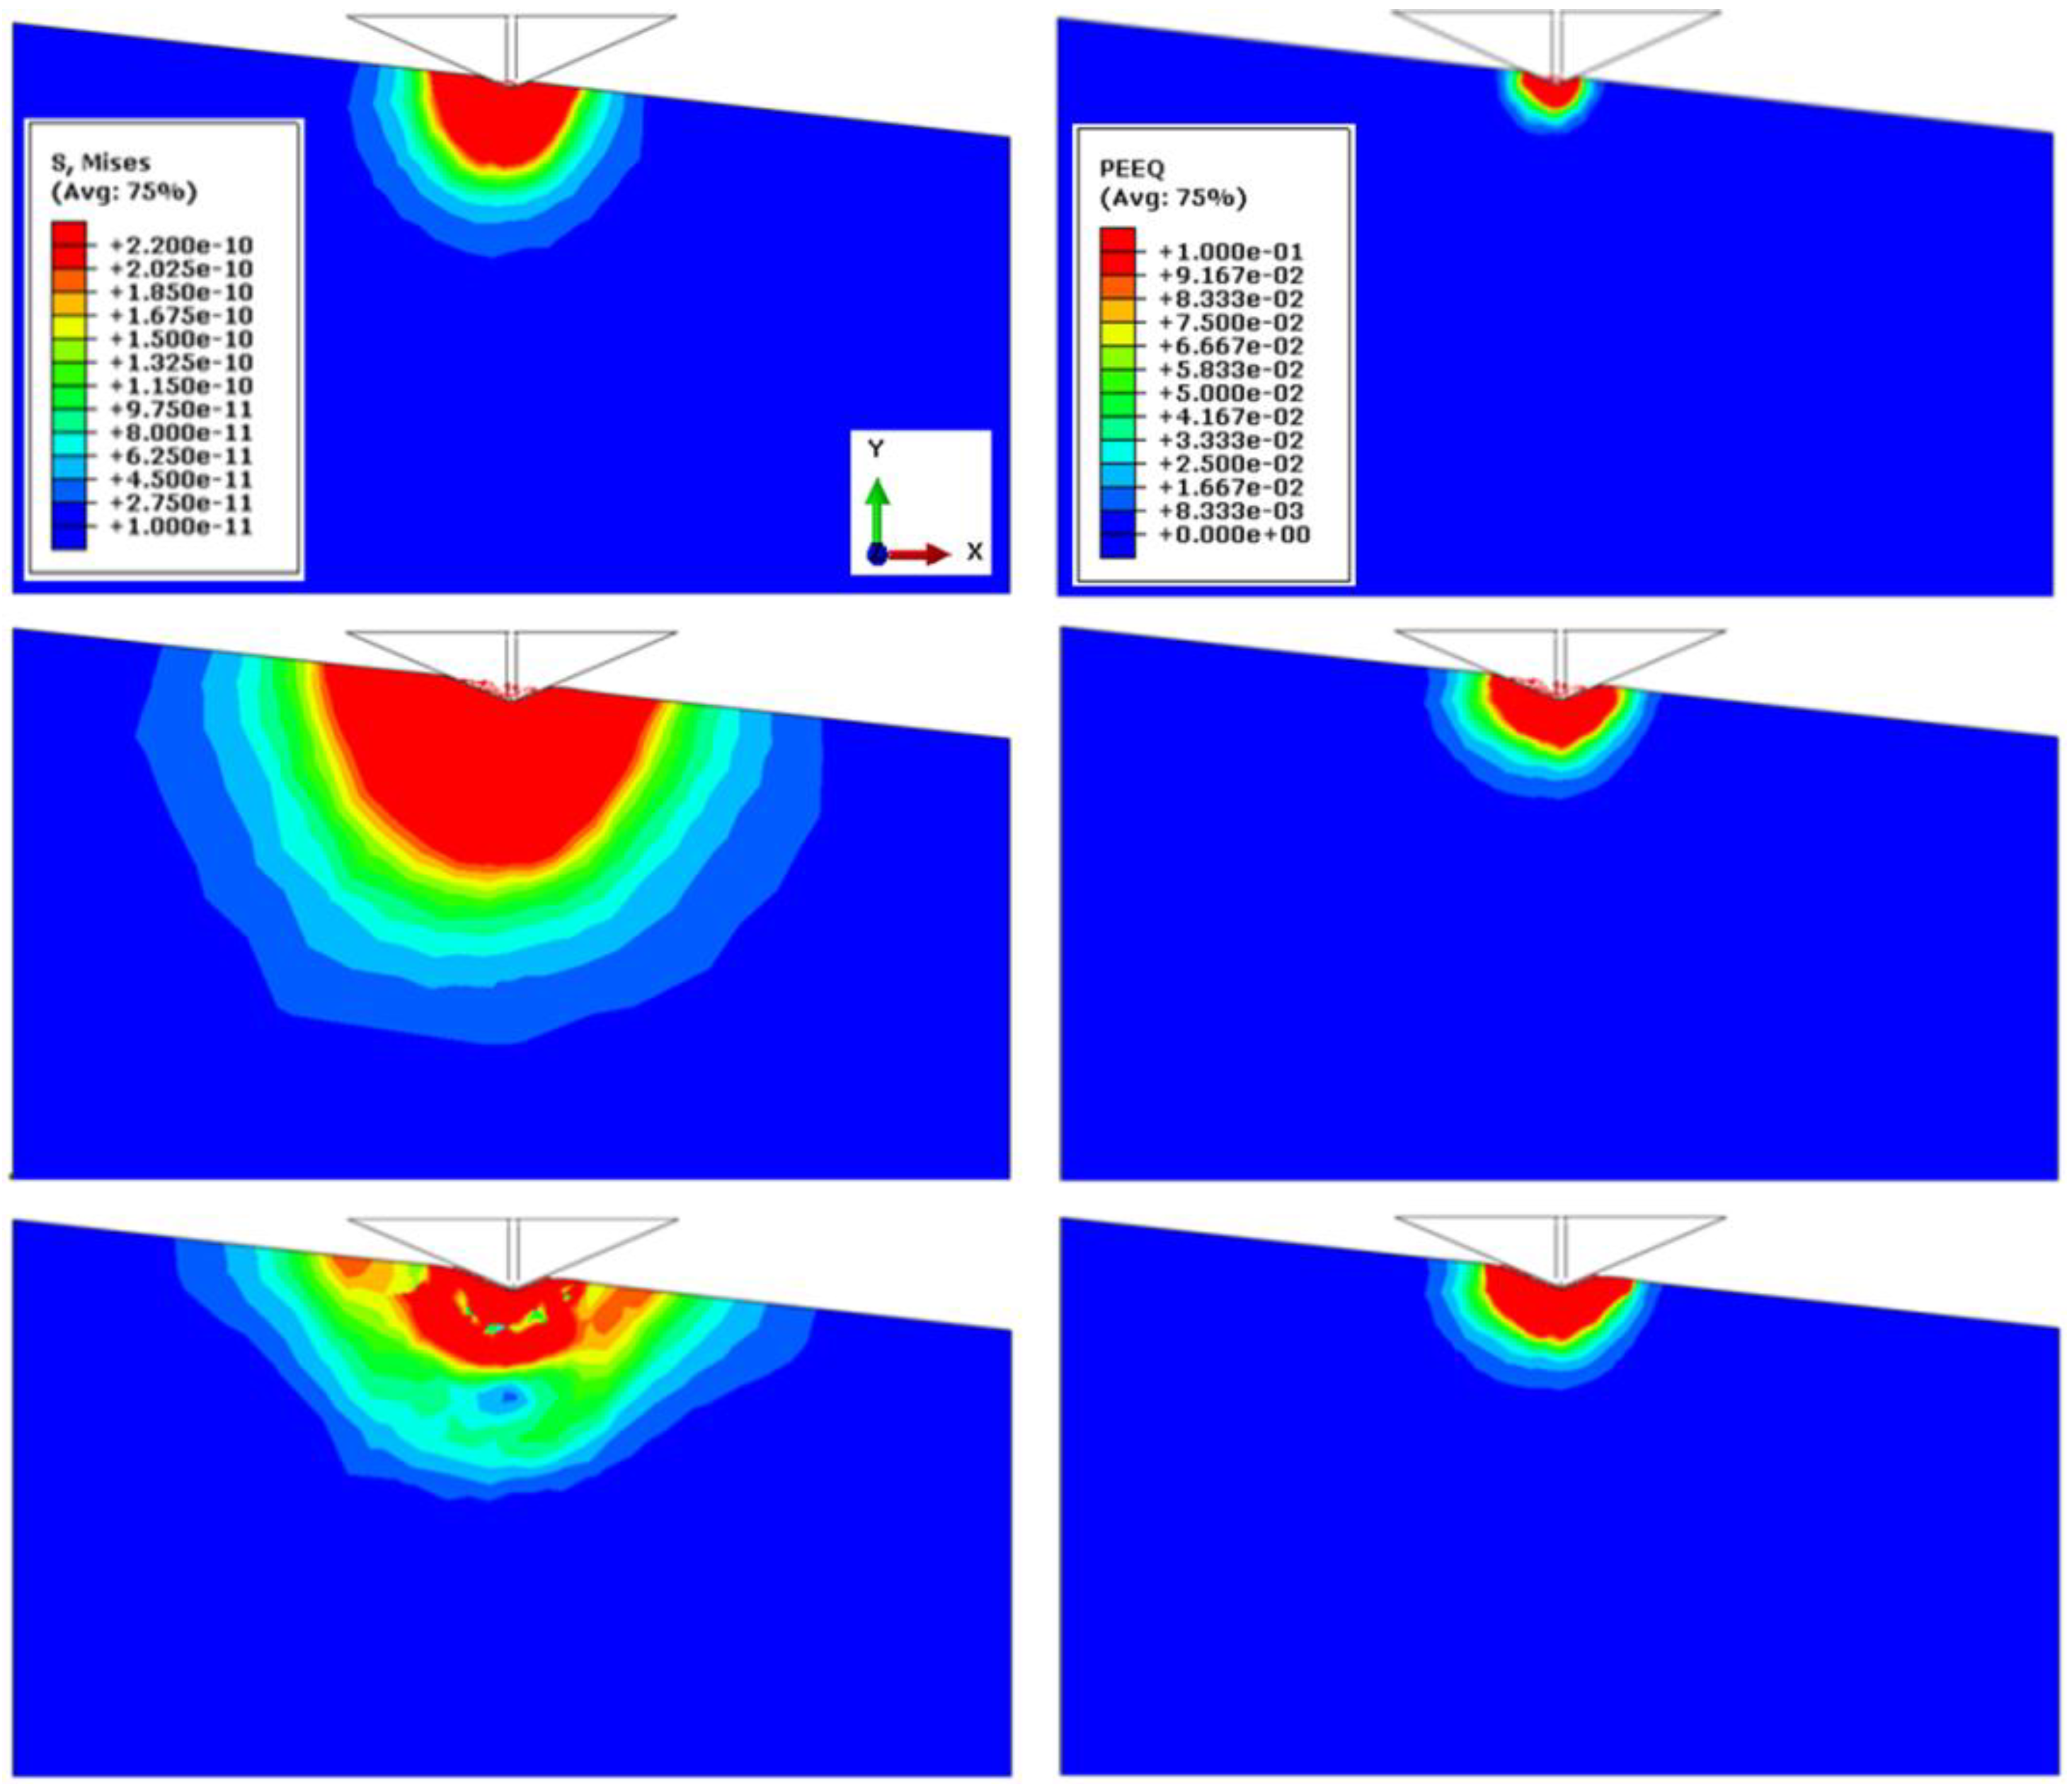
4.2.4. Results of the FE Model with Different Sample Tilts

The sample tilt indicates the orientation of the indentation plane and appears in most specimens, which is a common problem in nanoindentation experiment. In this respect, the validated FE model is modified by creating an aluminum block with different surface tilts of 0°, 3°, 6°, 9° and 12°. The load–displacement responses of the aluminum with different tilts are predicted to be higher for samples with larger tilts, as shown in Figure 12a. The structural response measured excessively high in exponential form for sample tilts larger than 6°. The results of the variation in elastic modulus and hardness indicated the same trend, as shown in Figure 12b. Such a high rate of variation in the structural response as well as the mechanical properties in samples with bigger tilts ( θ > 6 ° ) reflect by the larger contact area between the sample and indenter, which causes a larger zone of material undergoing plastic deformation.
The stress resultant of indentation deformation on the aluminum block with a tilt of 6° is shown using the contour plot of von Mises stress in Figure 13 (top). Similar to the stress contour plot of the flat aluminum (Figure 9), the same indentation depths were selected to show the results in comparative form. The plastic behavior of the aluminum is shown using the contour of equivalent plastic strain in Figure 13 (bottom). Similar mechanical behavior, but larger in terms of the elastic–plastic zone was predicted in the tilted aluminum sample in comparison with the case of flat surface (Figure 9). Such a large zone of deformation is the result of a much bigger contact area between the indenter and the material, as depicted in Figure 4. Subsequently, larger load–displacement response and mechanical properties were obtained from the tilted sample.

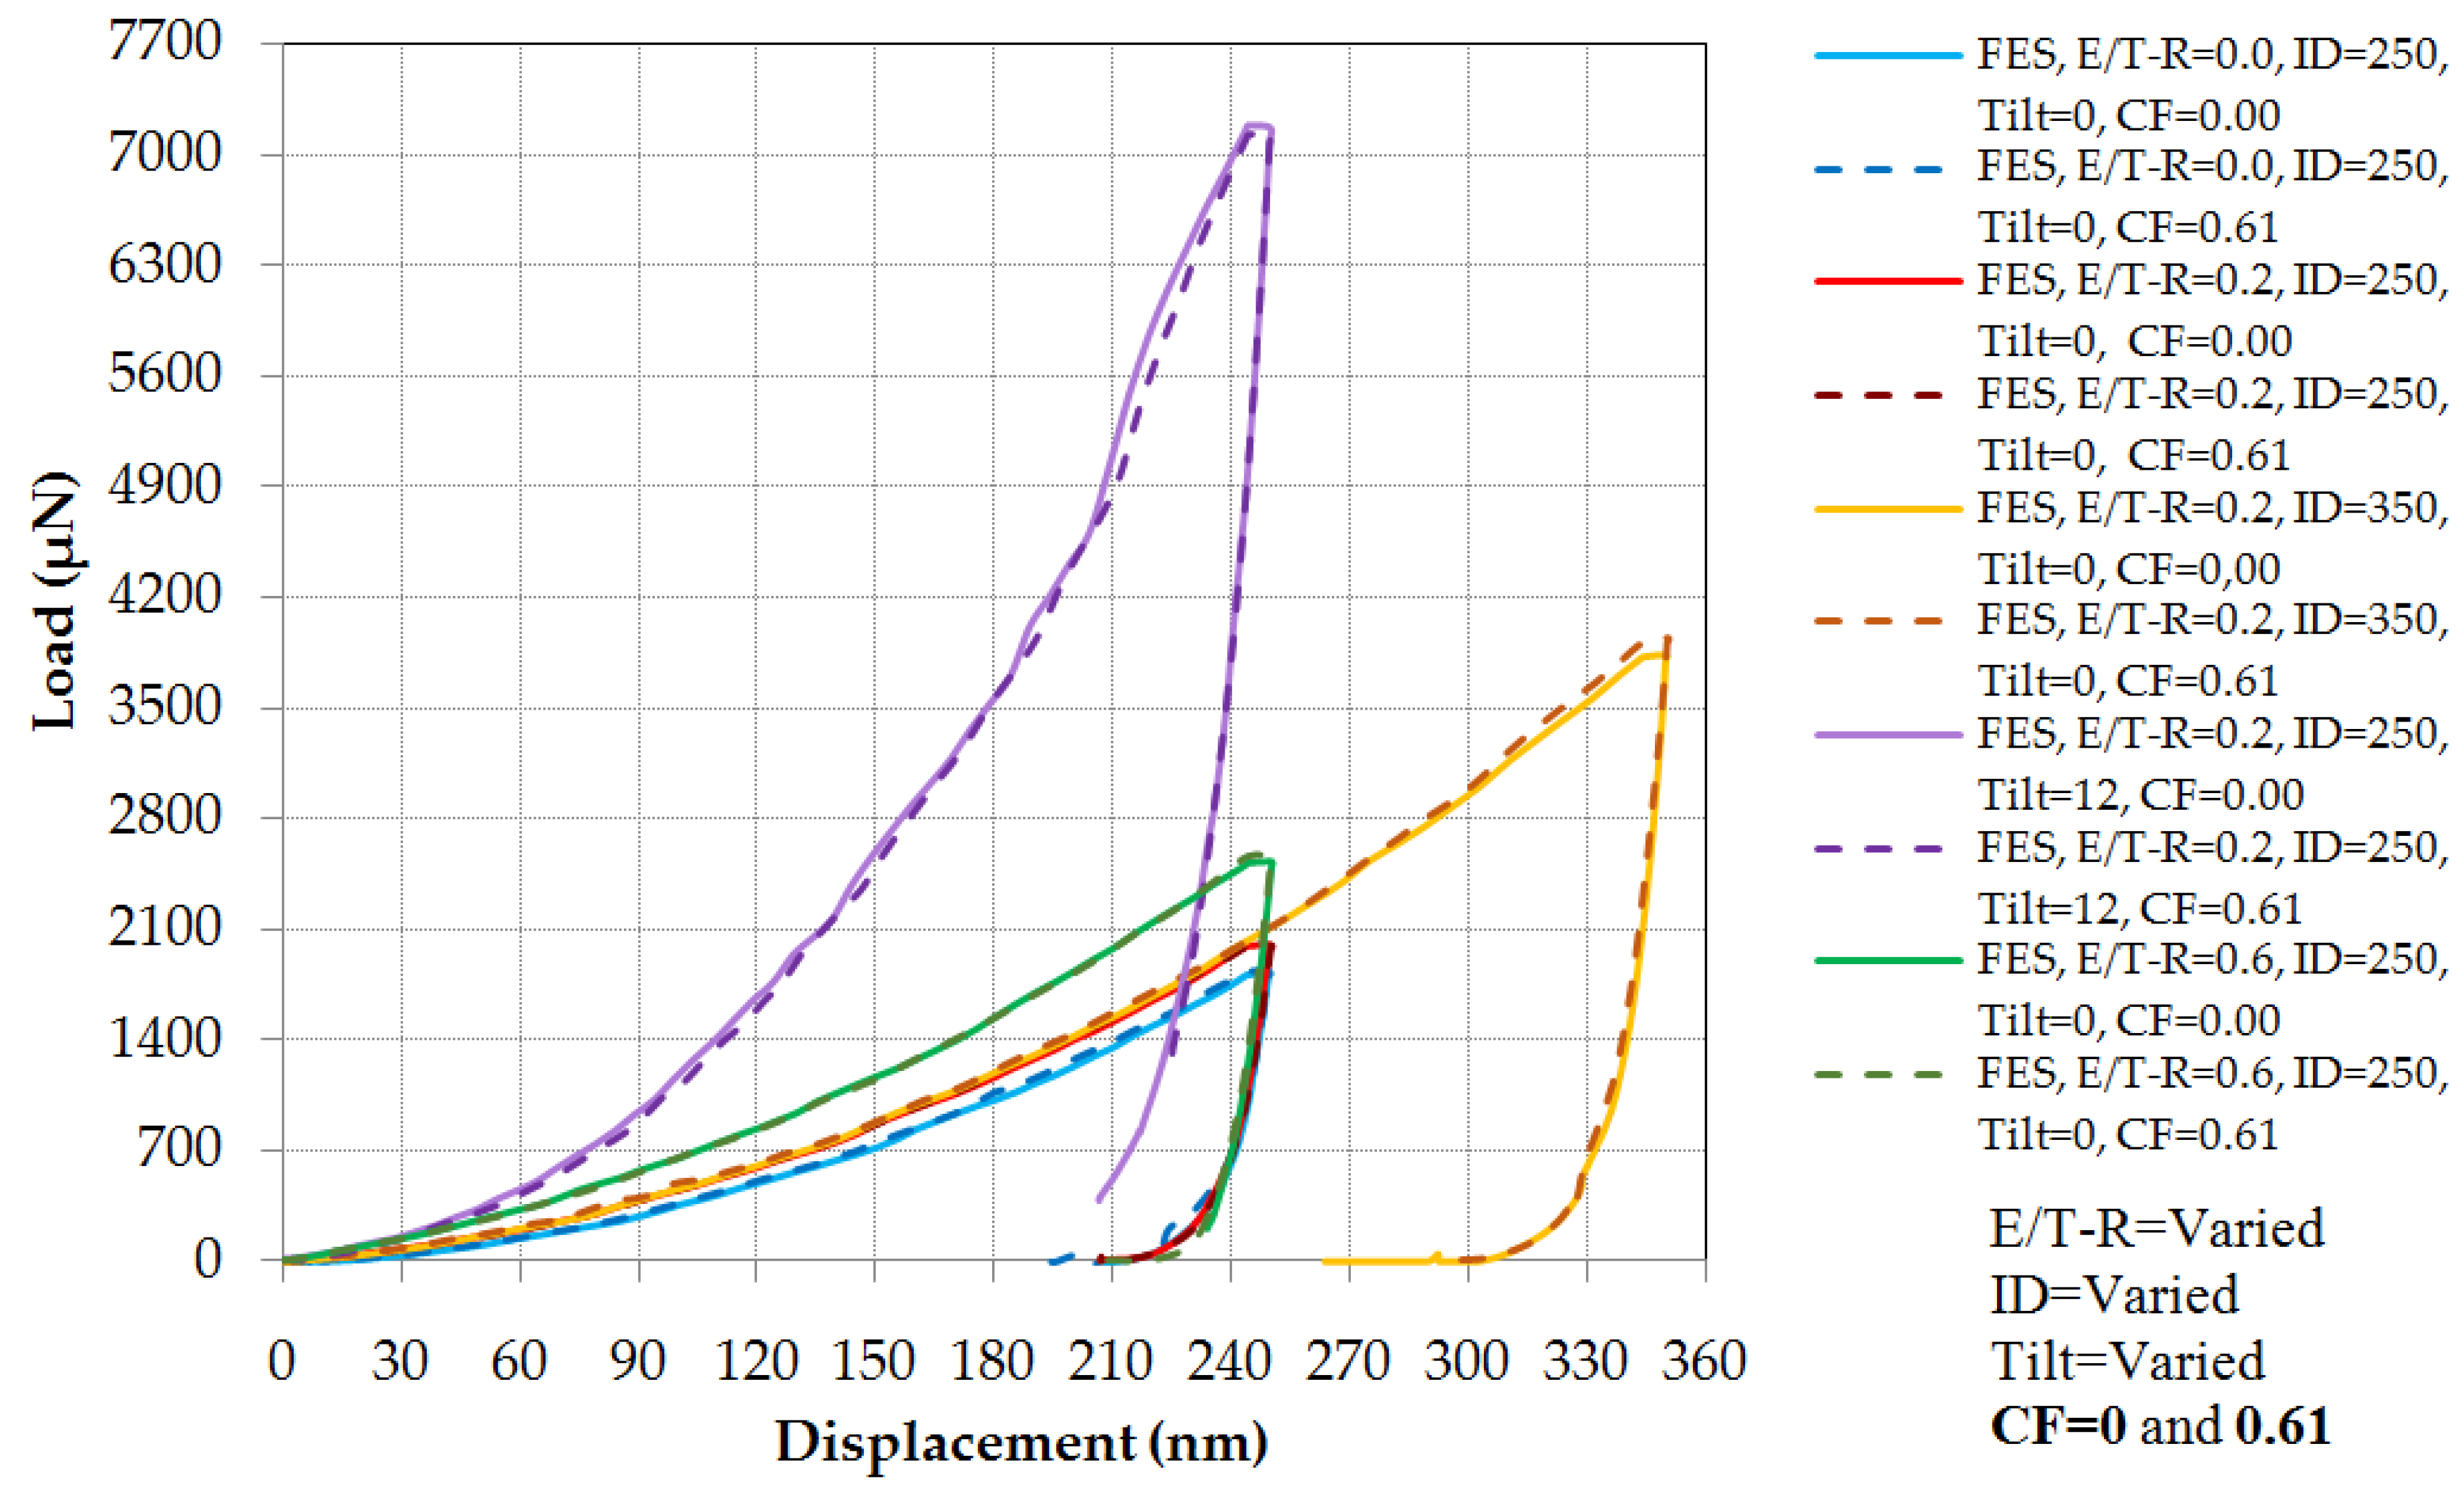
4.2.5. Results of the FE Model with Different Frictions between Sample and Indenter

The previous FE model cases were simulated based on the validated model with 0.6 friction coefficient (FC). In this section, further investigation is performed regarding the result of the indentation in a frictionless condition (FC = 0). In this respect, the frictionless condition is applied in the reference FE model that represents the experiment, as well as the FE models that shown critical effects on the nanoindentation test results, including models with sharp and blunt indenters ( R = 0 ,   0.6 μm), large indentation depths of 350 nm, and aluminum with a 12° sample tilt. The load/unload-displacement responses of the FE models are plotted in Figure 14. The FE results indicated no effects in the prediction of structural responses, as well as mechanical properties in all cases of nanoindentation on the aluminum sample. This result confirms the previous finding on the effect of friction between the indenter and the specimen in the nanoindentation experiment of metals [11,66].

5. Conclusions

In this study, the effects of different sample and indenter configurations were investigated for nanoindentation experiment of FCC single crystal ductile materials. Two different experiments, including nanoindentation and uniaxial tensile tests were conducted on aluminum 1100 as a common ductile material. The average results of both tests predicted almost similar mechanical properties for the aluminum sample. A 3D FE model was developed and validated for simulation of the nanoindentation experiment. Close comparison of the load/unload-displacement response of the sample along with a similar prediction of the mechanical properties, were considered as the validation step of the FE model and simulation process. Then, the validated FE model was used in a systematic method to investigate the effects of different configurations, including indenters with different edge-tip radii of 0, 0.2, 0.4 and 0.6 μm, different indentation depths of 150, 250 and 350 nm, various sample tilts of 0°, 3°, 6°, 9° 12°, and two friction coefficients of 0.0 and 0.6 between the indenter and the sample. The results indicated that:
  • The average elastic modulus and hardness values of aluminum for different ranges of indenter edge-tip radii were 78.34 ± 14.58 and 1.6 ± 0.24 GPa, respectively. The results indicated the size dependency of indenter edge-tip radius in structural response through nanoindentation process, and subsequently, in the calculation of the mechanical properties.
  • Average values of 77.03 ± 6.54 and 1.58 ± 0.17 GPa were calculated for the elastic modulus and hardness of aluminum under different indentation depths, respectively. The values of these parameters were slightly higher for low depth indentation, due to the small size of the indentation hole and permanent deformation.
  • The uneven surface morphology in the form of an oriented local indentation plane, indicated an exponential increase in the extracted values of the elastic modulus and hardness, ranging from 71.83 and 1.47 GPa (for the reference case, θ = 0) to 243.39 and 5.05 GPa at θ = 12°. The results of nanoindentation on the samples with θ 6 ° , could not be used to obtain the mechanical properties of ductile materials.
  • The effect of friction and frictionless condition in the simulation of the nanoindentation experiment of ductile materials was negligible. Therefore, similar structural responses as well as mechanical properties were obtained for both conditions.

Author Contributions

Seyed Saeid proposed the research topic, performed the simulation and analysis of the data and contributed to writing the paper; Atefeh performed the nanoindentation experiment and analysis of the tests data, and contributed to writing the paper; Mohd Nasir and Mohd Hamdi provided the platform of the research and contributed in the technical discussion as well as the writing of the paper.

Acknowledgments

This work is funded by the AIRBUS (France), the Aerospace Malaysia Innovation Centre (AMIC) and the Universiti Teknologi Malaysia (UTM) under Project No. AMIC/AM/P02-01 (UTM Grant No. 4C089 and 01M01, respectively). Seyed Saeid Rahimian Koloor is a researcher of UTM under the Post-Doctoral Fellowship Scheme for the project: “Advanced Testing of Laminated Composites for Aerospace Parts and Assemblies”.

Conflicts of Interest

The authors declare no conflict of interest.

References

  1. Campos, R.P.; Cuevas, A.C.; Muñoz, R.A.E. Characterization of Metals and Alloys; Springer International Publishing: Basel, Switzerland, 2016. [Google Scholar]
  2. Tiwari, A.; Natarajan, S. Applied Nanoindentation in Advanced Materials; Wiley: Hoboken, NJ, USA, 2017. [Google Scholar]
  3. Balokhonov, R.; Romanova, V.; Panin, A.; Martynov, S.; Kazachenok, M. Numerical study of stress-strain localization in the titanium surface modified by an electron beam treatment. Facta Univ. Ser. Mech. Eng. 2016, 14, 329–334. [Google Scholar] [CrossRef]
  4. Smith, B.H.; Szyniszewski, S.; Hajjar, J.F.; Schafer, B.W.; Arwade, S.R. Characterization of steel foams for structural components. Metals 2012, 2, 399–410. [Google Scholar] [CrossRef]
  5. Ramazani, A.; Mukherjee, K.; Abdurakhmanov, A.; Abbasi, M.; Prahl, U. Characterization of microstructure and mechanical properties of resistance spot welded dp600 steel. Metals 2015, 5, 1704–1716. [Google Scholar] [CrossRef] [Green Version]
  6. Wan, L.; Huang, Y. Microstructure and mechanical properties of al/steel friction stir lap weld. Metals 2017, 7, 542. [Google Scholar] [CrossRef]
  7. Papangelo, A. Adhesion between a power-law indenter and a thin layer coated on a rigid substrate. Facta Univ. Ser. Mech. Eng. 2018, 16, 19–28. [Google Scholar] [CrossRef]
  8. Alao, A.-R.; Yin, L. Nanoindentation characterization of the elasticity, plasticity and machinability of zirconia. Mater. Sci. Eng. A 2015, 628, 181–187. [Google Scholar] [CrossRef]
  9. Mesbah, M.; Fadaeifard, F.; Karimzadeh, A.; Nasiri-Tabrizi, B.; Rafieerad, A.; Faraji, G.; Bushroa, A.R. Nano-mechanical properties and microstructure of ufg brass tubes processed by parallel tubular channel angular pressing. Met. Mater. Int. 2016, 22, 1098–1107. [Google Scholar] [CrossRef]
  10. Sapezanskaia, I.; Roa, J.J.; Fargas, G.; Turon-Viñas, M.; Trifonov, T.; Kouitat Njiwa, R.; Redjaïmia, A.; Mateo, A. Deformation mechanisms induced by nanoindentation tests on a metastable austenitic stainless steel: A fib/sim investigation. Mater. Charact. 2017, 131, 253–260. [Google Scholar] [CrossRef]
  11. Ayatollahi, M.R.; Karimzadeh, A. Nano-indentation measurement of fracture toughness of dental enamel. Int. J. Fract. 2013, 183, 113–118. [Google Scholar] [CrossRef]
  12. Jin, T.; Niu, X.; Xiao, G.; Wang, Z.; Zhou, Z.; Yuan, G.; Shu, X. Effects of experimental variables on pmma nano-indentation measurements. Polym. Test. 2015, 41, 1–6. [Google Scholar] [CrossRef]
  13. Karimzadeh, A.; Ayatollahi, M.R. Investigation of mechanical and tribological properties of bone cement by nano-indentation and nano-scratch experiments. Polym. Test. 2012, 31, 828–833. [Google Scholar] [CrossRef]
  14. Wang, H.; Huang, Z.; Lu, Z.; Wang, Q.; Jiang, J. Determination of the elastic and plastic deformation behaviors of Yb:Y3Al5O12 transparent ceramic by nanoindentation. J. Alloy. Compd. 2016, 682, 35–41. [Google Scholar] [CrossRef]
  15. Randall, N.X.; Vandamme, M.; Ulm, F.-J. Nanoindentation analysis as a two-dimensional tool for mapping the mechanical properties of complex surfaces. J. Mater. Res. 2011, 24, 679–690. [Google Scholar] [CrossRef]
  16. Zhang, H.; Schuster, B.E.; Wei, Q.; Ramesh, K.T. The design of accurate micro-compression experiments. Scr. Mater. 2006, 54, 181–186. [Google Scholar] [CrossRef] [Green Version]
  17. Nix, W.D. Mechanical properties of thin films. Metall. Trans. A 1989. [Google Scholar] [CrossRef]
  18. Oliver, W.C. Alternative technique for analyzing instrumented indentation data. J. Mater. Res. 2001, 16, 3202–3206. [Google Scholar] [CrossRef]
  19. Pharr, G.M. Measurement of mechanical properties by ultra-low load indentation. Mater. Sci. Eng. 1998, A253, 151–159. [Google Scholar] [CrossRef]
  20. Pharr, G.M.; Bolshakov, A. Understanding nanoindentation unloading curves. J. Mater. Res. 2002, 17, 2660–2671. [Google Scholar] [CrossRef]
  21. Gadelrab, K.R.; Chiesa, M. Influence of nanoindenter tip radius on the estimation of the elastic modulus. MRS Proc. 2011, 1297, 3–47. [Google Scholar] [CrossRef]
  22. Sagadevan, S.; Murugasen, P. Novel analysis on the influence of tip radius and shape of the nanoindenter on the hardness of materials. Procedia Mater. Sci. 2014, 6, 1871–1878. [Google Scholar] [CrossRef]
  23. Yu, N.; Polycarpou, A.A.; Conry, T.F. Tip-radius effect in finite element modeling of sub-50 nm shallow nanoindentation. Thin Solid Films 2004, 450, 295–303. [Google Scholar] [CrossRef]
  24. Alisafaei, F.; Han, C.-S. Indentation depth dependent mechanical behavior in polymers. Adv. Condens. Matter Phys. 2015. [Google Scholar] [CrossRef]
  25. Voyiadjis, G.Z.; Yaghoobi, M. Review of nanoindentation size effect: Experiments and atomistic simulation. Crystals 2017, 7, 321. [Google Scholar] [CrossRef]
  26. Kashani, M.S.; Madhavan, V. Analysis and correction of the effect of sample tilt on results of nanoindentation. Acta Mater. 2011, 59, 883–895. [Google Scholar] [CrossRef]
  27. Laurent-Brocq, M.; Béjanin, E.; Champion, Y. Influence of roughness and tilt on nanoindentation measurements: A quantitative model. Scanning 2015, 37, 350–360. [Google Scholar] [CrossRef] [PubMed]
  28. Xu, Z.H.; Li, X. Effect of sample tilt on nanoindentation behaviour of materials. Philosophil. Mag. 2007, 87, 2299–2312. [Google Scholar] [CrossRef]
  29. Karimzadeh, A.; Ayatollahi, M.R.; Alizadeh, M. Finite element simulation of nano-indentation experiment on aluminum 1100. Comput. Mater. Sci. 2014, 81, 595–600. [Google Scholar] [CrossRef]
  30. Chen, X.; Ashcroft, I.A.; Wildman, R.D.; Tuck, C.J. A combined inverse finite element—Elastoplastic modelling method to simulate the size-effect in nanoindentation and characterise materials from the nano to micro-scale. Int. J. Solids Struct. 2017, 104–105, 25–34. [Google Scholar] [CrossRef]
  31. Xia, Y.; Bigerelle, M.; Bouvier, S.; Iost, A.; Mazeran, P.E. Quantitative approach to determine the mechanical properties by nanoindentation test: Application on sandblasted materials. Tribol. Int. 2015, 82, 297–304. [Google Scholar] [CrossRef] [Green Version]
  32. Haghshenas, M.; Khalili, A.; Ranganathan, N. On room-temperature nanoindentation response of an Al–Li–Cu alloy. Mater. Sci. Eng. A 2016, 676, 20–27. [Google Scholar] [CrossRef]
  33. Stegall, D.E. An Examination of the Indentation Size Effect in Fcc Metals and Alloys from a Kinetics Based Perspective Using Nanoindentation. Ph.D. Thesis, Old Dominion University, Norfolk, VA, USA, 2016. [Google Scholar]
  34. Pharr, G.M.; Herbert, E.G.; Gao, Y. The indentation size effect: A critical examination of experimental observations and mechanistic interpretations. Annu. Rev. Mater. Res. 2010, 40, 271–292. [Google Scholar] [CrossRef]
  35. Sangwal, K. On the reverse indentation size effect and microhardness measurement of solids. Mater. Chem. Phys. 2000, 63, 145–152. [Google Scholar] [CrossRef]
  36. Zhang, C.; Voyiadjis, G.Z. Rate-dependent size effects and material length scales in nanoindentation near the grain boundary for a bicrystal fcc metal. Mater. Sci. Eng. A 2016, 659, 55–62. [Google Scholar] [CrossRef]
  37. Voyiadjis, G.Z.; Zhang, C. The mechanical behavior during nanoindentation near the grain boundary in a bicrystal fcc metal. Mater. Sci. Eng. A 2015, 621, 218–228. [Google Scholar] [CrossRef]
  38. Aifantis, K.E.; Ngan, A.H.W. Modeling dislocation—grain boundary interactions through gradient plasticity and nanoindentation. Mater. Sci. Eng. A 2007, 459, 251–261. [Google Scholar] [CrossRef]
  39. Lian, J.; Garay, J.E.; Wang, J. Grain size and grain boundary effects on the mechanical behavior of fully stabilized zirconia investigated by nanoindentation. Scr. Mater. 2007, 56, 1095–1098. [Google Scholar] [CrossRef]
  40. Voyiadjis, G.Z.; Faghihi, D.; Zhang, C. Analytical and experimental determination of rate-and temperature-dependent length scales using nanoindentation experiments. J. Nanomech. Micromech. 2011, 1, 24–40. [Google Scholar] [CrossRef]
  41. Casals, O.; Forest, S. Finite element crystal plasticity analysis of spherical indentation in bulk single crystals and coatings. Comput. Mater. Sci. 2009, 45, 774–782. [Google Scholar] [CrossRef]
  42. Almasri, A.H.; Voyiadjis, G.Z. Nano-indentation in fcc metals: Experimental study. Acta Mech. 2010. [Google Scholar] [CrossRef]
  43. Voyiadjis, G.Z.; Peters, R. Size effects in nanoindentation: An experimental and analytical study. Acta Mech. 2010, 211, 131–153. [Google Scholar] [CrossRef]
  44. Liu, M.; Lu, C.; Tieu, K.A.; Peng, C.-T.; Kong, C. A combined experimental-numerical approach for determining mechanical properties of aluminum subjects to nanoindentation. Sci. Rep. 2015, 5, 15072. [Google Scholar] [CrossRef] [PubMed] [Green Version]
  45. Ehtemam-Haghighi, S.; Cao, G.; Zhang, L.-C. Nanoindentation study of mechanical properties of Ti based alloys with fe and ta additions. J. Alloy. Compd. 2017, 692, 892–897. [Google Scholar] [CrossRef]
  46. Attar, H.; Ehtemam-Haghighi, S.; Kent, D.; Okulov, I.V.; Wendrock, H.; Bӧnisch, M.; Volegov, A.S.; Calin, M.; Eckert, J.; Dargusch, M.S. Nanoindentation and wear properties of Ti and Ti-TiB composite materials produced by selective laser melting. Mater. Sci. Eng. A 2017, 688, 20–26. [Google Scholar] [CrossRef] [Green Version]
  47. Guo, H.; Jiang, C.; Yang, B.; Wang, J. On the fracture toughness of bulk metallic glasses under berkovich nanoindentation. J. Non-Cryst. Solids 2018, 481, 321–328. [Google Scholar] [CrossRef]
  48. Yang, L.W.; Mayer, C.; Li, N.; Baldwin, J.; Mara, N.A.; Chawla, N.; Molina-Aldareguia, J.M.; Llorca, J. Mechanical properties of metal-ceramic nanolaminates: Effect of constraint and temperature. Acta Mater. 2018, 142, 37–48. [Google Scholar] [CrossRef]
  49. Han, J.-K.; Li, X.; Dippenaar, R.; Liss, K.-D.; Kawasaki, M. Microscopic plastic response in a bulk nano-structured tial intermetallic compound processed by high-pressure torsion. Mater. Sci. Eng. A 2018, 714, 84–92. [Google Scholar] [CrossRef]
  50. Huang, C.; Peng, X.; Yang, B.; Xiang, H.; Sun, S.; Chen, X.; Li, Q.; Yin, D.; Fu, T. Anisotropy effects in diamond under nanoindentation. Carbon 2018, 132, 606–615. [Google Scholar] [CrossRef]
  51. Durst, K.; Backes, B.; Göken, M. Indentation size effect in metallic materials: Correcting for the size of the plastic zone. Scr. Mater. 2005, 52, 1093–1097. [Google Scholar] [CrossRef]
  52. Liu, T.; Phang, I.Y.; Shen, L.; Chow, S.Y.; Zhang, W.-D. Morphology and mechanical properties of multiwalled carbon nanotubes reinforced nylon-6 composites. Macromolecules 2004, 37, 7214–7222. [Google Scholar] [CrossRef]
  53. Hu, Y.; Shen, L.; Yang, H.; Wang, M.; Liu, T.; Liang, T.; Zhang, J. Nanoindentation studies on nylon 11/clay nanocomposites. Polym. Test. 2006, 25, 492–497. [Google Scholar] [CrossRef]
  54. Saber-Samandari, S.; Gross, K.A. Effect of angled indentation on mechanical properties. J. Eur. Ceram. Soc. 2009, 29, 2461–2467. [Google Scholar] [CrossRef]
  55. Roa, J.; Rayon, E.; Morales, M.; Segarra, M. Contact mechanics at nanometric scale using nanoindentation technique for brittle and ductile materials. Recent Pat. Nanotechnol. 2012, 6, 142–152. [Google Scholar] [CrossRef] [PubMed]
  56. ISO-14577. Metallic Materials—Instrumented Indentation Test for Hardness and Materials Parameters—Part 1: Test Method; International Organization for Standardization (ISO): Geneva, Switzerland, 2002. [Google Scholar]
  57. Fischer-Cripps, A.C. Nanoindentation, 3rd ed.; Springer: New York, NY, USA, 2011. [Google Scholar]
  58. Sneddon, I.N. The relation between load and penetration in the axisymmetric boussinesq problem for a punch of arbitrary profile. Int. J. Eng. Sci. 1965, 3, 47–57. [Google Scholar] [CrossRef]
  59. Stauss, S.; Schwaller, P.; Bucaille, J.L.; Rabe, R.; Rohr, L.; Michler, J.; Blank, E. Determining the stress–strain behaviour of small devices by nanoindentation in combination with inverse methods. Microelectron. Eng. 2003, 67–68, 818–825. [Google Scholar] [CrossRef]
  60. Oliver, W.C.; Pharr, G.M. Measurement of hardness and elastic modulus by instrumented indentation: Advances in understanding and refinements to methodology. J. Mater. Res. 2004, 19, 3–20. [Google Scholar] [CrossRef] [Green Version]
  61. Li, Y.; Kanouté, P.; François, M. Disturbance induced by surface preparation on instrumented indentation test. Mater. Sci. Eng. A 2015, 642, 381–390. [Google Scholar] [CrossRef]
  62. Zhang, Y.; Dhaigude, M.; Wang, J. The anvil effect in the spherical indentation testing of sheet metals. J. Manuf. Process. 2017, 27, 169–178. [Google Scholar] [CrossRef]
  63. Pelletier, H.; Krier, J.; Cornet, A.; Mille, P. Limits of using bilinear stress–strain curve for finite element modeling of nanoindentation response on bulk materials. Thin Solid Films 2000, 379, 147–155. [Google Scholar] [CrossRef]
  64. Lu, Y.; Kurapati, S.; Yang, F. Finite element analysis of cylindrical indentation for determining plastic properties of materials in small volumes. J. Phys. D Appl. Phys. 2008, 41, 115415. [Google Scholar] [CrossRef]
  65. Vaughan, T.; McCarthy, C. A combined experimental-numerical approach for generating statistically equivalent fibre distributions for high strength laminated composite materials. Compos. Sci. Technol. 2010, 70, 291–297. [Google Scholar] [CrossRef]
  66. Bucaille, J.L.; Stauss, S.; Felder, E.; Michler, J. Determination of plastic properties of metals by instrumented indentation using different sharp indenters. Acta Mater. 2003, 51, 1663–1678. [Google Scholar] [CrossRef]
Figure 1. A sample from the roughness analysis of an AFM image taken from the surface of the aluminum specimen.
Metals 08 00421 g001
Figure 2. Schematic 3D view of the model configuration and mesh pattern of the sample and indenter in the nanoindentation experiment.
Metals 08 00421 g002
Figure 3. The stress–strain curve of the uniaxial tensile test (a), and the average load/unload-displacement curve for the nanoindentation experiment (b) of aluminum 1100.
Metals 08 00421 g003
Figure 4. Schematic view of various indenter edge-tip radii (a), and sample tilts (b) in the nanoindentation experiment.
Metals 08 00421 g004
Figure 5. Load/unload–displacement curves of aluminum 1100 under nanoindentation tests.
Metals 08 00421 g005
Figure 6. A sample of the profile of indentation plane that was used to determine the sample tilt.
Metals 08 00421 g006
Figure 7. Atomic force microscopy (AFM) images of (a) 3D aluminum 1100 indentation surface, (b) 3D view of the nanoindentation mark, and (c) top view of the indentation mark samples from the nanoindentation experiment on aluminum 1100.
Metals 08 00421 g007
Figure 8. Experimental and simulation results of the load/unload-displacement response of aluminum 1100 during the nanoindentation test.
Metals 08 00421 g008
Figure 9. Contour plots of von Mises stress (top), and equivalent plastic strain (bottom) at the center of the x-y plane of the aluminum block in the nanoindentation experiment.
Metals 08 00421 g009
Figure 10. (a) Structural responses, and (b) variation in elastic modulus and hardness during nanoindentation experiments of aluminum 1100 with different indenter edge-tip radii.
Metals 08 00421 g010
Figure 11. (a) Load/unload-displacement curves, and (b) variation of the elastic modulus and hardness in nanoindentation experiments of aluminum 1100 with different indentation depths.
Metals 08 00421 g011
Figure 12. (a) Load/unload-displacement curves, and (b) variation of elastic modulus and hardness in the nanoindentation experiment based on different aluminum 1100 sample tilts.
Metals 08 00421 g012
Figure 13. Contour plots of von Mises stress (top), and equivalent plastic strain (bottom) at the center x-y plane of the aluminum block with 6° tilt in the nanoindentation experiment.
Metals 08 00421 g013
Figure 14. Critical load/unload-displacement curves of aluminum 1100 in the nanoindentation experiment based on different coefficients of friction between the indenter and the sample.
Metals 08 00421 g014

