Formation of Multi-Type Inclusions during the Cooling and Solidification of Steel: A Trend Model


Chair of Ferrous Metallurgy, Montanuniversität Leoben, Franz-Josef-Straße 18, 8700 Leoben, Austria
*
Author to whom correspondence should be addressed.
Metals 2018, 8(6), 452; https://doi.org/10.3390/met8060452
Submission received: 20 May 2018
/
Revised: 3 June 2018
/
Accepted: 11 June 2018
/
Published: 13 June 2018
(This article belongs to the Special Issue 5th UK-China Steel Research Forum)
Abstract
:This paper presents a trend model of the competitive formation of multi-type inclusions during the cooling and solidification of steel. The model is able to predict the evolution of various inclusions, including their type, composition and size distribution. In the calculations, the thermodynamic library, ChemApp, was applied to perform a thermodynamic equilibrium calculation. Homogeneous nucleation, diffusion-controlled growth and dissolution were employed to simulate the size distribution evolution. At the same time, the collision of inclusions of the same type were considered in a simplified way. The inclusion stabilities were validated by laboratory experiments, which offered a strong basis for the simulations. Using the proposed model, the influence of alloying temperature and oxygen content on the formation of multi-type inclusions was investigated. The results indicated that decreasing the alloying temperature resulted in a higher number density and finer size of different oxides. The oxygen content affected the formation of various oxides in different ways. The predictions, based on the mechanism of competitive nucleation and growth, are discussed and explained. It is believed that the calculations deepen the understanding of the competitive formation of multi-type inclusions. The predicted trends provide a valuable reference for inclusion control and experiment design.
1. Introduction
Nonmetallic inclusions can influence steelmaking processes as well as the final performance properties of steel. On the one hand, they are detrimental, as they cause nozzle clogging during continuous casting, and cracks, fatigue and corrosion in final products. Hence, many measures, such as tundish metallurgy, protecting slags and calcium treatment, have been taken to achieve “clean steel production” [1]. On the other hand, the concept of “oxide metallurgy” suggests that the finely dispersed oxides are beneficial for the optimization of the microstructure, acting as heterogeneous nuclei for acicular ferrite [2,3]. Moreover, the inclusions are useful for grain refinement [4,5]. Considering the aspects of the cleanliness of the steel and the specific utility of nonmetallic inclusions, a comprehensive control of inclusion behavior, including composition, phase components, size and number density, is necessary.
In steelmaking, the primary inclusions mainly form due to deoxidation and are partly removed by fluid flow and slag absorption. The inclusions generated in the casting process and the residual oxides mostly remain in the final products. These secondary inclusions can essentially affect steel quality. Hence, good knowledge of inclusion formation during cooling and solidification is desirable. The ongoing development of computer science and computational thermodynamics offers powerful and valuable tools to simulate inclusion formation [6,7]. Today, the kinetics of inclusion formation also play a significant role. Rocabois et al. [8,9] applied the multiphase code, Chemical Equilibrium Calculation for the Steel Industry (CEQCSI) [10], and classical nucleation and growth theories to model the formation of TiN during solidification. Then, the model was extended to one complex solution for oxides by Lehmann et al. [11], which enabled the calculation of composition changes and size evolution. You et al. [12] proposed a model of MnS formation by combining the thermodynamic library, ChemApp [13], and precipitation kinetics in cases where the collision was considered in a simplified manner. It was found that the aforementioned models were mainly for single inclusion formation, while predictions of the evolution of multi-type inclusions were needed in the development of alloy steels.
Based on previous work [12,14,15,16], the present paper proposes a comprehensive trend model of multi-type inclusions that considers competitive formation during cooling and solidification. This trend model aims at predicting the tendency of particle size and number density, but not the exact values. The model conjoins thermodynamics, kinetics and microsegregation. The thermodynamic library, ChemApp 6.3.4, was applied to perform a thermodynamic equilibrium calculation. Homogeneous nucleation and diffusion-controlled growth and dissolution were employed to simulate the size distribution evolution. At the same time, the collision of inclusions of the same type was considered in a simplified way. Note that the heterogeneous formation of different inclusion types and inclusion clusters and positions are beyond the capacity of the present model. The formation thermodynamics were validated to some extent by laboratory experiments. Using the present model, simulations with different alloying temperatures and initial oxygen contents were performed. The influence on the size and number density of the multi-type inclusions were discussed.
2. Modeling
2.1. Modeling Background
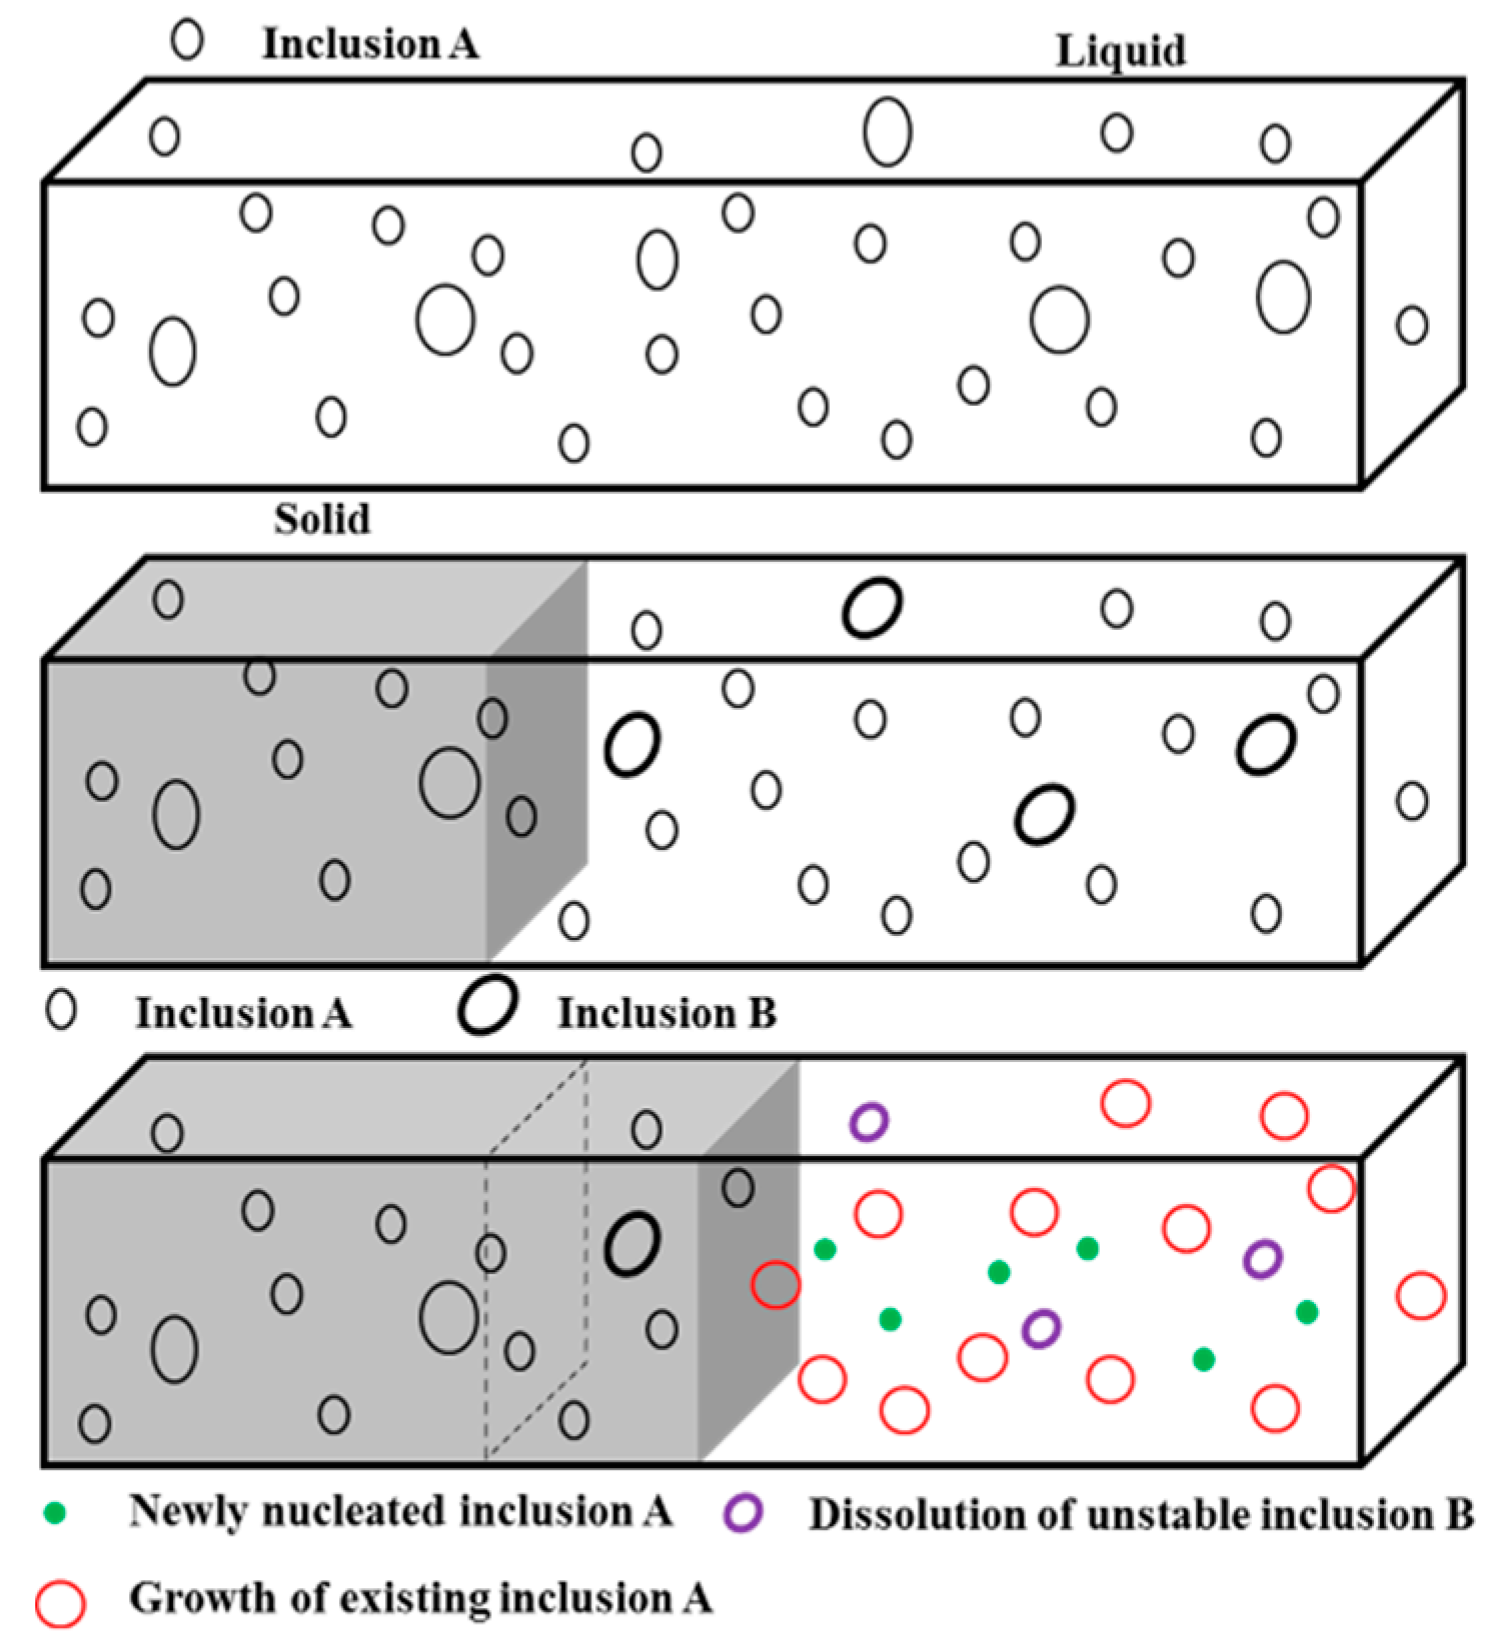
A schematic description of the evolution of various inclusions during the cooling and solidification of steel is shown in Figure 1. The first-precipitated inclusion A forms after the addition of alloy and continuously precipitates during the cooling process. When the steel starts to solidify, inclusion B nucleates due to the enriched solutes and lower temperature, while the pre-existing inclusion A is entrapped by the solid phase. The composition and size of the inclusions in the solid steel remain during solidification, and inclusion A in the liquid steel grows (shown in red) and continuously nucleates (green) as it consumes the less stable inclusion B, which gradually dissolves (purple particles). In the modeling process, the competitive nucleation, growth and dissolution of multi-type inclusions were accounted for using classical homogeneous nucleation theory and diffusion-controlled growth. The collision of two particles of the same type was simply calculated by introducing a frequency factor, as described in previous work [12]. Note that the heterogeneous formation of different inclusion types was not considered in the present model. The evolution of inclusion size and number density was recorded using the particle size distribution (PSD) [17] and particle size grouping (PSG) methods [18]. In the present model, PSD was restricted to defining the inclusion amount with the diameter and number density. The PSG method enables the simple calculation of particle size and number changes using a small number of size groups and the total particle volume. The thermodynamic equilibrium calculation was performed using ChemApp 6.3.4 [13] and the ChemSage datafile. The datafile was generated from FactSage 7.0, based on the FSstel and FToxid databases [19]. ChemApp is an interface software. FactSage, ChemSage and ChemApp are products of GTT Technologies, Herzogenrath, Germany. During the solidification process, the microsegregation of solutes was estimated using a step-wise Ohnaka model [14]. The FORTRAN language and the Microsoft Visual Studio 2013 (Microsoft, Washington, DC, USA) environment were applied to program the source code of the model.
To simplify the calculations, the physical and chemical assumptions of the model were as follows:
- The inclusions were assumed to be independent spherical particles.
- Only the inclusions formed in the liquid steel were modeled. The particles were homogeneously distributed in the liquid steel. The inclusions trapped in the solid steel were assumed to be inert.
- The inclusions nucleate homogeneously.
- Diffusion-controlled growth and dissolution and a reaction equilibrium are assumed to exist at the inclusion and liquid steel interface.
- Collision only happens between particles of the same inclusion type.
- Steel is assumed to be infinite dilution.
2.2. Thermodynamics
In the present model, the equilibrium temperature, stability and composition of the phases were determined using ChemApp, based on thermodynamic databases. In this way, the competitive formation of multi-type inclusions was accounted for. In addition to defining the thermodynamic stability, the Gibbs energy change of the formation of the inclusions also describes the chemical driving force of nucleation. For a stoichiometric phase, the Gibbs energy change of the formation can be estimated from the solubility and concentration products. The situation regarding the solution phase is more complex. The solution phase is generated under the condition that the affinities of all the components are equal [11]. A detailed explanation of this condition, including the concept of affinity, can be found elsewhere [20]. Using this method, the formation of a solution phase finds its equilibrium composition. In the proposed model, the quantities were solved using ChemApp. After the multi-component and multi-phase systems reached equilibrium, ChemApp offered components and compositions of various phases. The Ti-Al containing liquid oxide (a solution phase) was taken as an example whose formation is assumed in Equation (1):
In Equation (1), , and are the molar fractions of the components , and , respectively. The types of the components and their corresponding proportions were obtained from ChemApp. Hence, the Gibbs energy changes of the solution phase formation () were possibly estimated using the following equations:
where , and are the molar Gibbs energy changes for the components , and ; and are the real and equilibrium concentrations of reactants in liquid steel, respectively; is the gas constant; and is temperature.
2.3. Kinetics
2.3.1. Nucleation
The nucleation of the inclusions was described using the classical homogeneous nucleation theory. The inclusion nucleation rate was calculated using Equations (4) and (5). After the inclusions were thermodynamically stable, their nucleation rates were separately calculated. The nucleation driving force of each type of inclusion () was calculated based on ChemApp. At one calculation step, when the nucleus number (Equation (6)) of one type of inclusion was larger than one, the nucleation of this inclusion began. In the subsequent process, the nucleus possibly grew or dissolved, depending on the concentration of the reactant. At the same time, new nuclei of different inclusions could form.
where is the homogeneous nucleation rate; is a pre-exponent factor, which is constant; is the activation energy of the homogeneous nucleation of inclusions, which is given in Equation (5); is the Boltzmann constant; T is the temperature; is the interfacial energy between inclusions and liquid steel; stands for the change in the free energy per unit volume of the inclusion, which can be calculated by ; and and are the molar free energy change and the molar volume of the inclusion, respectively. Similar to Equation (3), could be calculated using the local and equilibrium concentrations of the reactants, based on the thermodynamic calculation at each step; is the nucleus number formed during time step ; is the steel mass of the investigated system; and is the steel density.
2.3.2. Growth and Dissolution
The growth and dissolution of the inclusions were assumed to be controlled by the diffusion of the solutes in the liquid steel. Zener´s equation [21], as given in Equation (7), was used to calculate the growth rate. In the calculations, the stable inclusion grew, while the unstable inclusions dissolved. Whelan [22] derived an expression to calculate the diffusion-controlled dissolution rate. When the transit item was neglected, the expression using Whelan’s method turned out to have the same form as Equation (7). This suggests that the dissolution could be considered as the reverse process of the growth. As described in Equation (7), for a given inclusion, when the interfacial concentration was higher than the concentration in the liquid, the growth rate was a negative value resulting in particle dissolution. Hence, in the present model, both the growth and dissolution of inclusions were calculated using Equation (7). The interfacial concentration of various oxides was represented by the equilibrium oxygen content, while for other inclusions, such as MnS, was calculated based on the solute diffusivity [12].
where is the growth rate of the particle, with a radius of ; is the solute diffusion coefficient in the liquid steel; , and are the solute concentrations in the liquid steel, the inclusion and at the inclusion-liquid-steel interface, respectively.
2.3.3. Collision
Collision is an important mechanism for inclusion growth. In steelmaking vessels, three types of particle collisions exist: Brownian motion, Stokes collisions and turbulent collisions. During the cooling and solidification of steel, it is difficult to calculate particle collisions based on all the three collision mechanisms due to a lack of parameters, such as fluid velocity and turbulent energy in the two-phase region. In the presented model, collision between particles of the same type of inclusion was accounted in a simplified way. A collision factor () based on Brownian motion collision was introduced. This is a factor that increases collision frequency by considering other types of collisions. In a previous study of MnS formation during solidification, a collision factor of 200 was calibrated using the experimental results and its validity was demonstrated [12]. In the present study, this value was simply applied to consider the collision of inclusions in the liquid steel. Using this method, the total collision frequency was calculated based on the collision factor and the Brownian motion collision frequency, as given in Equations (8) and (9). The number density of the particles formed by the collisions was calculated with Equation (10). In Equation (10), the particles with radii of and have the number densities of and , respectively; they collide with the frequency and form new particles with a number density of . The radii of the new particles were calculated with Equation (11) under a constant volume. After collision, the number densities of the inclusions with radii of and become and , respectively.
where and are the Brownian motion and the total collision frequency functions for particles with radii of and , respectively; is the Boltzmann constant; is temperature; is the dynamic viscosity of liquid steel; is the number density of the particle formed by the collisions of the particles with number densities of and .
2.3.4. Microsegregation
The enrichment of solutes fundamentally influenced the formation of inclusions during the solidification of steel. In the calculations, a step-wise Ohnaka model (Equation (12)) [14] was used to predict the enrichment of solutes in the residual liquid. At each solidification step, the partition coefficients, liquidus temperature and diffusion coefficients were calculated based on a thermodynamic equilibrium. The thermodynamic equilibrium calculation was performed using ChemApp [13]. A detailed description and validation of the microsegregation model can be found in a previous study [14]. During the solidification process, the inclusions at the solid/liquid interface were trapped, and the amount was proportional to the step value of the solid fraction [23]. The particles in the solid steel were inert in the following process.
where represents the solid fraction; and are the concentrations of the solutes in the residual liquid at the solid fractions of and , respectively; is the equilibrium partition coefficient between the solid and the liquid; is the back diffusion coefficient, which can be calculated using Equation (13); is the solute diffusion coefficient in the solid; is the local solidification time; and λ2 is the secondary dendrite arm spacing.
2.3.5. The Class Model
The PSD method has been widely applied to record the evolution of particle size and distribution. In this method, the size class and corresponding number density of each class is used to describe the size histogram. In the present model, PSG was necessary in addition to PSD in order to define the size class of the inclusions due to the wide size range generated by collision. PSG was found to be effective in classifying the size group of inclusions during particle evolution [18]. At each step of the calculation, the particles that experienced nucleation, collision, growth or dissolution were classified into suitable groups according to their sizes. If a particle was larger than the maximum group size, a new group was created. The size of the particles in one group was represented by the mean diameter, which was calculated by the total volume and number of particles in the group. A detailed description of the class model can be found in an earlier work [12]. The class model was applied to each type of inclusions independently.
A flow chart of the presented comprehensive model for the formation of multi-type inclusions is displayed in Figure 2. The simulation includes the cooling and solidification processes. The initial steel compositions, starting temperature and cooling rate were input parameters for the model. The temperature change was set to a step value during the cooling. As the temperature decreased, the thermodynamics and kinetics of the formation of inclusions were predicted until the liquidus temperature (solidification start) was reached. At each step, the stabilities of the inclusions were first defined by thermodynamic calculation. Nucleation began when the number of nuclei was larger than one (supersaturation-dependent). The existing stable particles grew by diffusion and collision. Meanwhile, the unstable inclusions dissolved. After the inclusions had reacted, the total amount of various inclusions was calculated. With respect to the consumption of inclusions, the new compositions of steel and the formed inclusions reached a new equilibrium at a decreased temperature in the subsequent step. Before cooling, the holding process could also be considered. Combined with microsegregation, inclusion formation during the solidification process was continuously simulated, based on the information on the existing inclusions, including size and number density, as well as steel composition. During solidification, the solid fraction difference was assumed to be a step value. In one step, the formation of inclusions was modeled in a similar way to the cooling process. Additionally, the enrichment of solutes in the residual liquid and inclusion entrapment were accounted for. Note that the heterogeneous formation of different inclusion types was not considered in the present model. The necessary parameters for the following calculations are listed in Table 1.
In Table 1, the step values of the temperature and solid fraction, as well as the group width in the PSG method, were defined by comparing different calculations that considered both the reasonability and efficiency of the simulations. The diffusion coefficient of oxygen in the liquid steel was calculated by Equation (14) due to its high sensitivity to temperature change [27]. The comparably smaller values of interfacial energy were applied to promote nucleation, because heterogeneous nucleation is dominant in practice. The molar volumes of the solution phase were calculated according to the components and their molar volumes.
3. Results and Discussion
As an illustrative example, the formation of inclusions in a Ti-Al alloy steel was calculated using the proposed model. The chemical composition of the steel is listed in Table 2. To study the influence of the oxygen contents on inclusion formation, the oxygen was varied from 30 to 50 ppm. The sample containing 50 ppm oxygen was selected to investigate the effects of alloying temperature. In the calculations, the mass of the steel was assumed to be 100 g and cooled down at a speed of 10 °C/s. To clearly display the size distribution of inclusions, the calculated size distribution was reclassified into limited size groups with a lognormal bin size. The calculated broad size range resulted in overlapping bars in the histogram of size distribution. While the PSG method was applied to reduce the size groups and the calculation load, the group bin size of the present calculations (0.01 µm) could still lead to a number of groups.
3.1. Influence of the Alloying Temperature
The alloying temperature here means the temperature of the addition of Ti and Al. The alloys were assumed to be instantly well-mixed with the melt after the addition Ti and A1. Without considering the holding process, the alloying temperature turned out to be the starting cooling temperature in the simulations. In laboratory experiments, the melt would be cooled down after a short period of time, following the addition of alloy, to prevent the floating of inclusions. Hence, the importance of the alloying temperature during the cooling and solidification process was studied using the model. The formation of inclusions under alloying temperatures of 1650 and 1600 °C were simulated.
The evolution of mass fractions of various inclusions (top) and the corresponding oxygen concentration changes (bottom) are displayed in Figure 3. The calculations under the different alloying temperatures show the same inclusions types: ASlag, Ti3O5, Al2O3 and MnS. ASlag is a solution phase that mainly consists of Al2O3, MnO, Ti2O3 and TiO2. ASlag is the only inclusion formed in the selected steel in the cooling process, as shown in Figure 3. After solidification starts, ASlag is transformed into Al2O3 and Ti3O5. MnS precipitates at the late stage of solidification due to its strong enrichment of Mn and S.
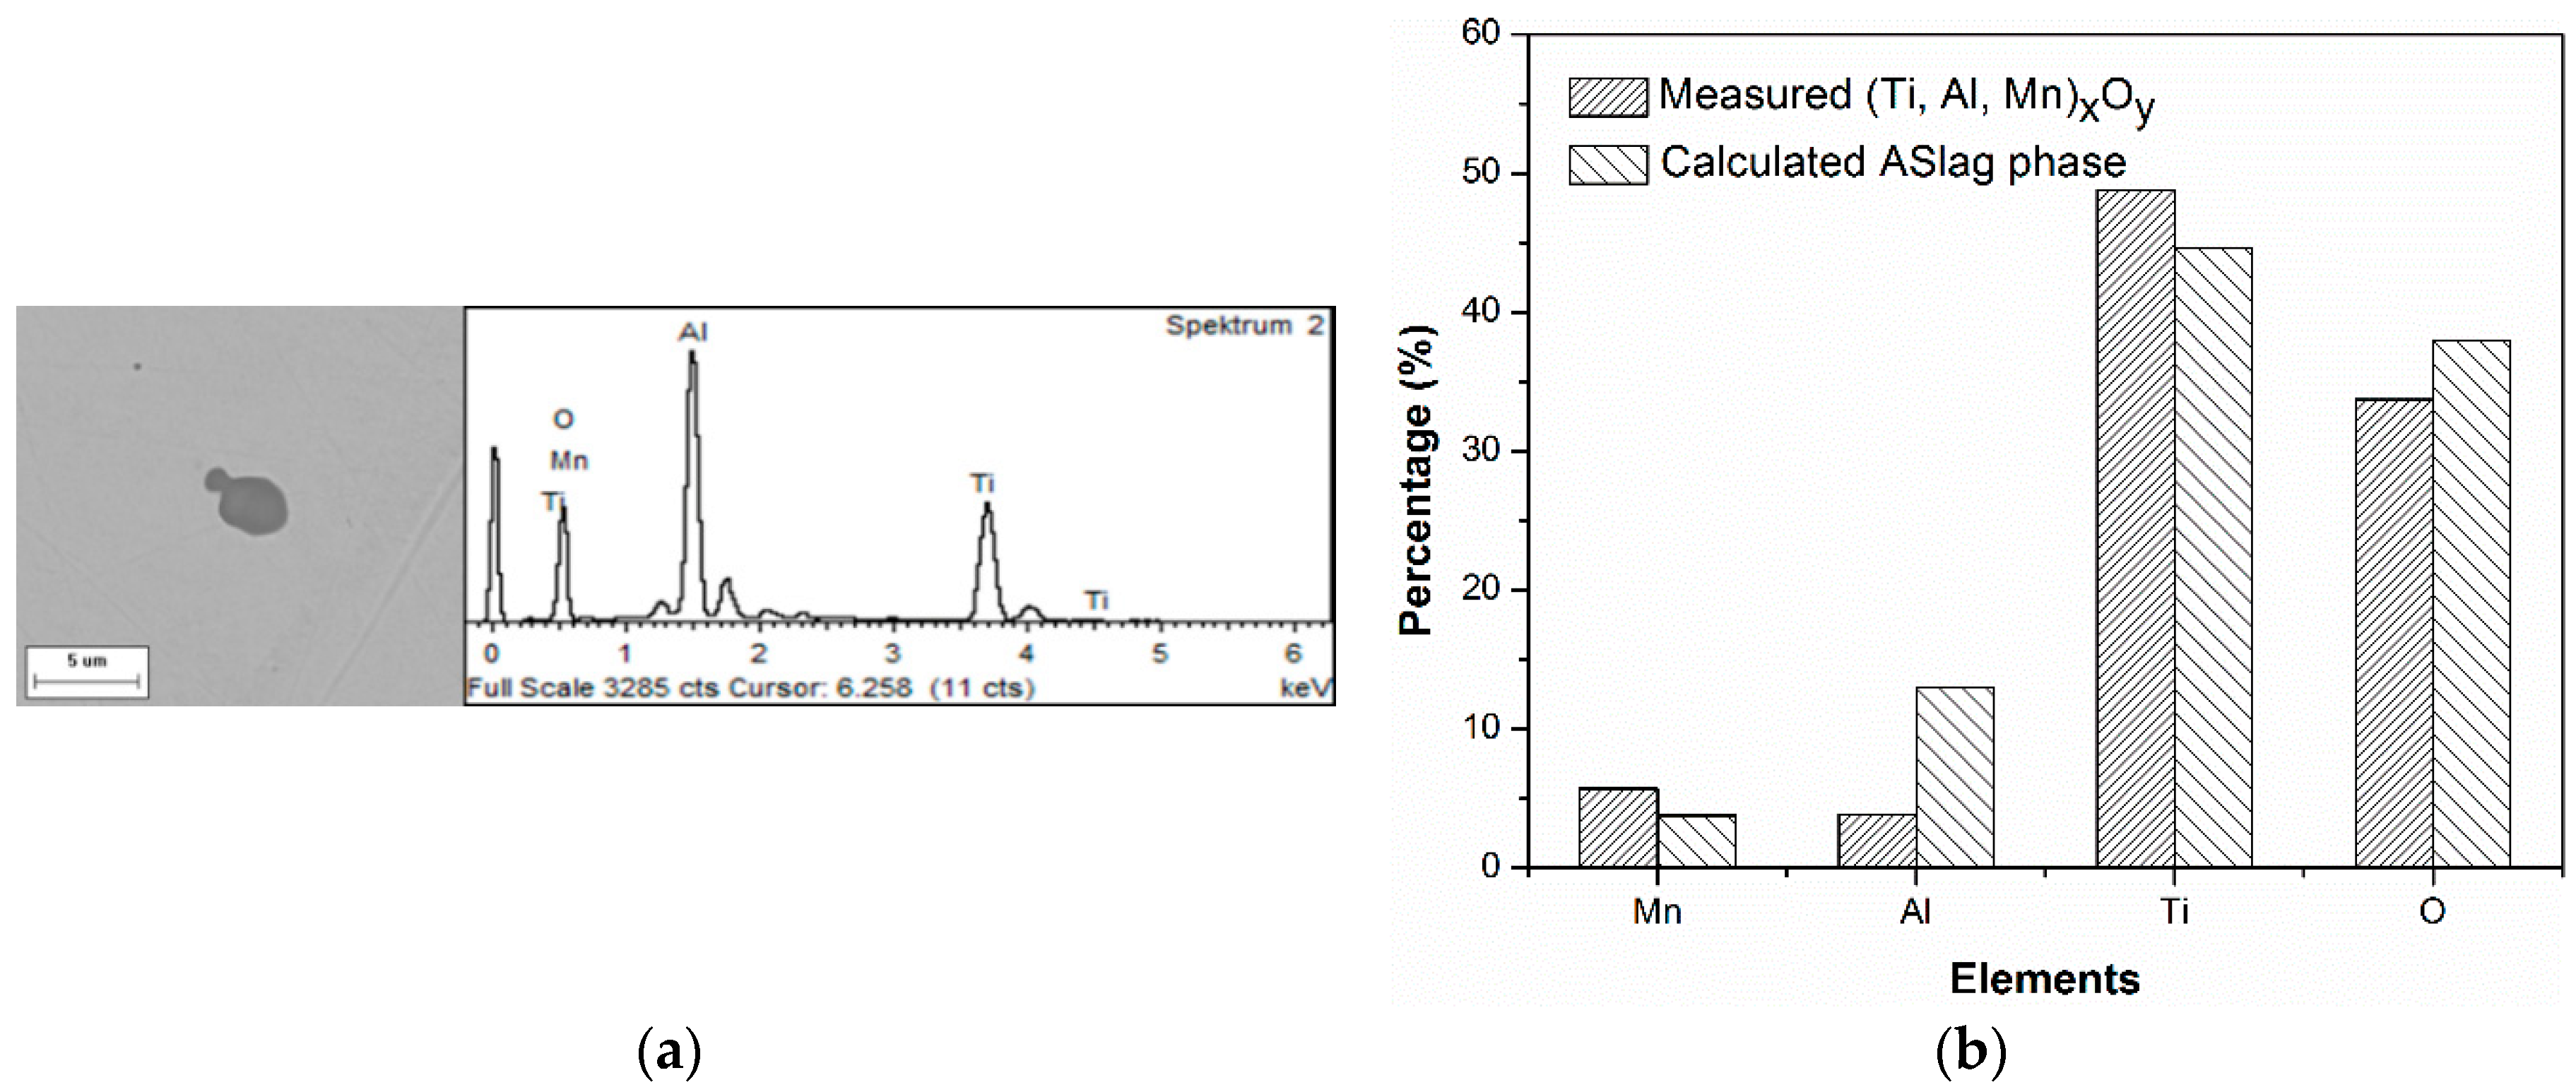
To evaluate the predicted types and composition of the inclusions, selected steel with 50 ppm oxygen was also melted in the laboratory. The prepared sample was observed using both manual and automated scanning electron microscopy/energy dispersive X-ray spectroscopy (SEM/EDS) measurement. The details of the experiment and measurements can be found elsewhere [15]. The predicted and measured inclusion types are compared in Table 3. All the homogeneous inclusions, including (Ti, Al, Mn)xOy, TiOx and MnS from calculation and experiment were in good accordance (Types 1, 2, and 3). The (Ti, Al, Mn)xOy particle was named ASlag in the prediction, which was a liquid solution phase. The detected (Ti, Al, Mn)xOy particle and a comparison of the compositions are shown in Figure 4. The shape and nature of this inclusion type indicates its liquid occurrence at the processing temperature, as shown in Figure 4a. There was reasonable agreement between the average composition of the measured and calculated oxides, as illustrated in Figure 4b. Both the aforementioned aspects indicate that this complex oxide was well-predicted. The heterogeneous inclusions, Al2O3-TiOx and TiOx-MnS (Types 4 and 5 in Figure 5), could not be predicted by the model. However, the formation order of the inclusions could be indirectly applied to illustrate the stability of the inclusions. As shown in Figure 5a,b, Al2O3 is likely to act as a heterogeneous nucleus for TiOx, and TiOx can also act as a nucleus for the precipitation of MnS. This indicates the following formation order of the inclusions: Al2O3, Ti3O5, and MnS. The simulations displayed the same order of formation of the inclusions, as shown in Figure 3. The agreement between the predicted and experimental inclusion types, and the composition and formation order indicated to some extent the reasonability of the modeling thermodynamics. Based on reliable thermodynamics, the competitive formation kinetics of the inclusions was studied. Note that only homogeneous nucleation was considered in the presented model, while the heterogeneous nucleation of different types of inclusions (as shown in Figure 5) is beyond the capacity of the model.
In addition, there were considerable differences in the mass fraction profiles at different alloying temperatures, while the mass evolutions of MnS remained the same; these are displayed in Figure 3. At an alloying temperature of 1650 °C, ASlag precipitated until the temperature cooled down to 1610 °C and the mass fraction gradually increased. When the alloying temperature was lowered to 1600 °C, the mass fraction of ASlag initially soared to approximately 85% (95 ppm) of its total amount and then increased at a much lower speed due to the limited oxygen content. At the liquidus temperature (about 1510 °C), the mass fractions in both cases reached similar peak values. After solidification started, ASlag became unstable and steeply dissolved, resulting in minor stability problems and mass fraction fluctuations. ASlag dissolved much more quickly and its mass fraction became less with an alloying temperature of 1600 °C, as compared to an alloying temperature of 1650 °C. This led to earlier formations and higher mass fractions in the later-transformed Al2O3 and Ti3O5 in the sample. The phenomenon can be explained by the fact that the smaller particles are more easily dissolved (Equation (7) and Figure 4) and promote the transformations. At both alloying temperatures, below 1480 °C, the mass fraction of Ti3O5, ASlag and Al2O3 remained constant even though ASlag and Al2O3 are thermodynamically unstable and completely dissolved in the residual liquid steel. Their existence in the solid steel was attributed only to the entrapment by the solidification interface. MnS precipitates at the end of solidification, which is little influenced by the alloying temperature. Throughout the whole process, the oxygen concentrations are in agreement with the mass fraction of oxides. While the oxygen concentration increased slightly at the latest stage of solidification due to microsegregation, the limited content in the residual liquid did not result in the significant growth of the oxides.
The influence of the alloying temperature on the size distribution, mean diameter and total amount of ASlag is displayed in Figure 6. The particle size distributions are described by the histograms with the lognormal group sizes. It was found that at the liquidus temperature (before dissolution) the size distribution of ASlag in the simulation at the alloying temperature of 1650 °C was significantly flatter and larger in size than the one with an alloying temperature of 1600 °C, as shown in Figure 6a. Specifically, the ASlag diameter (4.5 µm) with a peak number density in the simulation with an alloying temperature of 1650 °C was approximately three times higher than that in the simulation with an alloying temperature of 1600 °C (1.5 µm), and the peak number density of the latter was just one-seventh of the former (0.8 × 104 mm−3). At the solidus temperature (after dissolution), the size distribution of ASlag in the two cases had a similar shape as that which had not undergone dissolution, although the size and number densities were considerably reduced. The remarkable differences in mean diameter and total number at the different alloying temperatures are shown in Figure 6b. At both the liquidus and solidus temperatures, the ASlag in the simulation at an alloying temperature of 1600 °C showed a significantly smaller mean diameter, but much higher number density. Specifically at the liquidus temperature, the total amount of ASlag in the simulation at an alloying temperature of 1600 °C (9 × 104 mm−3) was more than ten times that of the simulation with an alloying temperature of 1650 °C (0.8 × 104 mm−3), and remained approximately three times higher after dissolution. The mean diameters at the liquidus and solidus temperatures in the simulation with a lower alloying temperature (1.6 and 1.3 µm) were approximately half those with higher alloying temperatures (3.8 and 2.4 µm). In total, the size of ASlag was reduced and the number was increased at the lower alloying temperature, before and after experiencing dissolution. The explanations will be further discussed below.
On the other hand, from Figure 6 it can be seen that dissolution influences the various size distributions in different ways. For the pointed shape distribution, which has a larger number density and smaller size (ASlag in the simulation with a lower alloying temperature), the dissolution of the particles mainly reduced their number, while their size was decreased in a limited manner, from 1.6 to 1.3 µm in the present case. In contrast, for the relatively flat size distribution, which offered a smaller number and a larger diameter, the dissolution of the particles preferably consumed the size, and the number had few changes (Figure 6b). In addition, it was illustrated that the alloying temperature influences the ASlag at liquidus and solidus (before and after disillusion) in the same way. This means that the dissolution does not affect the size distribution trend.
In the investigated steel, ASlag was the first precipitated inclusion and affiliated almost all the oxygen before dissolution. As discussed above, the alloying temperature obviously affected the size distribution of ASlag, while the influence on the later-transformed oxides (Al2O3 and Ti3O5) was limited. The effect of the alloying temperature on the final size distribution, mean diameter and total amount of Ti3O5, as an example, is shown in Figure 7. In Figure 7a, it can be seen that the size distribution of Ti3O5 in simulations with different alloying temperatures is similar. They have the same size (1.5 µm) as the peak number density and size range, but a difference in the peak number density can be observed. From Figure 7b, it was found that the total number of Ti3O5 in the simulations with different alloying temperatures were quite close, while their mean diameters had a difference within 0.1 µm. The alloying temperature had a minor indirect influence on the later-transformed inclusions. The smaller size and higher number density of ASlag in the simulation with the lower alloying temperature (1600 °C) resulted in an increased dissolution of the particles and a higher oxygen content. This led to a high number density of Ti3O5, but a similar size.
3.2. Influence of Oxygen Content
To understand and control the inclusion formation, the influence of oxygen content needs to be studied. The alloying temperature was set at 1650 °C in the calculations of this section. The calculated results including the evolution of the mass fraction, size distribution, mean size and total number are shown in Figure 8, Figure 9 and Figure 10.
The changes in the mass fraction of the inclusions and the corresponding oxygen concentrations during cooling and solidification are compared in Figure 8. With a lower oxygen content, ASlag inclusions precipitated later and, as expected, their mass fraction was lower, the oxygen content in the liquid steel decreased accordingly. At the beginning of solidification, ASlag steeply dissolved, with a decrease of just ten degrees in temperature due to the thermodynamic instability. The entrapment of particles at the liquid/solid interface was again responsible for the remaining ASlag phase results. Throughout the whole process, the mass fraction profiles of ASlag in the simulations with different oxygen contents evolved in parallel. Note that the minor fluctuation was caused by the instability problem due to the fast dissolution of ASlag. The simulation containing only 30 ppm of oxygen finally achieved a lower ASlag mass fraction than the others. The change in the amount of Al2O3 in all the simulations was similar; the mass fraction rapidly reached the maximum and then reduced gradually due to dissolution, while the final mass fractions of Al2O3 in the different simulations were nearly the same. The mass fraction profiles of Ti3O5 were similar but distinct. The amount of Ti3O5 increased as the oxygen content increased. The fluctuations in the oxygen concentration curves resulted from the changes in the amount of ASlag, Al2O3 and Ti3O5. The dissolution of ASlag led to the increase in the oxygen concentration of the residual liquid at the beginning of the solidification. The Al2O3 formation caused a sharp decrease of dissolved oxygen, and after the Al2O3 became unstable, the oxygen concentration increased again until the formation of Ti3O5 started. Ti3O5 consumed almost all the oxygen content in the residual liquid. Though the oxygen concentration increased slightly at the end of solidification due to microsegregation, its content was quite limited. While MnS formed at the end of solidification and is also displayed in Figure 3, oxygen had little influence on it in the current calculations.
In Figure 9, the influence of oxygen content on the size distribution of the oxides after solidification is presented. The maximum number density of ASlag decreased as the oxygen content increased, while their corresponding size enlarged from 1.5 µm to 2.5 µm, as shown in Figure 9a. The maximum size of ASlag in the simulation containing 30 ppm oxygen was 2.5 µm, while the largest particles in the simulations with a higher oxygen content were in a diameter range of 4.4 µm. The number density of Ti3O5 decreased as the oxygen content decreased, while the size with the largest number increased from 1.5 µm to 2.5 µm, as displayed in Figure 9b. The maximum sizes in the different simulations were the same, with a diameter of 4.5 µm. The peak number density of Al2O3 decreased with the lower oxygen content, as shown in Figure 9c. The corresponding particle sizes ranged within the same diameter of approximately 0.45 µm. The size ranges of the Al2O3 particles in the three cases were also similar (from 0.08 to 1.35 µm).
The influence of the oxygen content on the total number and mean diameter of the oxides is displayed in Figure 10. Due to the different formation conditions, the oxygen content affected the total number and mean diameter of the various oxides in different ways. For ASlag (Figure 10a), increasing the oxygen content led to a large mean diameter and a lower number density. In contrast to ASlag, the total number of Ti3O5 increased with the higher oxygen content and the mean diameters were similar (from 1.8 µm to 1.9 µm) (Figure 10b). As shown in Figure 10c, Al2O3 had a higher number density and a smaller but similar size (from 0.53 µm to 0.58 µm) when the oxygen content was higher. The mechanisms related to the influence of the oxygen content on the formation of oxides are discussed in the following.
3.3. Discussion
As described in the former sections, both alloying temperature and oxygen content have a significant influence on the formation of various oxides. In contrast to the effects resulting from metallurgical parameters, they could be explained by the mechanisms of competitive nucleation and growth.
As shown in Figure 6, lowering the alloying temperature reduces the energy obstacle and enhances the chemical driving force of the nucleation (Equations (4) and (5)) of ASlag in the selected steel. Thus the nucleation rate and number density are greatly increased. The high number density further limits the growth of the particles with the given oxygen content. This results in a relatively pointed shape size distribution and a smaller size (Figure 6a). Comparatively, the ASlag in the simulation with a higher alloying temperature had a larger size but were fewer in number. As the first-precipitated oxide, the size distribution of ASlag further influenced the formation of later-transformed oxides. From Equation (7), it was found that smaller particles show a faster dissolution rate and disappear more easily. This explains the lower mass fraction of ASlag and higher mass fraction of Ti3O5 and Al2O3 in the simulation with a lower alloying temperature (Figure 3). While Ti3O5 and Al2O3 formed at comparable temperatures in different cases, the higher dissolution rate of ASlag released more oxygen and contributed to higher nucleation rates and number densities of Ti3O5 and Al2O3.
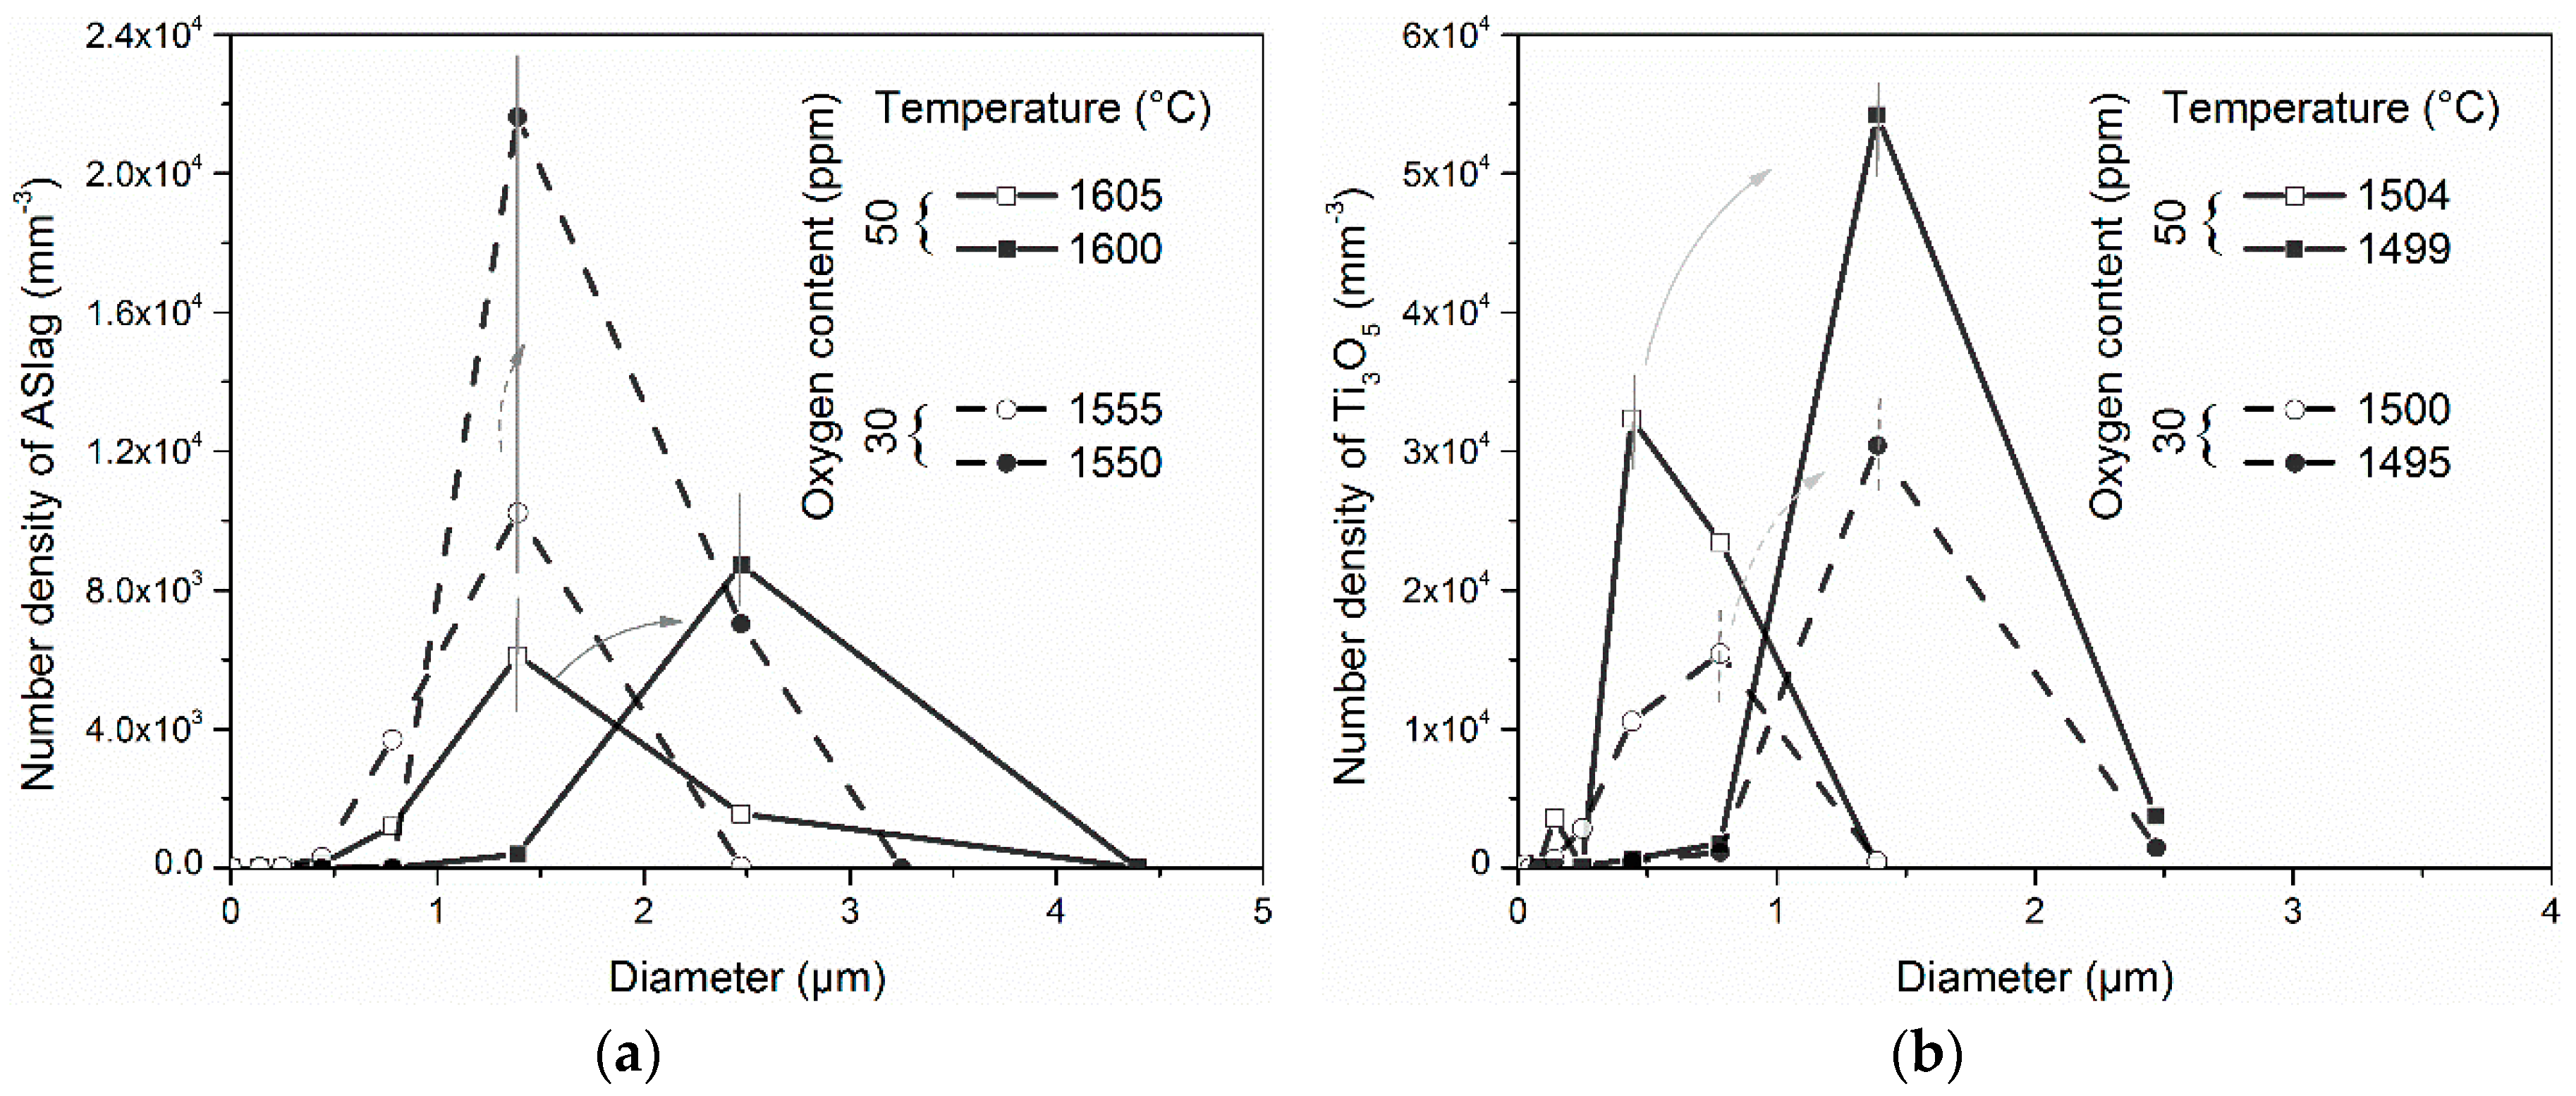
In Figure 9 and Figure 10, it can be seen that the initial oxygen content affects the first precipitated ASlag phase and the later-transformed Ti3O5 and Al2O3 in different manners. As the oxygen content in the simulations increased, ASlag starts to form at significantly higher temperatures, over 30 °C (Figure 8). From Equation (14), we can see that oxygen diffuses faster at higher temperatures. This led to the faster growth of ASlag particles in the simulation containing more oxygen. In the meantime, the growth of ASlag was more favorable than its nucleation in the simulation with a higher oxygen content, as illustrated in Figure 11a. In the figure, the size and number evolution of ASlag in the simulations with 50 and 30 ppm oxygen are compared. In both cases, ASlag can nucleate and increase in size during the temperature periods; the temperatures decreased by 5 °C under the same cooling rate, which ensures that the evolution time of ASlag is the same. It showed that the size distribution of ASlag in the simulation with 50 ppm oxygen at 1605 °C was similar to that in the simulation containing 30 ppm oxygen at 1555 °C. When the temperature decreased from 1605 to 1600 °C, the ASlag in the simulation with 50 ppm oxygen grew significantly, with a limited increase in number, the size with the largest number density almost doubled and the number density increased by just 30%. In contrast, in the simulation with 30 ppm oxygen cooled down by 5 °C, the peak number density of the particles became 2.2 times higher and the corresponding diameter remained unchanged. By comparing these two cases at a higher formation temperature, ASlag was more likely to increase in size than its nucleate. In addition, ASlag precipitated earlier in the simulation with more oxygen and had a longer time to grow, which also contributed to its larger size. Based on the above discussion, it was reasonable to find that the total number of ASlag decreased and the mean diameter increased as the oxygen content increased (Figure 10a). Further, the size distribution of the particles trapped by the solid steel can reflect their character in the formation process due to the assumed homogeneous distribution in the residual liquid, even though the particles undergo dissolution.
In the cases of Al2O3 and Ti3O5, which formed during the solidification process, the oxides in the simulations containing different oxygen contents started to precipitate at quite similar temperatures. In the simulation with a higher oxygen content before nucleation (Figure 8), the supersaturation and driving force of the oxide formation were higher. This led to a smaller nucleation barrier, as referred to in Equation (5). From Equation (5), at the given temperature, the less-critical nucleation energy change enlarged the nucleation rate. Thus, the number densities of Al2O3 and Ti3O5 increased as the oxygen content increased. At a similar temperature, the diffusivity of the reactants was regarded as the same in the different simulations and the growth rates of the particles were similar. In Figure 11b, the evolution of the Ti3O5 in the simulation with 50 and 30 ppm oxygen were taken as an example to instruct this. Similar to the case of ASlag (Figure 11a), the size distribution of Ti3O5 that experienced the same evolution period (5 °C decrease) were compared. This shows that the number densities were larger in the simulation with a higher oxygen content, before and after evolution. The size distribution shapes of the two cases were quite similar, and changes in them after nucleation and growth were in parallel. The mean size growth rates of Ti3O5 in the simulations with 50 and 30 ppm oxygen were almost the same at 1.89 and 1.82 (µm/s), respectively. A large number of particles limits the growth driving force of each single particle and further reduces the growth rate. This explains why the final mean diameters of the Al2O3 and Ti3O5 particles increased insignificantly in the simulations with less oxygen (Figure 10b,c). The case of Ti3O5 in the simulation containing 30 ppm oxygen was an exception, with both a smaller number and mean diameter compared to that in the simulation containing 40 ppm oxygen (Figure 10b). This is attributed to the limited amount of oxygen in the residual liquid.
Based on the calculation results and the mechanisms of the competitive formation of the multi-type inclusions, decreasing the alloy temperature effectively avoided the formation of large oxides and improved the steel properties. Additionally, it generated a high number of particles with a small size, which were beneficial for promoting acicular ferrite formation and grain refinement. On the other hand, the available oxygen content, which was nothing other than the total oxygen content, neither stands automatically for the total amount of various oxides nor for their number or size. According to the different objectives, a specific focus on the inclusions in different steels and the metallurgical conditions is needed. In the selected steel, the large ASlag particles in the simulation with a higher oxygen content that formed at a high temperature should be avoided; considering both the cleanness of the steel and the creation of desirable oxides, 30 ppm of oxygen is the preferable choice. The comprehensive adjustment of the alloying temperature and steel composition is a promising approach to obtaining preferable inclusions. In sum, to combine a preferably high steel cleanness with the creation of specific inclusion types and sizes for microstructure evolution, comprehensive knowledge of the inclusion formation is needed.
4. Summary
The concept of coupling a metallurgical model with thermodynamic databases is applied for the present simulations. In former studies, microsegregation, single inclusion formation and the formation of multi-type inclusion thermodynamics were predicted using the proposed models. Continuously, accounting for thermodynamics and kinetics, this work proposed a trend model for the competitive formation of multi-type inclusions during the cooling and solidification process. Using this model, the influence of alloying temperature and oxygen content on inclusion formation were studied and discussed. Based on the calculations and discussions, the following conclusions were drawn:
- Using the model, the competitive formation of multi-type inclusions can be simulated. The composition, amount, size and number evolution of inclusions as well as the corresponding changes in the concentration of solutes can be predicted.
- Decreasing the alloying temperature resulted in a higher number density and finer size of first precipitated inclusions (specific to ASlag in the studied steel). This can be explained by the fact that a lower temperature enhances the supersaturation of oxide formation and further promotes nucleation. The smaller size of the primary ASlag formation is favorable to the nucleation of later-transformed Al2O3 and Ti3O5.
- The oxygen content influenced the formation of various oxides in different ways due to the competitive nucleation and growth. With a higher oxygen content, ASlag formed at a higher temperature and showed a larger mass fraction; the size distribution of ASlag became larger, while the number densities were reduced. The high formation temperature was favorable to the diffusion of reactants and ASlag particle growth, which led to limited nucleation and a lower number density. Regarding the later-transformed Al2O3 and Ti3O5, the oxides offered higher number densities, while their sizes were similar. A possible explanation could be that the higher oxygen content enhanced the supersaturation and nucleation rate; at a similar formation temperature, the growth rate of the inclusions in different simulations were comparable.
The presented model separately predicted the formation kinetics of multi-type inclusions. The heterogeneous formation of different inclusions is a promising but challenging task for future studies. Completing this task will consist in well-designed experiments that make it possible to calibrate the model. The simulations can further approach practice and become more applicable.
Author Contributions
D.Y., S.K.M. and C.B. conceived and designed the modeling work; D.Y. wrote the program and performed calculations; S.K.M. offered the experimental results; all the authors contributed to the analysis and discussion; D.Y. wrote the paper.
Funding
This research received no external funding.
Acknowledgments
The authors are grateful for the support Chair of Ferrous Metallurgy, Montanuniversitaet Leoben.
Conflicts of Interest
The authors declare no conflict of interest.
References
- Millman, S. Clean steel-basic features and operation practices. In IISI Study on Clean Steel; Wünnenberg, K., Millman, S., Eds.; IISI Committee on Technology: Brussels, Belgium, 2004; pp. 39–60. [Google Scholar]
- Takamura, J.; Mizoguchi, S. Metallurgy of Oxides in Steels. I. In Proceedings of the Sixth International Iron and Steel Congress Roles of Oxides in Steels Performance, Nagoya, Japan, 21–26 October 1990; pp. 591–597. [Google Scholar]
- Mizoguchi, S.; Takamura, J. Metallurgy of Oxides in Steels. II. In Proceedings of the Sixth International Iron and Steel Congress Control of Oxides as Inoculants, Nagoya, Japan, 21–26 October 1990; pp. 598–604. [Google Scholar]
- Grong, Ø.; Kolbeinsen, L.; Van der Eijk, C.; Tranell, G. Microstructure Control of Steels through Dispersoid Metallurgy Using Novel Grain Refining Alloys. ISIJ Int. 2006, 46, 824–831. [Google Scholar] [CrossRef] [Green Version]
- Van Der Eijk, C.; Grong, Ø.; Haakonsen, F.; Kolbeinsen, L.; Tranell, G. Progress in the development and use of grain refiner based on cerium sulfide or titanium compound for carbon steel. ISIJ Int. 2009, 49, 1046–1050. [Google Scholar] [CrossRef]
- Kang, Y.; Chang, C.; Park, S.; Khn, S.; Jung, I.; Lee, H. Thermodynamics of inclusions engineering in steelmaking and refining. Iron Steel Technol. 2006, 3, 154–162. [Google Scholar]
- Jung, I.H. Overview of the applications of thermodynamic databases to steelmaking processes. Calphad 2010, 34, 332–362. [Google Scholar] [CrossRef]
- Rocabois, P.; Lehmann, J.; Gaye, H.; Wintz, M. Kinetics of precipitation of non-metallic inclusions during solidification of steel. J. Cryst. Growth 1999, 198, 838–843. [Google Scholar] [CrossRef]
- Gaye, H.; Rocabois, P.; Lehmann, J.; Bobadilla, M. Kinetics of inclusion precipitation during steel solidification. Steel Res. 1999, 70, 356–361. [Google Scholar] [CrossRef]
- Lehmann, J.; Gaye, H.; Rocabois, P. The IRSID slag model for steelmaking process control. In Proceedings of the 2nd International Conference Mathematical Modeling and Computer Simulation of Metal Technologies, Ariel, Israel, 2000; pp. 89–96. [Google Scholar]
- Lehmann, J.; Rocabois, P.; Gaye, H. Kinetic model of non-metallic inclusions' precipitation during steel solidification. J. Non-Cryst. Solids 2001, 282, 61–71. [Google Scholar] [CrossRef]
- You, D.; Michelic, S.K.; Wieser, G.; Bernhard, C. Modeling of manganese sulfide formation during the solidification of steel. J. Mater. Sci. 2017, 52, 1797–1812. [Google Scholar] [CrossRef]
- Petersen, S.; Hack, K. The thermochemistry library ChemApp and its applications. Int. J. Mater. Res. 2007, 98, 935–945. [Google Scholar] [CrossRef]
- You, D.; Bernhard, C.; Wieser, G.; Michelic, S. Microsegregation Model with Local Equilibrium Partition Coefficients during Solidification of Steels. Steel Res. Int. 2016, 87, 840–849. [Google Scholar] [CrossRef]
- You, D.; Michelic, S.K.; Bernhard, C.; Loder, D.; Wieser, G. Modeling of inclusion formation during the solidification of steel. ISIJ Int. 2016, 56, 1770–1778. [Google Scholar] [CrossRef]
- You, D.; Michelic, S.K.; Presoly, P.; Liu, J.; Bernhard, C. Modeling inclusion formation during solidification of steel: A review. Metals 2017, 7, 460. [Google Scholar] [CrossRef]
- Perez, M.; Dumont, M.; Acevedo, D. Implementation of classical nucleation and growth theories for precipitation. Acta Mater. 2008, 56, 2119–2132. [Google Scholar] [CrossRef]
- Nakaoka, T.; Taniguchi, S.; Matsumoto, K.; Johansen, S.T. Particle-size-grouping method of inclusion agglomeration and its application to water model experiments. ISIJ Int. 2001, 41, 1103–1111. [Google Scholar] [CrossRef]
- Bale, C.W.; Chartrand, P.; Degterov, S.A.; Eriksson, G.; Hack, K.; Mahfoud, R.; Melançon, J.; Pelton, A.D.; Petersen, S. FactSage thermochemical software and databases. Calphad 2002, 26, 189–228. [Google Scholar] [CrossRef]
- Hillert, M. Phase Equilibria, Phase Diagrams and Phase Transformations; Cambridge University Press: Cambridge, UK, 2007. [Google Scholar]
- Zener, C. Theory of Growth of Spherical Precipitates from Solid Solution. J. Appl. Phys. 1949, 20, 950–953. [Google Scholar] [CrossRef]
- Whelan, M.J. On the Kinetics of Precipitate Dissolution. Met. Sci. 2013, 3, 95–97. [Google Scholar] [CrossRef]
- Yamada, W.; Matsumiya, T.; Ito, A. Development of simulation model for composition change of nonmetallic inclusions during solidification of steels. In Proceedings of the Sixth International Iron and Steel Congress, Nagoya, Japan, 21–26 October 1990; pp. 618–625. [Google Scholar]
- Zhang, J.; Xing, X.; Song, B.; Guo, X.; Xiang, C. Metallurgical Physical Chemistry; Metallurgical Industry Press: Beijing, China, 2004. [Google Scholar]
- Oikawa, K.; Ohtani, H.; Ishida, K.; Nishizawa, T. The control of the morphology of MnS inclusions in steel during solidification. ISIJ Int. 1995, 35, 402–408. [Google Scholar] [CrossRef]
- Chemical Databook. Available online: http://www.chemicalbook.com/ (accessed on 6 May 2018).
- Hong, T.; Debroy, T. Time-temperature-transformation diagrams for the growth and dissolution of inclusions in liquid steels. Scr. Mater. 2001, 44, 847–852. [Google Scholar] [CrossRef]
Figure 1.
Schematic of the evolution of multi-type inclusions during the cooling and solidification process: Inclusion A nucleation and growth in liquid steel before solidification; some Inclusion A was trapped by the solid steel (gray volume); the Inclusion A in the residual liquid steel grew further and Inclusion B was able to start to nucleate; with the solidification of the steel, Inclusion B started to dissolve (in purple) and Inclusion A continued to grow (in red) and nucleate (in green).

Figure 2.
The flow chart of the comprehensive model of the formation of multi-phase inclusions during the cooling and solidification of steel.
Figure 2.
The flow chart of the comprehensive model of the formation of multi-phase inclusions during the cooling and solidification of steel.
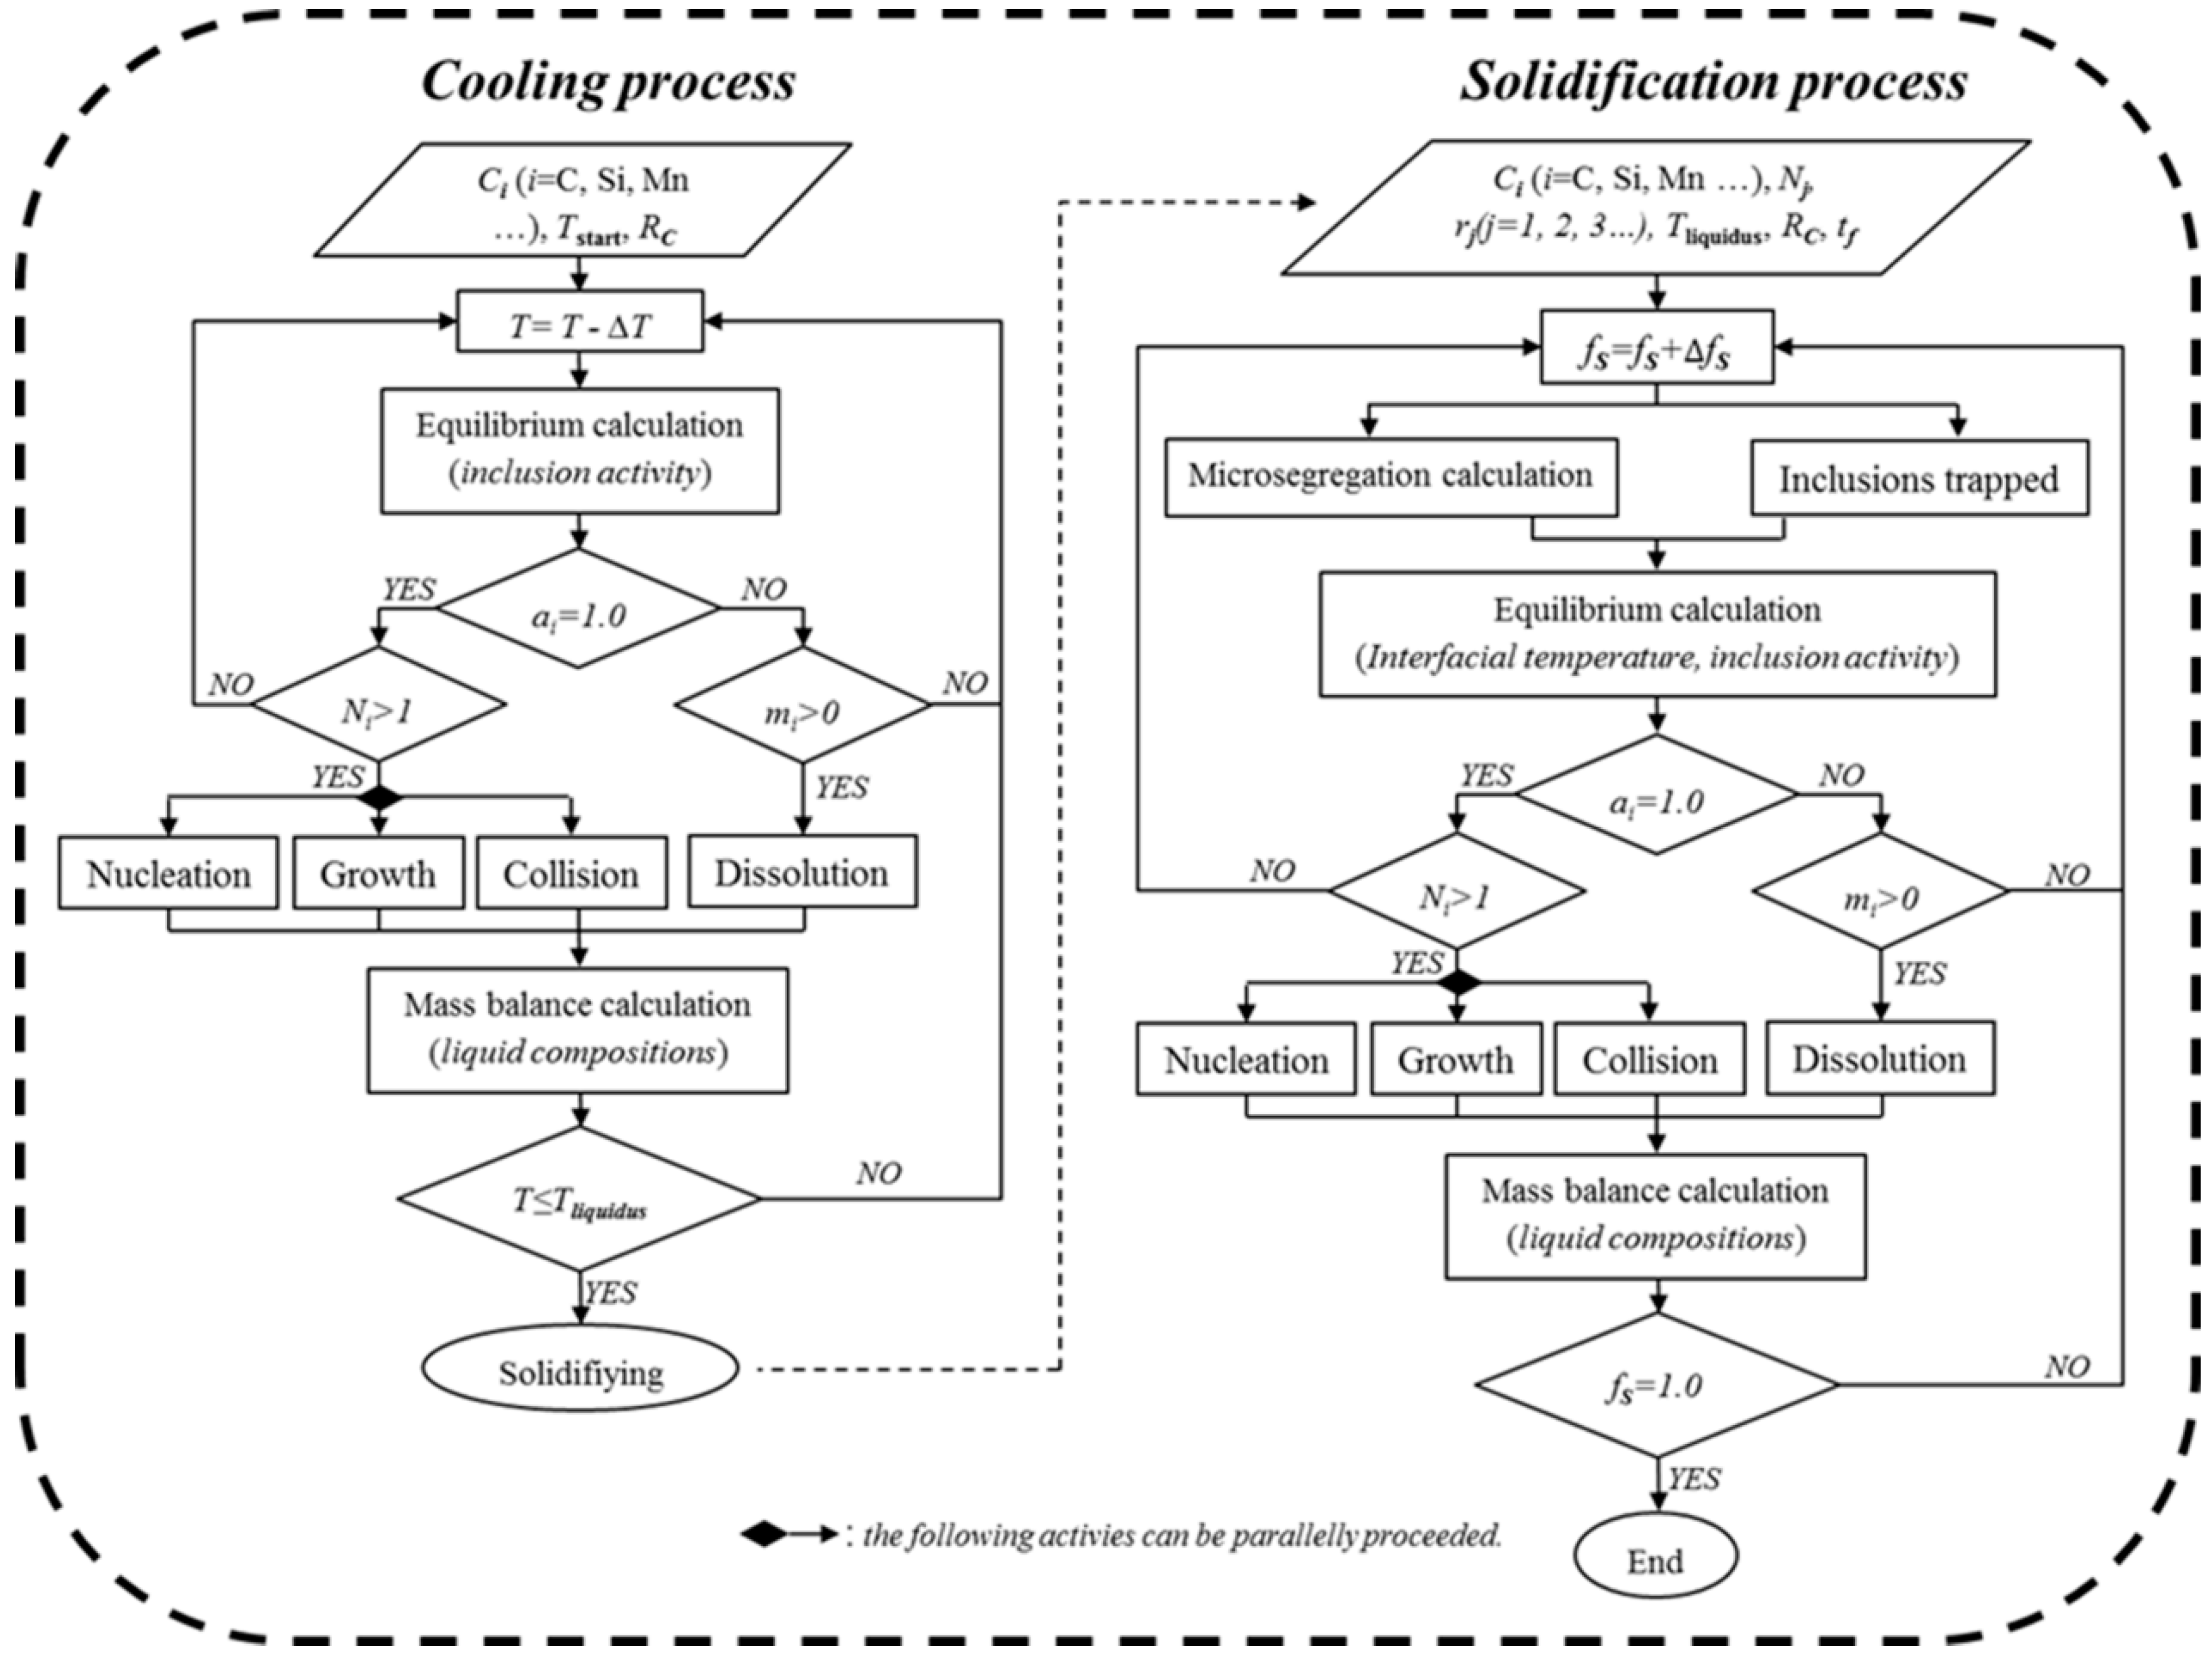
Figure 3.
The mass fraction changes of the inclusions during the cooling and solidification process (top) and the corresponding changes of oxygen concentration (bottom) at the alloying temperatures of 1650 and 1600 °C.
Figure 3.
The mass fraction changes of the inclusions during the cooling and solidification process (top) and the corresponding changes of oxygen concentration (bottom) at the alloying temperatures of 1650 and 1600 °C.
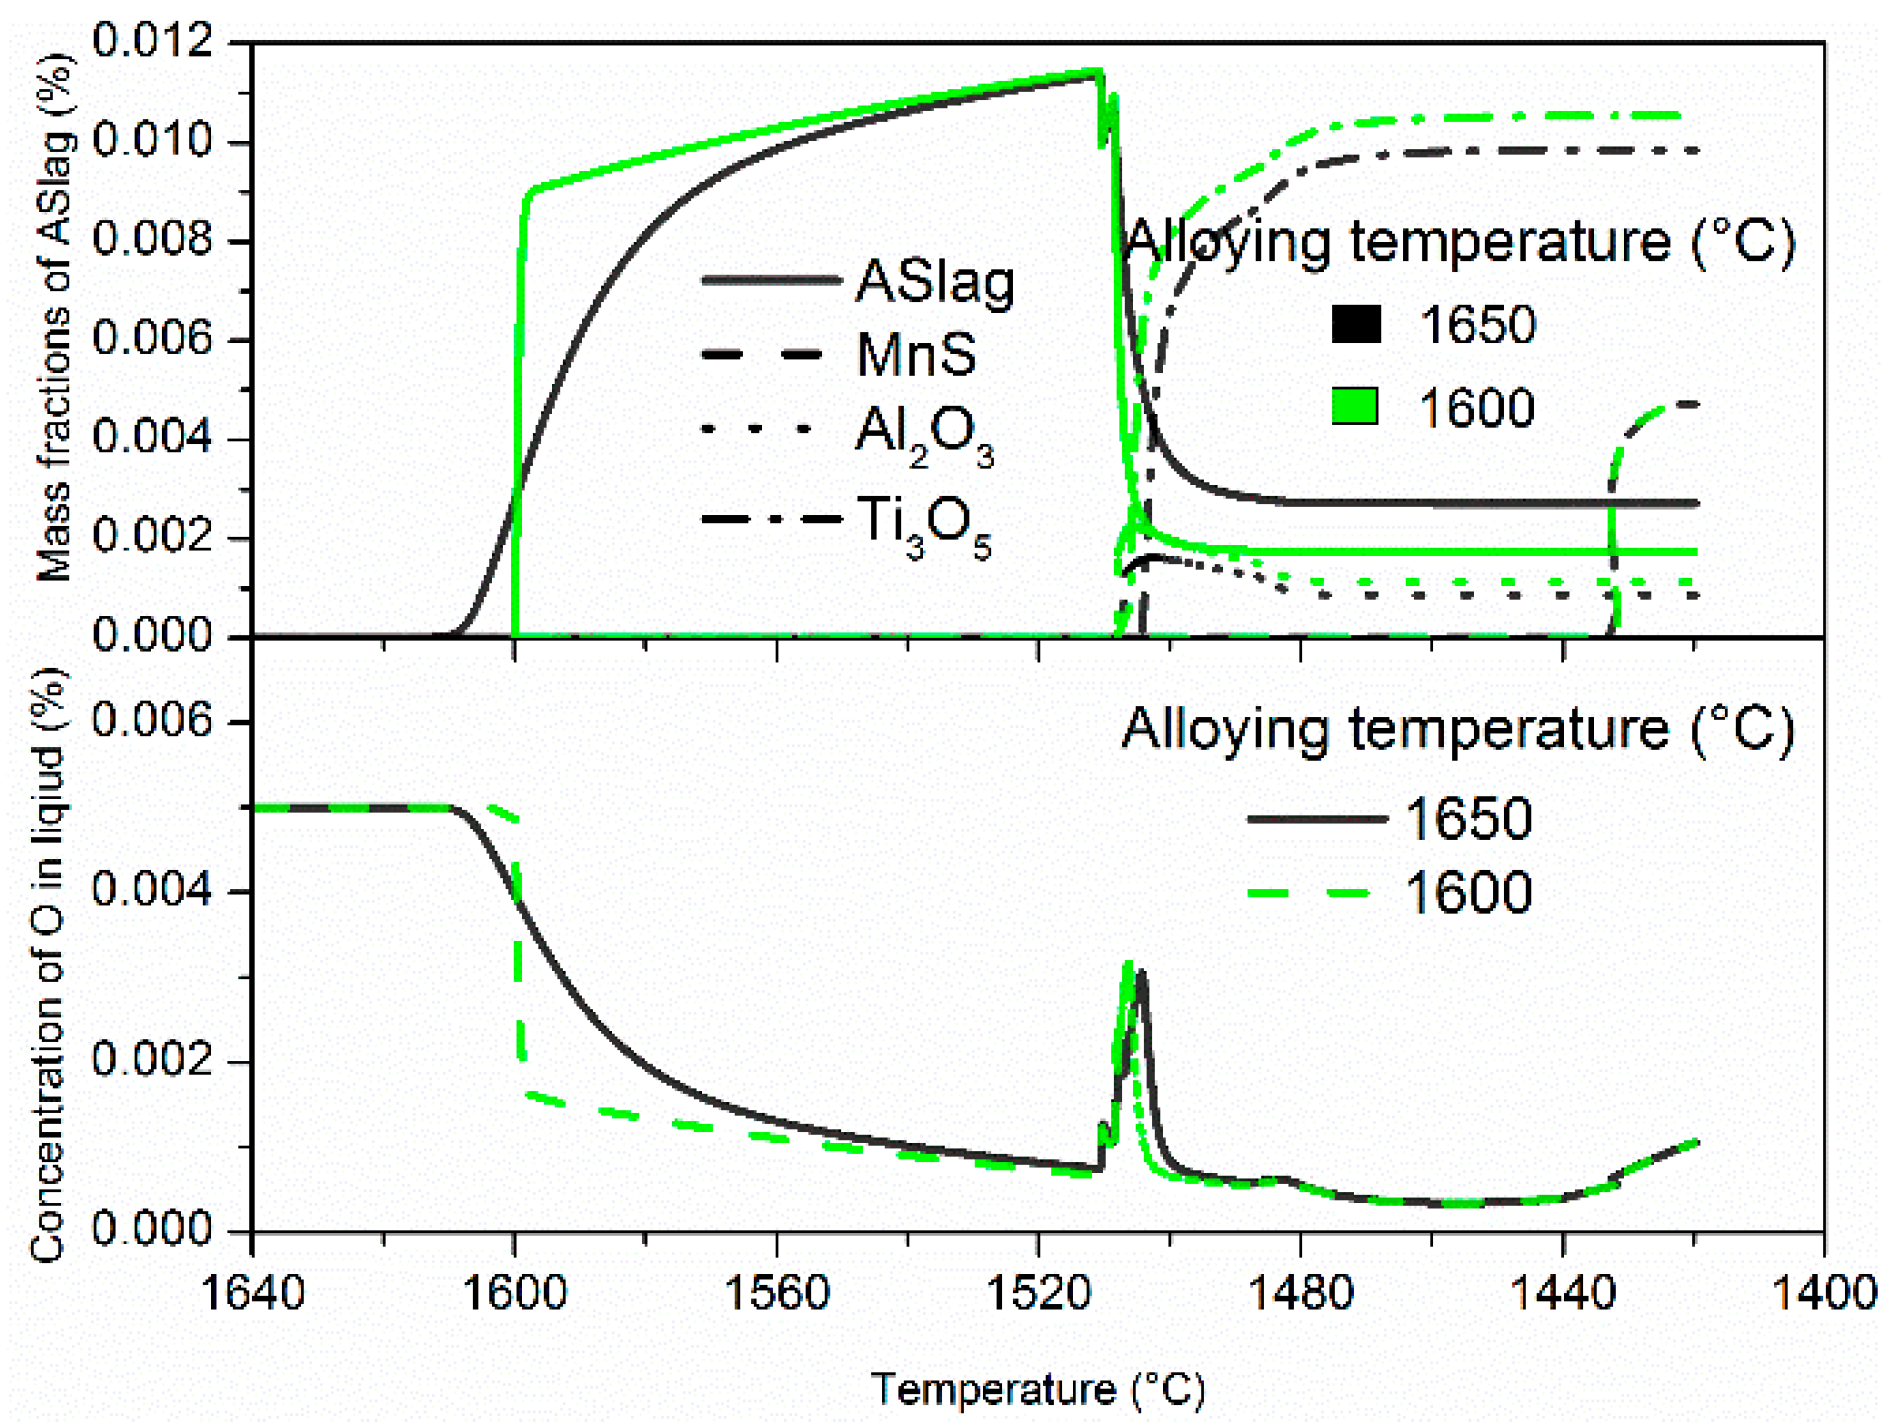
Figure 4.
(a) Morphology and EDS analysis of (Ti, Al, Mn)xOy; (b) comparison of the composition of the calculated ASlag and measured (Ti, Al, Mn)xOy. Reproduced with permission from [15], ISIJ International, 2016.
Figure 4.
(a) Morphology and EDS analysis of (Ti, Al, Mn)xOy; (b) comparison of the composition of the calculated ASlag and measured (Ti, Al, Mn)xOy. Reproduced with permission from [15], ISIJ International, 2016.

Figure 5.
Typical heterogeneous inclusions in steel B: (a) Al2O3-TiOx and (b) TiOx-MnS. Reproduced with permission from [15], ISIJ International, 2016.
Figure 5.
Typical heterogeneous inclusions in steel B: (a) Al2O3-TiOx and (b) TiOx-MnS. Reproduced with permission from [15], ISIJ International, 2016.
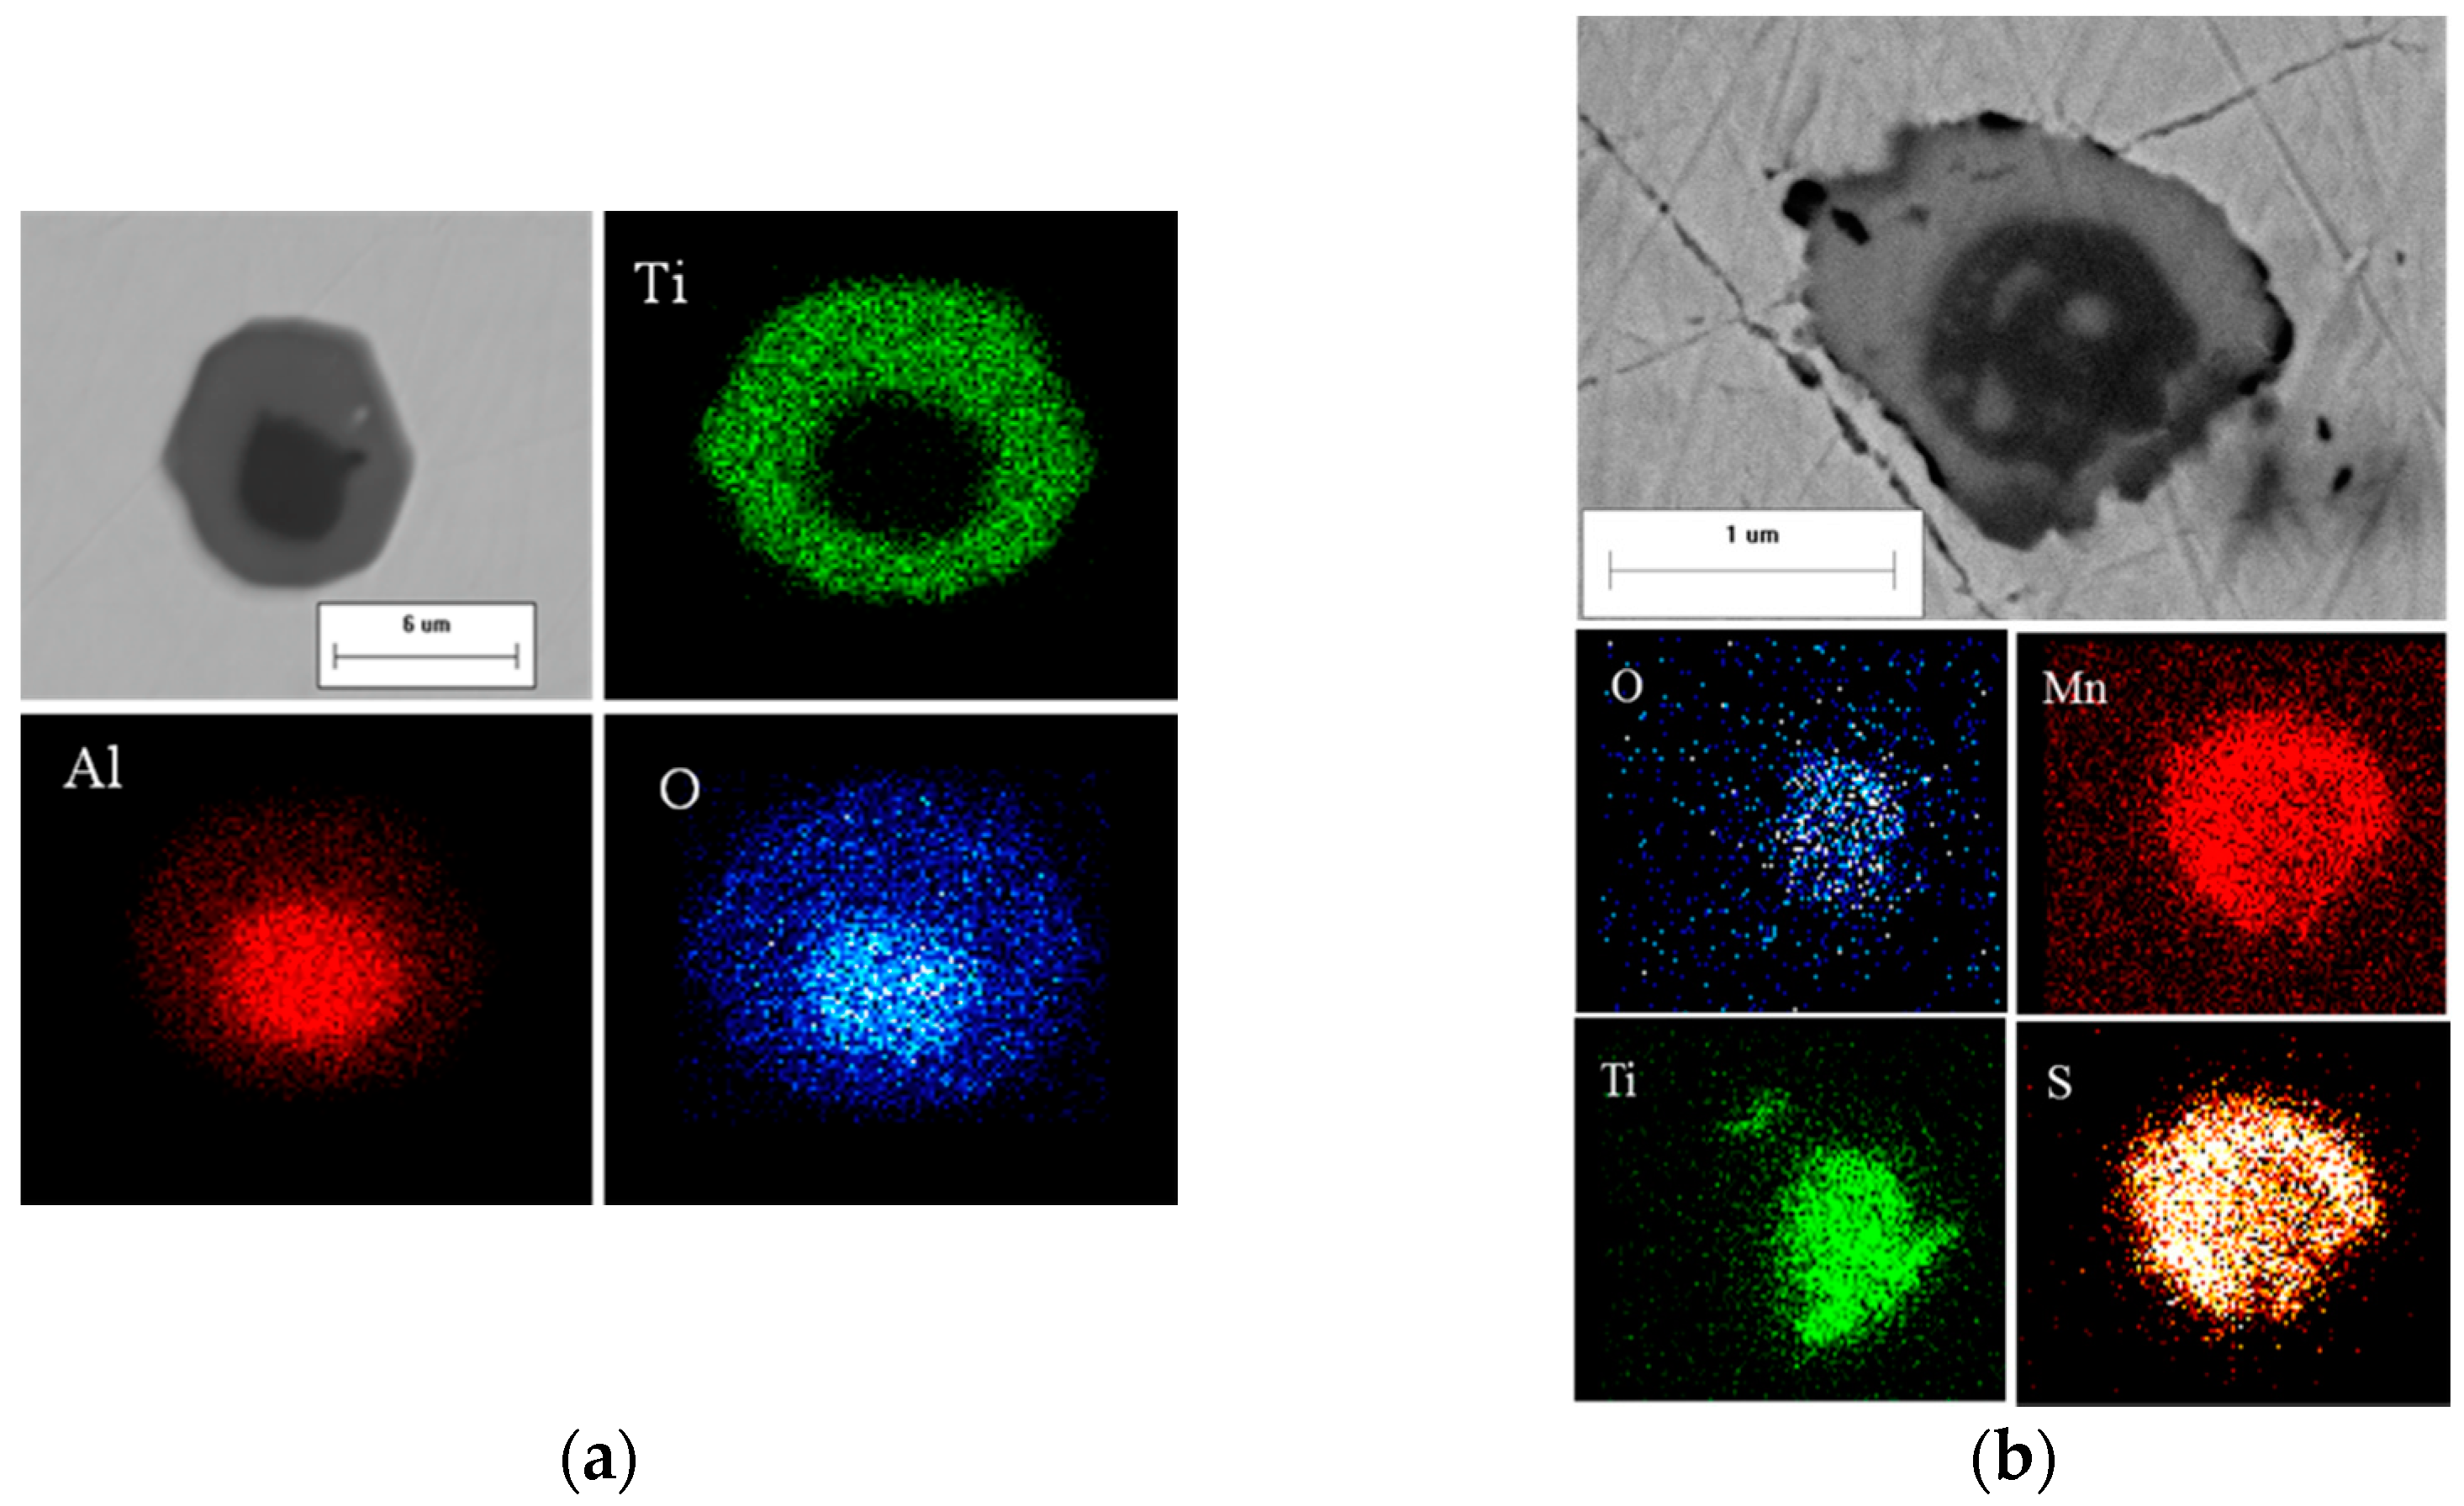
Figure 6.
The influence of alloying temperature on ASlag (a) size distribution and (b) mean diameter and total number at solidus and liquidus temperature.
Figure 6.
The influence of alloying temperature on ASlag (a) size distribution and (b) mean diameter and total number at solidus and liquidus temperature.
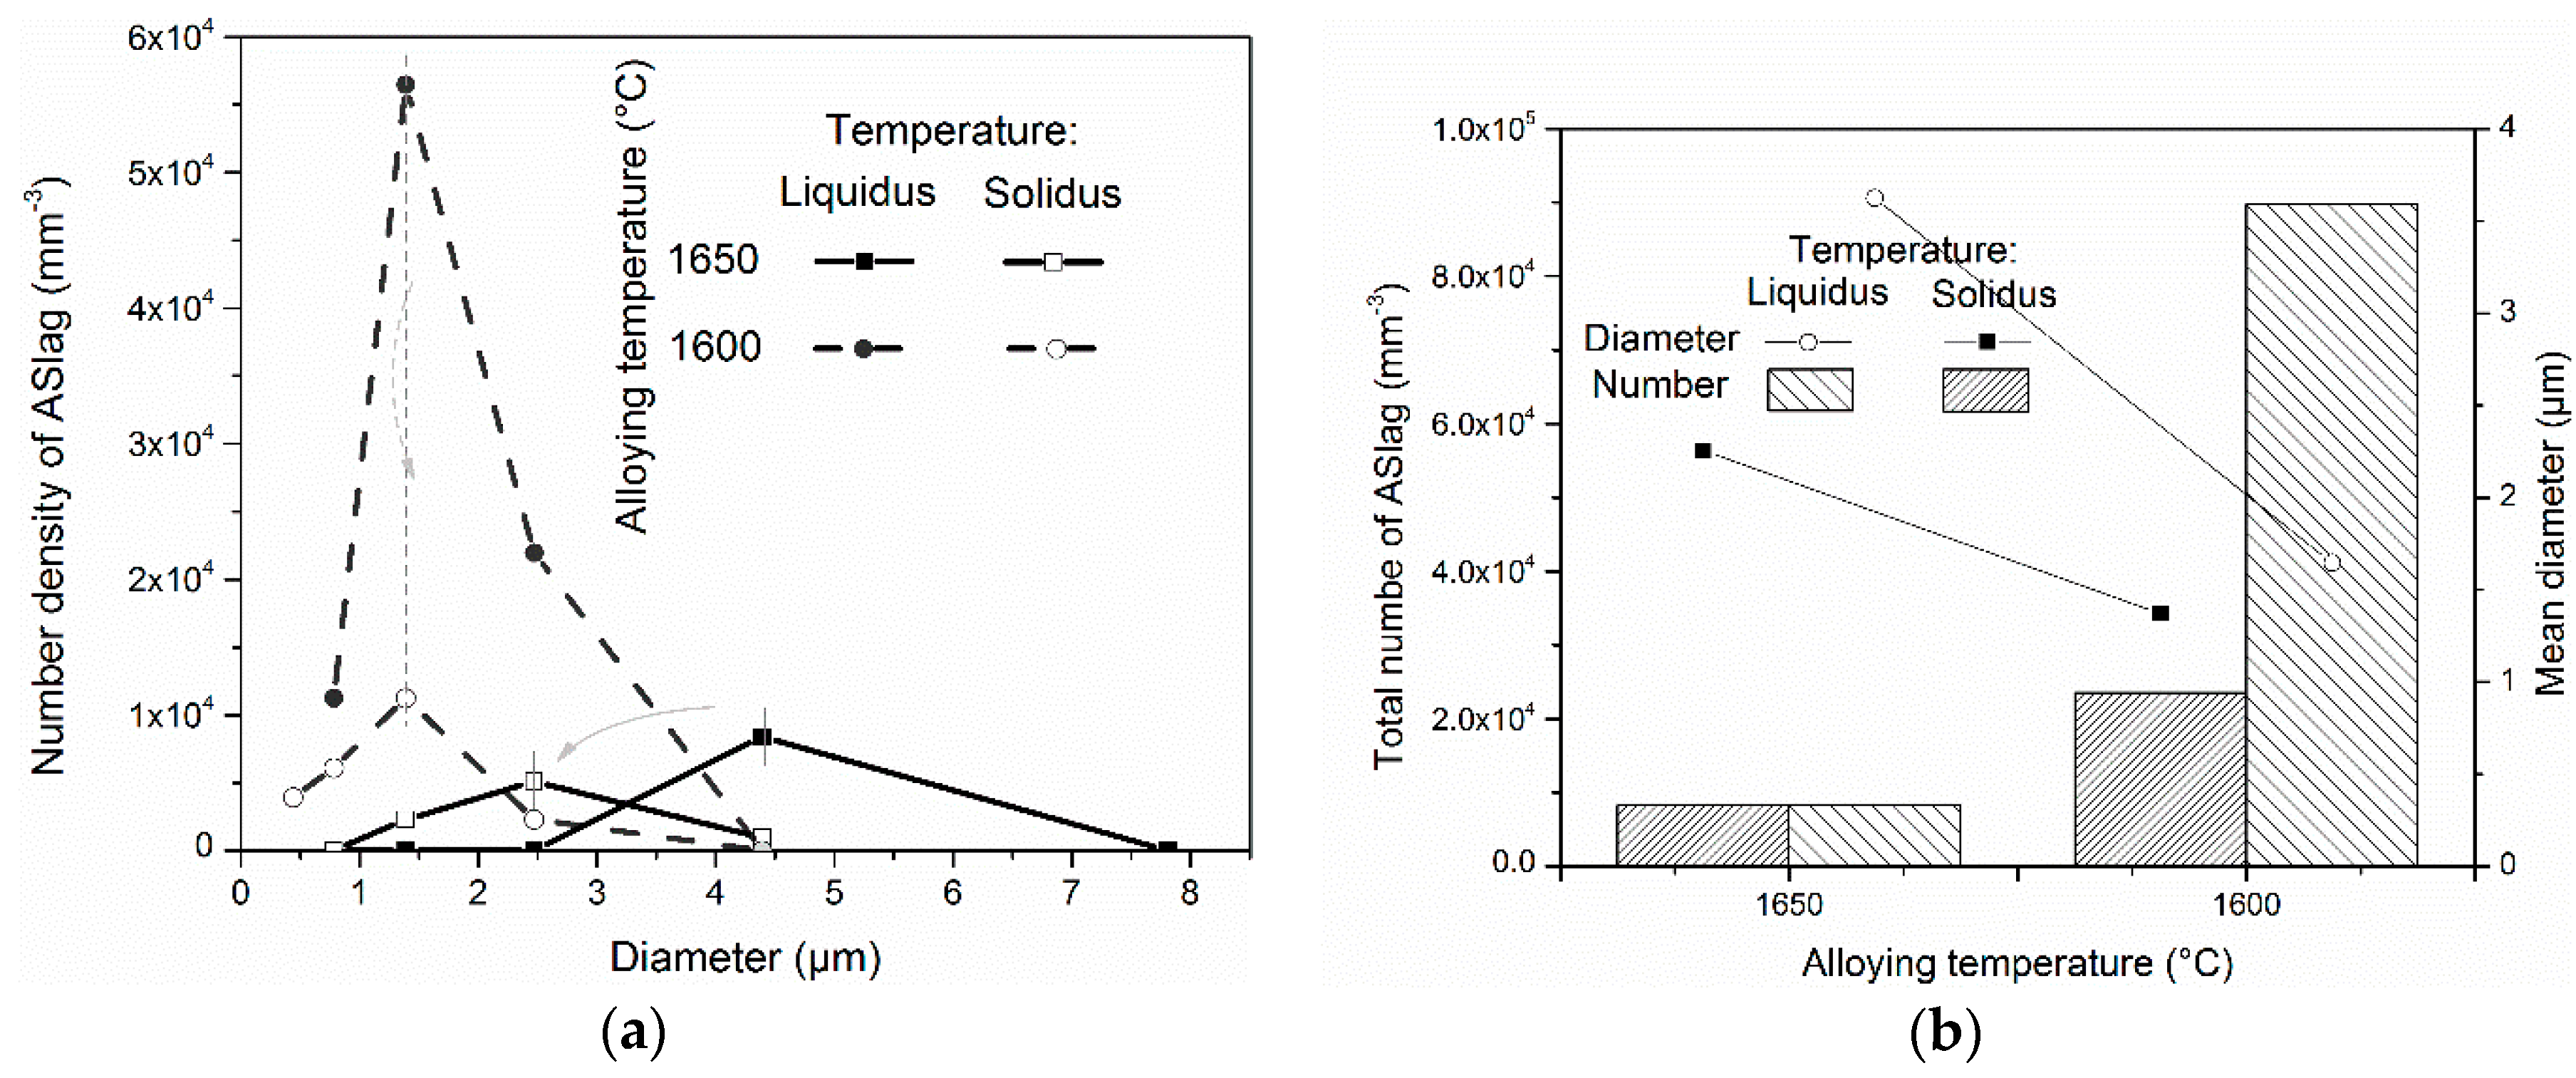
Figure 7.
The influence of alloying temperature on Ti3O5 (a) size distribution and (b) mean diameter and total number at solidus temperature.
Figure 7.
The influence of alloying temperature on Ti3O5 (a) size distribution and (b) mean diameter and total number at solidus temperature.
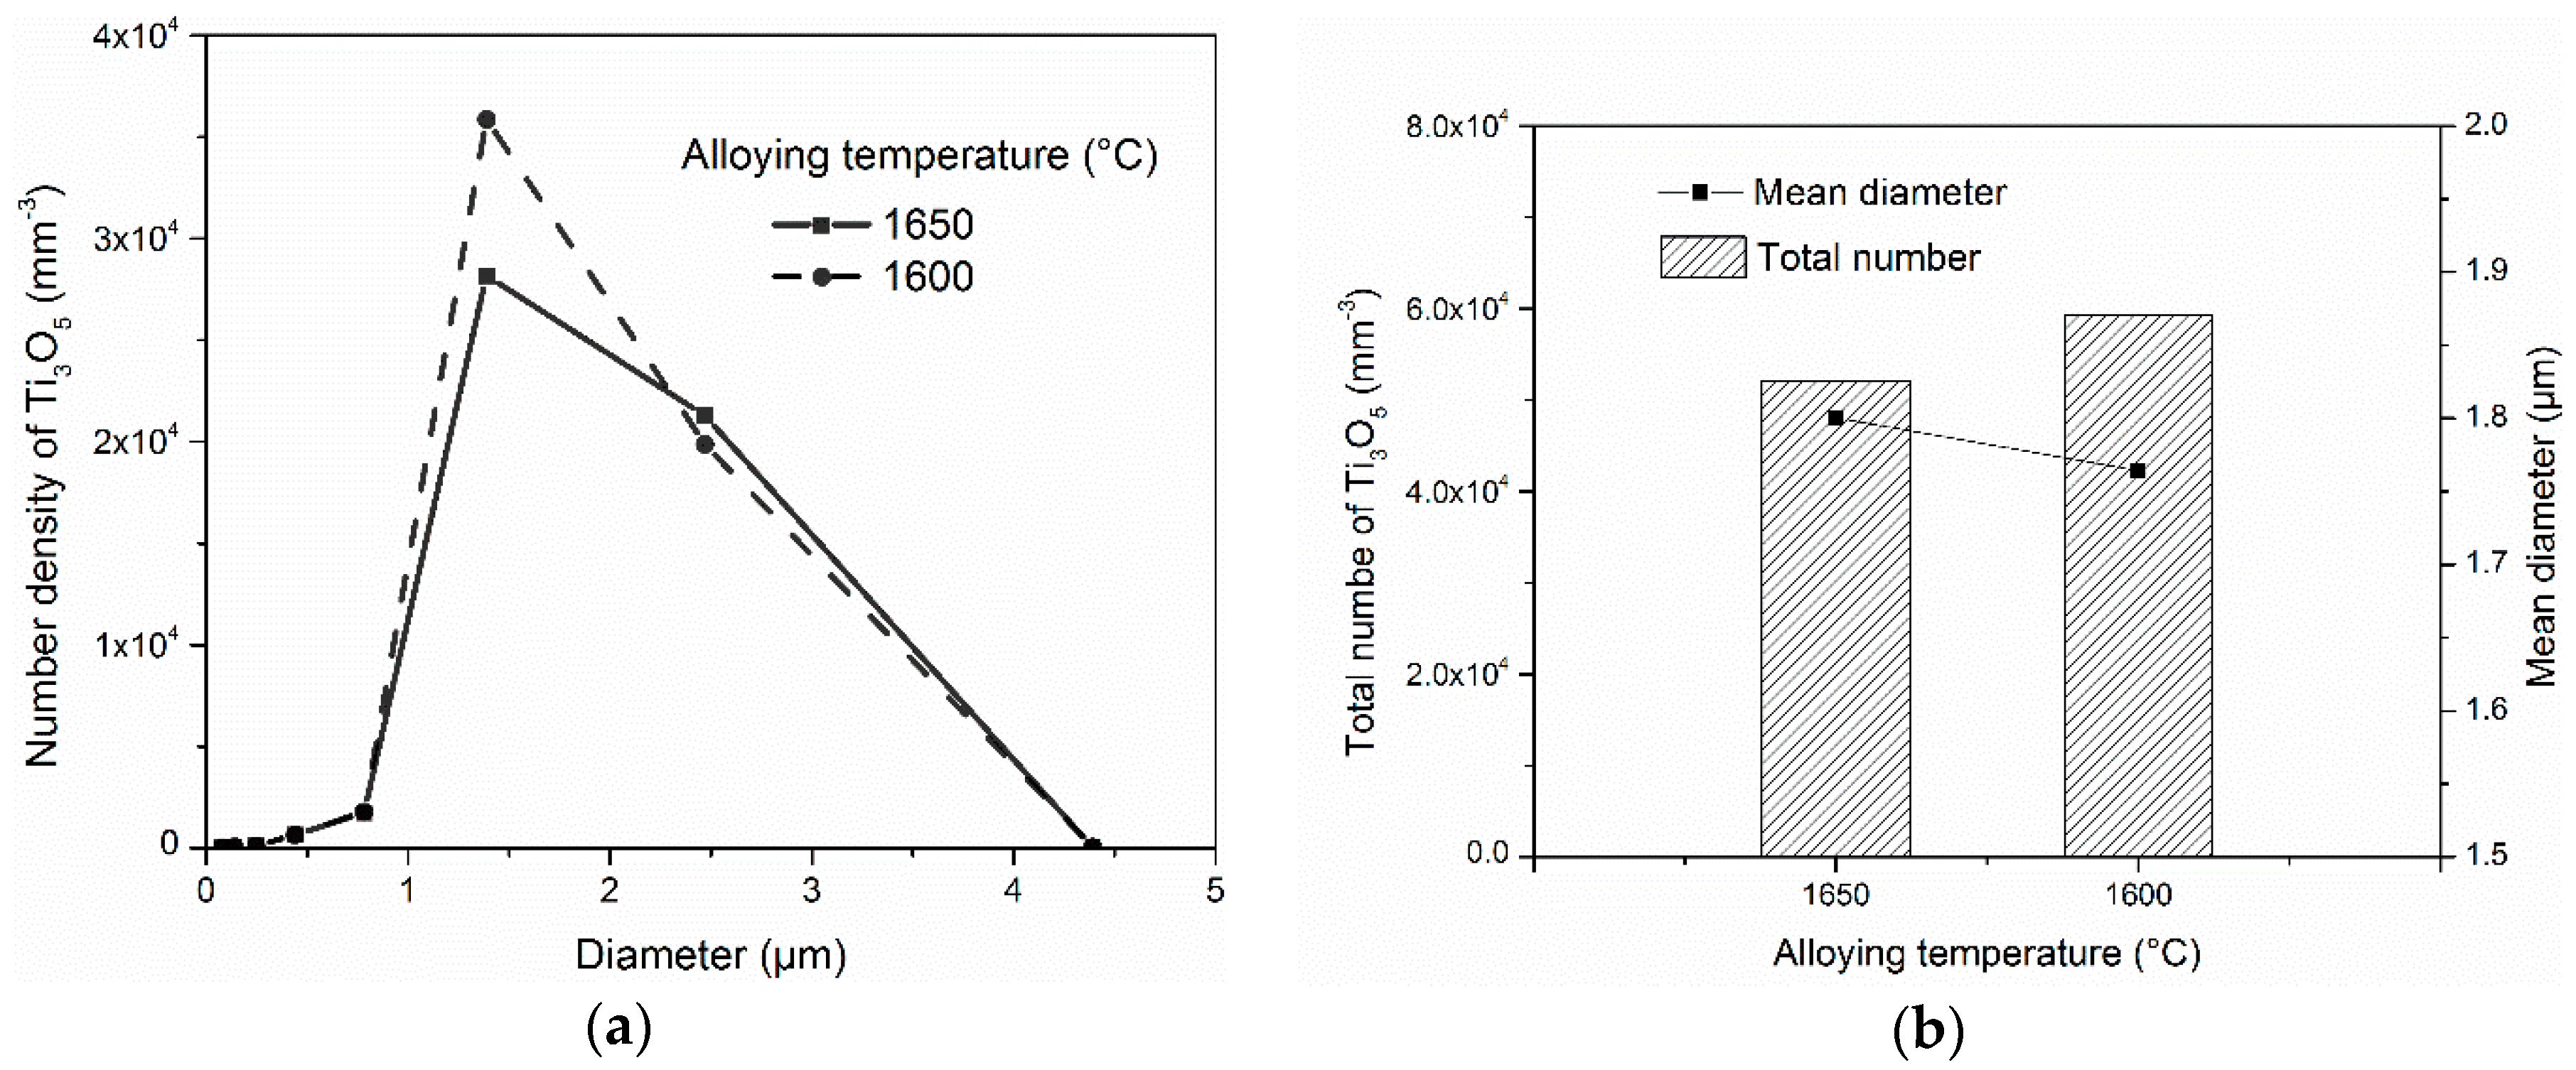
Figure 8.
Influence of oxygen content on the mass fraction of inclusions (top) and the corresponding oxygen concentration changes (bottom).
Figure 8.
Influence of oxygen content on the mass fraction of inclusions (top) and the corresponding oxygen concentration changes (bottom).

Figure 9.
Influence of oxygen content on the size distribution of (a) ASlag, (b) Ti3O5 and (c) Al2O3 at solidus temperature.
Figure 9.
Influence of oxygen content on the size distribution of (a) ASlag, (b) Ti3O5 and (c) Al2O3 at solidus temperature.


Figure 10.
Influence of oxygen content on the number and mean diameter of (a) ASlag, (b) Ti3O5 and (c) Al2O3.
Figure 10.
Influence of oxygen content on the number and mean diameter of (a) ASlag, (b) Ti3O5 and (c) Al2O3.

Figure 11.
Illustration of the competitive nucleation and growth of (a) ASlag and (b) Ti3O5 in the simulations with different oxygen contents.
Figure 11.
Illustration of the competitive nucleation and growth of (a) ASlag and (b) Ti3O5 in the simulations with different oxygen contents.

Table 1.
Parameters applied in the comprehensive model of the formation of multi-type inclusions [11,24,25,26].
| Symbol (Unit) | Name | Values | Symbol (Unit) | Name | Values |
|---|---|---|---|---|---|
| Solidification step () | 2.5 × 10⁻⁴ | Solidification step () | 2.5 × 10⁻⁵ | ||
| (°C) | Cooling step | 5.0 × 10⁻² | (µm) | Group width | 0.01 |
| Collision factor | 200 | (m−3·s−1) | Pre-exponent | 1033 | |
| (m2·s−1) | O diffusion coefficient in liquid | 6.0~12.0 × 10⁻⁹ | (m2·s−1) | Al diffusion coefficient in liquid | 3.0 × 10⁻⁹ |
| (m2·s−1) | Mn diffusion coefficient in liquid | 1.3 × 10⁻⁹ | (m2·s−1) | S diffusion coefficient in liquid | 2.1 × 10⁻⁹ |
| (m2·s−1) | Ti diffusion coefficient in liquid | 3.5 × 10⁻⁹ | (J·m−2) | Interfacial energy of Ti3O5 | 0.7 |
| (J·m−2) | Interfacial energy of Al2O3 | 0.7 | (J·m−2) | Interfacial energy of solution phase | 0.57 |
| (J·m−2) | Interfacial energy of MnS | 0.2 | (kg·m−3) | Density of liquid steel | 7.9 × 10³ |
| (m3·mol−1) | Molar volume of Ti3O5 | 5.3 × 10⁻⁵ | (m3·mol−1) | Molar volume of Al2O3 | 2.6 × 10⁻⁵ |
| (m3·mol−1) | Molar volume of Ti2O3 | 3.2 × 10⁻⁵ | (m3·mol−1) | Molar volume of TiO2 | 1.9 × 10⁻⁵ |
| (m3·mol−1) | Molar volume of MnO | 1.5 × 10⁻⁵ | (m3·mol−1) | Molar volume of MnS | 2.2 × 10⁻⁵ |
| (kg·m−3) | Density of Ti3O5 | 4.89 × 10³ | (kg·m−3) | Density of MnS | 4.0 × 10³ |
| (kg·m−3) | Density of Al2O3 | 3.97 × 10³ | (kg·m−3) | Density of Ti2O3 | 4.49 × 10³ |
| (kg·m−3) | Density of TiO2 | 4.26 × 10³ | (kg·m−3) | Density of MnO | 4.80 × 10³ |
| (J·K−1) | Boltzmann constant | 1.38 × 10⁻²³ | (kg·m−1s−1) | Dynamic viscosity of liquid steel | 6.2 × 10⁻³ |
Table 2.
Chemical composition of the selected steels (mass %).
| C | Si | Mn | S | P | Al | Ti | O (ppm) |
|---|---|---|---|---|---|---|---|
| 0.23 | 0.02 | 1.48 | 0.0074 | 0.0040 | 0.0051 | 0.0500 | 50/40/30 |
Table 3.
Comparison of the predicted and measured inclusions in the selected steel [15].
Table 3.
Comparison of the predicted and measured inclusions in the selected steel [15].
| Types | 1 | 2 | 3 | 4 | 5 |
|---|---|---|---|---|---|
| Measured | (Ti, Al, Mn)xOy | TiOx | MnS | Al2O3-TiOx | TiOx-MnS |
| Calculated | ASlag | Ti3O5 | MnS | Al2O3 | - |
| Corresponding | Yes | Yes | Yes | Possible | Possible |
© 2018 by the authors. Licensee MDPI, Basel, Switzerland. This article is an open access article distributed under the terms and conditions of the Creative Commons Attribution (CC BY) license (http://creativecommons.org/licenses/by/4.0/).
Share and Cite
MDPI and ACS Style
You, D.; Michelic, S.K.; Bernhard, C. Formation of Multi-Type Inclusions during the Cooling and Solidification of Steel: A Trend Model. Metals 2018, 8, 452. https://doi.org/10.3390/met8060452
AMA Style
You D, Michelic SK, Bernhard C. Formation of Multi-Type Inclusions during the Cooling and Solidification of Steel: A Trend Model. Metals. 2018; 8(6):452. https://doi.org/10.3390/met8060452
Chicago/Turabian StyleYou, Dali, Susanne K. Michelic, and Christian Bernhard. 2018. "Formation of Multi-Type Inclusions during the Cooling and Solidification of Steel: A Trend Model" Metals 8, no. 6: 452. https://doi.org/10.3390/met8060452
Note that from the first issue of 2016, this journal uses article numbers instead of page numbers. See further details here.