Electrochemical Properties of Nb-Substituted Zr-Ti-Ni Hydrogen Storage Alloy Negative Electrodes for Nickel-Metal Hydride Batteries


1
Frontier Research and Development Division, Aichi Steel Corporation, Tokai, Aichi 4768666, Japan
2
Department of Applied Chemistry, Graduate School of Engineering, Osaka Prefecture University, Sakai, Osaka 5998531, Japan
*
Author to whom correspondence should be addressed.
Metals 2018, 8(7), 473; https://doi.org/10.3390/met8070473
Submission received: 4 June 2018
/
Revised: 18 June 2018
/
Accepted: 18 June 2018
/
Published: 21 June 2018
(This article belongs to the Special Issue Metals and Alloys for Energy Conversion and Storage Applications)
Abstract
:Crystal structure, pressure-composition isotherms and electrochemical properties of the Zr0.6−xTi0.4NbxNi (x = 0.01, 0.02, and 0.05) alloys were investigated. Their X-ray diffraction profiles demonstrated that all the Zr0.6−xTi0.4NbxNi alloys consisted of the primary phase with the B33-type orthorhombic structure and the secondary phase with the B2-type Ti0.6Zr0.4Ni cubic structure. Rietveld refinement demonstrated that the atomic fraction of the secondary phase increased with the Nb content. The Zr0.6−xTi0.4NbxNi alloys were lower in hydrogen storage capacity than the Nb-free Zr0.6Ti0.4Ni alloy due to an increase in the abundance of the secondary phase. In the charge-discharge tests with the Zr0.6−xTi0.4NbxNi alloy negative electrodes, all the initial discharge curves had two potential plateaus due to the electrochemical hydrogen desorption of trihydride to monohydride and monohydride to alloy of the primary phase. The total discharge capacities at 333 and 303 K for the Zr0.58Ti0.4Nb0.02Ni alloy negative electrode were 384 and 335 mAh g−1, respectively, which were higher than those of the other Zr0.6−xTi0.4NbxNi and Zr0.6Ti0.4Ni alloy negative electrodes.
1. Introduction
Secondary batteries with high energy density, high power density, and long lifetime are needed because of the system interconnection of sustainable energy. Nickel-metal hydride (Ni-MH) batteries are known to have long lifetime and high-rate capability [1,2], but they exhibit lower gravimetric energy density than lithium ion batteries (LIBs). Nevertheless, the LIBs have a serious problem regarding safety because flammable organic electrolytes are used in them [3,4]. Therefore, it is meaningful to increase the energy density of the Ni-MH batteries with increased safety. For this purpose, it is essential to develop new negative electrode active materials with high capacity. The AB-type ZrNi hydrogen storage alloy is a promising negative electrode active material, because it has the theoretical capacity of 536 mAh g−1 [5], which was higher than that of the AB5- or AB3-type rare-earth-based commercial alloys [6,7]. We reported on the electrochemical properties of the ZrNi alloy negative electrode before and after the boiling alkaline surface treatment, and its discharge capacity after the treatment was 320 mAh g−1 at 333 K [8]. However, the large difference between the experimental and theoretical specific discharge capacity for the ZrNi alloy negative electrode was attributed to the stability of monohydride (β-ZrNiH) [8,9].
The way to destabilize hydrides is to reduce the lattice constant or the unit cell volume by partially replacing the alloy constituents with another element whose atomic radius is smaller [10,11]. Recently, we have reported on the ternary AB-type Zr1−xTixNi (0.05 ≤ x ≤ 0.5) alloys, in which the Zr constituent was partially replaced with Ti whose atomic radius is smaller than Zr (rZr = 1.60 Å and rTi = 1.47 Å), and have assessed their crystallographic, thermodynamic and electrochemical properties [12,13]. With an increase in the Ti content, the hydrides were destabilized due to the reduction of the unit cell volume of the primary phase. For the alloys with x ≥ 0.3, the discharge reaction of the monohydride to alloy partially proceeded, leading to the increase in the total discharge capacity. Moreover, the alloy with x = 0.4 exhibited the maximum discharge capacity of 349 mAh g−1 at 333 K [13]. Thus, the lattice shrinkage for the Zr1−xTixNi (0.05 ≤ x ≤ 0.5) alloys also caused the destabilization of their hydrides. Nevertheless, there are still large differences between the experimental and theoretical discharge capacities. To improve the utilization of the Zr-Ti-Ni alloys, additional replacement of the constituents with other foreign metals will be needed. Niobium (Nb) is a suitable element because its atomic radius (rNb = 1.46 Å) is smaller than that of Zr and Ti, which can cause lattice shrinkage or the destabilization of the hydride. In addition, Nb is higher in electronegativity (χ) than Zr and Ti (χNb = 1.60, χZr = 1.33 and χTi = 1.54). Nakano et al. reported the effect of the Nb substitution of the AB2-type Zr-based Zr1−xMx(V0.10Ni0.49–0.57Mn0.30–0.36Co0.05)2.1 (M = Ti or Nb, 0 ≤ x ≤ 0.1) in Laves-phase alloys [14]. The difference between the average electronegativity (χave) of the constituents and the χ of hydrogen (χH = 2.20) decreased with an increase in the Ti or Nb content, leading to the destabilization of the hydrides [14]. So, the replacement of Zr and Ti with Nb will increase χave or decrease the difference between χave and χH, which causes the destabilization of the hydrides. However, so far, there has been no investigation of the effect of the Nb substitution on the electrochemical properties of the AB-type ZrTiNi hydrogen storage alloys.
In this study, the Zr0.6Ti0.4Ni alloy was chosen as a fundamental alloy because it exhibited the best negative electrode performances in our previous study [13], and Nb was substituted for the Zr constituent. The effect of the Nb substitution on the crystal structure, hydrogen absorption, and electrochemical properties of the Zr0.6Ti0.4Ni alloy was investigated.
2. Materials and Methods
2.1. Sample Preparation
The Zr0.6−xTi0.4NbxNi (x = 0.01, 0.02, and 0.05) alloys were prepared according to the previous method [12,13]. Briefly, an ingot of each alloy was prepared by arc-melting a mixture of element constituents (Zr wire-cut rod 99.0%, Ti powder 99.0%, Nb powder 99.9%, and Ni powder 99.9% purities, Kojundo Chemical Laboratory Co, LTD., Sakado, Japan) in a water-cooled copper mold in an Ar atmosphere. Before the arc-melting, the residual oxygen in the apparatus was removed to melt a piece of Ti a few times. The ingot was turned over and remelted five times to ensure homogeneity, and then, it was pulverized and sieved between 20 and 40 μm in diameter.
2.2. Material Characterization
The chemical composition of the Zr0.6−xTi0.4NbxNi (x = 0.01, 0.02, and 0.05) alloy powders was analyzed by induced couple plasma spectroscopy (ICPS, ICPV-1017, Shimadzu, Kyoto, Japan). The ICPS measurement was carried out according to our previous report [12].
The crystallographic characterization of the Zr0.6−xTi0.4NbxNi (x = 0.01, 0.02, and 0.05) alloy powders was carried out by X-ray diffractometry (XRD, D8 ADVANCE, Bruker AXS, Madison, WI, USA) with CuKα radiation (λ = 0.1541 nm, 40 kV, 40 mA). The lattice parameters (a, b, c) and unit cell volume (VM) were refined by Rietveld analysis using Z-Rietveld software (ver.1.0.2) [15,16]. In the Rietveld refinement, the initial composition for the primary and secondary phases was taken as Zr0.59Ti0.4Nb0.01Ni and Ti0.59Zr0.4Nb0.01Ni for x = 0.01, Zr0.58Ti0.4Nb0.02Ni and Ti0.58Zr0.4Nb0.02Ni for x = 0.02, and Zr0.55Ti0.4Nb0.05Ni and Ti0.55Zr0.4Nb0.05Ni for x = 0.05, respectively. The lattice parameters (a, b, and c) calculated from the experimental XRD pattern for each alloy were taken as the initial values [12]. The atomic coordinates reported by Matar [17] and Cuevas et al. [18] were used as those of the primary and secondary phases, respectively.
2.3. Hydrogen Storage Property
The hydrogen storage properties for the Zr0.6−xTi0.4NbxNi (x = 0.01, 0.02, and 0.05) alloy powders were examined with pressure-composition isotherms (PCT curves) at 423 K using a Sieverts-type apparatus (PCT-6-4SDMDWIN, Suzuki Shokan, Tokyo, Japan). Before the PCT measurement, the initial activation treatment was performed according to the previous procedure [12]. Each sample was placed into a stainless-steel reactor tube in an Ar-filled glove box, heated in vacuum at 473 K for 1 h, and gradually introduced at 0.9 MPa H2 pressure. After the reactor tube was heated to 623 K, it was evacuated at the same temperature for 2 h. After the initial activation, the hydrogen pressure was set to 0, and the PCT curves at 423 K were measured in the H2 pressure from 0 to 0.92 MPa.
2.4. Electrochemical Property
The Zr0.6−xTi0.4NbxNi (x = 0.01, 0.02, and 0.05) negative electrodes were prepared according to the previous method [8,9,13]. Briefly, the Zr0.6−xTi0.4NbxNi (x = 0.01, 0.02, and 0.05) powders (42.5 mg), Cu powders (5 mg), and 10 mass% polyvinyl alcohol aqueous solution (25 μL) were mixed to make a paste, and the paste was filled into a Ni mesh as a current collector. For the activation treatment, the resultant Zr0.6−xTi0.4NbxNi negative electrodes were soaked in a boiling 6 M KOH alkaline solution for 4 h [8,9]. The positive and reference electrodes were NiOOH/Ni(OH)2 and Hg/HgO electrodes, respectively. The electrolyte solution (100 mL) was a 6 M KOH aqueous solution containing 1 M LiOH.
Charge-discharge cycle tests were performed following our previous report [13]. Each negative electrode was charged at 100 mA g−1 for 5 h and discharged at 25 mA g−1 to a cut off potential of −0.5 V versus Hg/HgO. After charging and discharging, the circuit was opened for 10 min. For evaluating high-rate dischargeability (HRD), each negative electrode was charged at 100 mA g−1 for 5 h and then discharged at 25–200 mA g−1 to −0.5 V versus Hg/HgO. Each measurement was carried out at 333 and 303 K. After each cycle test, the concentration of each element dissolving in the electrolyte was measured by inductively coupled plasma spectroscopy (ICPS).
Alternative current (AC) impedance measurement was conducted in a frequency range of 64 kHz to 0.1 Hz with an amplitude of 5 mV at 303 K. Prior to the measurement, each negative electrode was charged at 100 mA g−1 for 5 h, and then, its potential was kept open for 1 h. All electrochemical properties were measured by VMP3 (Bio-Logic, Claix, France).
3. Results and Discussions
3.1. Structural Characteristics of the Zr1−xTi0.4NbxNi (x = 0.01, 0.02, and 0.05) Alloys
The chemical composition of the Zr0.6−xTi0.4NbxNi (x = 0.01, 0.02, and 0.05) alloy powders analyzed by ICPS is listed in Table 1. In each case, the experimental composition was similar to the theoretical one. The error of these experimental data was ±0.1 at%.
The red curves in Figure 1 show the experimental XRD patterns for the Zr0.6−xTi0.4NbxNi (x = 0.01, 0.02, and 0.05) alloy powders. The blue curves in Figure 1 show the profiles refined by the Rietveld method, and the gray curves show the difference between the experimental and calculated diffraction intensities. As can be seen from each gray curve, the difference was small, so the experimental profile is reasonably well fitted with the theoretical model in each case. Rwp and S are named the residue of the weighted pattern and goodness-of-fit indicator, respectively [19,20]. The Rietveld refinement demonstrated that each alloy consisted of two phases, the primary phase with the B33-type ZrNi orthorhombic structure [12,17] and the secondary phase with the B2-type Ti0.6Zr0.4Ni cubic structure [12,18], which are indicated by the green and yellow bars in Figure 1, respectively.
Composition, lattice parameters (a, b, c) and unit cell volume (V) estimated by the Rietveld refinement for each phase of the Zr0.6−xTi0.4NbxNi (x = 0.01, 0.02, and 0.05) alloy powders are summarized in Table 2. All the lattice parameters and unit cell volume of the primary phase in Table 2 slightly decreased with an increase in the x value because of the Nb substitution. The fractions of two phases for the Nb-substituted alloys were evaluated by the Rietveld refinement and summarized in Table 2. The fraction of the secondary phase increased with x value. Nb is known to stabilize the β-phase Ti and Ti-based alloys with the body-centered cubic (BCC) structure [21,22,23]. So, in the present study, Nb seems to promote the segregation of the secondary phase, causing the increase in the intensity of the diffraction peak around 41.0 degree in Figure 1.
3.2. Hydrogen Storage Properies of the Zr1−xTi0.4NbxNi (x = 0.01, 0.02, and 0.05) Alloys
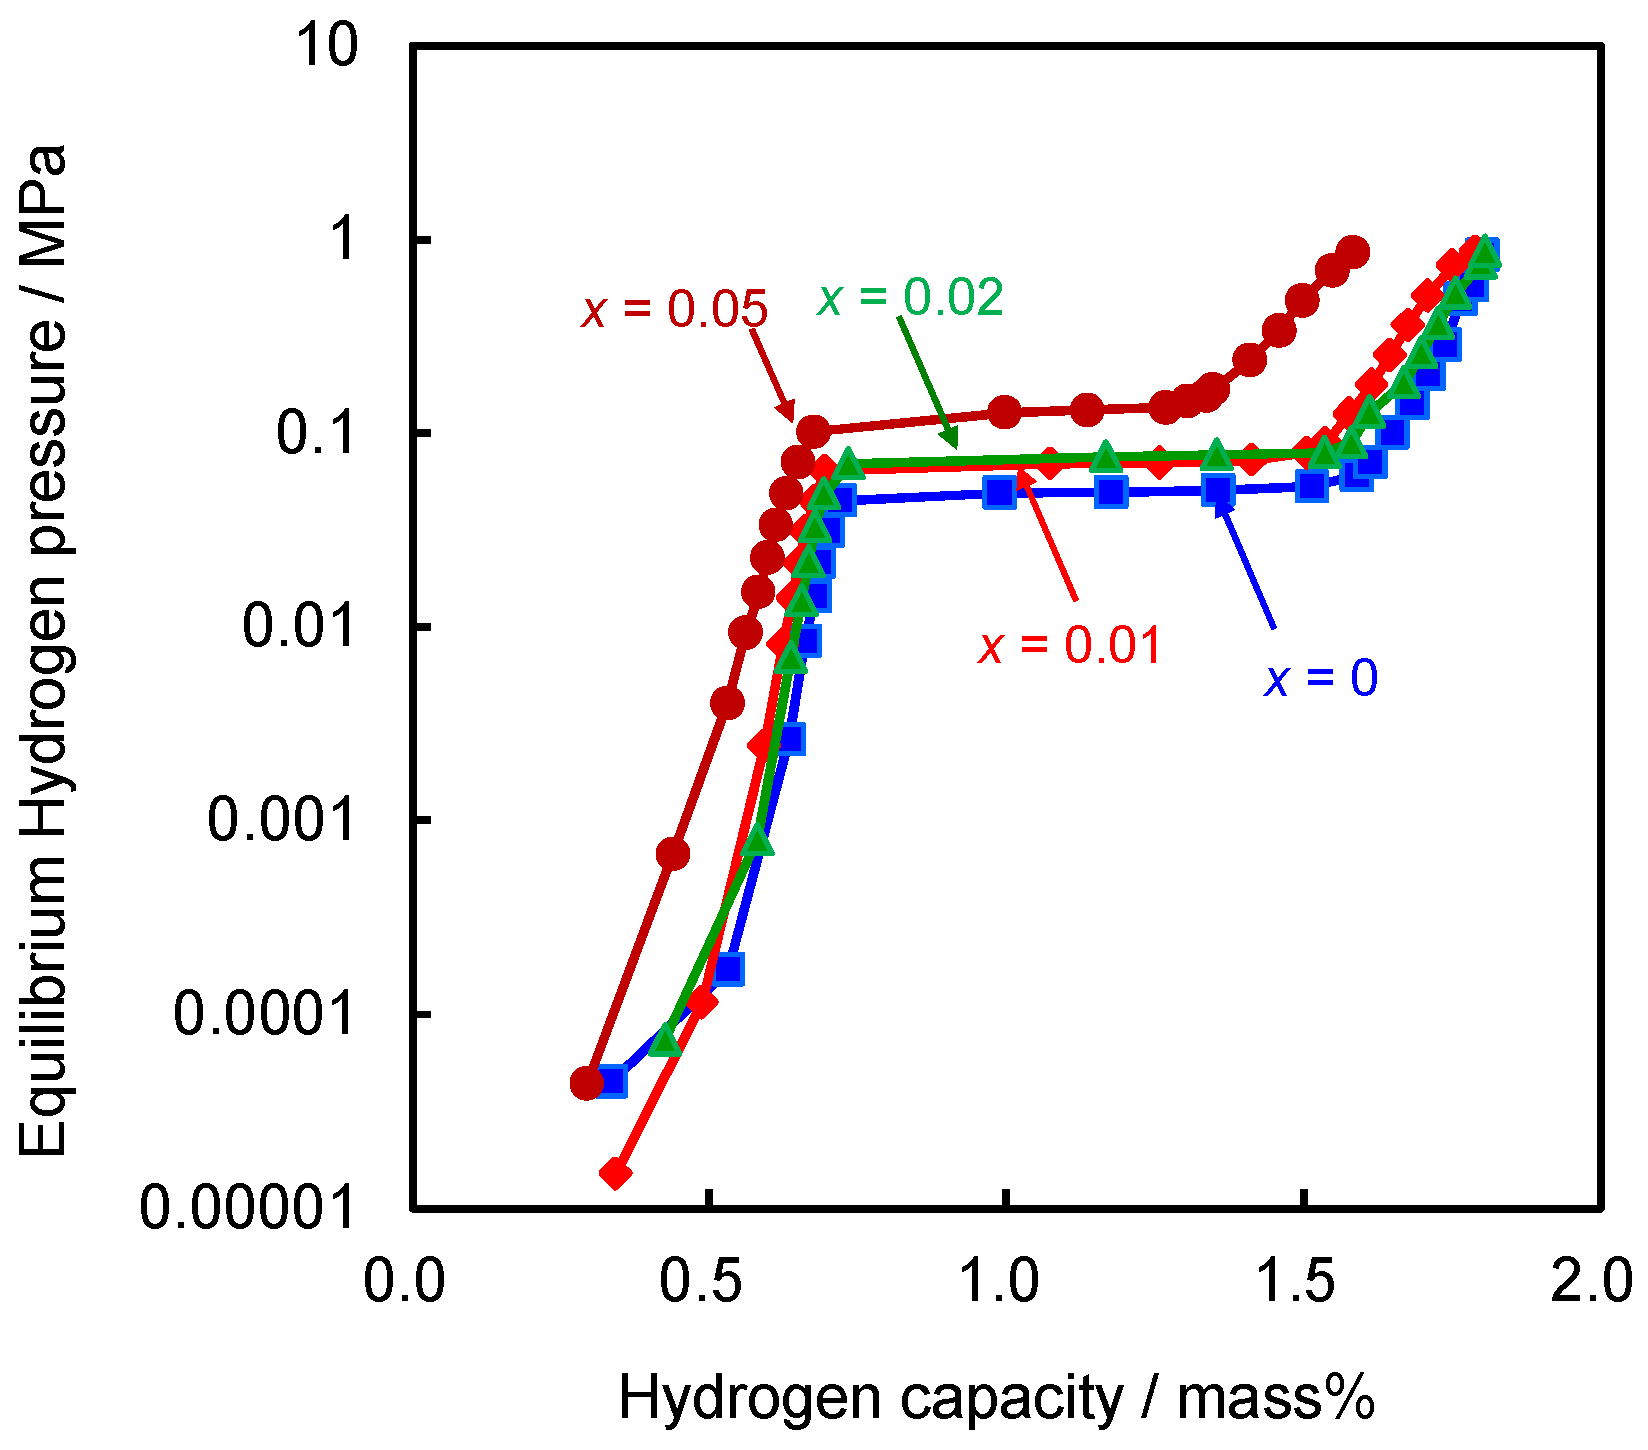
Figure 2 shows the PCT curves in the hydrogen absorption process at 423 K for the Zr0.6−xTi0.4NbxNi (x = 0, 0.01, 0.02, and 0.05) alloy powders.
The plateau region for each alloy is mainly assigned to the transformation from monohydride to trihydride of the primary phase, because the abundance of the primary phase was much higher than that of the secondary phase, as shown in Table 2. The hydrogen storage capacities at 0.5 MPa and the plateau pressure at 423 K were summarized in Table 3. Hydrogen storage capacity can be influenced by the lattice volume and abundance of the primary phase [12]. The plateau pressure at 423 K increased with the Nb content mainly due to the destabilization of hydrogen absorbed in the primary phase. The unit cell volume, however, barely decreased with an increase in the Nb content, as shown in Table 2, so the change in the unit cell volume will minorly contribute to the destabilization of the hydride. The χave value is defined by the following equation [14]:
where ni and χi are the number and electronegativity of constituent i, respectively. Nakano et al. reported that when the χave value for the Zr-based Laves-phase alloy increased by 0.01, the enthalpy change for the hydride formation increased by about 3 kJ mol(H2)−1 [14], suggesting that the stability of hydride is sensitive to χave. In the present study, χave of the primary phase increased with the x value or the Nb content, as shown in Table 3, suggesting that the difference between χave of the primary phase and χH decreased or hydrogen in the primary phase was destabilized. Therefore, the destabilization of hydrogen absorbed in the primary phase with the Nb substitution can be largely attributed to the electronic effect.
χave = ∑(ni χi)/∑ ni
3.3. Electrochemical Properties of the Zr0.6−xTi0.4NbxNi (x = 0.01, 0.02, and 0.05) Alloys
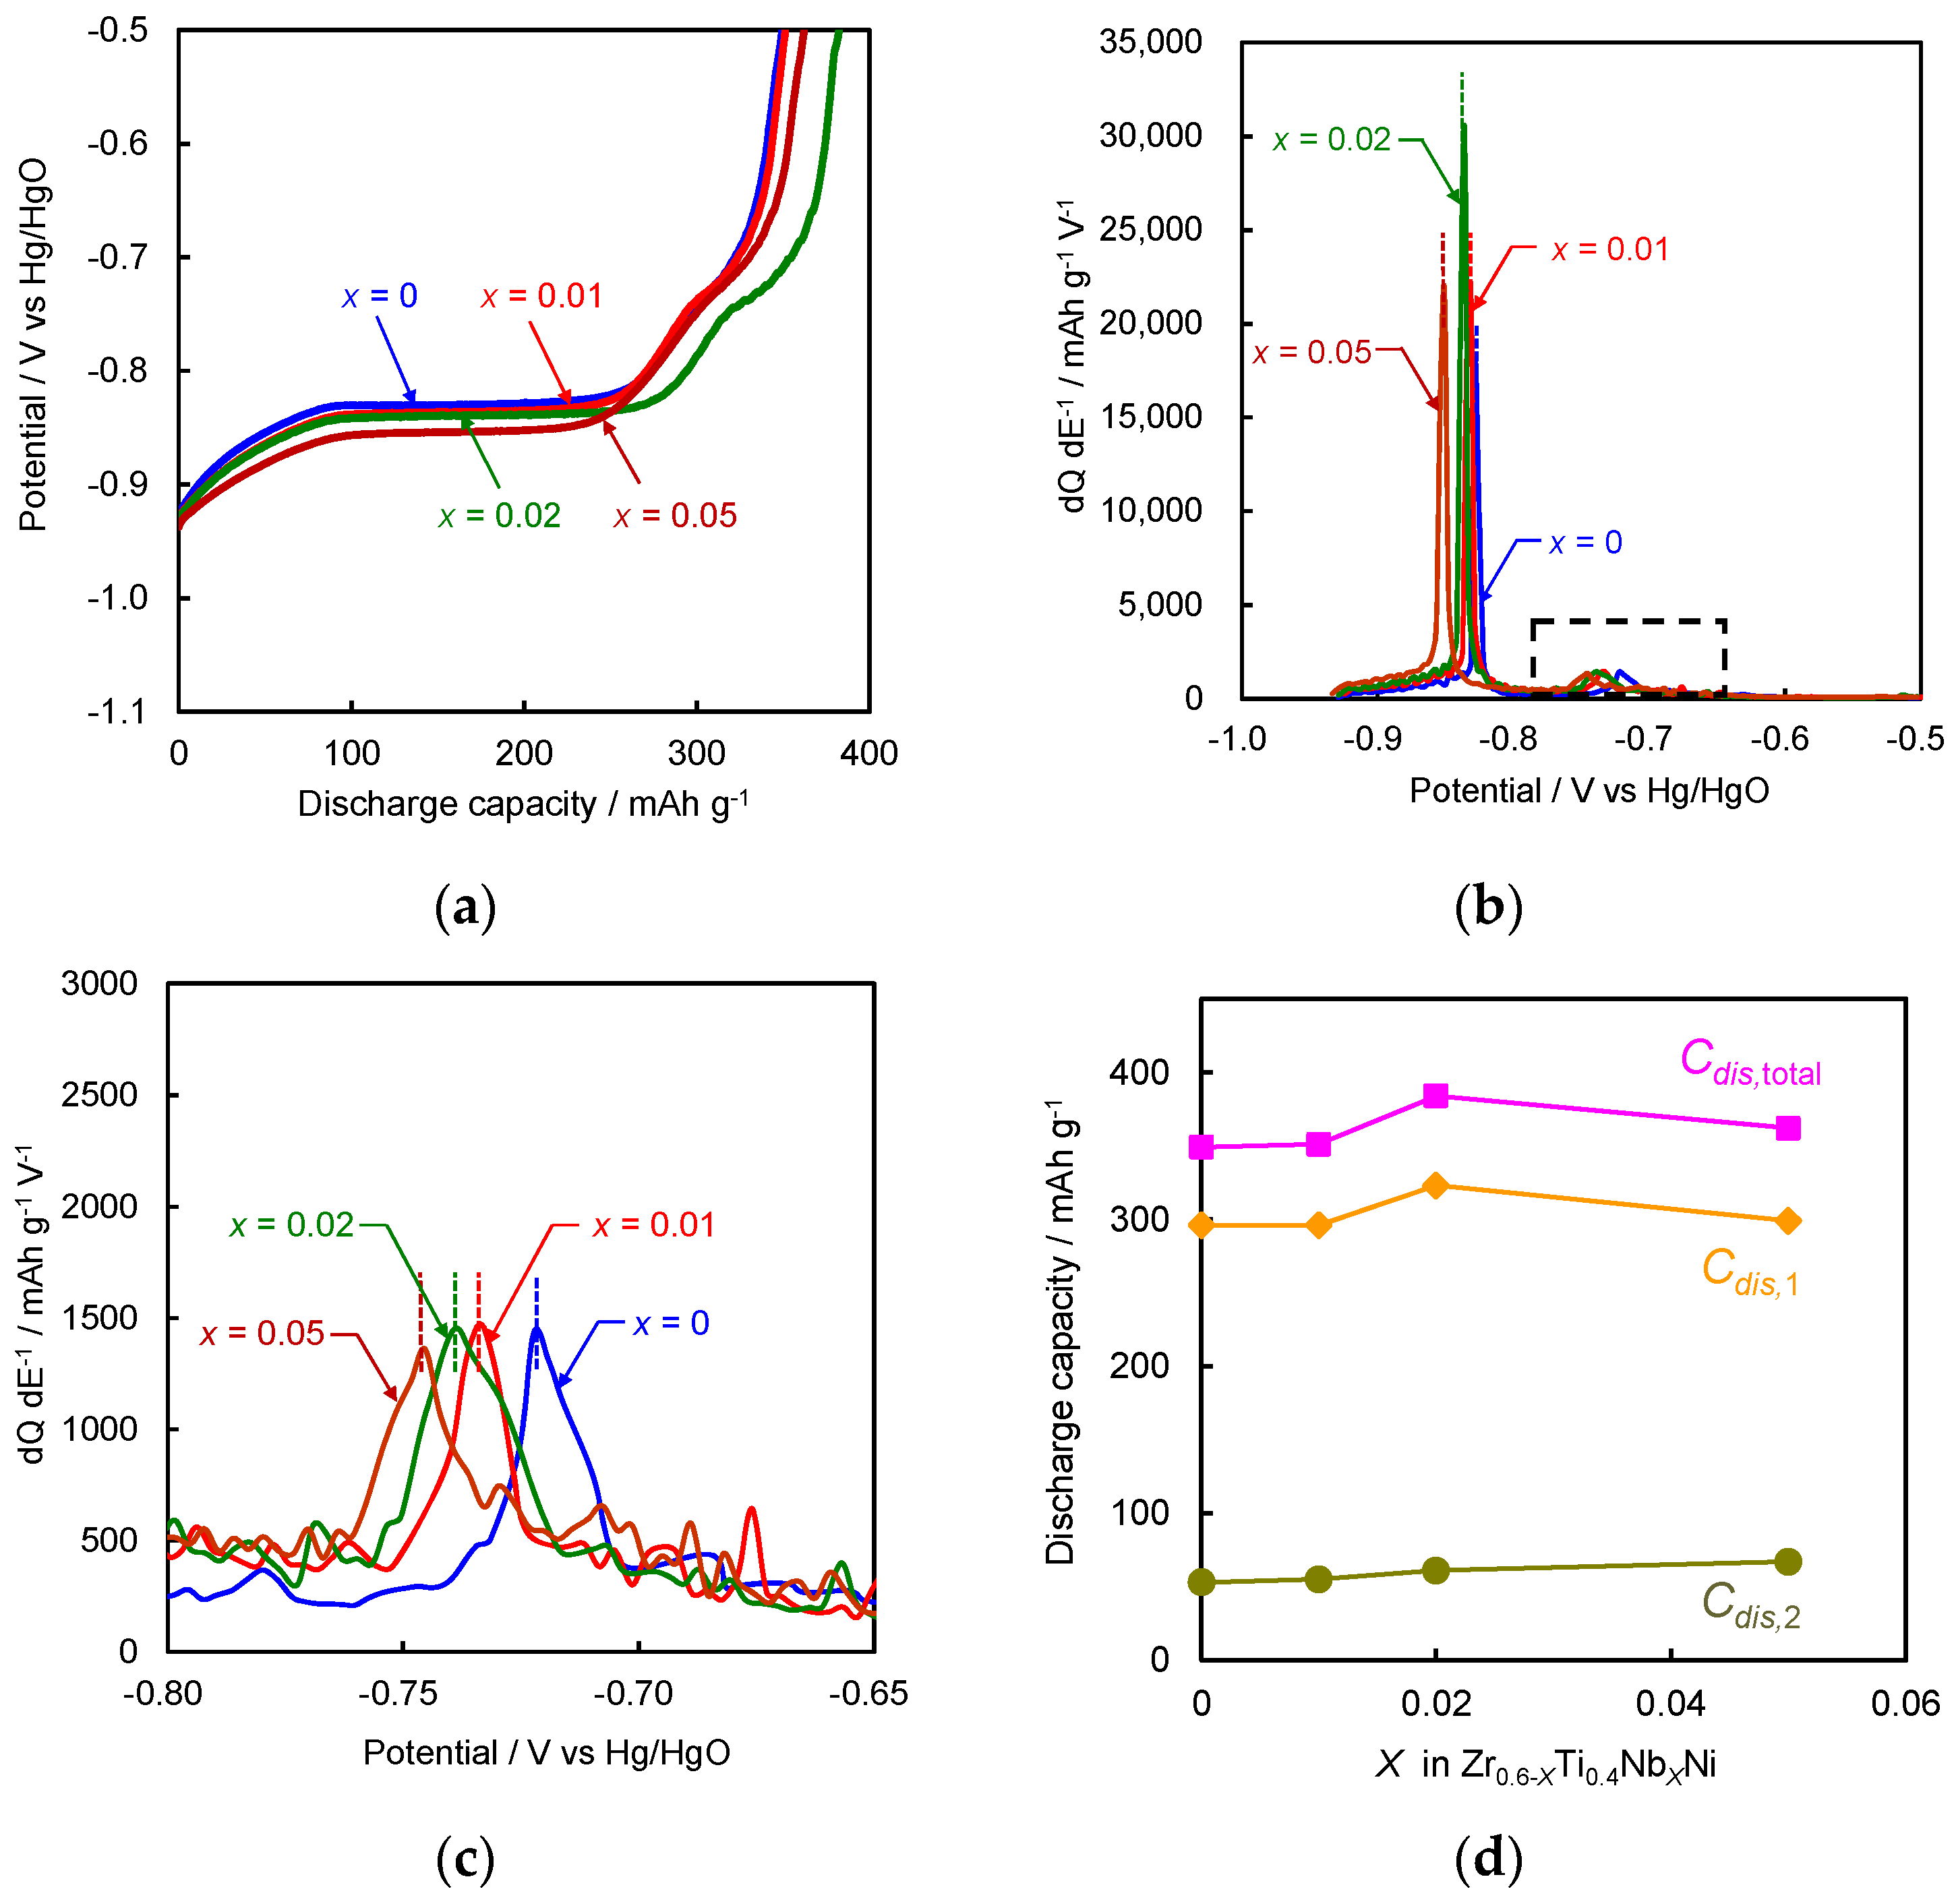
The initial discharge curves of the Zr0.6−xTi0.4NbxNi (x = 0, 0.01, 0.02, and 0.05) negative electrodes at 333 K are shown in Figure 3a. Each discharge curve was divided by two potential plateau regions. The total discharge capacity (Cdis,total) defined by the sum of two plateaus is summarized in Table 4. The Cdis,total value exhibited the maximum at the Nb content of x = 0.02. The first and second discharge potential plateaus at the lower and higher potentials are attributed to electrochemical hydrogen desorption of trihydride to monohydride and monohydride to alloy of the primary phase, respectively [12]. To precisely estimate the plateau potential, the differential capacity (dQ dE−1) curves in Figure 3a are shown in Figure 3b,c. Figure 3c is the enlarged area between −0.80 and −0.65 V in Figure 3b. The discharge potentials for the lower and higher potential plateaus (E1 and E2) were defined as the first and second plateau potentials, respectively [23] and are summarized in Table 4. From Table 4, both E1 and E2 shifted to the lower potentials with an increase in the Nb content. This suggests the trihydride and monohydride of the primary phase were destabilized by the Nb substitution. In this way, the Nb substitution was effective for improving the destabilization of both trihydride and monohydride of the primary phase, which seems to be largely due to the electronic effect as mentioned above.
The discharge capacities in the first and second plateau regions (Cdis,1 and Cdis,2) were defined as the charge passed from the beginning of the discharge process to the inflection point between two peaks in each differential curve [13] and are summarized in Figure 3d. The Cdis,1 was the highest for the alloy with x = 0.02, which showed a similar trend as the Cdis,total, because hydrides of the primary phase were destabilized by the increase in the Nb content. However, the Cdis,1 value for the alloy with x = 0.05 decreased, because the abundance of the secondary phase greatly increased as shown in Table 2. The Cdis,2, which was defined as (Cdis,total−Cdis,1), is also shown in Figure 3d. The Cdis,2 gradually increased with the Nb content due to the destabilization of monohydride of the primary phase.
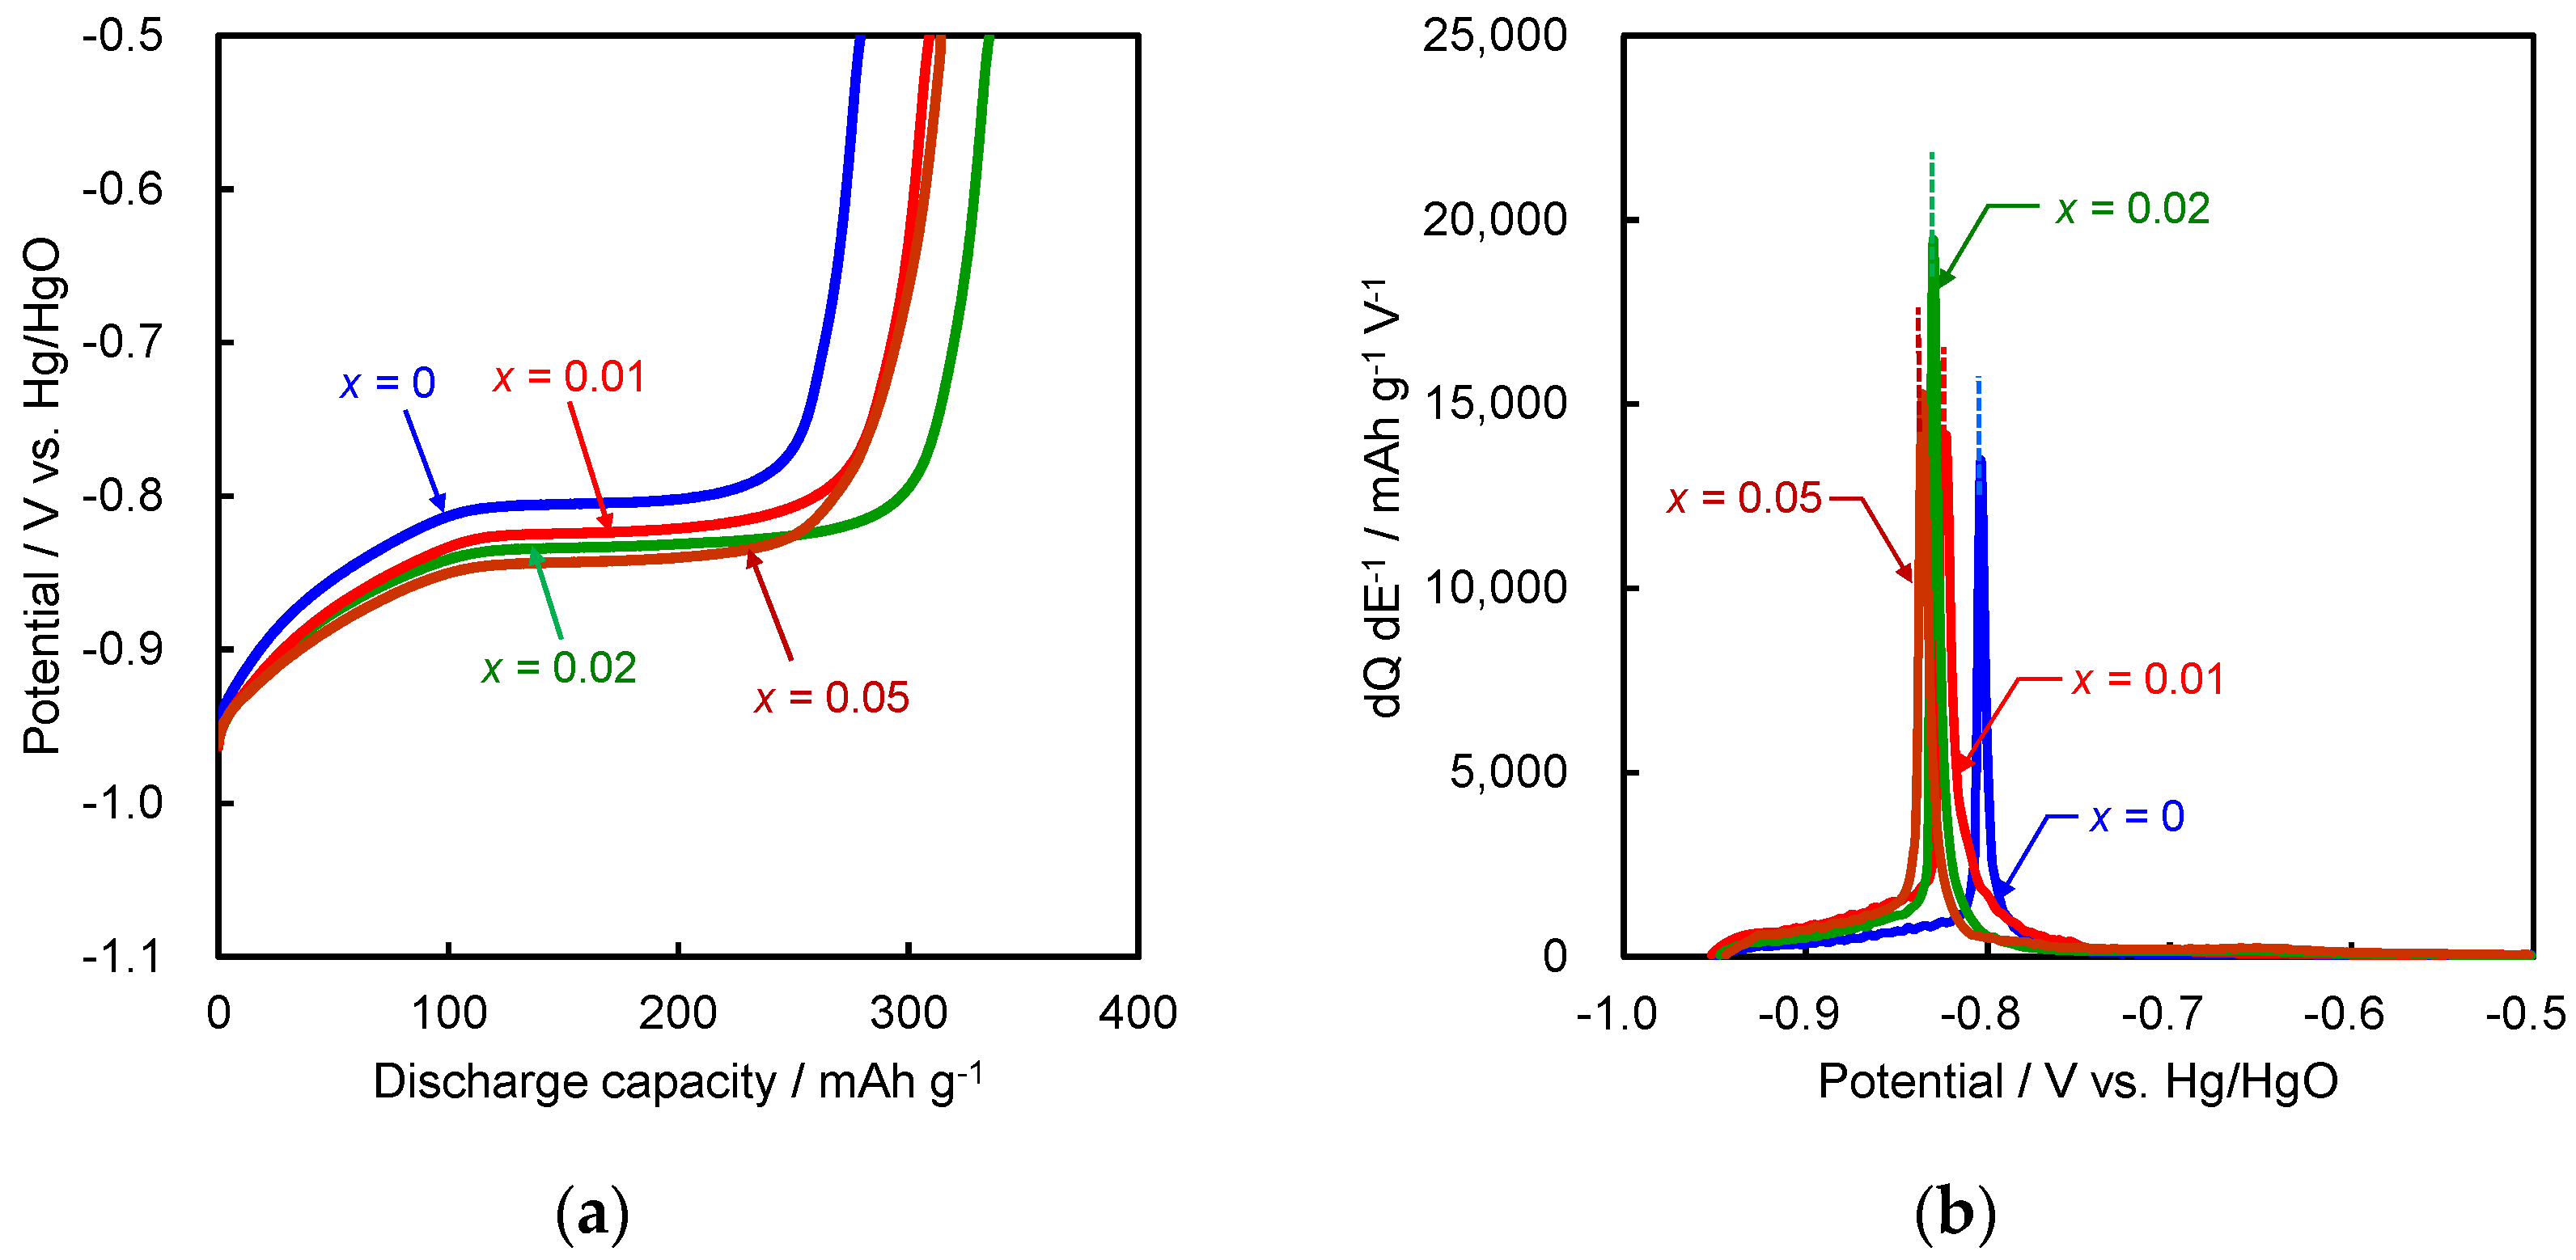
Figure 4a shows the initial discharge curves of the Zr0.6−xTi0.4NbxNi (x = 0, 0.01, 0.02, and 0.05) negative electrodes at 303 K. In Figure 4a, the second plateau region was not distinctly observed in all discharge curves, suggesting that the monohydride of the primary phase scarcely desorbed hydrogen at 303 K. The Cdis,total for each alloy is summarized in Table 5. This table showed that the Nb substitution was effective for improving discharge capacity even at 303 K. The differential capacity (dQ dE−1) curve for each discharge curves in Figure 4a is shown in Figure 4b. The E1 value for each negative electrode is summarized in Table 5. As can be seen from this table, the E1 value negatively shifted with increasing the Nb content, suggesting that the trihydride of the primary phase is destabilized even at 303 K due to the electronic effect.
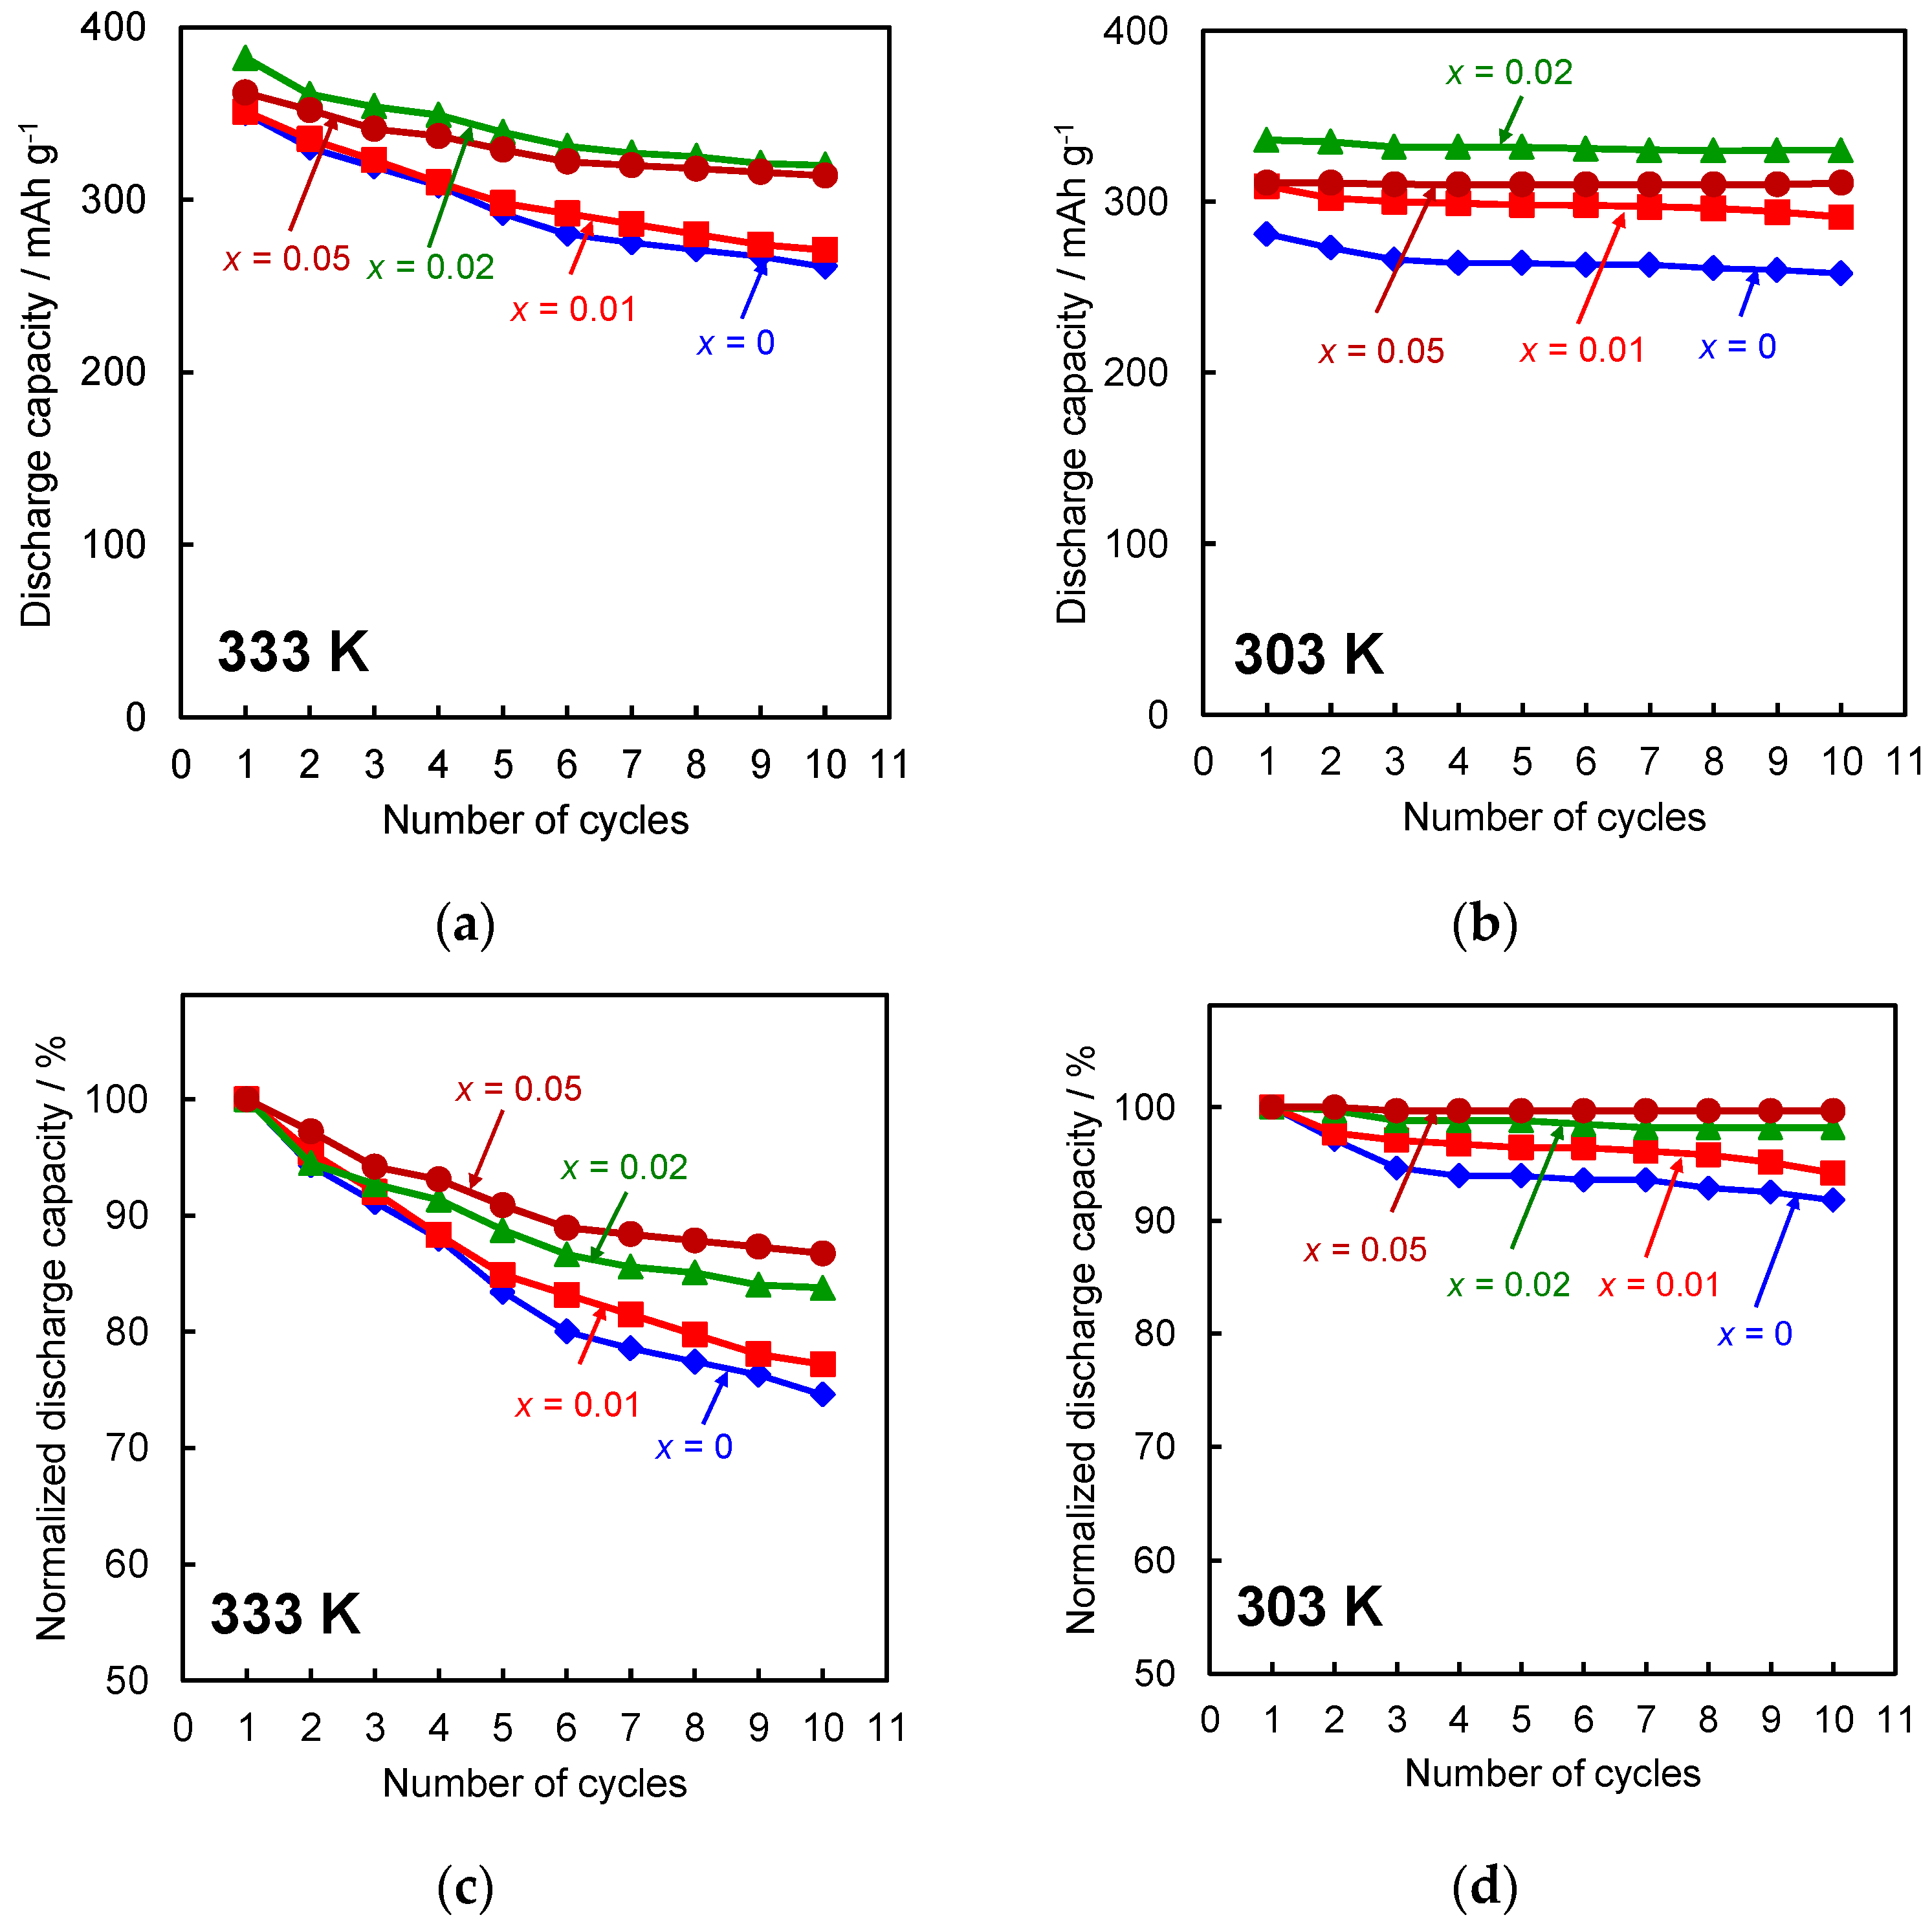
Figure 5a,b show the change in discharge capacity at 333 and 303 K with cycle number for the Zr0.6−xTi0.4NbxNi (x = 0, 0.01, 0.02, and 0.05) alloy negative electrodes, respectively. In Figure 5a, the cycle performance was improved by the increase in the Nb content, and the discharge capacity for the alloys with x ≥ 0.02 at both temperatures was more than 300 mAh g−1 even at the 10th cycle. The normalized discharge capacity (NDC) at 333 and 303 K for the Zr0.6−xTi0.4NbxNi (x = 0, 0.01, 0.02, and 0.05) negative electrodes was plotted as a function of cycle number in Figure 5c,d, respectively. The NDC is defined by the following equation [24]:
where Cdis,n is the discharge capacity at the n-th cycle, and Cdis,max is the maximum discharge capacity.
NDC (%) = 100Cdis,n/Cdis,max
At 333 K, the NDC values at the 10th cycle for the alloy negative electrodes with x = 0, 0.01, 0.02, and 0.05 were 74%, 77%, 83%, and 87%, respectively. The higher the NDC, the higher the charge-discharge cycle performance or cycle stability. At 303 K, the NDC values for alloys with x = 0, 0.01, 0.02, and 0.05 were 90%, 94%, 98%, and 100% at the10th cycle, respectively, and were higher than those at 333 K. For the alloys with x = 0.01, 0.02, and 0.05, the amount of Zr and Ti constituents dissolving in the electrolyte for 10 charge-discharge cycles at 303 and 333 K were determined by ICPS and are summarized in Table 6. The Zr and Ti species are detected at both temperatures and probably exist as HZrO3− and HTiO3− as expected from the Pourbaix diagrams for Zr and Ti [25]. On the other hand, the Nb and Ni constituents are not detected by ICPS. Nb also can dissolve in alkaline solutions [26], but its content in the alloys is very low in this study. So, Nb may be undetectable even if Nb dissolves. In contrast, Ni can be oxidized to Ni(OH)2, which does not dissolve [25,27]. For all alloys, the amounts of Zr and Ti dissolving in the electrolyte at 303 K were less than that at 333 K, which is consistent with previous reports [28,29]. These results clearly indicate that the significant improvement of cycle performance at 303 K is attributable to effective suppression of the dissolution of the Zr, Ti, and Nb constituents. Moreover, the amount of dissolved Zr and Ti for the alloy with x = 0.05, which has the highest fraction of the secondary phase, was smaller than that for alloys with x = 0.01 and 0.02.
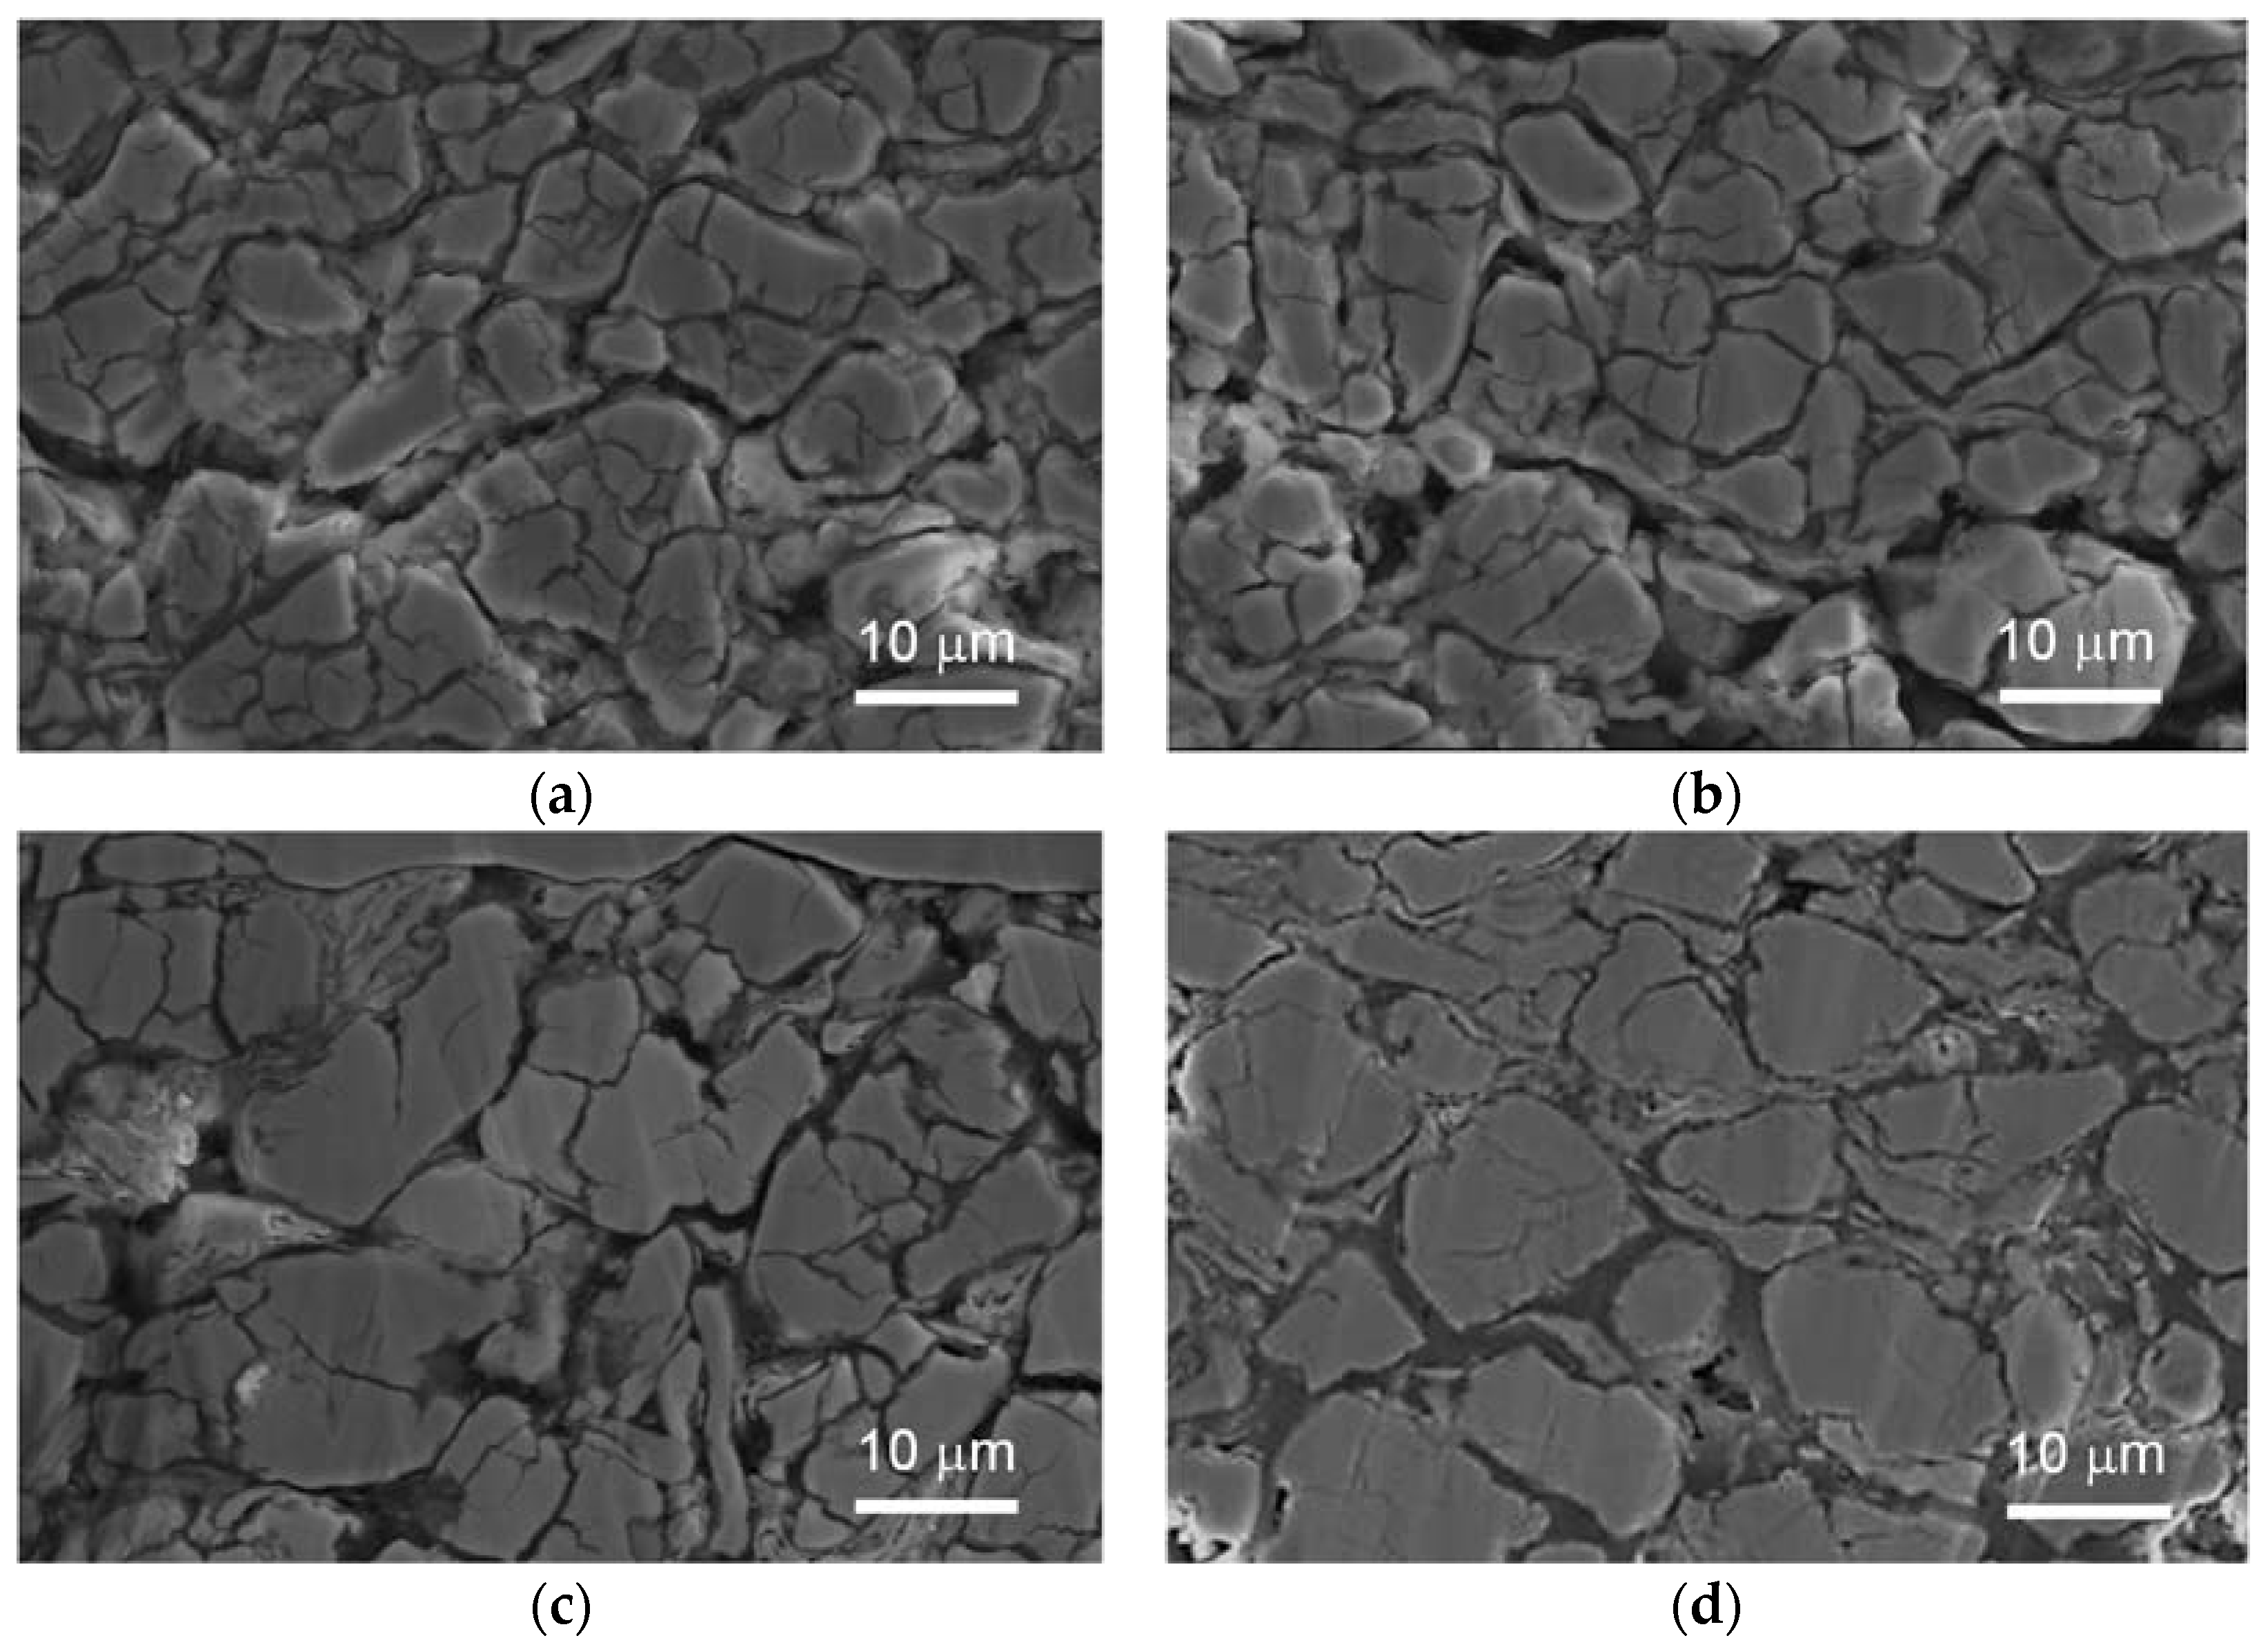
The cross-sectional SEM images of the Zr0.6−xTi0.4NbxNi (x = 0, 0.01, 0.02, and 0.05) negative electrodes after 10 cycles at 333 K are shown in Figure 6. The size of the alloy particles for each negative electrode was between 20 and 40 μm before the cycle test, but after 10 cycles it became less than 5 μm due to the cracking of the alloy particles. The reduction of particle size, however, was suppressed more effectively for the higher Nb contents, as shown in Figure 6. As shown in Table 6, the dissolution of the Zr and Ti constituents accelerated for the alloys with lower Nb contents, which may induce the pulverization of alloy particles.
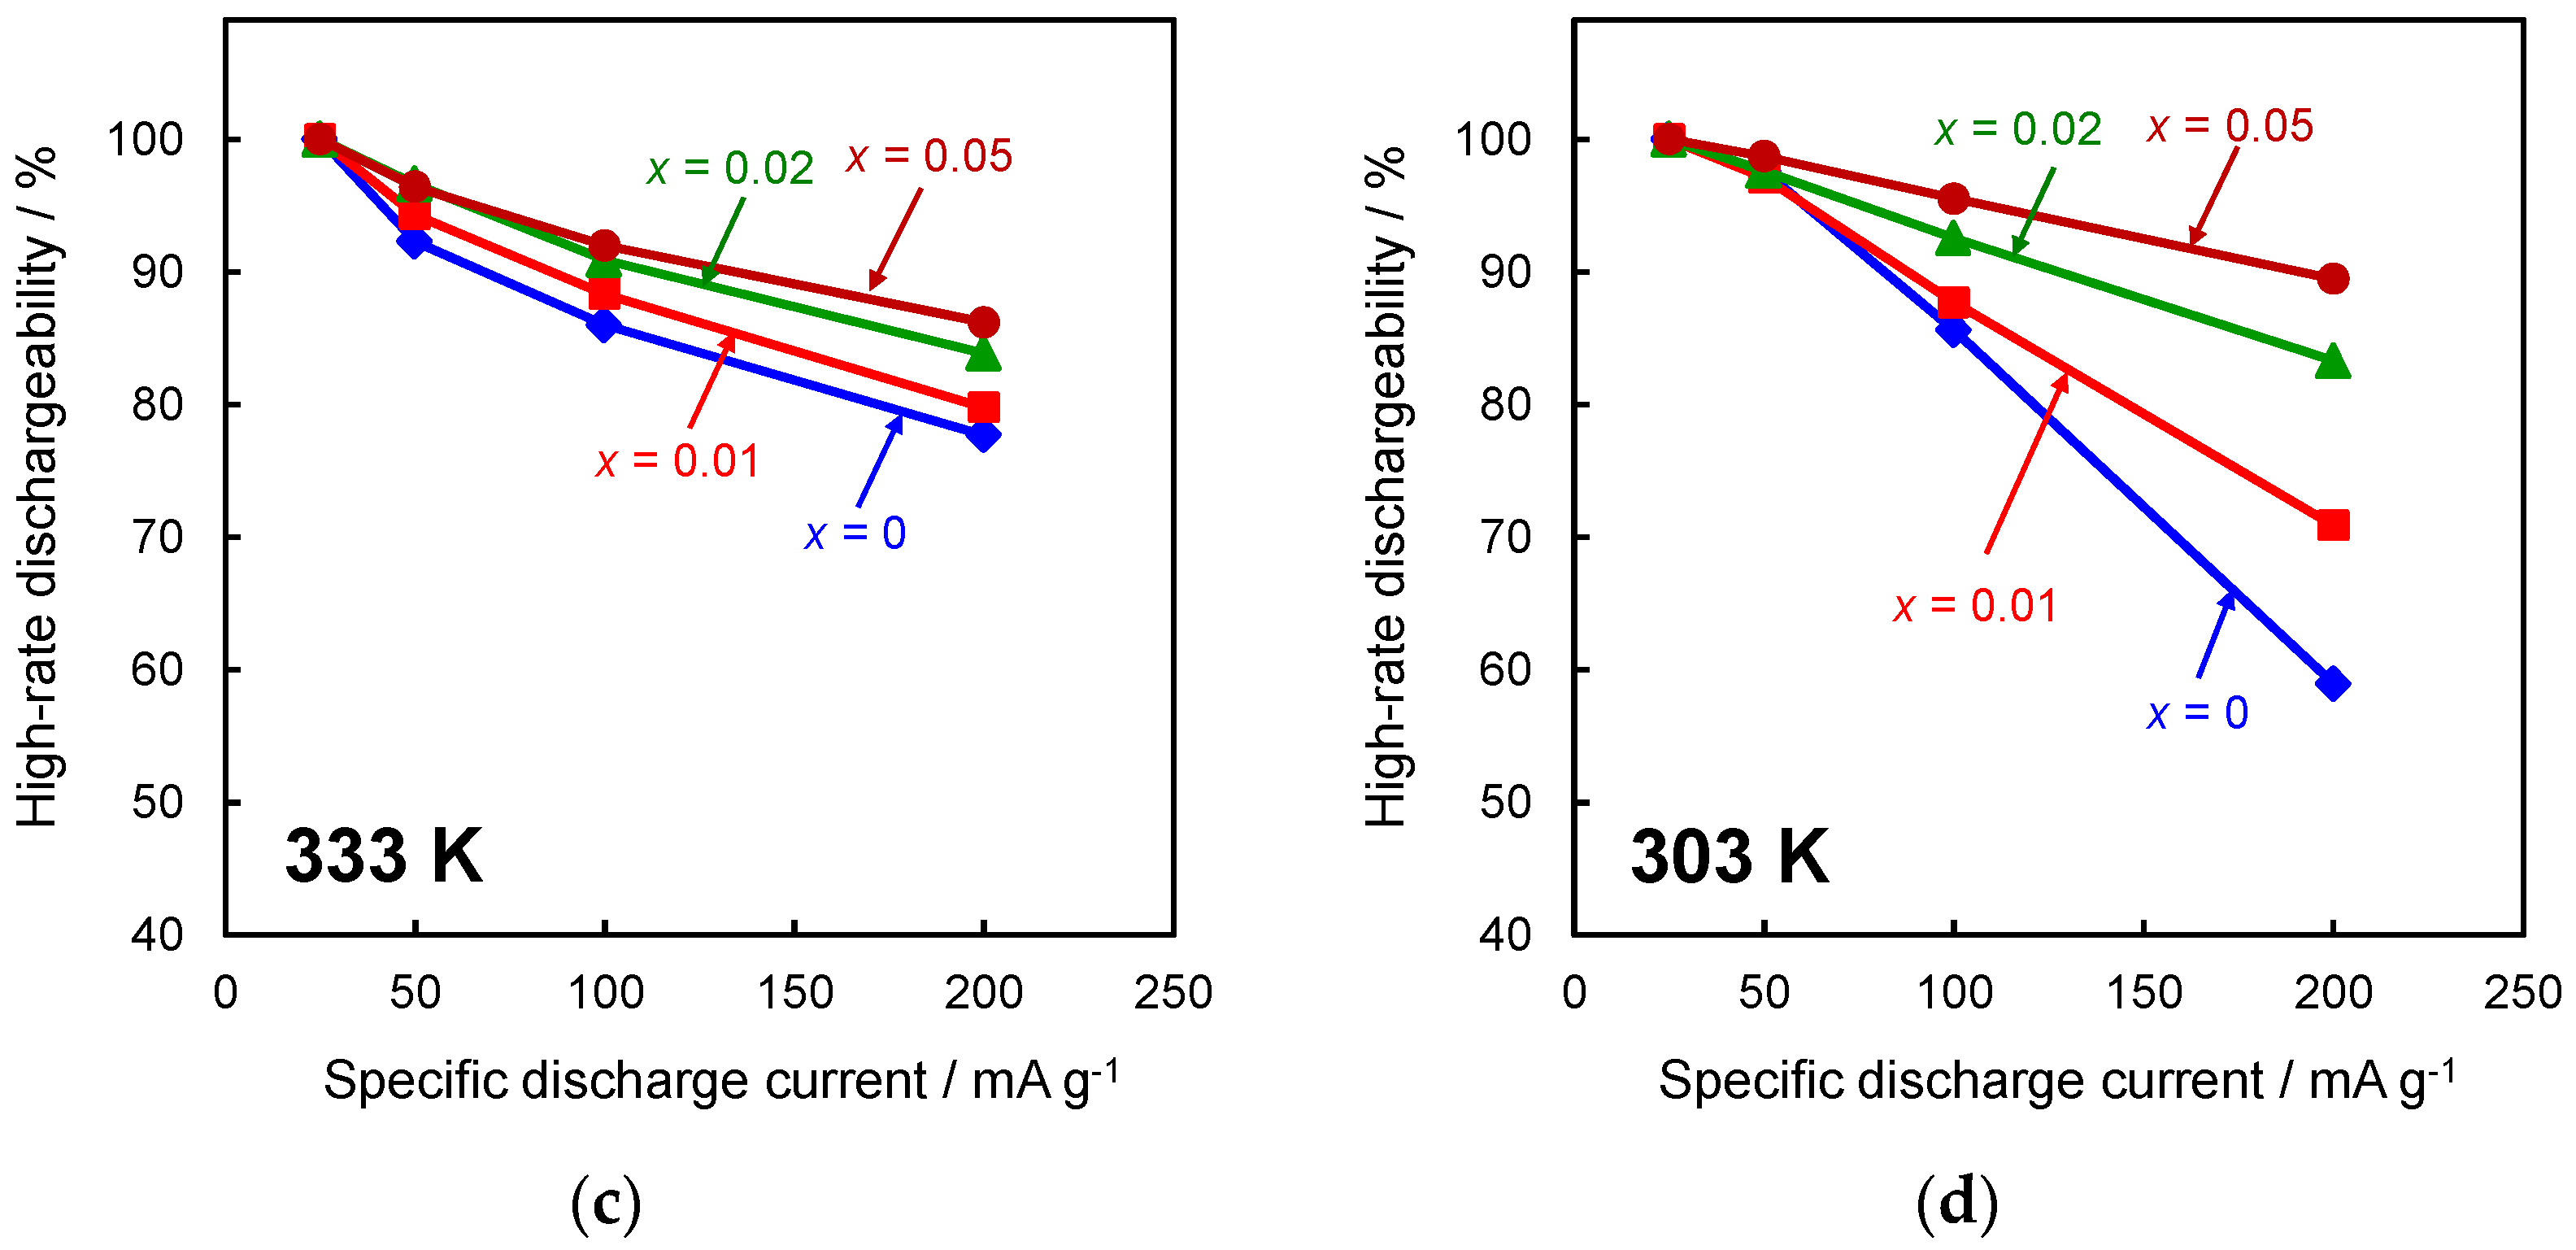
The discharge capacity at 333 and 303 K, as functions of specific discharge current for the Zr0.6−xTi0.4NbxNi (x = 0, 0.01, 0.02, and 0.05) negative electrodes, are shown in Figure 7a,b, respectively. At both temperatures, the discharge capacity at 200 mA g−1 increased with an increase in the Nb content. High-rate dischargeability (HRD) at 333 and 303 K, as functions of specific current density for the Zr0.6−xTi0.4NbxNi (x = 0, 0.01, 0.02, and 0.05) negative electrodes, are shown in Figure 7c and Figure 7d, respectively. HRD is defined by the following equation [24]:
where Cdis,i and Cdis,25 represent discharge capacity at i and 25 mA g−1, respectively.
HRD (%) = 100Cdis,i/Cdis,25
At 333 K, each Nb-substituted alloy negative electrode is a little superior in HRD to the Zr0.6Ti0.4Ni negative electrode. In contrast, at 303 K, HRD was greatly improved with increasing the Nb content. The hydrides of the Zr0.6−xTi0.4NbxNi alloy were destabilized by the electronic effect of the Nb substitution, facilitating hydrogen diffusion [14,30]. Consequently, the decay in discharge capacity with an increase in specific discharge current will be suppressed.
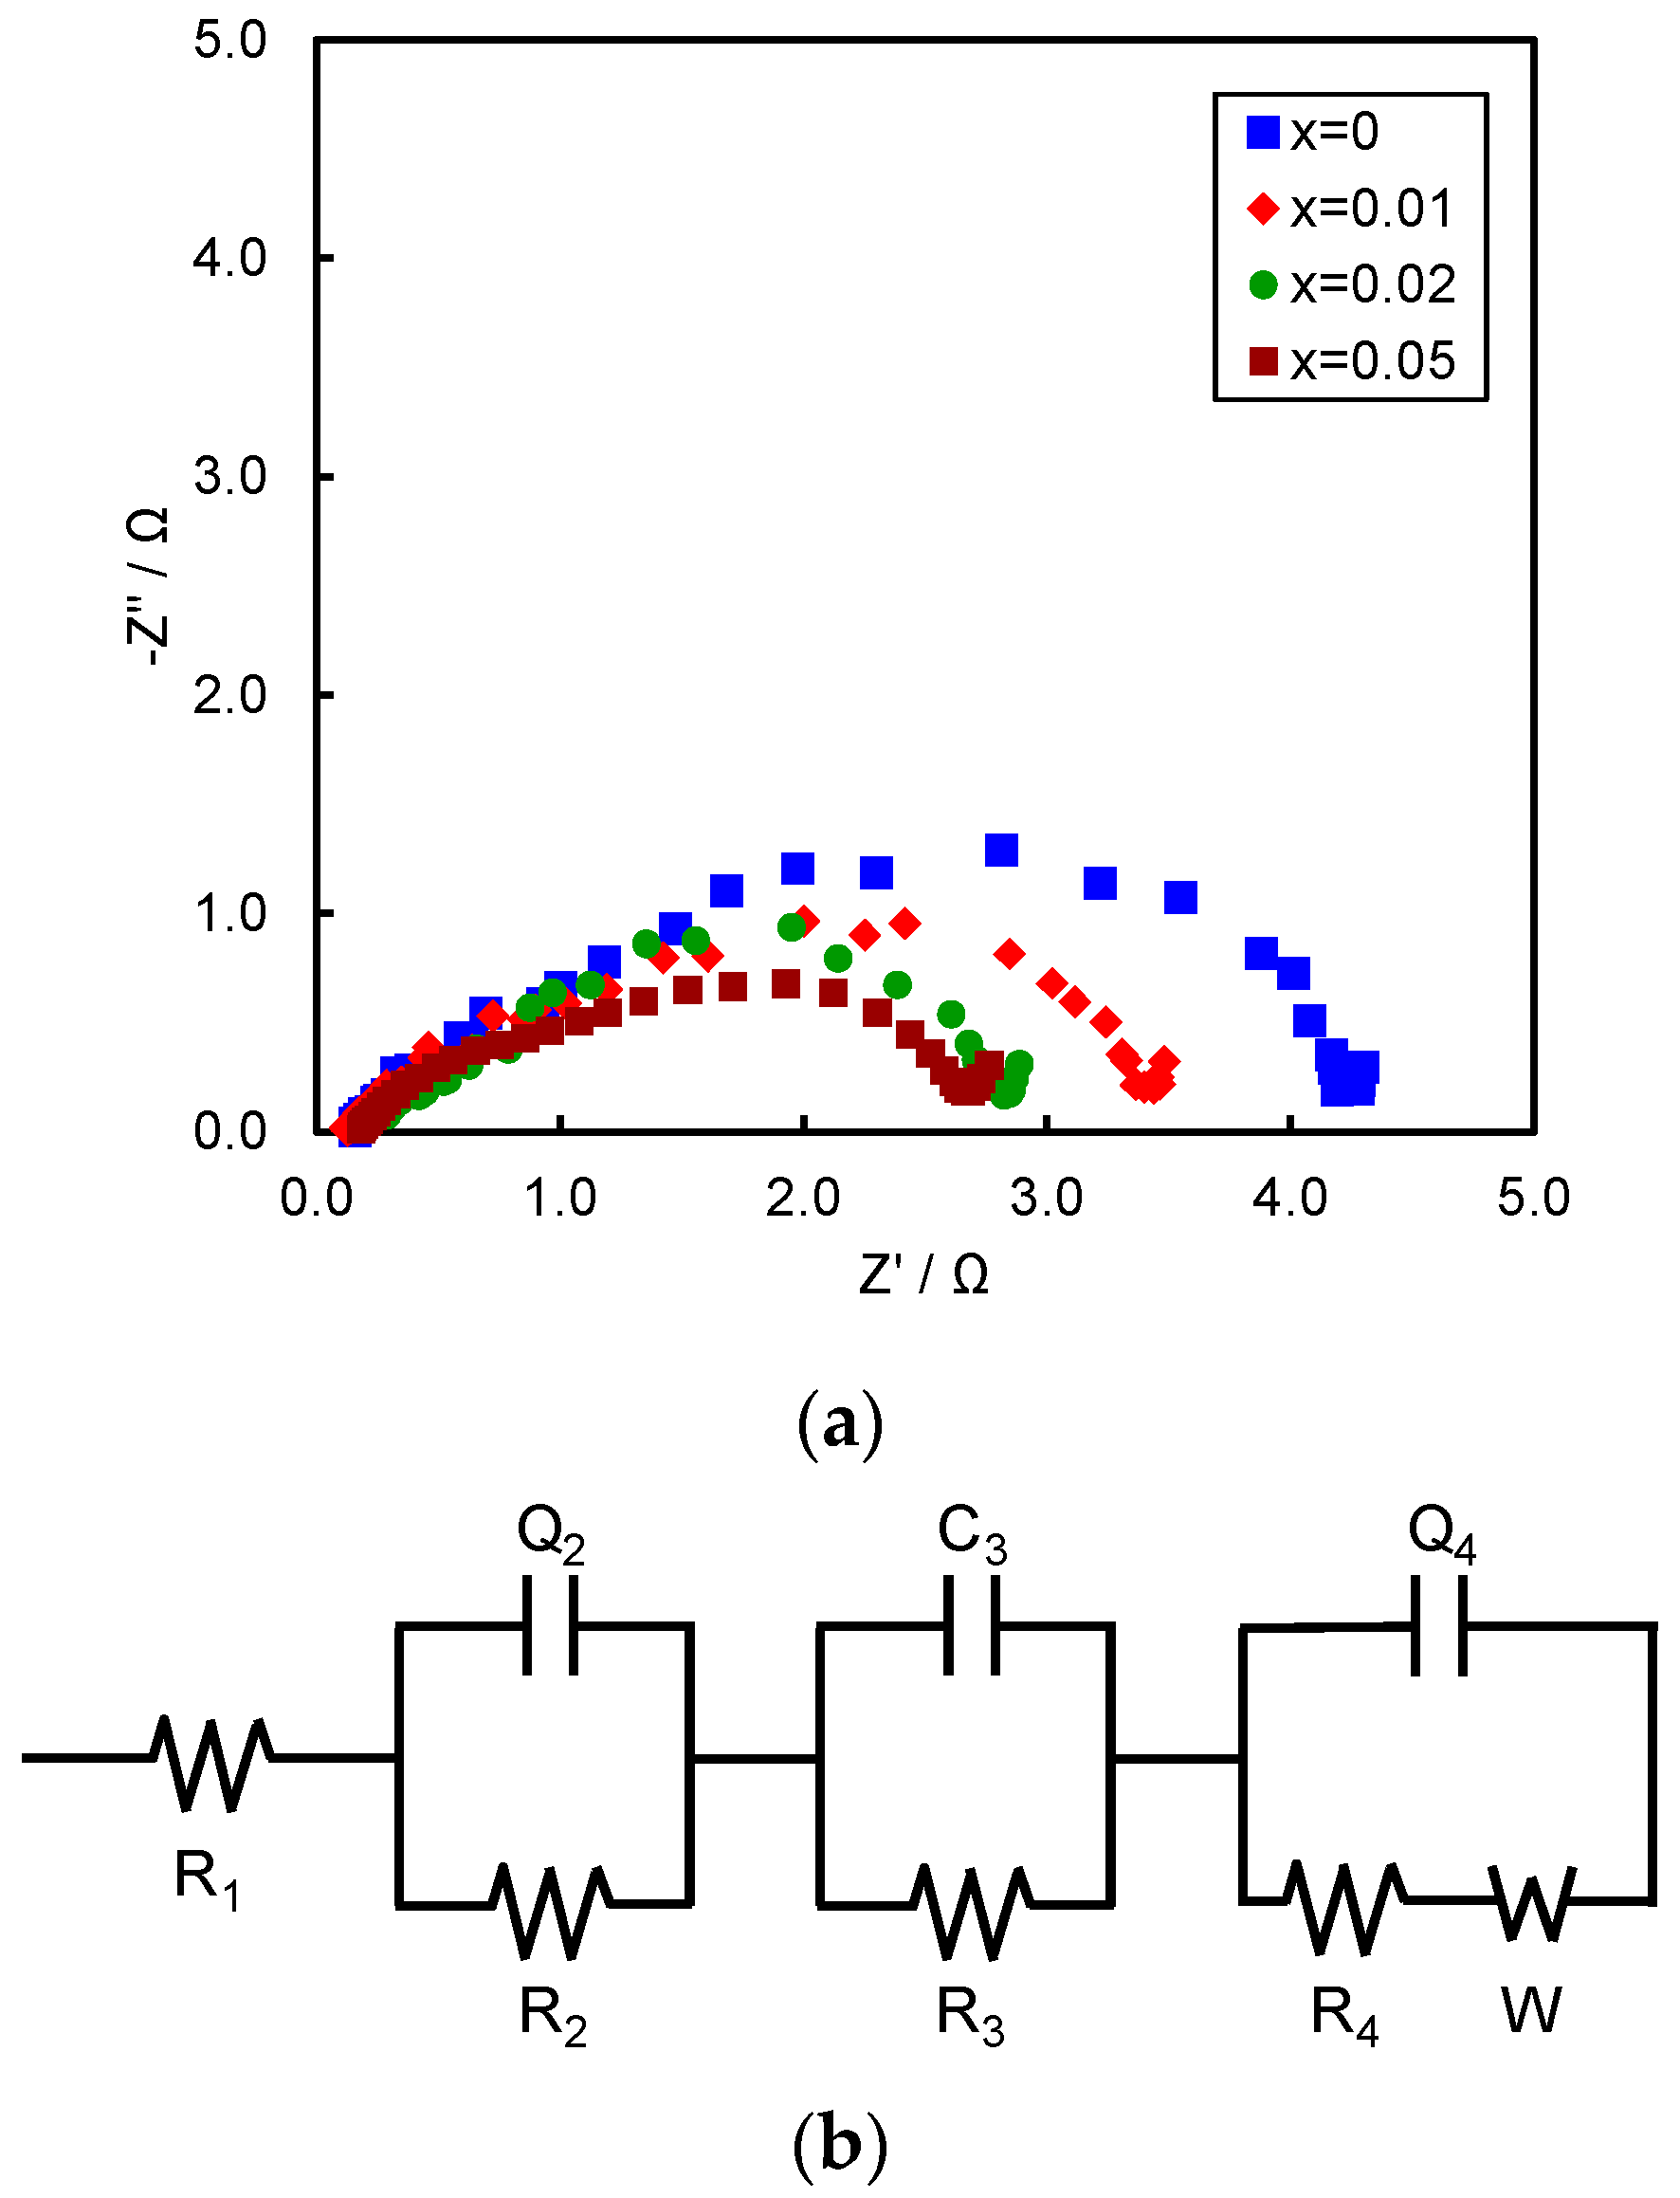
Figure 8a shows the Nyquist plots of Zr0.6−xTi0.4NbxNi (x = 0, 0.01, 0.02, and 0.05) alloy negative electrodes after charging at the 11th cycle at 303 K, and each measured impedance spectrum was simulated on the basis of an equivalent circuit given in the Figure 8b [31]. The model circuit is composed of three depressed semicircles and a straight line. Constant phase elements (Q2 and Q4) were employed for the capacitive components parallel to R2 and R4, which are related to the two semicircles in order to take into account the depressed shape of the semicircles. Q2 and Q4 are converted as the pseudocapacitance (C2 and C4) by the EC-Lab software (Bio-Logic, Claix, France). Resistances (R1–R4) and capacitances (C2–C4) for each alloy at the 11th cycle are shown in Table 7. R1 is the electrolyte resistance. R2 and C2 are the resistance and capacitance between the alloy particles and the current collector. R3 and C3 are the resistance and capacitance between the alloy particles. R4 and C4 are the charge transfer resistance and double layer capacitance [9]. R2 and R4 decreased with an increase in Nb content, whereas C2 and C4 increased. In particular, R4 for the alloy with x = 0.05 was much smaller than that with x = 0. The abundance of the TiNi phase is known to improve electrical conductivity [32]; so, in this study, the abundance of the Ti0.6Zr0.4Ni secondary phase also seems to improve the electrical conductivity. Consequently, the alloys with higher Nb contents will improve HRD at the lower temperature. R3 and C3 were scarcely changed regardless of the Nb content, suggesting that the pulverization of the alloy particles scarcely occurs during charge-discharge cycling at 303 K.
Charge-discharge performance for the Zr0.58Ti0.4Nb0.02Ni alloy, which exhibited the best performance in this study, is still insufficient, compared to the commercial rare-earth-based alloys. However, its discharge capacity was higher than that of the commercial alloys, which motivates us to propel the development of the Zr-Ti-Nb-Ni alloys to increase the energy density of Ni-MH batteries; although, some breakthroughs will be required.
4. Conclusions
The crystal structure of the Zr0.6−xTi0.4NbxNi (x = 0, 0.01, 0.02, and 0.05) alloy powders with two phases was assigned to the B33-type orthorhombic structure for the primary phase and the B2-type Ti0.6Zr0.4Ni structure for the secondary phase. The Rietveld refinement demonstrated that the atomic fraction of the secondary phase increased with the Nb content. Moreover, the lattice parameters and unit cell volume of the primary phase decreased with an increase in the Nb content.
The hydrogen storage capacity at 0.5 MPa decreased with an increase in the Nb content because of the increase in the abundance of the secondary phase, whereas the plateau pressure in hydrogen absorption from monohydride to trihydride of the primary phase rose due to the destabilization of the trihydride of the primary phase, which could mainly be attributed to the electronic effect.
The discharge curves for the Zr0.6−xTi0.4NbxNi (x = 0, 0.01, 0.02, and 0.05) negative electrodes had two potential plateaus. The first and second plateaus were attributable to electrochemical hydrogen desorption of trihydride to monohydride and monohydride to alloy of the primary phase, respectively. The Cdis,total value at 333 and 303 K was highest for the alloy with x = 0.02. The first and second plateau potentials negatively shifted with an increase in the Nb content, suggesting the destabilization of the trihydride and monohydride of the primary phase. The cycle and rate performance were also improved by the Nb substitution. In this study, the Zr0.58Ti0.4Nb0.02Ni negative electrode exhibited the best negative electrode performance.
Author Contributions
A.M. designed all experiments, analyzed the results, and wrote the paper. H.T. and T.K. analyzed and interpreted all data. H.I. assisted in data analysis and manuscript preparation.
Funding
This research was funded by Aichi Steel Corporation of Development no K3-002A.
Acknowledgments
The support of Aichi Steel is grateful acknowledged.
Conflicts of Interest
The authors declare no conflict of interest.
References
- Bäuerlein, P.; Antonius, C.; Löffler, J.; Kümpers, J. Progress in high-power nickel-metal hydride batteries. J. Power Sources 2008, 176, 547–554. [Google Scholar] [CrossRef]
- Nishimura, K.; Takasaki, T.; Sakai, T. Introduction of large-sized nickle-metal hydride battery GIGACELL® for industrial applications. J. Alloy. Compd. 2013, 580, S353–S358. [Google Scholar] [CrossRef]
- Larsson, F.; Andersson, P.; Blomqvist, P.; Lorén, A.; Mellander, B.E. Characteristics of lithium-ion batteries during fire tests. J. Power Sources 2014, 271, 414–420. [Google Scholar] [CrossRef]
- Larsson, F.; Andersson, P.; Mellander, B.E. Lithium-ion battery aspects on fires in electrifield vehicles on the basis of experimental abuse tests. Batteries 2016, 2, 9. [Google Scholar] [CrossRef]
- Dantzer, P.; Millet, P.; Flanagan, T.B. Thermodynamic Characterization of Hydride Phase Growth in ZrNi-H2. Metall. Mater. Trans. A 2001, 32, 29–38. [Google Scholar] [CrossRef]
- Lan, Z.; Li, J.; Wei, B.; Zhu, R.; Guo, J. Study on electrochemical property of La0.75Mg0.25Ni2.85Co0.45−x(AlSn)x (x = 0.0, 0.1, 0.2, 0.3) alloys. J. Rare Earth 2016, 34, 401–406. [Google Scholar] [CrossRef]
- Zhao, W.; Zhu, D.; Tang, Z.; Wu, C.; Huang, L.; Ma, Z.; Chen, Y. Improvement in low-temperature and instantaneous high-rate output performance of Al-free AB5-type hydrogen storage alloy for negative electrode in Ni/MH battery: Effect of thermodynamic and kinetic regulation via partial Mn substituting. J. Power Sources 2017, 343, 11–21. [Google Scholar] [CrossRef]
- Matsuyama, A.; Mizutani, H.; Kozuka, T.; Inoue, H. Effect of surface treatment with boiling alkaline solution on electrochemical properties of the ZrNi alloy electrode. Int. J. Hydrog. Energy 2016, 41, 9908–9913. [Google Scholar] [CrossRef]
- Matsuyama, A.; Mizutani, H.; Kozuka, T.; Inoue, H. Charge-discharge properties of the surface-modified ZrNi alloy electrode with differential degrees of boiling alkaline treatment. Batteries 2016, 2, 30. [Google Scholar] [CrossRef]
- Flanagan, T.B.; Bowman, R.C., Jr.; Cantrell, J.S. Thermodynamic and degradation studies of LaNi5 (closely stoichiometric)-H and LaNi5−xMnx-H with x = 0.5–2.0. J. Alloy. Compd. 1993, 202, 147–159. [Google Scholar] [CrossRef]
- Qiu, S.; Huang, J.; Chu, H.; Zou, Y.; Xiang, C.; Zhang, H.; Xu, F.; Sun, L.; Quyang, L.; Zhou, H. Influence of Zr Addition on Structure and Performance of Rare Earth Mg-Based Alloys as Anodes in Ni/MH Battery. Metals 2015, 5, 565–577. [Google Scholar] [CrossRef] [Green Version]
- Matsuyama, A.; Mizutani, H.; Kozuka, T.; Inoue, H. Crystal structure and hydrogen absorption-desorption properties of Zr1−xTixNi (0.05 ≤ x ≤ 0.5) alloys. J. Alloy. Compd. 2017, 714, 467–475. [Google Scholar] [CrossRef]
- Matsuyama, A.; Mizutani, H.; Kozuka, T.; Inoue, H. Effect of Ti substitution on electrochemical properties of ZrNi alloy electrode for use in nickel-metal hydride batteries. Int. J. Hydrog. Energy 2017, 42, 22622–22627. [Google Scholar] [CrossRef]
- Nakano, H.; Wakao, S. Substitution effect of elements in Zr-based alloys with Laves phase for nickel-hydride battery. J. Alloy. Compd. 1995, 231, 587–593. [Google Scholar] [CrossRef]
- Oishi, R.; Yonemura, M.; Nishimaki, Y.; Torii, S.; Hoshikawa, A.; Ishigaki, T.; Morishima, T.; Mori, K.; Kamiyama, T. Rietveld analysis software for J-PARC. Nucl. Instrum. Methods 2009, A600, 94–96. [Google Scholar] [CrossRef]
- Oishi-Tomiyasu, R.; Yonemura, M.; Morishima, T.; Hoshikawa, A.; Torii, S.; Ishigaki, T.; Kamiyama, T. Application of matrix decomposition algorithms for singular matrices to the Pawley method in Z-Rietveld. J. Appl. Crystallogr. 2012, 45, 299–308. [Google Scholar] [CrossRef]
- Matar, S.F. First principles studies of ZrNi and ZrNiH3. Chem. Phys. Lett. 2009, 473, 61–65. [Google Scholar] [CrossRef]
- Cuevas, F.; Latroche, M.; Bourée-Vigneron, F.; Percheron-Guégan, A. A conjoint XRD-ND analysis of the crystal structures of austenitic and martensitic Ti0.64Zr0.36Ni hydrides. J. Solid-State Chem. 2006, 179, 3295–3307. [Google Scholar] [CrossRef]
- Yong, R.A.; Prince, E. Suggested guidelines for the publication of Rietveld analyses and pattern decomposition studies. J. Appl. Crystallogr. 1982, 15, 357–359. [Google Scholar] [CrossRef] [Green Version]
- Huot, J.; Akiba, E.; Iba, H. Crystal structure and phase composition of alloys Zr1−xTix(Mn1−yVy)2. J. Alloy. Compd. 1995, 228, 181–187. [Google Scholar] [CrossRef]
- Carlin, M.; Health, A.; Moreno, J.J.G.; Bönisch, M.; Brackmann, V.; Giebeler, L.; Gemming, T.; Lekka, C.E.; Gebert, A.; Schnettler, T.; et al. Elastic softening of β-type Ti-Nb alloys by indium (In) addition. J. Mech. Behav. Biomed. 2014, 39, 162–174. [Google Scholar] [CrossRef] [PubMed]
- Sakaguchi, N.; Niinomi, M.; Akahori, T.; Takeda, J.; Toda, H. Relationships between tensile deformation behavior and microstructure in Ti-Nb-Ta-Zr system alloys. Mater. Sci. Eng. C 2005, 25, 363–369. [Google Scholar] [CrossRef]
- Hashi, K.; Ishikawa, K.; Matsuda, T.; Aoki, K. Microstructures and hydrogen permeability of Nb-Ti-Ni alloys with high resistance to hydrogen embrittlement. Mater. Trans. 2005, 46, 1026–1031. [Google Scholar] [CrossRef]
- Inoue, H.; Koyama, S.; Higuchi, E. Charge-discharge performance of Cr-substituted V-based hydrogen storage alloy negative electrodes for use in nickel-metal hydride batteries. Electrochim. Acta 2012, 59, 23–31. [Google Scholar] [CrossRef]
- Pourbaix, M. Atlas Electrochemical Equilibria in Aqueous Solutions, 2nd ed.; National Association of Corrosion Engineers (NACE): Houston, TX, USA, 1974; p. 333. [Google Scholar]
- Robin, A. Corrosion Behavior of Niobium in Sodium Hydroxide Solutions. J. Appl. Electrochem. 2004, 34, 623–629. [Google Scholar] [CrossRef]
- Seghiouer, A.; Chevalet, J.; Barhoun, A.; Lantelme, F. Electrochemical oxidation of nickel in alkaline solution: A voltammetric study and modeling. J. Electroanal. Chem. 1998, 442, 112–123. [Google Scholar] [CrossRef]
- Yau, T.L. Corrosion comparisons between zirconium and titanium. Mater. Corros. 1992, 43, 358–363. [Google Scholar] [CrossRef]
- Pjescic, J.; Mentus, S.; Blagojevic, N. Investigation of titanium corrosion in concentrated NaOH solutions. Mater. Corros. 2002, 53, 44–50. [Google Scholar] [CrossRef]
- Sawa, H.; Wakao, S. Electrochemical properties of Zr-V-Ni system hydrogen-absorbing alloys of face-centered cubic structure. Mater. Trans. 1990, 31, 487–492. [Google Scholar] [CrossRef]
- Kuriyama, N.; Sakai, T.; Miyamura, H.; Uehara, I.; Ishikawa, H. Electrochemical impedance and deterioration behavior of metal hydride electrodes. J. Alloy. Compd. 1993, 202, 183–197. [Google Scholar] [CrossRef]
- Tsukahara, M.; Takahashi, K.; Mishima, T.; Sakai, T.; Miyamura, H.; Kuriyama, N.; Uehara, L. Metal hydride electrodes based on solid solution type alloy TiV3Nix (0 ≦ x ≦ 0.75). J. Alloy. Compd. 1995, 226, 203–207. [Google Scholar] [CrossRef]
Figure 1.
X-ray diffraction patterns of the Zr0.6−xTi0.4NbxNi (x = 0.01, 0.02, and 0.05) alloy powders with the Rietveld refinement. (a) x = 0.01, (b) x = 0.02, and (c) x = 0.05.
Figure 1.
X-ray diffraction patterns of the Zr0.6−xTi0.4NbxNi (x = 0.01, 0.02, and 0.05) alloy powders with the Rietveld refinement. (a) x = 0.01, (b) x = 0.02, and (c) x = 0.05.

Figure 2.
PCT curves at 423 K for the Zr0.6−xTi0.4NbxNi (x = 0.01, 0.02, and 0.05) alloy powders.

Figure 3.
(a) Initial discharge curves, their differential curves in the potential ranges (b) between −1.0 and −0.5 V, and (c) −0.8 and −0.65 V, and (d) Ctotal, C1, and C2 values as a function of the x value for the Zr0.6−xTi0.4NbxNi (x = 0, 0.01, 0.02, and 0.05) negative electrodes at 333 K. Specific discharge current: 25 mA g−1.

Figure 4.
(a) Initial discharge curves and their differential curves in the potential ranges (b) between −1.0 and −0.5 V for the Zr0.6−xTi0.4NbxNi (x = 0, 0.01, 0.02, and 0.05) negative electrodes at 303 K. Specific discharge current: 25 mA g−1.
Figure 4.
(a) Initial discharge curves and their differential curves in the potential ranges (b) between −1.0 and −0.5 V for the Zr0.6−xTi0.4NbxNi (x = 0, 0.01, 0.02, and 0.05) negative electrodes at 303 K. Specific discharge current: 25 mA g−1.

Figure 5.
(a,b) Discharge capacity and (c,d) normalized discharge capacity (NDC) as a function of cycle number for the Zr0.6−xTi0.4NbxNi (x = 0, 0.01, 0.02, and 0.05) negative electrodes at 333 K and 303 K.
Figure 5.
(a,b) Discharge capacity and (c,d) normalized discharge capacity (NDC) as a function of cycle number for the Zr0.6−xTi0.4NbxNi (x = 0, 0.01, 0.02, and 0.05) negative electrodes at 333 K and 303 K.

Figure 6.
Cross-sectional SEM images of the Zr0.6−xTi0.4NbxNi negative electrodes after charge–discharge cycle tests at 333 K. (a) x = 0, (b) x = 0.01, (c) x = 0.02, and (d) x = 0.05.
Figure 6.
Cross-sectional SEM images of the Zr0.6−xTi0.4NbxNi negative electrodes after charge–discharge cycle tests at 333 K. (a) x = 0, (b) x = 0.01, (c) x = 0.02, and (d) x = 0.05.

Figure 7.
(a,b) Discharge capacity and (c,d) high-rate dischargeability (HRD) as a function of specific discharge current for the Zr0.6−xTi0.4NbxNi (x = 0, 0.01, 0.02, and 0.05) negative electrodes at 333 K and 303 K.
Figure 7.
(a,b) Discharge capacity and (c,d) high-rate dischargeability (HRD) as a function of specific discharge current for the Zr0.6−xTi0.4NbxNi (x = 0, 0.01, 0.02, and 0.05) negative electrodes at 333 K and 303 K.


Figure 8.
(a) Nyquist plots for the full-charged Zr0.6−xTi0.4NbxNi (x = 0, 0.01, 0.02, and 0.05) negative electrodes at 303 K and (b) equivalent circuit.
Figure 8.
(a) Nyquist plots for the full-charged Zr0.6−xTi0.4NbxNi (x = 0, 0.01, 0.02, and 0.05) negative electrodes at 303 K and (b) equivalent circuit.


Table 1.
Chemical composition for the Zr0.6−xTi0.4NbxNi (x = 0.01, 0.02, and 0.05) powders.
| Content/at% | |||||
|---|---|---|---|---|---|
| Zr | Ti | Nb | Ni | ||
| x = 0.01 | Theoretical | 29.50 | 20.00 | 0.50 | 50.00 |
| Experimental | 29.12 | 19.13 | 0.46 | 50.68 | |
| x = 0.02 | Theoretical | 29.00 | 20.00 | 1.00 | 50.00 |
| Experimental | 28.86 | 19.43 | 0.96 | 50.12 | |
| x = 0.05 | Theoretical | 27.50 | 20.00 | 2.50 | 50.00 |
| Experimental | 27.39 | 19.44 | 2.49 | 50.37 | |
Table 2.
Structural parameters after the Rietveld refinement for the Zr0.6−xTi0.4NbxNi (x = 0.01, 0.02, and 0.05) alloy powders.
Table 2.
Structural parameters after the Rietveld refinement for the Zr0.6−xTi0.4NbxNi (x = 0.01, 0.02, and 0.05) alloy powders.
| Composition of Primary and Secondary Phases | Lattice | Space Group (No.) | a/nm | b/nm | c/nm | V/nm3 | Phase Abundance/at% | |
|---|---|---|---|---|---|---|---|---|
| x = 0.01 | Zr0.589Ti0.396Nb0.014Ni1.001 | B33 | Cmcm(63) | 0.31279 | 0.96712 | 0.40670 | 0.12303 | 95.2 |
| Ti0.589Zr0.392Nb0.013Ni1.000 | B2 | Pm-3m(221) | 0.31239 | 0.31239 | 0.31239 | 0.03048 | 4.8 | |
| x = 0.02 | Zr0.571Ti0.401Nb0.026Ni1.002 | B33 | Cmcm(63) | 0.31269 | 0.96684 | 0.40662 | 0.12292 | 93.9 |
| Ti0.588Zr0.396Nb0.013Ni0.998 | B2 | Pm-3m(221) | 0.31265 | 0.31265 | 0.31265 | 0.03056 | 6.1 | |
| x = 0.05 | Zr0.550Ti0.399Nb0.052Ni0.999 | B33 | Cmcm(63) | 0.31246 | 0.96572 | 0.40576 | 0.12243 | 84.9 |
| Ti0.528Zr0.433Nb0.038Ni1.001 | B2 | Pm-3m(221) | 0.31236 | 0.31236 | 0.31236 | 0.03047 | 15.1 |
Table 3.
Hydrogen storage capacity at 0.5 MPa, plateau pressure at 423 K, and χave of the primary phases for the Zr0.6−xTi0.4NbxNi (x = 0.01, 0.02, and 0.05) alloy powders.
Table 3.
Hydrogen storage capacity at 0.5 MPa, plateau pressure at 423 K, and χave of the primary phases for the Zr0.6−xTi0.4NbxNi (x = 0.01, 0.02, and 0.05) alloy powders.
| Hydrogen Storage Capacity at 0.5 MPa/mass% | Plateau Pressure/MPa | χave | |
|---|---|---|---|
| x = 0 | 1.78 | 0.0496 | 1.662 |
| x = 0.01 | 1.71 | 0.0695 | 1.664 |
| x = 0.02 | 1.74 | 0.0756 | 1.667 |
| x = 0.05 | 1.52 | 0.128 | 1.675 |
Table 4.
Total discharge capacity (Cdis,total), first discharge capacity (Cdis,1), second discharge capacity (Cdis,2), first peak potential (E1), and second peak potential (E2) for the Zr0.6−xTi0.4NbxNi (x = 0.01, 0.02, and 0.05) alloy negative electrodes at 333 K.
Table 4.
Total discharge capacity (Cdis,total), first discharge capacity (Cdis,1), second discharge capacity (Cdis,2), first peak potential (E1), and second peak potential (E2) for the Zr0.6−xTi0.4NbxNi (x = 0.01, 0.02, and 0.05) alloy negative electrodes at 333 K.
| Cdis,total/mAh g−1 | Cdis,1/mAh g−1 | Cdis,2/mAh g−1 | E1/V | E2/V | |
|---|---|---|---|---|---|
| x = 0 | 349 | 296 | 53 | −0.828 | −0.722 |
| x = 0.01 | 351 | 296 | 55 | −0.831 | −0.733 |
| x = 0.02 | 384 | 323 | 61 | −0.836 | −0.739 |
| x = 0.05 | 362 | 299 | 67 | −0.851 | −0.748 |
Table 5.
Total discharge capacity (Cdis,total), peak potential (E1), and second peak potential (E2) for the Zr0.6−xTi0.4NbxNi (x = 0.01, 0.02, and 0.05) alloy negative electrodes at 303 K.
Table 5.
Total discharge capacity (Cdis,total), peak potential (E1), and second peak potential (E2) for the Zr0.6−xTi0.4NbxNi (x = 0.01, 0.02, and 0.05) alloy negative electrodes at 303 K.
| Cdis,total/mAh g−1 | E1/V | |
|---|---|---|
| x = 0 | 281 | −0.803 |
| x = 0.01 | 309 | −0.825 |
| x = 0.02 | 335 | −0.830 |
| x = 0.05 | 313 | −0.836 |
Table 6.
Concentration in the electrolyte after 10 cycles at 303 and 333 K by induced couple plasma spectroscopy (ICPS).
Table 6.
Concentration in the electrolyte after 10 cycles at 303 and 333 K by induced couple plasma spectroscopy (ICPS).
| Temperature/K | Concentration/ppm | ||||
|---|---|---|---|---|---|
| Zr | Ti | Nb | Ni | ||
| x = 0.01 | 303 | 3.6 | 1.1 | - | - |
| 333 | 5.9 | 2.5 | - | - | |
| x = 0.02 | 303 | 3.3 | 1.0 | - | - |
| 333 | 5.7 | 2.3 | - | - | |
| x = 0.05 | 303 | 1.4 | 0.6 | - | - |
| 333 | 3.9 | 2.0 | - | - | |
Table 7.
Resistances (R1–R4), capacitance (C3), and pseudocapacitances (C2, C4) for the full-charged Zr0.6−xTi0.4NbxNi (x = 0, 0.01, 0.02, and 0.05) alloy negative electrodes at the 11th cycle at 303 K.
Table 7.
Resistances (R1–R4), capacitance (C3), and pseudocapacitances (C2, C4) for the full-charged Zr0.6−xTi0.4NbxNi (x = 0, 0.01, 0.02, and 0.05) alloy negative electrodes at the 11th cycle at 303 K.
| R1/Ω | R2/Ω | R3/Ω | R4/Ω | C2/F | C3/F | C4/F | |
|---|---|---|---|---|---|---|---|
| x = 0 | 0.150 | 0.238 | 0.354 | 3.67 | 3.48 × 10⁻³ | 0.248 | 9.90 × 10⁻³ |
| x = 0.01 | 0.127 | 0.234 | 0.369 | 3.11 | 3.61 × 10⁻³ | 0.226 | 11.57 × 10⁻³ |
| x = 0.02 | 0.187 | 0.227 | 0.388 | 2.38 | 3.87 × 10⁻³ | 0.212 | 12.07 × 10⁻³ |
| x = 0.05 | 0.168 | 0.214 | 0.370 | 2.06 | 3.95 × 10⁻³ | 0.219 | 12.36 × 10⁻³ |
© 2018 by the authors. Licensee MDPI, Basel, Switzerland. This article is an open access article distributed under the terms and conditions of the Creative Commons Attribution (CC BY) license (http://creativecommons.org/licenses/by/4.0/).
Share and Cite
MDPI and ACS Style
Matsuyama, A.; Takito, H.; Kozuka, T.; Inoue, H. Electrochemical Properties of Nb-Substituted Zr-Ti-Ni Hydrogen Storage Alloy Negative Electrodes for Nickel-Metal Hydride Batteries. Metals 2018, 8, 473. https://doi.org/10.3390/met8070473
AMA Style
Matsuyama A, Takito H, Kozuka T, Inoue H. Electrochemical Properties of Nb-Substituted Zr-Ti-Ni Hydrogen Storage Alloy Negative Electrodes for Nickel-Metal Hydride Batteries. Metals. 2018; 8(7):473. https://doi.org/10.3390/met8070473
Chicago/Turabian StyleMatsuyama, Akihiro, Hironori Takito, Takumi Kozuka, and Hiroshi Inoue. 2018. "Electrochemical Properties of Nb-Substituted Zr-Ti-Ni Hydrogen Storage Alloy Negative Electrodes for Nickel-Metal Hydride Batteries" Metals 8, no. 7: 473. https://doi.org/10.3390/met8070473
Note that from the first issue of 2016, this journal uses article numbers instead of page numbers. See further details here.