Article

Microstructure Evolution in Super Duplex Stainless Steels Containing σ-Phase Investigated at Low-Temperature Using In Situ SEM/EBSD Tensile Testing

by
Christian Oen Paulsen
1,2,*,†,
Runar Larsen Broks
1,†,
Morten Karlsen
1,3,†,
Jarle Hjelen
1,4,† and
Ida Westermann
1,2,†
1
Department of Materials Science and Engineering, Norwegian University of Science and Technology (NTNU), NO-7491 Trondheim, Norway
2
Centre for Advanced Structural Analysis (CASA), Norwegian University of Science and Technology (NTNU), NO-7491 Trondheim, Norway
3
Equinor ASA, NO-7053 Trondheim, Norway
4
Department of Geoscience and Petroleum, Norwegian University of Science and Technology (NTNU), NO-7491 Trondheim, Norway
*
Author to whom correspondence should be addressed.
These authors contributed equally to this work.
Metals 2018, 8(7), 478; https://doi.org/10.3390/met8070478
Submission received: 25 May 2018 / Revised: 15 June 2018 / Accepted: 19 June 2018 / Published: 22 June 2018

Abstract

:
An in situ scanning electron microscope (SEM) study was conducted on a super duplex stainless steel (SDSS) containing 0%, 5% and 10% σ -phase. The material was heat treated at 850 °C for 12 min and 15 min, respectively, to achieve the different amounts of σ -phase. The specimens were investigated at room temperature and at −40 °C. The microstructure evolution during the deformation process was recorded using electron backscatter diffraction (EBSD) at different strain levels. Both σ -phase and χ -phase were observed along the grain boundaries in the microstructure in all heat treated specimens. Cracks started to form after 3–4% strain and were always oriented perpendicular to the tensile direction. After the cracks formed, they were initially arrested by the matrix. At later stages of the deformation process, cracks in larger σ -phase constituents started to coalesce. When the tensile test was conducted at −40 °C, the ductility increased for the specimen without σ -phase, but with σ -phase present, the ductility was slightly reduced. With larger amounts of σ -phase present, however, an increase in tensile strength was also observed. With χ -phase present along the grain boundaries, a reduction of tensile strength was observed. This reduction seems to be related to χ -phase precipitating at the grain boundaries, creating imperfections, but not contributing towards the increase in strength. Compared to the effect of σ -phase, the low temperature is not as influential on the materials performance.

1. Introduction

Duplex stainless steels (DSS) consist of two phases: austenite and ferrite. The two phases, in combination with the alloying elements, result in a steel with superior mechanical properties and corrosion resistance compared to steels with similar cost. DSS was first developed by the oil and gas industry for use in the North Sea. Here, it is typically used in process pipe systems and fittings exposed to corrosive environments at elevated temperature (up to 150 °C in H2S atmosphere) [1]. DSS typically contains 22% Cr, 5% Ni and 0.18% N, to achieve the desired phase composition and corrosion properties. If better corrosion properties are required, super duplex stainless steel (SDSS) can be used instead. This alloy contains a higher amount of Cr, Ni and N typically 25%, 7% and 0.3%, respectively. In order to achieve the desired phase composition, it is annealed at 1050 °C, and left there until a 50-50 phase balance between ferrite and austenite is obtained. During cooling after the heat treatment, precipitation of intermetallic phases ( σ , χ , π and R) may occur. These intermetallics have been found to considerably reduce the mechanical properties and corrosion resistance of the material [2,3,4,5,6,7,8,9,10,11,12,13]. The most common of these phases is the σ -phase. Even small amounts (<0.5%) of σ -phase will significantly reduce the fracture toughness [2,14]. This reduction, combined with the short time it takes for the phase to form and the deteriorating effect on corrosion properties, is what makes σ -phase a dangerous and strongly unwanted intermetallic.
The χ precipitates on ferrite/ferrite grain boundaries and occurs before the σ -phase [13,15]. In addition, the χ -phase is a metastable phase, consumed during σ -phase precipitation [13]. σ -phase typically forms on austenite/ferrite boundaries, but can also form on ferrite/ferrite boundaries. The σ -phase forms in the temperature range 675 °C–900 °C. After 10 min at 850 °C, small amounts of σ -phase will start to precipitate [6,16,17]. σ -phase has a body centered tetragonal crystal structure with the lattice parameters a = 8.8 Å and c = 4.55 Å, while the χ -phase has a body centered cubic crystal structure with lattice parameter a = 8.8 Å [18]. The lattice parameters of both are significantly larger than the 2.87 Å and 3.65 Å for ferrites and austenite, respectively [19,20]. The chemical composition of σ -phase includes, in addition to Fe, approximately 30–60% Cr and 4–10% Mo. The χ -phase differs from σ -phase with a higher Mo content and a lower content of Cr [15]. As a result, since χ -phase has a higher atomic weight, it is possible to distinguish it from σ -phase in a scanning electron microscope (SEM) using Z-contrast. In such an image, the χ -phase will appear brighter. Since Cr and Mo are stabilizing elements for ferrite, the σ and χ -phase will form at the expense of ferrite. Following the eutectoid reaction α σ + γ or α χ + γ , an increase in the austenite phase will also occur [15,17]. The surrounding area will be depleted of Cr and Mo, which are important elements for corrosion protection and, as a consequence, leaving the material exposed. This is especially troublesome in SDSS since these are mostly selected to operate in areas requiring a corrosion resistance superior to DSS.
A study by Børvik et al. [2] looked into the low-temperature effect on σ -phase in DSS. It was found that the temperature had a minor effect on the tensile ductility, while increasing amounts of σ -phase in the structure considerably reduced the ductility. Another study by Kim et al. [21] investigated the low-temperature mechanical behavior of SDSS containing σ -phase. Here, the material was tested in a universal tensile test machine, equipped with a sub-zero chamber. After the specimens were tested, the microstructure was investigated, comparing the amount of σ -phase present with microcrack length. Microcracks were found to have propagated through the entire σ -phase, relating the crack length to the size of σ -phase inclusions. As in Børvik et al. [2], the influence of temperature was observed to be minor. In addition, in the tensile tests performed at −50 °C, no strain-induced martensite was produced.
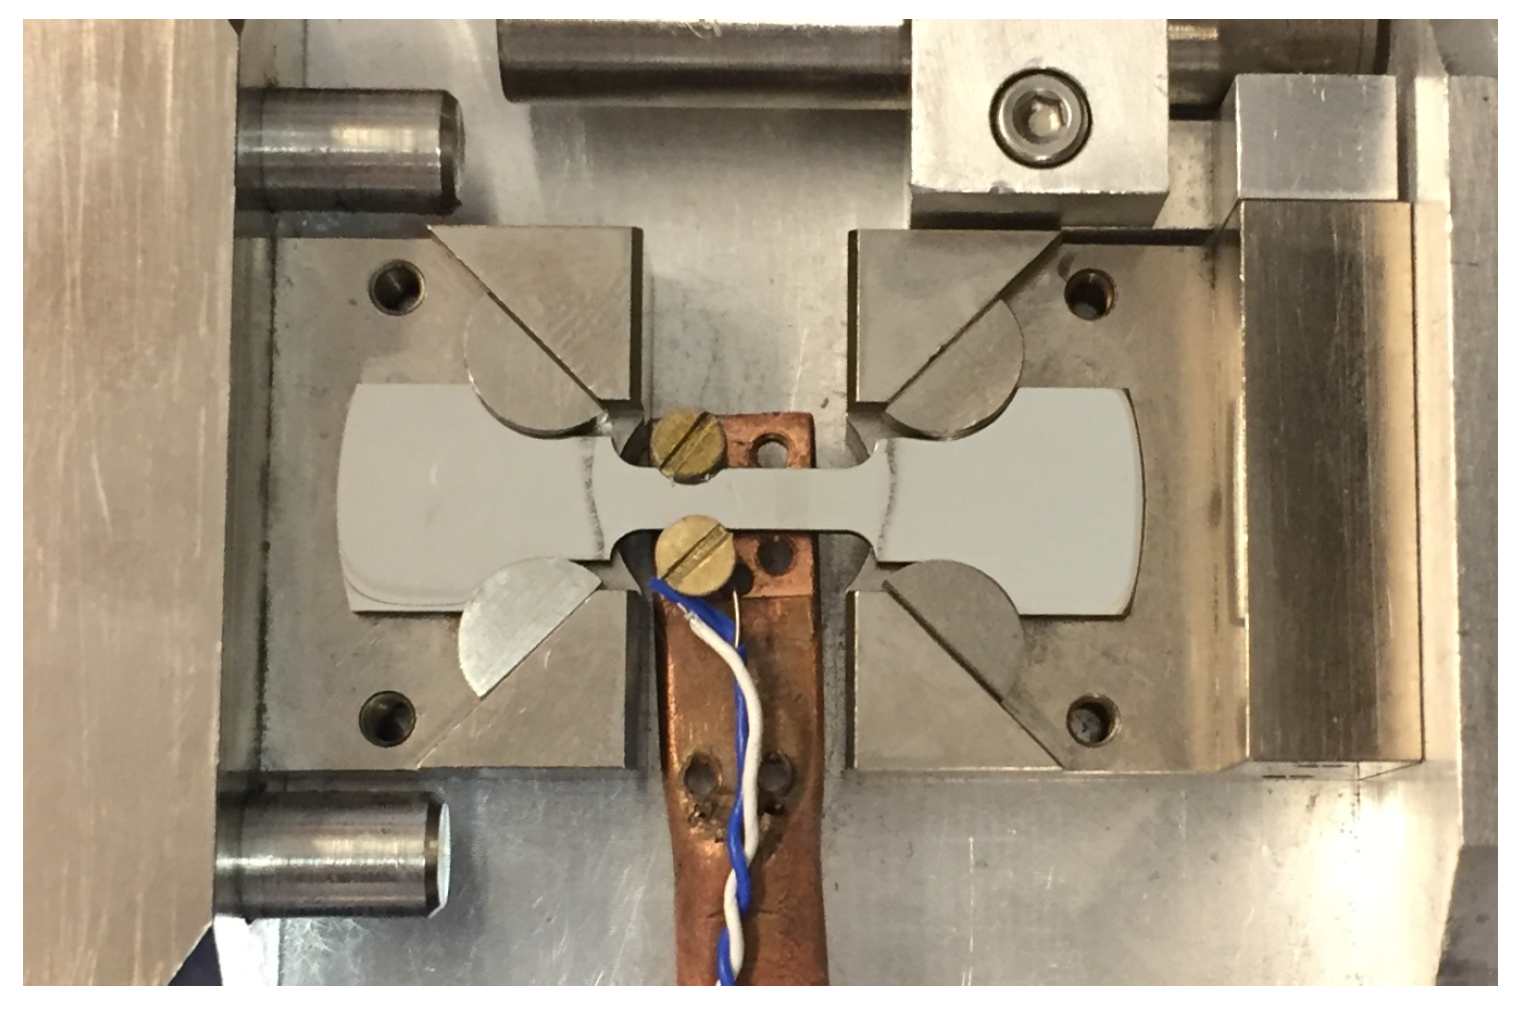
In the present study, in situ SEM tensile tests have been conducted on an SDSS with 0%, 5% and 10% σ -phase present in the microstructure. The tensile tests were carried out at both room temperature and sub-zero temperature (−40 °C). The microstructure was monitored with secondary electron imaging and electron backscatter diffraction (EBSD). Images were acquired at different loading steps. From these results, it is possible to observe the microstructure evolution and study the effects of χ -phase and σ -phase on the microstructure during the deformation process.

2. Materials and Methods

2.1. Material and Heat Treatments

The investigated material in this study was a 2507 SDSS, with the chemical composition listed in Table 1. This pipe was manufactured by welding a rolled plate along the length of the pipe. The microstructure of the steel investigated here contained more ferrite than austenite, 56.3% and 43.7%, respectively. The grain size in the two phases is also different, with ferrite having larger grains compared with austenite grains. These results have been summarized in Table 2. In addition, the grains have different morphology in different directions. Figure 1 gives a phase map of the pipe in three different directions. Here, LD, RD, and TD are abbreviations for longitudinal direction, radial direction, and transverse directions, respectively. The meaning of these are illustrated in Figure 2a.
Specimens being used for EBSD analysis need a completely smooth surface, where the deformation layer at the surface has to be removed. For SDSS this was done by grinding and polishing down to 1 µm, followed by electropolishing. The settings used are summarized in Table 3. Specimens were spark eroded from a 10 mm thick pipe to the dimensions in Figure 2b. All specimens were parallel to the length of the pipe, as illustrated in Figure 2a. The observed plane in the specimen during an in situ experiment has TD as plane normal.
The material was heat treated to achieve different amounts of σ -phase in the structure. Specimens were placed in a pre-heated oven at 850 °C for 12 min, 15 min, 20 min and 25 min. Cooling was performed by quenching in a water bath at room temperature. The heat treatment and the resulting amount of σ -phase achieved are summarized in Table 4. Phase maps from EBSD scans were used to quantify amounts of σ -phase present. These will not be exact measurements since they were only taken from the surface. The results from Elstad [16] was used to determine the heat treatment procedures used in this work. However, σ -phase precipitation was not constant with the same heat treatment being performed. Resulting in significant variation in σ -phase content during the heat treatment. All specimens in this work are heat treated as described in Table 4, but only specimens with amounts roughly in the region indicated in the third column were used for the in situ tests. However, the deviation was less than 1% for the 5% specimen, measured by EBSD. For the specimens with larger amounts of σ -phase present, the deviation was 1–2%.

2.2. Materials Characterization

During this experiment, the microstructure was monitored using secondary electron imaging and EBSD. Images were acquired at different loading steps. At each step, the same area (350 µm × 350 µm) was recorded with EBSD, using a step size of 1 µm. From these results, it is possible to observe the microstructure evolution and study the effects of σ -phase and χ -phase on the microstructure during the deformation process. The microscope used was a Field Emission SEM Zeiss Ultra 55 Limited Edition (Jena, Germany) with a NORDIF UF-1100 EBSD detector (Trondheim, Norway), with the microscope settings given in Table 5. Z-contrast imaging mode was used in order to distinguish σ -phase from χ -phase during the experiments.

2.3. Tensile Testing

The specimen was deformed using a spindle-driven in situ tensile device. This device was placed inside the vacuum chamber of the SEM to monitor the microstructure. In situ tensile tests were carried out at both room temperature and at −40 °C for specimens containing 0%, 5% and 10% σ -phase. Tensile tests were also performed on specimens containing 15% and 20% of σ -phase, however, no in situ investigation or low-temperature testing was carried out on these specimens, due to their purely brittle behavior. The in situ tensile tests were carried out with a constant ramp speed of 1 µm/s. This corresponds to a strain rate of 1.11 × 10⁻⁴ s−1. For further reading and previous use of the in situ device, the reader is referred to [22,23]. When performing the sub-zero experiments, a cold finger was attached to the specimen as shown in Figure 3. This cold finger is made from 99.99% Cu. It goes from the specimen, through the microscope door, into a dewar filled with liquid N. The blue and white wire seen in Figure 3 is a thermocouple. It was placed between the screw-head and specimen throughout the experiment. The temperature was measured to be in the interval −35 °C and −45 °C for all specimens. However, the fluctuations in temperature are assumed to be due to the variable thermal resistance between the thermocouple and specimen. This variation is a result of the thermocouple shifting position during straining. The temperature is assumed constant and reported as −40 °C in this paper.

3. Results

3.1. Tensile Properties and Fracture Surfaces

The tensile test curves for the specimens tested in this work are shown in Figure 4. As seen from these curves, the specimens with more than 10% σ -phase present exhibit a purely brittle behavior at room temperature and do not deform plastically before fracture. For that reason, these specimens are not suitable for in situ and low-temperature investigations. Hence, only specimens containing roughly 5% and 10% σ -phase are further investigated. The specimens containing 0% σ -phase are included as a reference.
The stress–strain curves in Figure 4 show that small amounts of σ -phase greatly affect the tensile properties of the material. Another observation is the short time at the critical temperature it takes before the material is completely brittle (cf. Table 4). Specimens containing 15% and 20% σ -phase only deforms elastically before fracture. A general remark is that the yield strength increases at low temperature and the strain at fracture decrease with an increasing amount of intermetallic phases. Conversely, for the material not heat treated, there is an increase of fracture strain. In addition, the drops in the curves are from when the tensile test is paused for EBSD acquisition. A curious observation from the tensile test curve is that the tests containing 5% σ -phase have a lower yield strength and ultimate tensile strength (UTS). In Figure 5, the microstructure of one of these specimens can be seen. Along the grain boundaries, the χ -phase has precipitated as a thin continuous layer of approximately 200 nm thickness. This image was acquired during the test at room temperature, after 4% strain. In the center of the image is a σ -phase island, with two cracks marked with white circles. The χ -phase also contains numerous small cracks, seen in the black circles in Figure 5, which seem to contribute towards a reduction in strength. When the amount of σ -phase increases, it also adds towards increased tensile strength.
In Figure 6, the fracture surfaces of the specimens tested at room temperature with 0%, 5% and 10% σ -phase are presented. To the left is an overview of the total surface area and to the right is a close-up image showing the fracture surface at a higher magnification. The reference sample exhibits classic ductile fracture features, with a large reduction of area and the typical cup and cone dimpled structure at the surface. This is also expected when compared to the tensile test curve (Figure 4). In the specimen with 5% σ -phase present, Figure 6b, some reduction in area is observed—however, not as great as in the test with 0% σ -phase present. In addition, here the fracture surface appears to be mixed between a ductile dimpled structure and a brittle faceted structure. Conversely, the specimen containing 10% σ -phase, Figure 6c, has all the characteristics of a brittle fracture. There is little to no reduction in area and completely faceted fracture surface, despite having a 10% fracture strain.

3.2. Microstructure Evolution

During the tensile tests, specimens containing different amounts of σ -phase were recorded using secondary electron imaging and EBSD to observe the microstructure throughout the deformation process. EBSD scans were obtained at the same area at approximately 0%, 2% and 6% strain of all tested specimens. Each of the tensile test curves in Figure 4 showed a drop when the test was paused for the acquisition of EBSD scans and secondary electron imaging. An observation is that the specimen with 0% σ -phase, tested at −40 °C, has a greater fracture strain than the specimen tested at room temperature.
In all specimens containing σ -phase, cracks were observed throughout the microstructure. These were observed to form after 3–4% strain in all the specimens, initiating in the σ -phase. Typical size of the cracks is seen in Figure 7. In Figure 8, two micrographs acquired at 6% and 10% strain show several micro-sized cracks in the σ -phase. During further straining, these cracks widen and appears to propagate deeper into the specimen. The ferrite and austenite grain boundaries act as a barrier for the cracks to propagate further. However, the larger constituents of σ -phase in the matrix contain large cracks, which eventually will propagate through the matrix. This is seen in the center of both frames in Figure 8. The microcracks in Figure 8a grow, and, in Figure 8b (black circle), they have coalesced, forming one large crack. A close-up of this crack is shown in Figure 9. This is a phase map superimposed on to an image quality (IQ) map from EBSD, acquired with a step size of 50 nm. From this map, it can be seen that the crack propagates along grain boundaries when it is moving through the matrix. When the cracks start to coalesce, the material is close to fracturing, as the volume fraction of cracks is increasing fast. The micrograph in Figure 8b was acquired after 10% strain. The specimen fractured after being strained less than 1% further. It is possible to see how the cracks in the white circles widen from Figure 8a to Figure 8b. Presumably, they are propagating through the thickness of the material.
In Figure 10, the grain orientation spread (GOS) in the different tests are shown. All curves are obtained after 6% global strain. The GOS gives a quantitative description of the crystallographic orientation gradients in individual grains [24,25]. It is found by calculating the average orientation deviation of all points in a grain from the average grain orientation. A higher spread would indicate that those grains are accommodating a larger deformation compared to a lower spread. However, as seen from the graphs, there is, in general, a low spread, with peaks for all tests around 1–2°. One notable deviation is the curves from the experiment at −40 °C with 0% σ -phase present in Figure 10b. These grains seem to accommodate more deformation, with a larger GOS distribution compared to other curves in Figure 10. Another observation is that the ferrite and austenite phases have nearly identical curves in the low-temperature test in Figure 10b, while the phases are behaving differently at room temperature (Figure 10a). During the room temperature tests, all curves for ferrite grains have a taller peak compared to austenite grains. In addition, the specimen with 5% σ has a higher GOS peak-value compared to the specimen containing 10% σ -phase when tested at −40 °C. At room temperature, the austenite for both tests is fairly similar, while the ferrite is accommodating more deformation in the specimen with 5% σ -phase.

4. Discussion

During this work, different specimens of super duplex stainless steel, containing varying amounts of σ -phase have been investigated, during an in situ SEM tensile test. Each specimen was taken from a pipe segment and heat treated to get different amounts of σ -phase present. In general, it took roughly 10 min for the intermetallic phases to start forming at 850 °C. During the next 10 min, approximately 15% of σ -phase had precipitated, and the material had changed to an utterly brittle behavior, as seen in Figure 4. It proved hard to meet our targets of 5% and 10% σ -phase, sometimes achieving 0% after 13 min and other times 15% after 15 min at 850 °C. However, when the σ -phase starts to precipitate, it forms fast. Since duplex steels are being heat treated, typically at 1050 °C, to achieve its final microstructure and often goes through other heat treatment, e.g., welding, a thorough control of the cooling rate is crucial. In addition, no ductile-to-brittle transition was observed in this work. This was also the case in the work of Børvik et al. [2] and Kim et al. [21]. In these works, DSS and SDSS, respectively, were tested at −50 °C and no transition was observed. This means that, if the material has a ductile-to-brittle transition temperature, it is lower than −50 °C.
As seen from Figure 4, additions of σ -phase significantly reduce the ductility. This phenomenon is also well documented by others in previous studies [2,3,5,7,9]. However, in this study, the microstructure has been closely monitored during the tensile test to elucidate how it is accommodating the σ -phase in relation to deformation. The GOS in grains from the austenite and ferrite (shown in Figure 10) suggests that the presence of σ -phase and low temperature (−40 °C) is influencing the deformation behavior of the matrix. A consequence of presence of σ -phase is a lower fraction of ferrite. This altered phase balance, in combination with much harder particles containing numerous cracks explains this difference in behavior between specimens with and without σ -phase present. However, the primary concern is the brittle nature of σ -
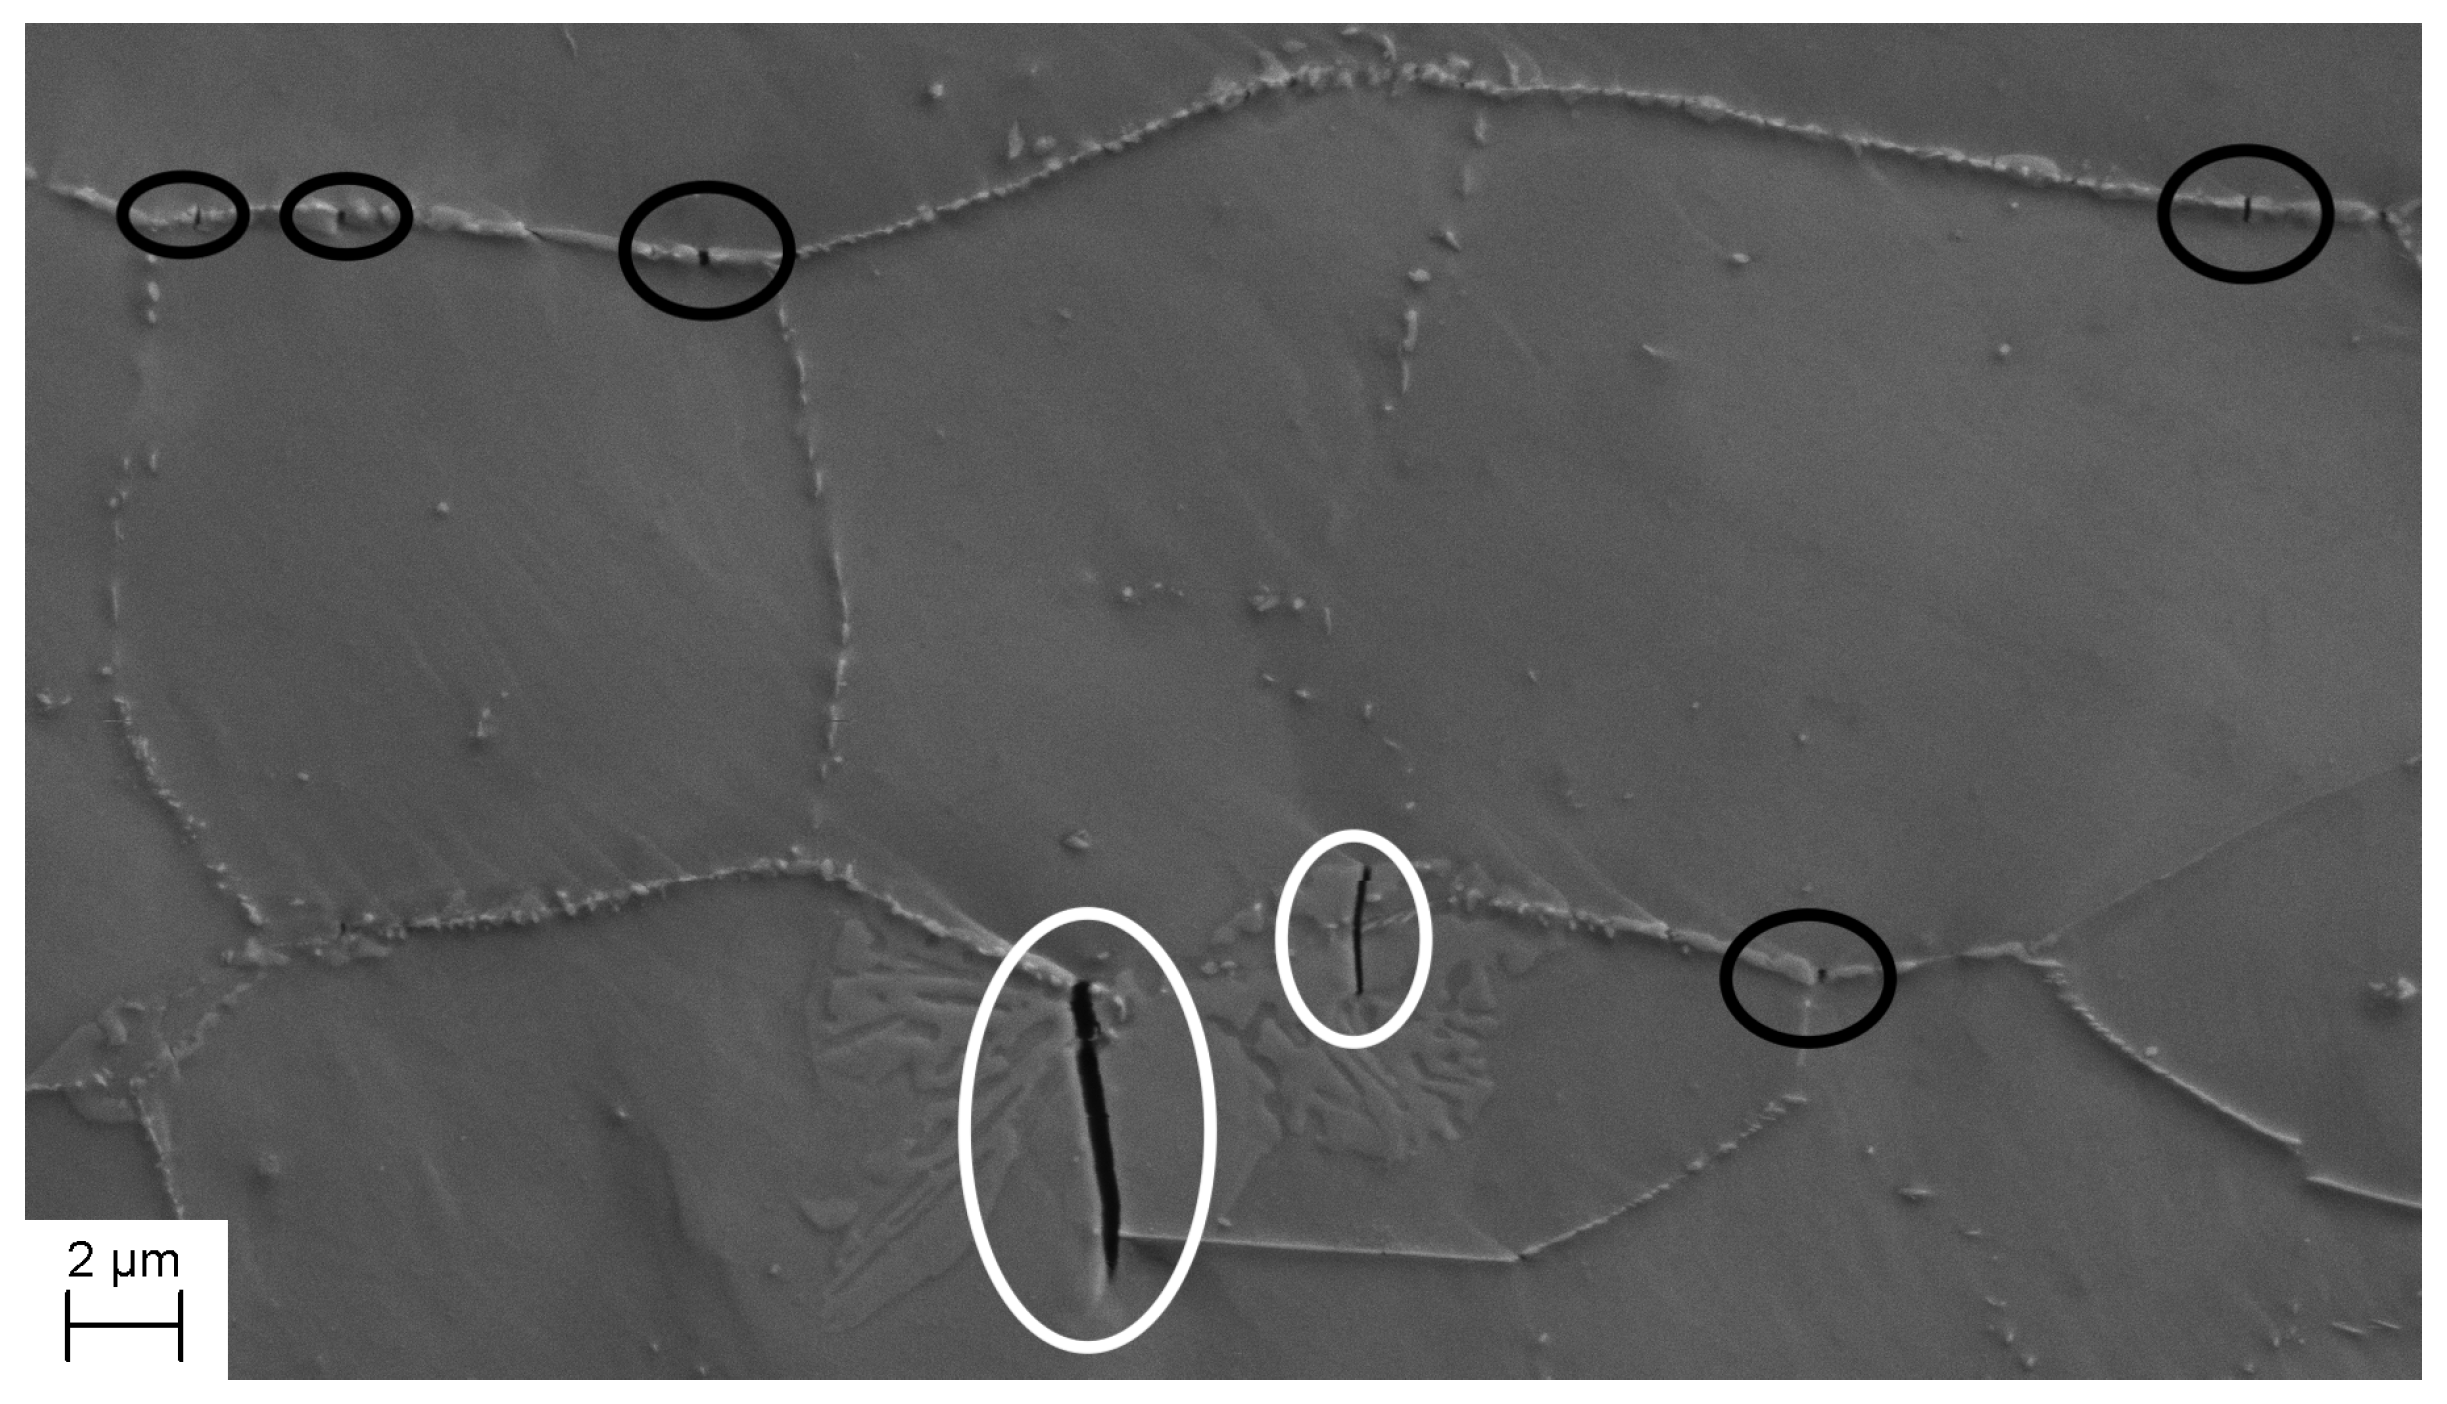
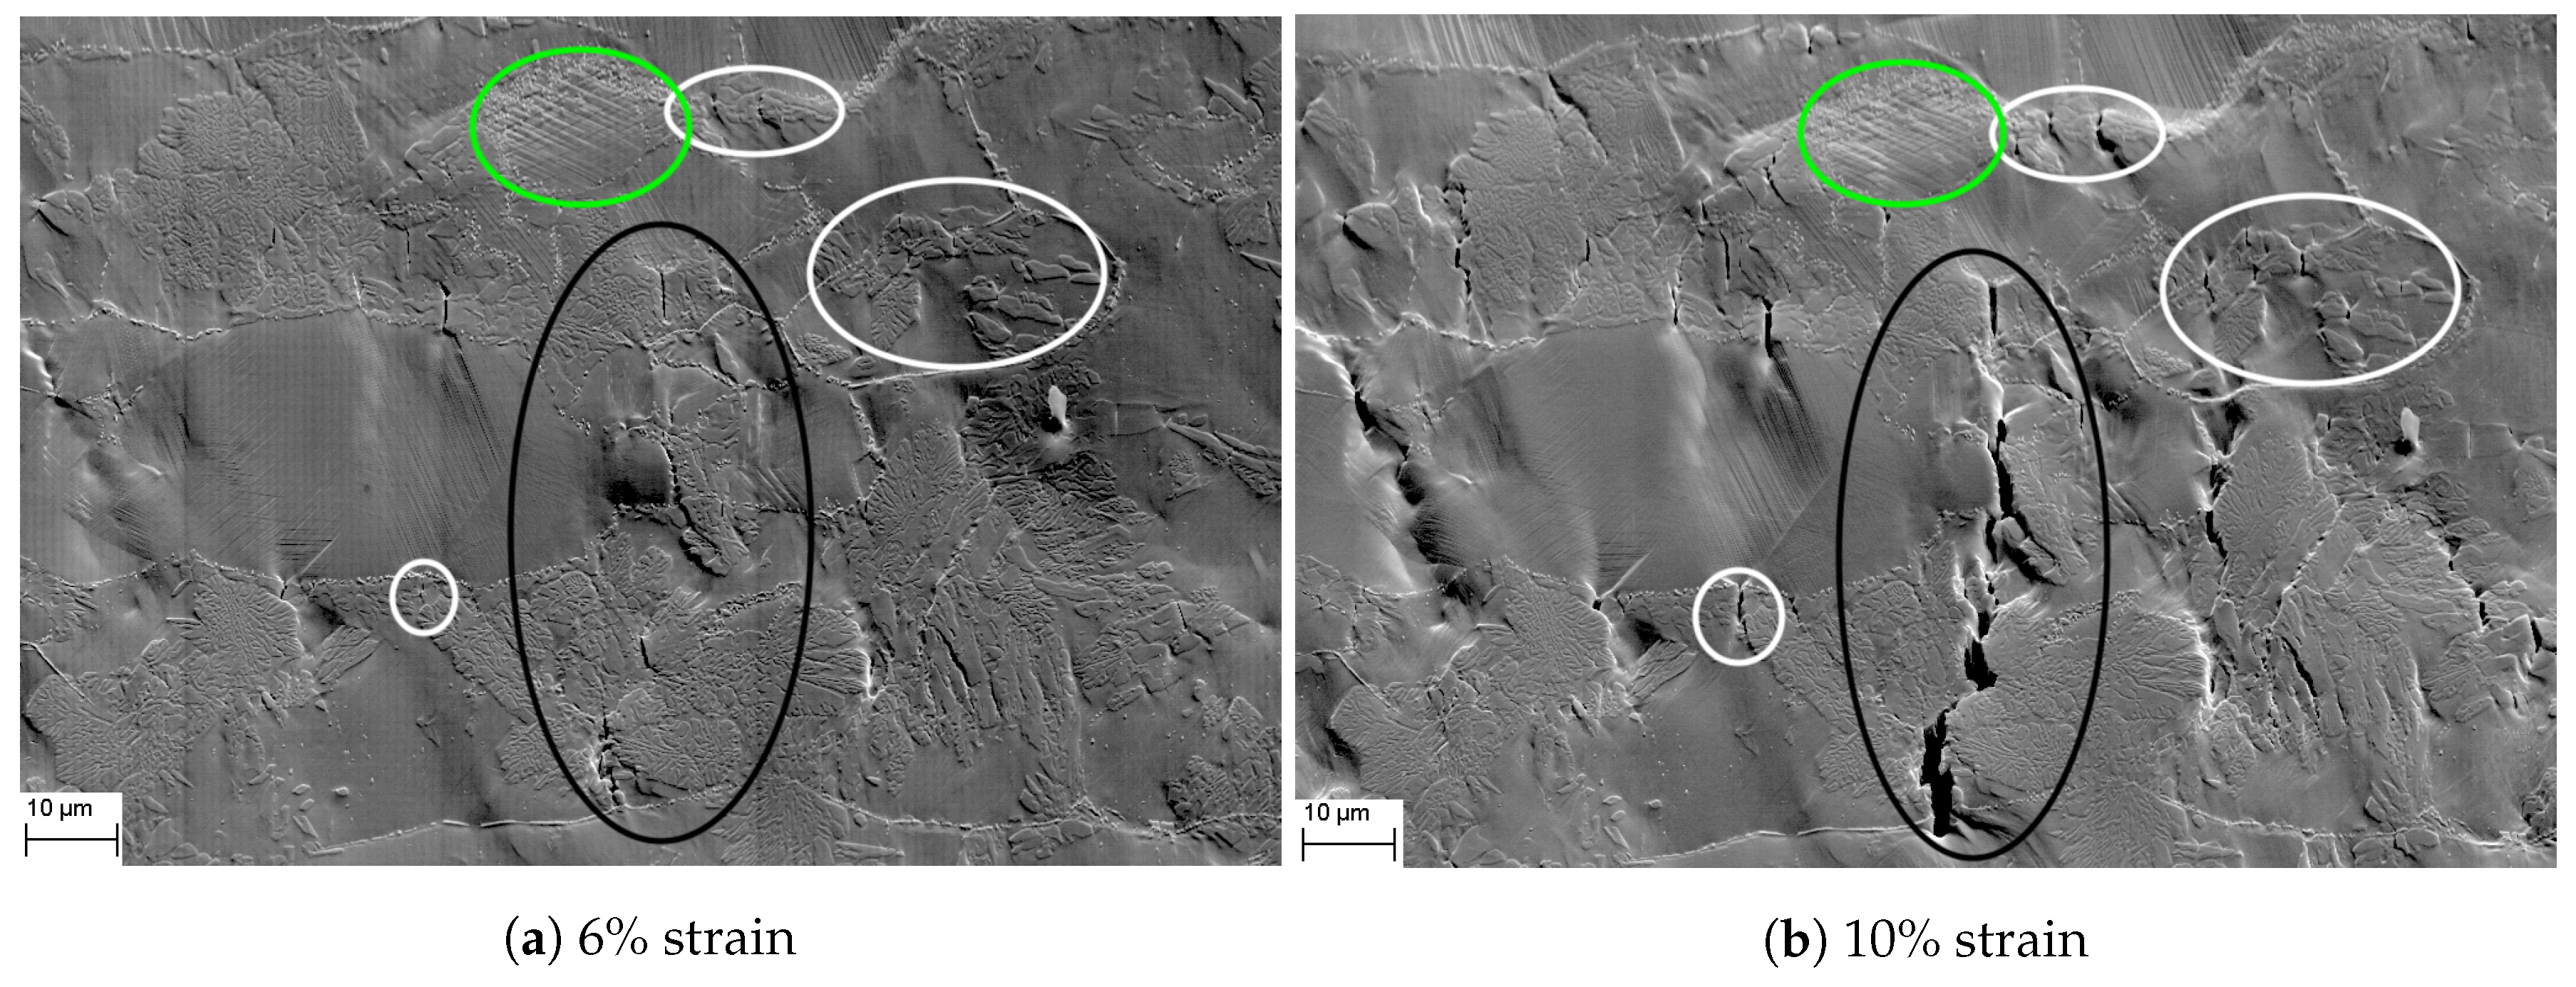
phase. Cracks were observed in the σ -phase at 3–4% strain in all specimens, and all cracks were oriented perpendicular to the tensile direction. During the initial stages, the surrounding matrix restricts the growth of the crack. As the material is strained further, the cracks continues to widen. Eventually, the cracks start to propagate and coalesce. In specimens with higher amounts of σ -phase, the propagation occurs earlier, following the shorter distance to the nearest σ -phase inclusion. In addition, the σ -phase particles are larger and the cracks, therefore, grow to a larger size.
The influence of temperature seems to make the σ -phase somewhat more brittle, resulting in a higher UTS and lower ductility. Austenite and ferrite grains seem to behave similarly during the low-temperature tests with σ -phase present when studying Figure 10b. However, during the test at room temperature, the ferrite accommodates more deformation compared to the austenite. This is seen from the curves in Figure 10a. The reason for the ferrite being more active is believed to be due to the fact that ferrite has 48 active slip systems at room temperature. Conversely, austenite has 12 slip systems and they are not dependent on temperature. With more slip systems available, there are more ways for the dislocations to propagate. In addition, the specimens without any σ -phase present have a larger GOS compared to the specimens containing σ -phase. This indicates that the presence of σ -phase in the structure is retarding the deformation of ferrite and austenite. This is also observed through visual inspection of micrographs. There are more slip lines present, at equal strain level, in specimens without σ -phase present.
An observation of a specimen with 0% σ -phase, tested at −40 °C, has a greater fracture strain than the specimen tested at room temperature. It could be expected that the ferrite would have a brittle behavior at this temperature. A reason for this behavior might be due to the fact that SDSS is a highly alloyed material, containing elements improving the low-temperature performance of ferrite. In addition, the presence of austenite will improve low-temperature performance. It has been reported in several studies that austenitic steels have increased ductility at −50 °C in static uniaxial tensile tests [26,27,28].
Looking at the tensile test curve in Figure 4 for the tests with 5% σ -phase, a lower tensile strength compared to the curve without any σ -phase present is observed. Conversely, a greater amount of σ -phase gives a contribution towards increased strength. An explanation for this can be the relative amount of χ -phase present. As seen from the black circles in Figure 5, the χ -phase precipitates along grain boundaries and is very brittle containing many cracks. These cracks result in the observed reduction of tensile strength. However, the size of the cracks in χ -phase are subcritical and does not contribute towards a large reduction in ductility. The specimen containing 5% σ -phase is still a very ductile material, with a fracture strain of 35%–38%. This is in contrast to previously reported literature. As mentioned in the Introduction, it has been reported that specimens with only 0.5% σ -phase have significantly reduced fracture toughness. However, as discussed in Børvik et al. [2] and Børvik et al. [3], DSS are more sensitive towards σ -phase with respect to fracture toughness than to tensile ductility. In this work, all specimens were tested strain rate of 1.11 × 10⁻⁴ s−1. In addition, the tensile tests were paused at certain intervals to acquire images and EBSD scans. In Børvik et al. [2], an increase in flow stress of about 30% was found for DSS when the strain rate was increased from 5 × 10⁻⁴ s−1 to 50 s−1 based on tensile tests.
No strain-induced martensite was observed in any of the specimens investigated in this work. This indicates a very stable austenitic phase. However, this is not unexpected, since the σ -phase is formed at the expense of ferrite, not austenite. The alloying elements added to stabilize the austenitic phase are still present in the matrix. In the work by Kim et al. [21], there was also no martensite observed.

5. Conclusions

  • The cracks in χ -phase contribute towards a lower flow stress but were not of critical size concerning a large reduction in tensile ductility. The specimens with small amounts of χ -phase and σ -phase still retained a ductility of 35%.
  • Visible cracks start to form after 3–4% strain, regardless of σ -phase content and they all form perpendicular to the tensile direction.
  • During the initial stages of deformation, the cracks are constrained by the ferrite/austenite matrix. However, during the later stages, these cracks start to propagate through the material and coalesce. This occurs moments before fracture.
  • The ferrite accommodates more deformation than austenite at room temperature tests; however, during low-temperature tests, both phases have a more equal behavior during deformation.
  • At low temperature, with σ -present, the material had slightly higher flow stress and lower ductility. However, the amount of σ -phase present is the most important aspect when it comes to duplex steels. It alters the phase balance of ferrite and austenite and deteriorates the mechanical properties.

Author Contributions

C.O.P. is the first author and analyzed the data and wrote the paper. The experiments were performed by C.O.P. and R.L.B. I.W., M.K., and J.H. conceived, designed and supervised the experiments. In addition, they contributed to the interpretation of data and editing the paper.

Funding

This research received no external funding.

Conflicts of Interest

The authors declare no conflict of interest.

Abbreviations

The following abbreviations are used in this manuscript
CASACentre for Advanced Structural Analysis
DSSDuplex Stainless Steel
EBSDElectron Backscatter Diffraction
GOSGrain Orientation Spread
IQImage Quality
LDLongitudinal Direction
NTNUNorwegian University of Science and Technology
RDRadial Direction
RTRoom Temperature
SDSSSuper Duplex Stainless Steel
SEMScanning Electron Microscope
TDTransverse Direction
UTSUltimate Tensile Strength

References

  1. NORSOK Standard. Materials Selection. 2004. Available online: http://www.standard.no/pagefiles/1174/m-dp-001r1.pdf (accessed on 11 June 2018).
  2. Børvik, T.; Lange, H.; Marken, L.A.; Langseth, M.; Hopperstad, O.S.; Aursand, M.; Rørvik, G. Pipe fittings in duplex stainless steel with deviation in quality caused by sigma phase precipitation. Mater. Sci. Eng. A 2010, 527, 6945–6955. [Google Scholar] [CrossRef]
  3. Børvik, T.; Marken, L.A.; Langseth, M.; Rørvik, G.; Hopperstad, O.S. Influence of sigma-phase precipitation on the impact behaviour of duplex stainless steel pipe fittings. Ships Offshore Struct. 2016, 11, 25–37. [Google Scholar] [CrossRef]
  4. Lee, Y.H.; Kim, K.T.; Lee, Y.D.; Kim, K.Y. Effects of W substitution on ς and χ phase precipitation and toughness in duplex stainless steels. Mater. Sci. Technol. 1998, 14, 757–764. [Google Scholar] [CrossRef]
  5. Kim, S.B.; Paik, K.W.; Kim, Y.G. Effect of Mo substitution by W on high temperature embrittlement characteristics in duplex stainless steels. Mater. Sci. Eng. A 1998, 247, 67–74. [Google Scholar] [CrossRef]
  6. Lopez, N.; Cid, M.; Puiggali, M. Influence of σ-phase on mechanical properties and corrosion resistance of duplex stainless steels. Corros. Sci. 1999, 41, 1615–1631. [Google Scholar] [CrossRef]
  7. Chen, T.H.; Yang, J.R. Effects of solution treatment and continuous cooling on σ-phase precipitation in a 2205 duplex stainless steel. Mater. Sci. Eng. A 2001, 311, 28–41. [Google Scholar] [CrossRef]
  8. Chen, T.H.; Weng, K.L.; Yang, J.R. The effect of high-temperature exposure on the microstructural stability and toughness property in a 2205 duplex stainless steel. Mater. Sci. Eng. A 2002, 338, 259–270. [Google Scholar] [CrossRef]
  9. Zucato, I.; Moreira, M.C.; Machado, I.F.; Lebrão, S.M.G. Microstructural characterization and the effect of phase transformations on toughness of the UNS S31803 duplex stainless steel aged treated at 850 °C. Mater. Res. 2002, 5, 385–389. [Google Scholar] [CrossRef]
  10. Cvijović, Z.; Radenković, G. Microstructure and pitting corrosion resistance of annealed duplex stainless steel. Corros. Sci. 2006, 48, 3887–3906. [Google Scholar] [CrossRef]
  11. Michalska, J.; Sozańska, M. Qualitative and quantitative analysis of σ and χ phases in 2205 duplex stainless steel. Mater. Charact. 2006, 56, 355–362. [Google Scholar] [CrossRef]
  12. Souza, C.M.; Abreu, H.F.G.; Tavares, S.S.M.; Rebello, J.M.A. The σ phase formation in annealed UNS S31803 duplex stainless steel: Texture aspects. Mater. Charact. 2008, 59, 1301–1306. [Google Scholar] [CrossRef]
  13. Pohl, M.; Storz, O.; Glogowski, T. Effect of intermetallic precipitations on the properties of duplex stainless steel. Mater. Charact. 2007, 58, 65–71. [Google Scholar] [CrossRef]
  14. Calliari, I.; Zanesco, M.; Ramous, E. Influence of isothermal aging on secondary phases precipitation and toughness of a duplex stainless steel SAF 2205. J. Mater. Sci. 2006, 41, 7643–7649. [Google Scholar] [CrossRef]
  15. Escriba, D.; Materna-Morris, E.; Plaut, R.; Padilha, A. Chi-phase precipitation in a duplex stainless steel. Mater. Charact. 2009, 60, 1214–1219. [Google Scholar] [CrossRef]
  16. Elstad, K.R. In Situ Tensile Testing During Continuous EBSD Mapping of Super Duplex Stainless Steel Containing Sigma Phase. 2016. Available online: http://hdl.handle.net/11250/2418016 (accessed on 25 May 2018).
  17. Stradomski, Z.; Dyja, D. Sigma Phase Precipitation in Duplex Phase Stainless Steels. 2009. Available online: http://www.ysesm.ing.unibo.it/Abstract/57Dyja.pdf (accessed on 25 May 2018).
  18. Padilha, A.F.; Rios, P.R. Decomposition of Austenite in Austenitic Stainless Steels. ISIJ Int. 2002, 42, 325–327. [Google Scholar] [CrossRef] [Green Version]
  19. Cahn, R.W.; Haasen, P.; Kramer, E.J. Materials Science and Technology: A Comprehensive Treatment—Volume 1: Structure of Solids; Wiley-VCH: Weinheim, Germnay, 2005. [Google Scholar]
  20. Cahn, R.W.; Haasen, P.; Kramer, E.J. Materials Science and Technology: A Comprehensive Treatment—Volume 7: Constitution and Properties of Steel; Wiley-VCH: Weinheim, Germnay, 2005. [Google Scholar]
  21. Kim, S.K.; Kang, K.Y.; Kim, M.S.; Lee, J.M. Low-temperature mechanical behavior of super duplex stainless steel with sigma precipitation. Metals 2015, 5, 1732–1745. [Google Scholar] [CrossRef]
  22. Karlsen, M.; Hjelen, J.; Grong, Ø.; Rørvik, G.; Chiron, R.; Schubert, U.; Nilsen, E. SEM/EBSD based in situ studies of deformation induced phase transformations in supermartensitic stainless steels. Mater. Sci. Technol. 2008, 24, 64–72. [Google Scholar] [CrossRef]
  23. Karlsen, M.; Grong, Ø.; Søfferud, M.; Hjelen, J.; Rørvik, G.; Chiron, R. Scanning Electron Microscopy/Electron Backscatter Diffraction—Based Observations of Martensite Variant Selection and Slip Plane Activity in Supermartensitic Stainless Steels during Plastic Deformation at Elevated, Ambient, and Subzero Temperatures. Metall. Mater. Trans. A 2009, 40, 310–320. [Google Scholar] [CrossRef]
  24. Jorge-Badiola, D.; Iza-Mendia, A.; Gutiérrez, I. Study by EBSD of the development of the substructure in a hot deformed 304 stainless steel. Mater. Sci. Eng. A 2005, 394, 445–454. [Google Scholar] [CrossRef]
  25. Mitsche, S.; Poelt, P.; Sommitsch, C. Recrystallization behaviour of the nickel-based alloy 80 A during hot forming. J. Microsc. 2007, 227, 267–274. [Google Scholar] [CrossRef] [PubMed] [Green Version]
  26. Byun, T.; Hashimoto, N.; Farrell, K. Temperature dependence of strain hardening and plastic instability behaviors in austenitic stainless steels. Acta Mater. 2004, 52, 3889–3899. [Google Scholar] [CrossRef]
  27. Lee, K.J.; Chun, M.S.; Kim, M.H.; Lee, J.M. A new constitutive model of austenitic stainless steel for cryogenic applications. Comput. Mater. Sci. 2009, 46, 1152–1162. [Google Scholar] [CrossRef]
  28. Park, W.S.; Yoo, S.W.; Kim, M.H.; Lee, J.M. Strain-rate effects on the mechanical behavior of the AISI 300 series of austenitic stainless steel under cryogenic environments. Mater. Des. 2010, 31, 3630–3640. [Google Scholar] [CrossRef]
Figure 1. An illustration of the microstructure with the phases illustrated. The dimensions of the cube are 500 µm × 500 µm × 500 µm, green representing ferrite and red representing austenite. In the bottom right corner of each side, the plane normal is given. LD, RD, and TD are illustrated in Figure 2a.
Metals 08 00478 g001
Figure 2. (a) an illustration on how the specimens were taken from the SDSS pipe and gives the definition of LD, RD and TD. The specimen dimensions is magnified compared to the pipe for illustration purpose; (b) specimen geometry, with all measurements in mm. The specimen had an original thickness of 2 mm before grinding and polishing.
Metals 08 00478 g002
Figure 3. Cold finger attached to the specimen with a thermocouple placed between the screw-head and specimen.
Metals 08 00478 g003
Figure 4. Tensile test curves obtained during the in situ tensile tests. The drops in the curves are when the test is paused for acquiring EBSD data.
Metals 08 00478 g004
Figure 5. A close up micrograph from the specimen containing 5% σ -phase, after 4% strain, tested at room temperature. Along the grain boundaries, the χ -phase can be found, and, in the center, a larger island of σ -Phase is seen. The white circles show cracks in the σ -phase and the black circles show the cracks in the χ -phase.
Metals 08 00478 g005
Figure 6. Fracture surfaces for the tensile test specimens with (a) 0%, (b) 5% and (c) 10% σ -phase, tested at room temperature. To the left is the total fracture area and to the right is a close-up of the fracture surface.
Metals 08 00478 g006
Figure 7. Micro-crack formed in the σ -phase during the initial stages of deformation. This frame is acquired after 6% strain, during the low temperature test with 5% σ -phase.
Metals 08 00478 g007
Figure 8. Micrographs of cracks formed in the σ -phase, taken from the test carried out at room temperature with 10% σ -phase present. Some cracks are restricted by the matrix while some propagate and coalesce. In the green circle, a heavily deformed austenite grain with cross-slip is seen. The white circles show microcracks restrained by the matrix and the large crack in the black circle was formed when many smaller cracks coalesce. A close-up of this crack is shown in Figure 9.
Metals 08 00478 g008
Figure 9. A close-up of the crack shown in the black circle in Figure 8b. This is a phase map with an IQ map overlay, acquired by EBSD. The red is austenite, green is ferrite and mustard yellow is σ -phase. The EBSD-scan of this area was acquired with a step size of 50 nm.
Metals 08 00478 g009
Figure 10. The grain orientation spread curves for the different specimens. (a) are the specimens tested at room temperature and (b) are the specimens tested at −40 °C. All curves were taken after 6% strain. The solid lines are ferrite and the dashed lines are austenite.
Metals 08 00478 g010
Table 1. Chemical composition of 2507 SDSS.
ElementCSiMnPSCrMoNiCuWN
wt%0.0180.420.520.0170.00125.553.468.280.720.520.25
Table 2. Microstructure statistics summarized. The data was collected from EBSD scans.
AverageFerriteAusteniteOverall
Composition56.3%43.7%100%
Grain size9 µm6.5 µm7.9 µm
Table 3. Parameters used during the electropolishing.
ElectrolyteStruers A2
Voltage [V]20
Time [s]15
Temperature [°C]22
Table 4. Heat treatment and resulting amount of σ -phase in the specimens tested.
Temperature [°C]Time [min]Amount σ -Phase [%]
--0
850125
8501510
8502015
8502520
Table 5. SEM parameters used during EBSD acquisition.
Acceleration Voltage [kV]20
Working distance [mm]24.6–25.4
Tilt angle [°]70
Aperture size [µm]300
Probe current [nA]65–70

