Article

Designed Materials by Additive Manufacturing—Impact of Exposure Strategies and Parameters on Material Characteristics of AlSi10Mg Processed by Laser Beam Melting

Fraunhofer Institute for High–Speed Dynamics, Ernst-Mach-Institut, Ernst-Zermelo-Str. 4, 79104 Freiburg, Germany
*
Author to whom correspondence should be addressed.
Metals 2018, 8(7), 491; https://doi.org/10.3390/met8070491
Submission received: 9 May 2018 / Revised: 6 June 2018 / Accepted: 25 June 2018 / Published: 27 June 2018

Abstract

:
The Laser Beam Melting (LBM) Additive Manufacturing technology for metal processing is based on the local application of an intense laser beam, causing a characteristic microstructure, which can achieve higher mechanical properties than conventionally manufactured equivalents. The material is created incrementally in sections that are processed with different manufacturing parameters. This paper proposes the creation of Designed Materials by varying the manufacturing parameters and exposure strategy in order to induce a gradient or a local change of properties by designing the microstructure. Such materials could also be created by changing the material topology on a micro-, meso-, or macro-scale, or on multiple scales at once. This enables systematic creation of material types like Functionally Graded Materials (FGMs), Metamaterials, or other Designed Materials, in which characteristics can be varied locally in order to create a customized material. To produce such materials by LBM, it is necessary to gain a detailed understanding about the influence of the manufacturing parameters. Experimental studies have been carried out to investigate the melt pool geometry and microstructure resulting from the exposure parameters. Based on the results, parameter sheets have been derived, which support the process of finding optimized parameter sets for a specific purpose. General methods and their ability to influence the material structure and properties were tested and evaluated. Furthermore, the resulting change of the microstructure was analyzed and a first Graded Material was generated and analyzed to show the potential and possibilities for Designed Materials on multiple scales by Laser Beam Melting.

1. Introduction

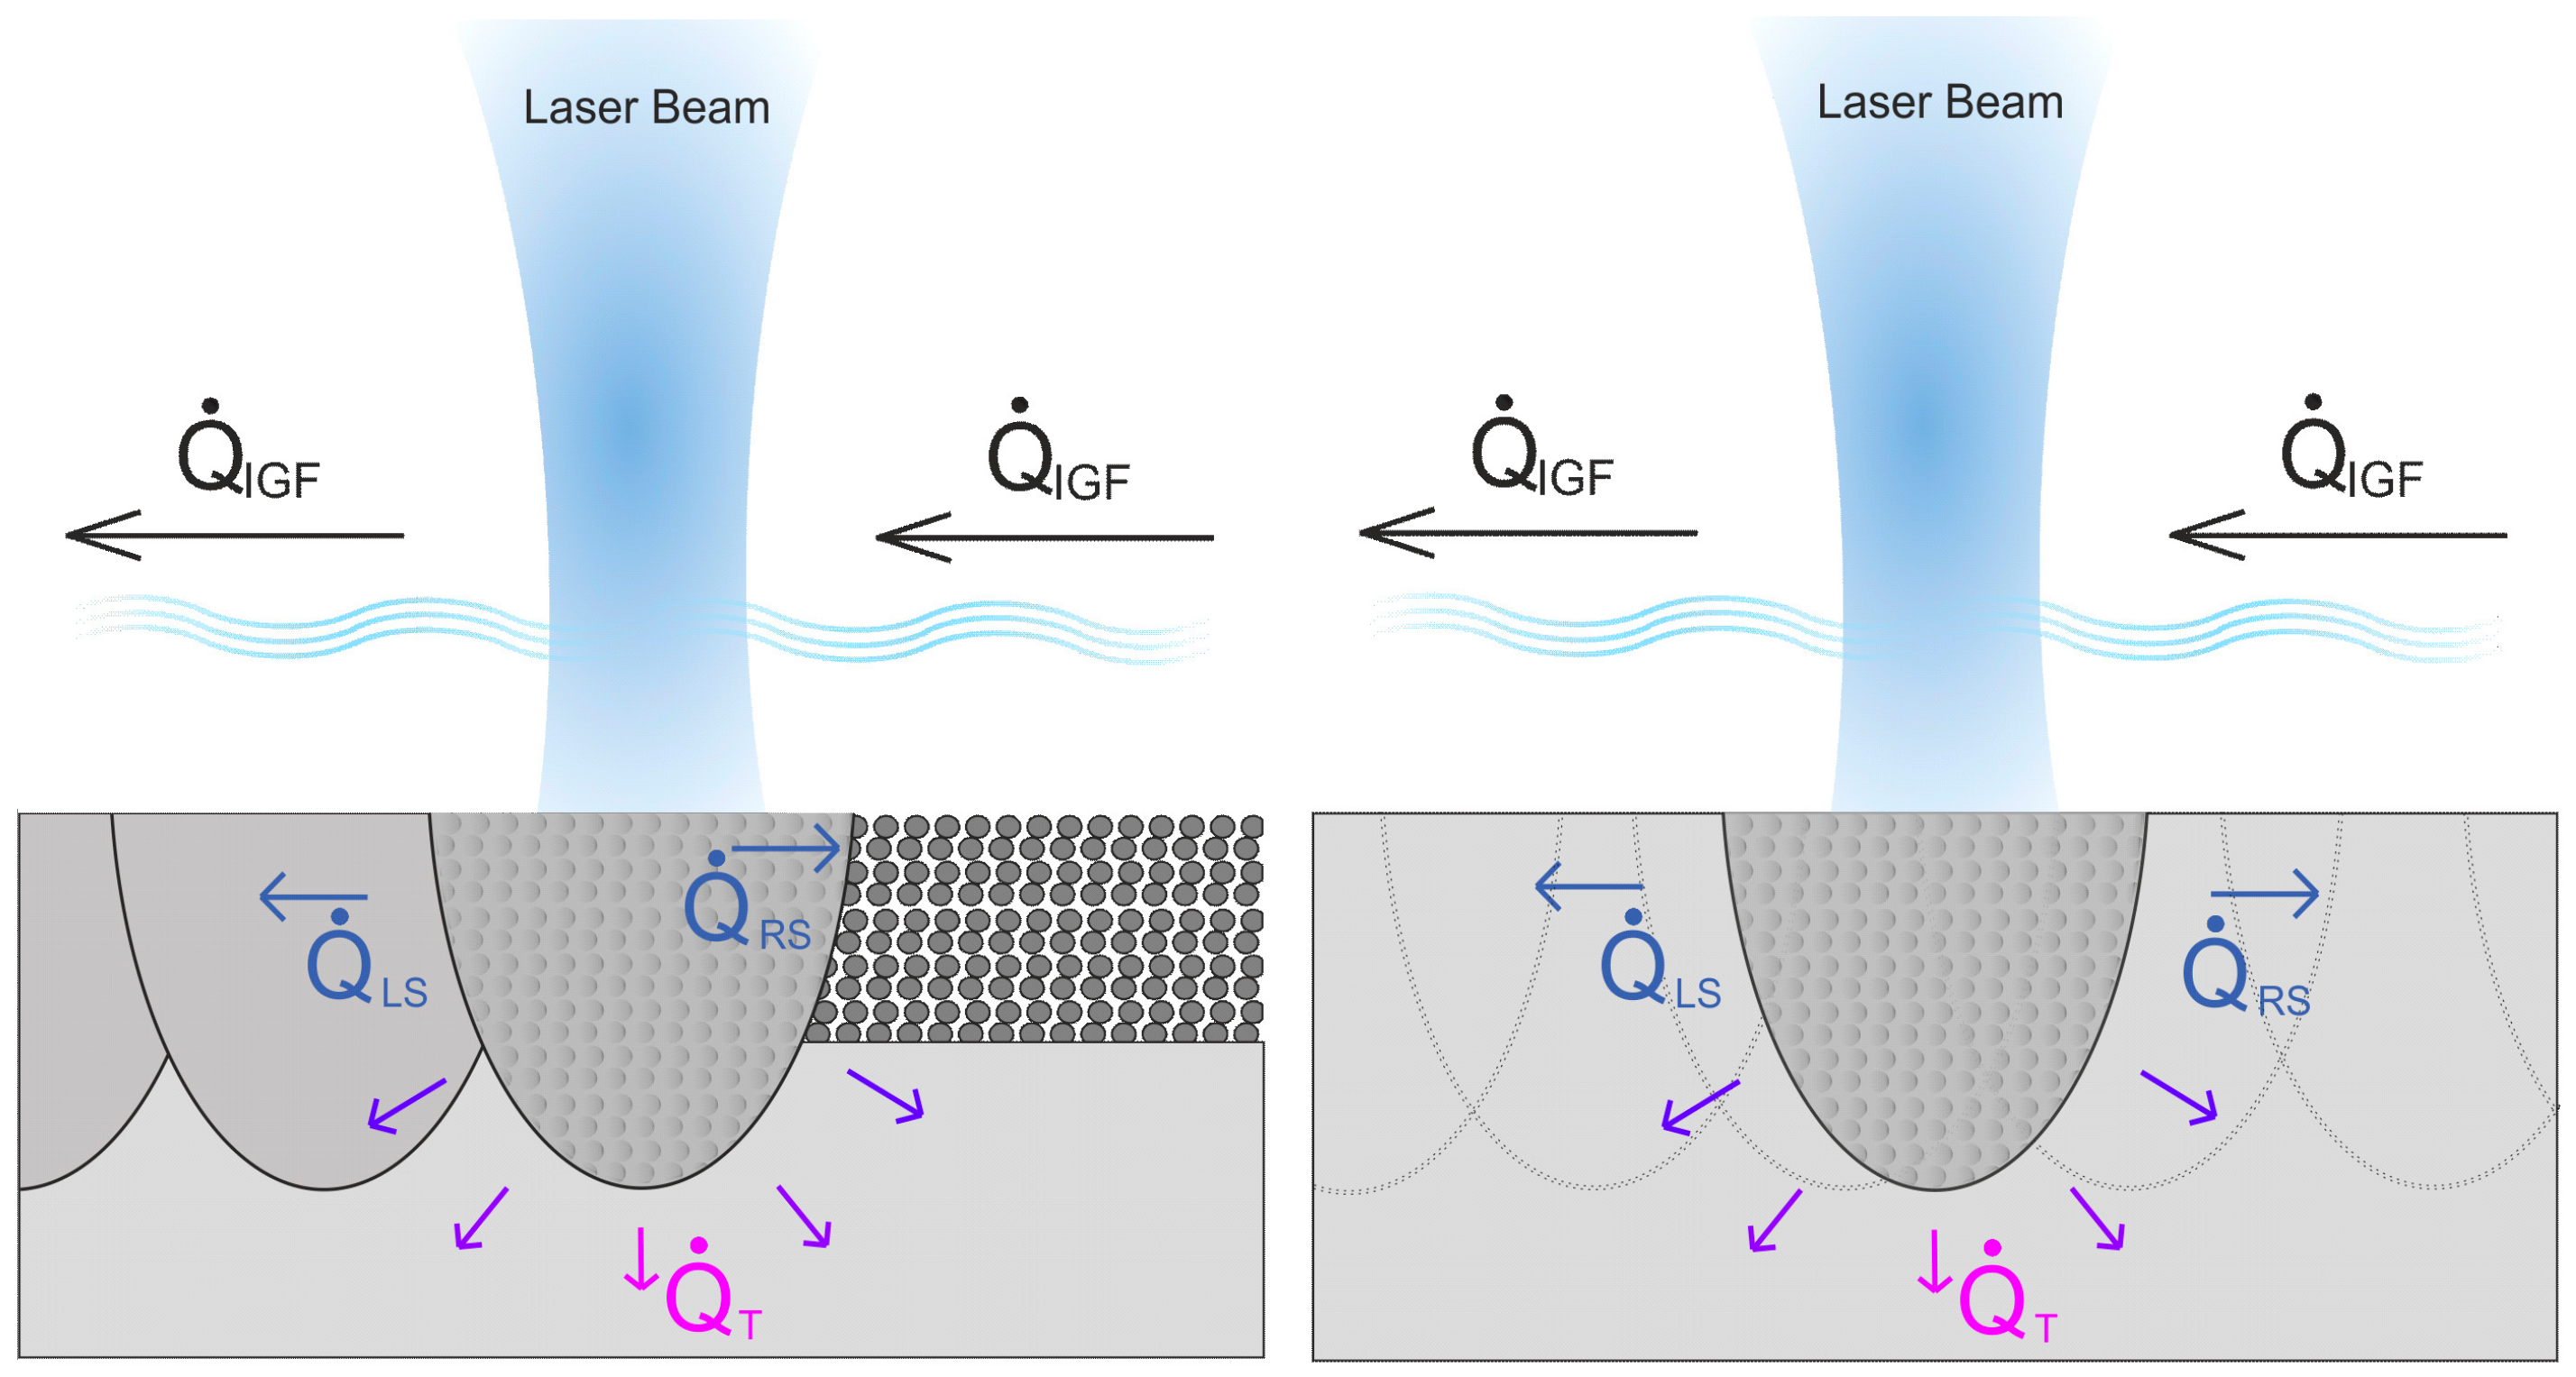
1.1. State of the Art Regarding Laser Beam Melting

Additive Manufacturing (AM) technologies are based on an incremental joining of material, and are therefore contrary to subtractive manufacturing techniques (ASTM F2792-12a). Metal powder bed fusion (PBF)-based AM techniques can be used to create structural material out of metallic powders like aluminum, titanium, maraging steel, stainless steel, or nickel alloys with relative densities >98%. Laser Beam Melting (LBM) is currently the most common PBF process and is capable of providing a comparable material quality to conventional manufacturing techniques, e.g., casting [1,2]. LBM processes metallic powder layers using a laser beam, generating solid material on an optionally heated base plate. The local application of a high-energy source and resulting high cooling rates of melted material induce a characteristic microstructure, resulting in different but competitive mechanical properties like tensile strength and ductility compared with conventionally manufactured alloys [1,2]. Therefore, LBM is at the edge of initial small batch productions [1,3] in several industry sectors [4]. Due to the incremental creation of material by using a spot-like energy source (laser beam), the process control and resulting material characteristics are intricate. The exposure parameters (laser power and exposure speed) in combination with the arrangement of laser tracks (exposure strategy), which are necessary to create a volume using a spot-like energy source, define the final material structure and, therefore, its characteristics. The discrete control over countless volume elements at microscale is a challenge in terms of the complexity of process control, planning, and the simultaneous holding potential for the creation of customized materials.

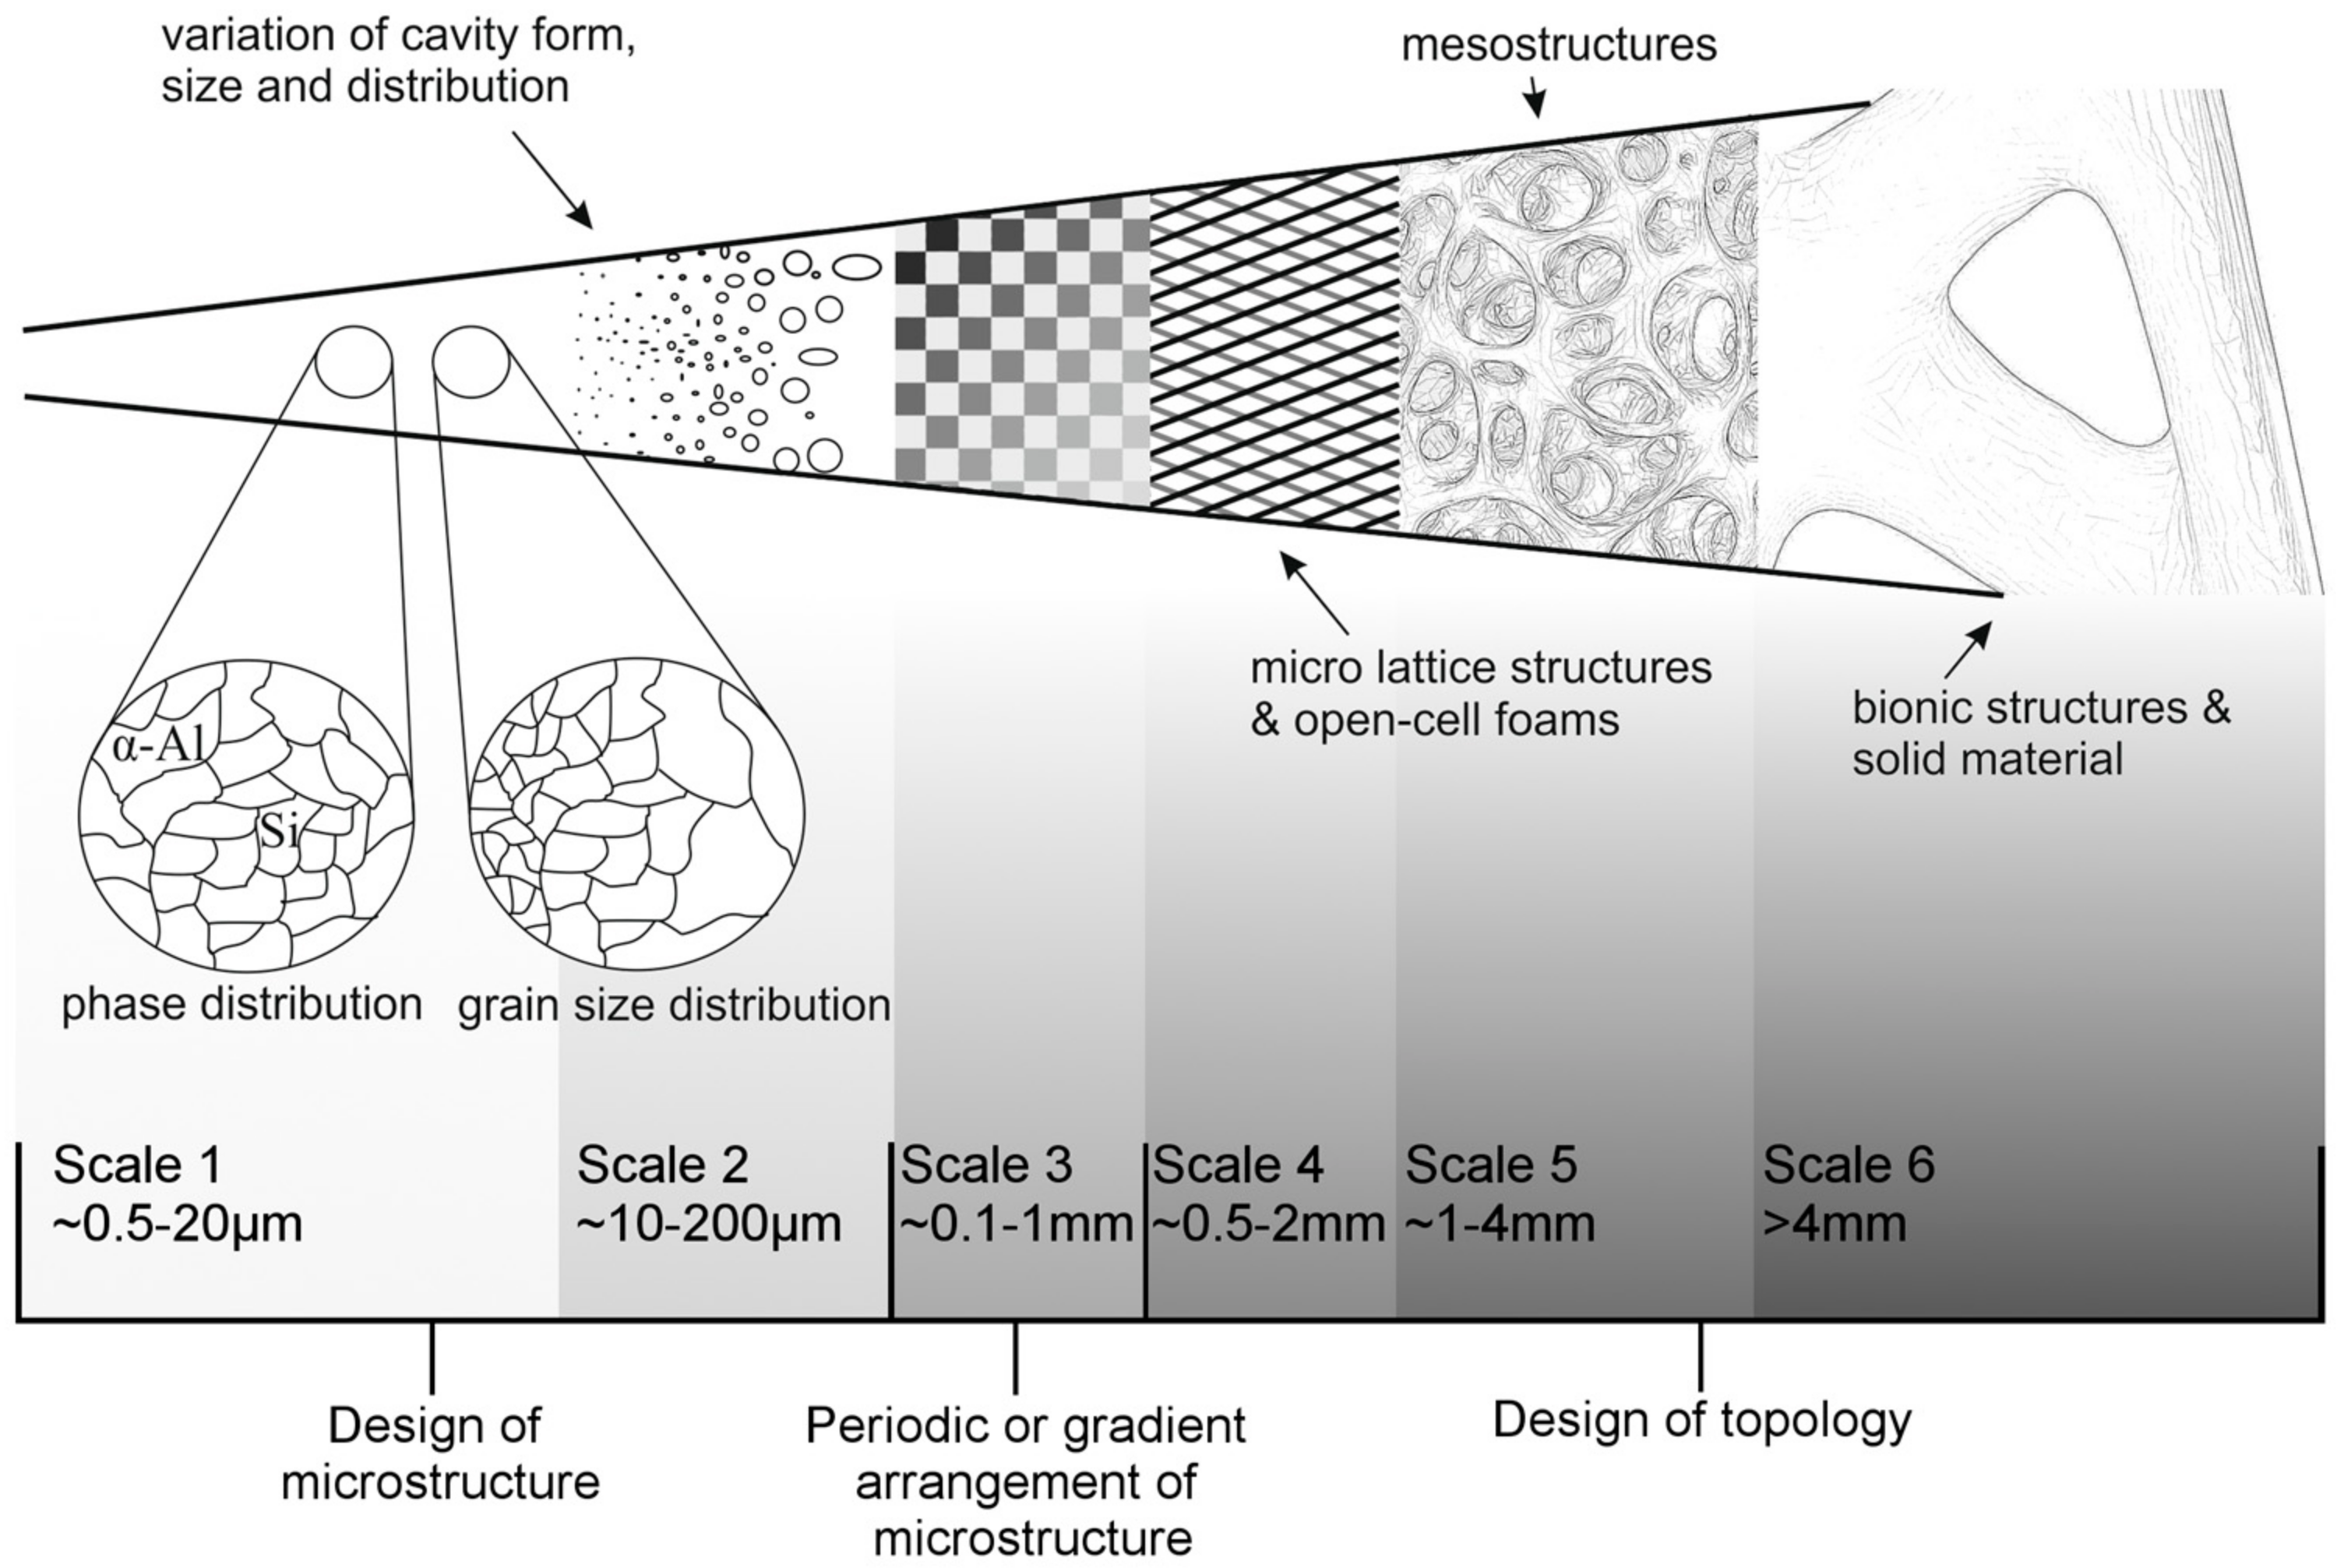
1.2. Methodology Proposistion Regarding Designed Materials

The incremental nature of the LBM process facilitates the generation of local material properties and microstructures to meet specific demands. This potential is pointed out by the VDI (Verein Deutscher Ingenieure) [3] as well as in the draft for the ISO/DIS 20195. Based on these sources, this work proposes the following methodological possibilities to create materials for a specific demand.
Material characteristics could be implemented on several scales as shown in Figure 1. On a microscale (Scales 1 and 2), phase and grain size distributions as well as cavities can be influenced in their form, size, and distribution. These microscopic characteristics can be varied locally in the form of gradients, periodic arrangements, or other demanded layouts on micro- to mesoscale (Scale 3). Furthermore, geometrical shapes can be realized on meso- and macro-levels due to the enhanced design freedom of AM technologies (Scales 4 to 6). Thus, manufacturing technologies of an incremental nature carry the potential for a controlled material design and, therefore, for customized and optimized material types like Functionally Graded Material (FGM), Intelligent Materials, or Mechanical Metamaterials.
The approaches on Scales 4 to 6 are of a geometrical nature and can therefore be realized by the increased design freedom of AM. However, first trials showed that the topology, size, and distribution of porosities can be influenced by manufacturing parameters, exposure strategy, and by geometrical methods by providing precise exposure gaps (Scale 2). The phase and grain size distribution is dependent on the cooling rate and can therefore be impacted by manufacturing parameters and exposure strategy (Scale 1). A layer-wise variation of these settings or variation by defining areas of different parameter settings enables the creation of local material characteristics (Scale 3).

1.3. Relevant Preliminary Work Regarding Designed Materials

As outlined by the VDI (Verein Deutscher Ingenieure) [3], work on the application of distinct manufacturing parameters in order to create specific material properties is scarce. However, the first FGMs manufactured by LBM were realized by Popovich [5], consisting of an anisotropic structuring of grain size in tensile specimens, which showed promising results. Zhang [6] indicates the benefits of a Bimodal Structure Topology, combining the advantages of fine-grained and coarse-grained microstructures. Zhang [6] used sintering as a manufacturing technique to realize the arrangement of microstructures in stainless steel.
Microstructures resulting from LBM manufacturing parameters have been investigated intensively over the last years for AlSi10Mg (e.g., by [2,7]). However, most of the current studies focus on the optimization of density (e.g., [2,7,8,9]). Resulting microstructures are investigated for single parameter sets. Buchbinder [2], Zhang [7], and Brandl [10] examined the microstructure of AlSi10Mg manufactured by LBM for single parameter sets, which are suitable for high densities.
Thijs [11] investigated the impact of exposure parameters and exposure strategy on the density and resulting texture of the LBM material. The studies indicate that the material texture and, therefore, its mechanical properties can be influenced by exposure strategy as well as exposure parameters. Buchbinder [2], Zhang [7], and Thijs [11] also identified a connection between the fine microstructure of AlSIi10Mg manufactured by LBM and the resulting increased hardness.
Alternative approaches inspect material generated by single laser tracks instead of voluminous material, which results from a complex arrangement of laser tracks and, therefore, different interactions. Poprawe [12] and Bliedtner [13] dealt with the theory of the dynamic process in the weld pool for laser beams under feed motion, as well as the heat conduction equation. Poprawe also illustrated the potential to influence the grain size and, therefore, the hardness of AlSi10Mg processed by LBM by a variation in scanning speed. Gong [14] proposed the investigation of single laser tracks in order to achieve a time- and cost-efficient parameter development method. Single laser tracks placed in the first layer of the LBM process were analyzed regarding the melt pool width and surface topology with respect to the visual stability. Keyhole and balling phenomena were observed. Similar to Gong [14], Kruth [15] classified laser tracks by the outer topology in order to analyze the impact on deformation mechanisms. Gong [14] also proposed the introduction of a general factor, based on the melt pool width, which could be used to determine a suitable hatch distance. However, the results showed that this factor would be dependent on laser power and exposure speed (especially for lower energy densities). According to the author, the reason for this could be the application of the laser tracks in the first layer of powder and, therefore, right onto the building platform, which results in different thermal boundary conditions. Regarding the geometrical features, Gong [14] also pointed out differences between simulated features and actual manufacturing results. For the single laser track method applied in the first layer, it should be kept in mind that the method cannot be applied in all cases, since the alloys of building platform and metal powder do not always match. The dependency of the melt pool depth on the melt pool temperature was investigated by Yadroitsev [16]. Vasinonta [17] proposed the use of process maps based on single laser tracks in order to retrieve manufacturing parameters for LBM in an economic way.

1.4. Research Objective

In order to create Designed Materials, it is necessary to gain information about the interaction between laser beam and powder bed. Based on the proposition of Vasinonta [17], this work focuses on the generation of process maps based on single laser tracks. Instead of concentrating on single parameter sets, a systematic investigation of melt pool size and grain size depending on laser power and exposure speed is conducted for the first time. Single laser tracks are applied under relevant thermal boundary conditions. The retrieved process parameter maps support the selection of parameters for Designed Materials. Since every LBM system exhibits its own characteristics, it is beneficial to generate process maps for each system. Therefore, the methodology has to be economically efficient and based on a minimum number of relevant measuring points. For that reason, the following investigations rest upon statistical experimental designs based on the methodology “design of experiment” (DOE).

2. Materials and Methods

The following investigations were conducted with a commercial LBM system (EOS M 400) equipped with a 1 kW laser unit (YLR-series, CW-laser, wavelength 1070 nm, Gaussian TEM00 mode). The samples were manufactured of AlSi10Mg (PSD: D10: 12.28 µm; D90: 43.22 µm) processed in 90 µm layers, under the influence of a heated building platform (165 °C) and an argon-based inert gas atmosphere (O2 < 1.2%) to avoid material oxidation. A shield gas stream flowing over the powder bed was applied to remove any side products arising from the welding process. The samples rested for ~30 h of manufacturing time under the influence of the heated building platform.
For the energy-dispersive X-ray spectroscopy (EDX), an Octane Plus detector on a DSM 962 scanning electron microscope was used.
Quadratic specimens were manufactured according to the machine vendor’s parameters as a base material (density 2.64 g/cm³). The last layer was followed by an exposure of multiple single laser tracks. A gap of 3 mm was set between the tracks to prevent any interaction. Two cases with different thermal boundary conditions were examined (see Figure 2). First, the direct exposure of powder particles and the resulting laser tracks were examined (primary laser tracks). While the solid material features an increased thermal conductivity, the powder layer contains a significant amount of gas; this gas is insulating and therefore causes a minor heat flow to the right side of the laser track ( Q ˙ RS). Therefore, the cooling rate is dominated by the heat flows Q ˙ LS and Q ˙ T (left side and tip). The heat flow resulting from the inert gas flow Q ˙ IGF is dependent on the type of inert gas used and set parameters regarding the speed of the gas flow above the powder bed. In a second experiment, the laser tracks were applied directly on already solidified LBM material (secondary laser tracks). In this setup, the laser tracks were created by a re-exposure of already-generated material, which results from different thermal boundary conditions than for primary laser tracks. As no isolating powder is in contact with the laser track, Q ˙ RS equals Q ˙ LS in the case of the secondary laser tracks. Furthermore, the enthalpy of fusion changes, since already-solidified material is re-melted instead of creating solid material out of powder particles. Secondary laser tracks could be applied as an in situ heat treatment and are, therefore, of special interest.
The cut, ground, polished, and etched specimens were evaluated under an optical light microscope, regarding melt pool dimensions (depth and width) as well as grain size (see Figure 3). The melt pool dimension does not include heat-affected zones (HAZ) as described by Poprawe [12]. However, the HAZ are not of considerable size for AlSi10Mg. The microstructure shows the characteristic dendritic microstructure of AlSi10Mg manufactured by LBM, consisting of the darker AlSi eutectic and brighter Al phase (see [2,6,18]). A common method to characterize such a dendritic structure would be the dendrite arm distance defined in BDG Richtlinie P220. The method suggests a measurement orthogonal to the main orientation of the visible grains. However, no significant results could be achieved by this method, since the grains seem to grow in the main orientation direction without increasing in width. Therefore, the grain size was determined statistically by the linear intercept method based on binarized images of a magnification of 150× (see Figure 4). This method enables a statistical determination of the length of the visible grains. Lines are arranged alongside the main orientation of the grains. Each intersection with the AlSi eutectic is marked in order to quantify the statistical mean of the grain size.
The parameter investigations are based on two experimental designs. A full factorial design provides data for a quadratic regression and, therefore, information about the process window of 100–900 W laser power and 250–2000 mm/s exposure speed. The second design consists of two sets of single parameter variations at 600 W and 900 W, which are used to validate the regression of the full factorial design. The regression equation is based on the desired dimension d (melt pool width, depth, or grain size), laser power P, and exposure speed v. The constants Cn are retrieved by regression.
  d = C 1 + C 2 P + C 3 v + C 4 P 2 + C 5 v 2 + C 6 P v
The experimental design and resulting values regarding melt pool dimension and grain size are listed in Appendix A. The results regarding melt pool dimensions are based on three measured specimens. Appendix A shows the arithmetic means. The application of an Anderson Darling test confirms a normal distribution for the results.

3. Results and Discussion

3.1. EDX Phase Analysis

EDX measurements (Table 1) reveal Si contents of ~3 wt % in the Al matrix and ~41 wt % in the eutectic area, whereas Tradowsky [18] reports a range between ~8 and ~12 wt % Si in the as-fabricated material. Furthermore, the study observes 37 wt % Si in the T6 condition. As presented by Hedge [19], the elemental distribution in an Al–Si alloy influences the mechanical behavior of the material and depends on the thermal history. The material properties will therefore depend on the set manufacturing parameters as well as the used LBM equipment.

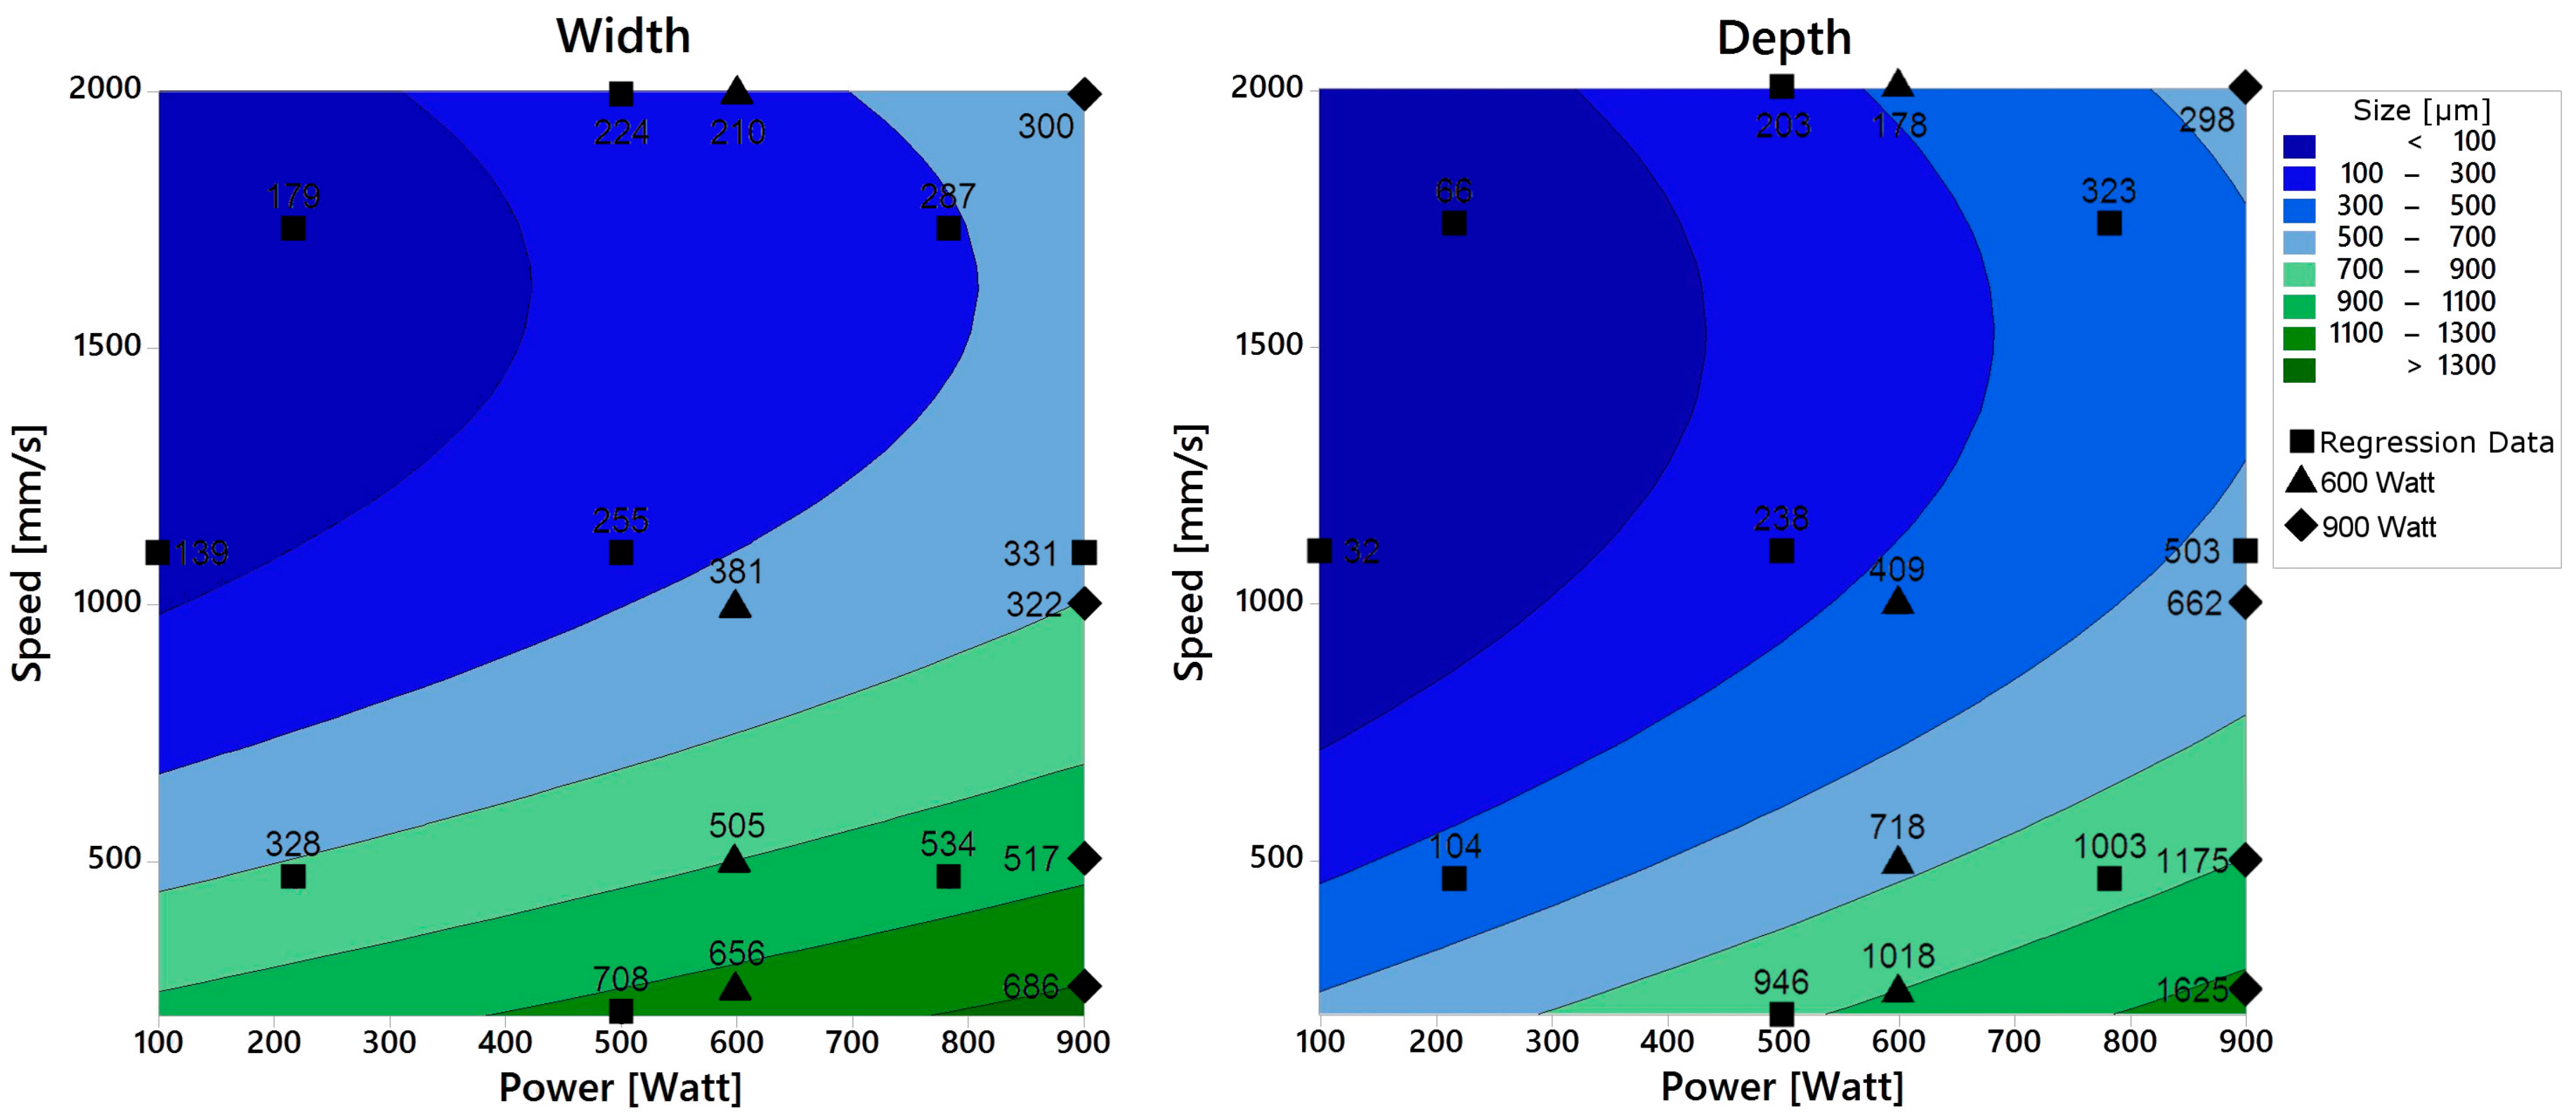
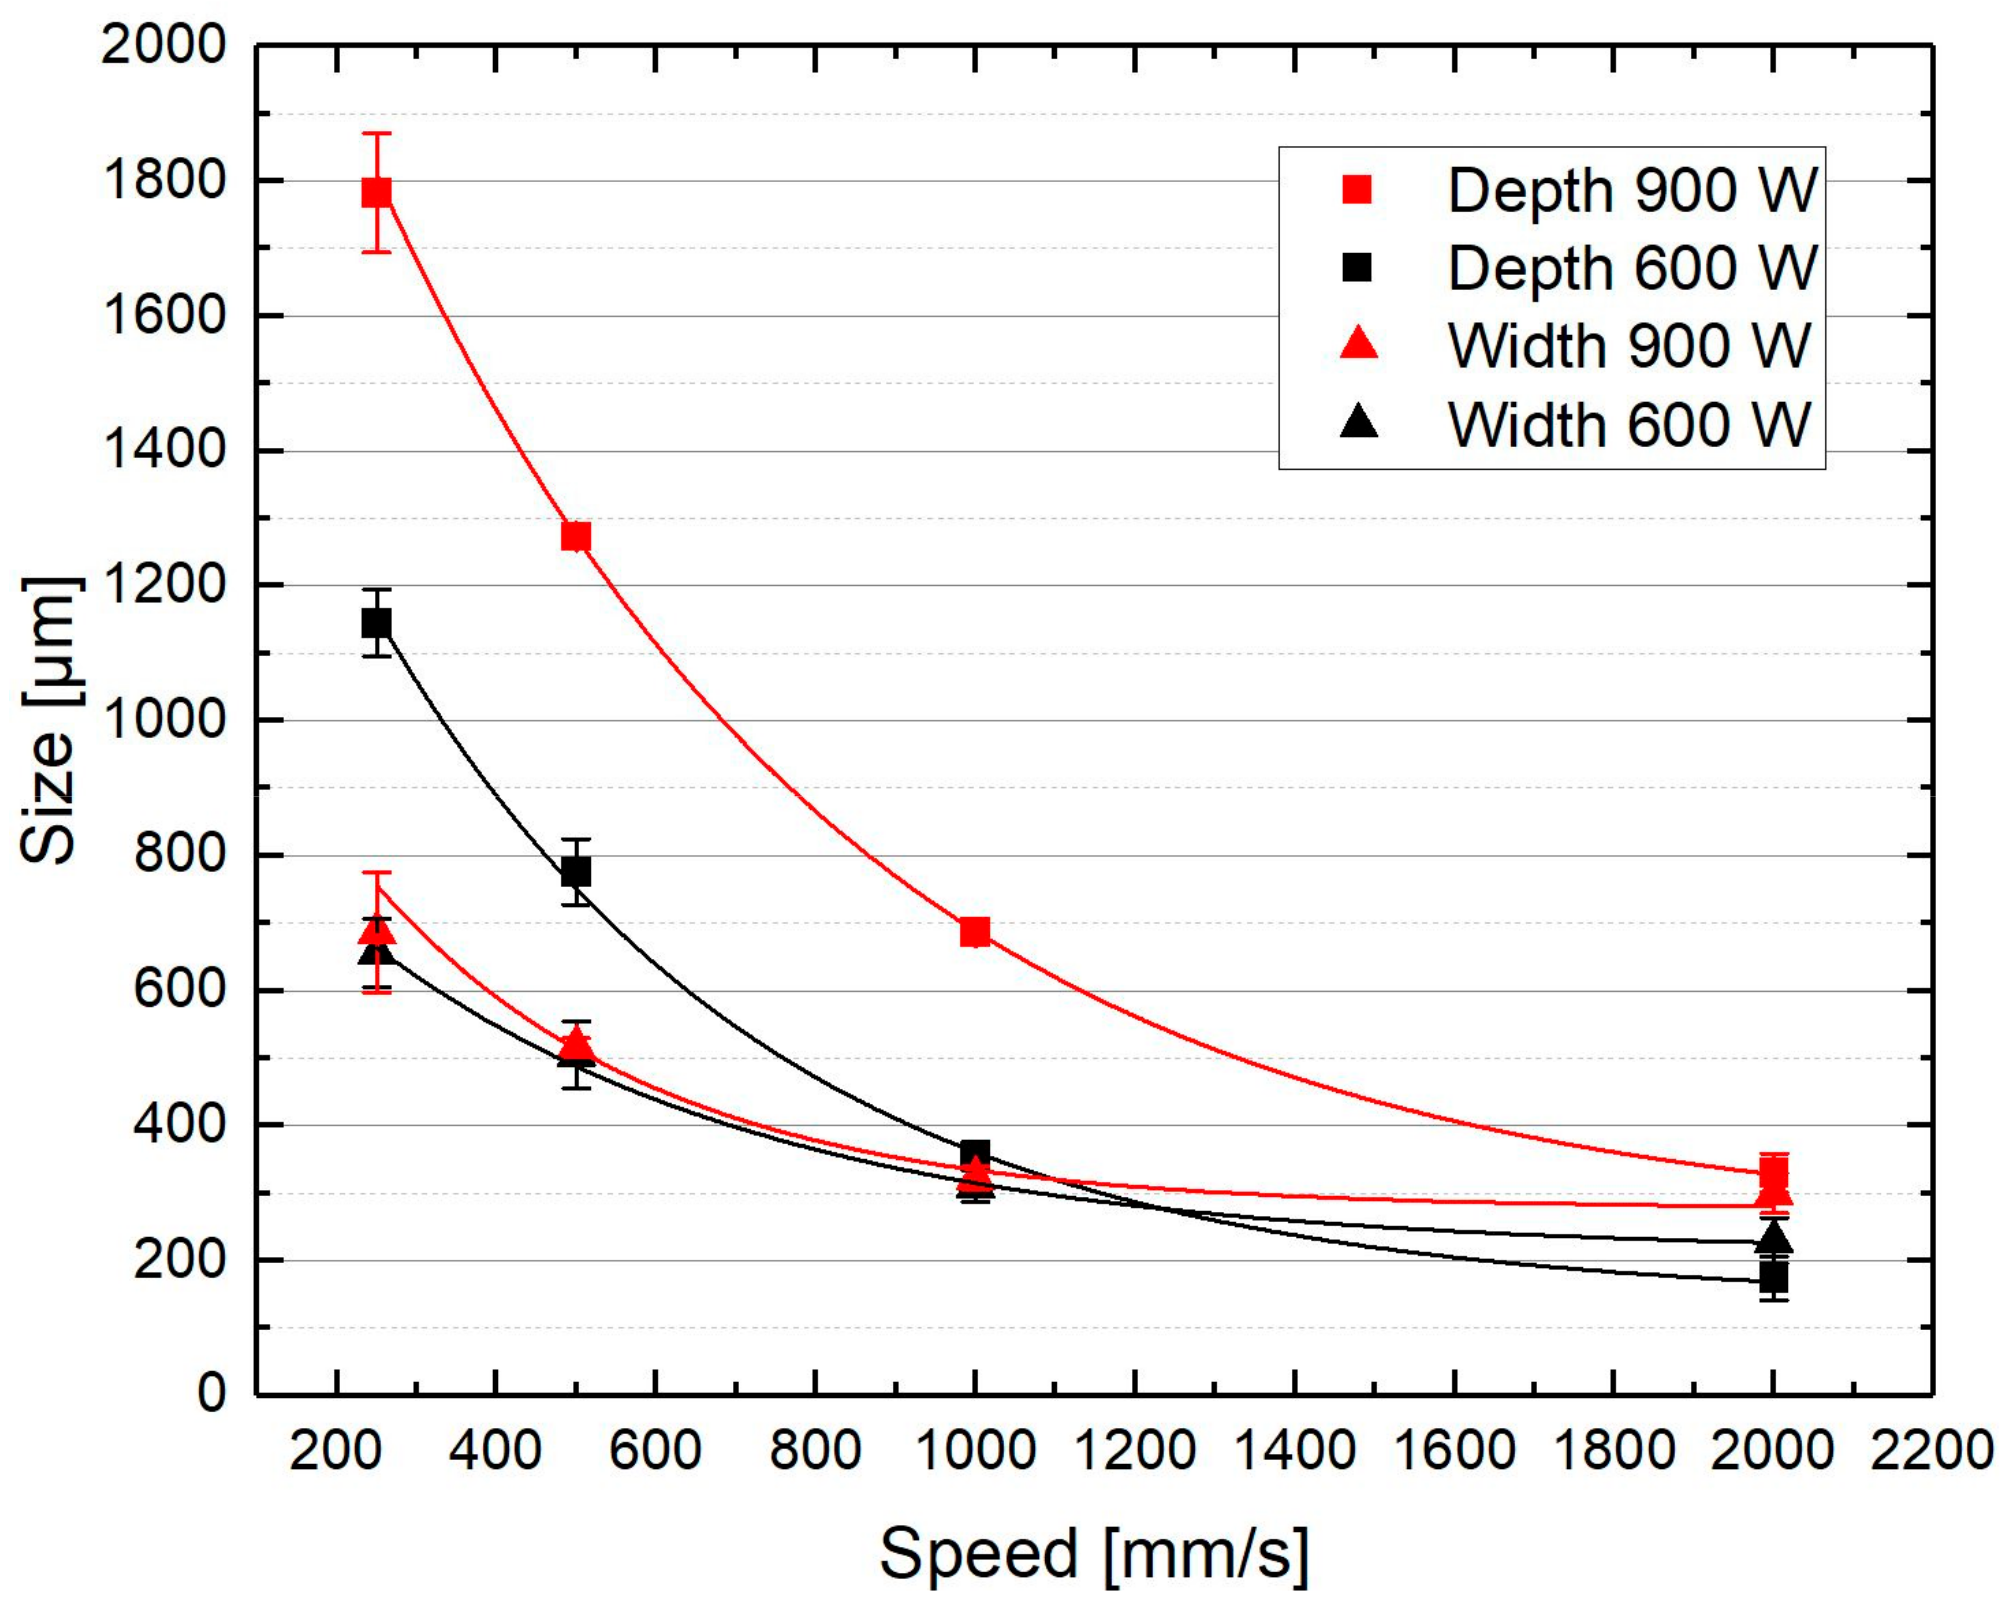
3.2. Melt Pool Dimension
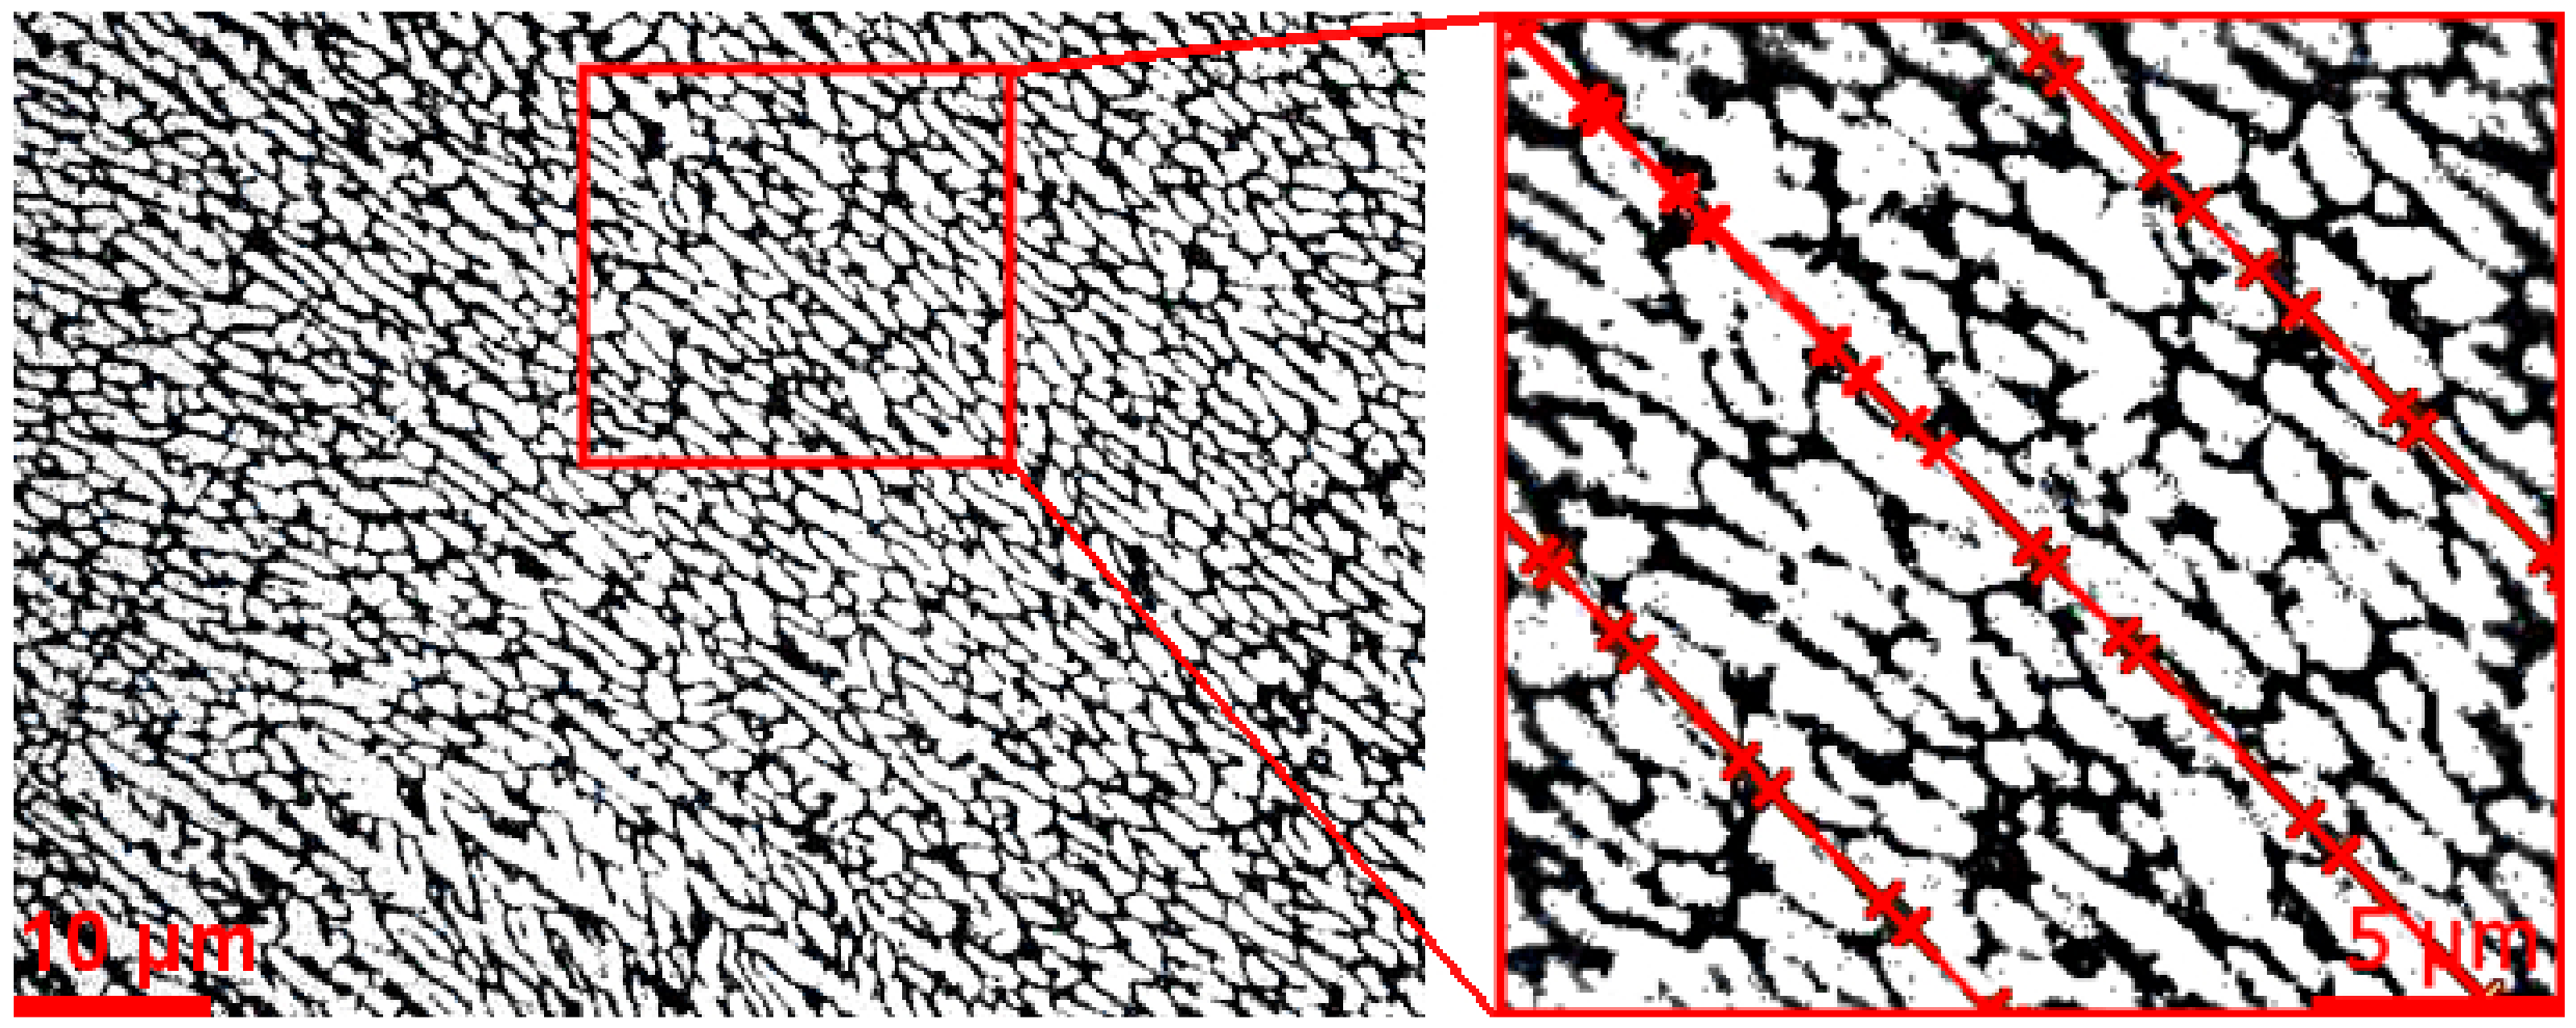
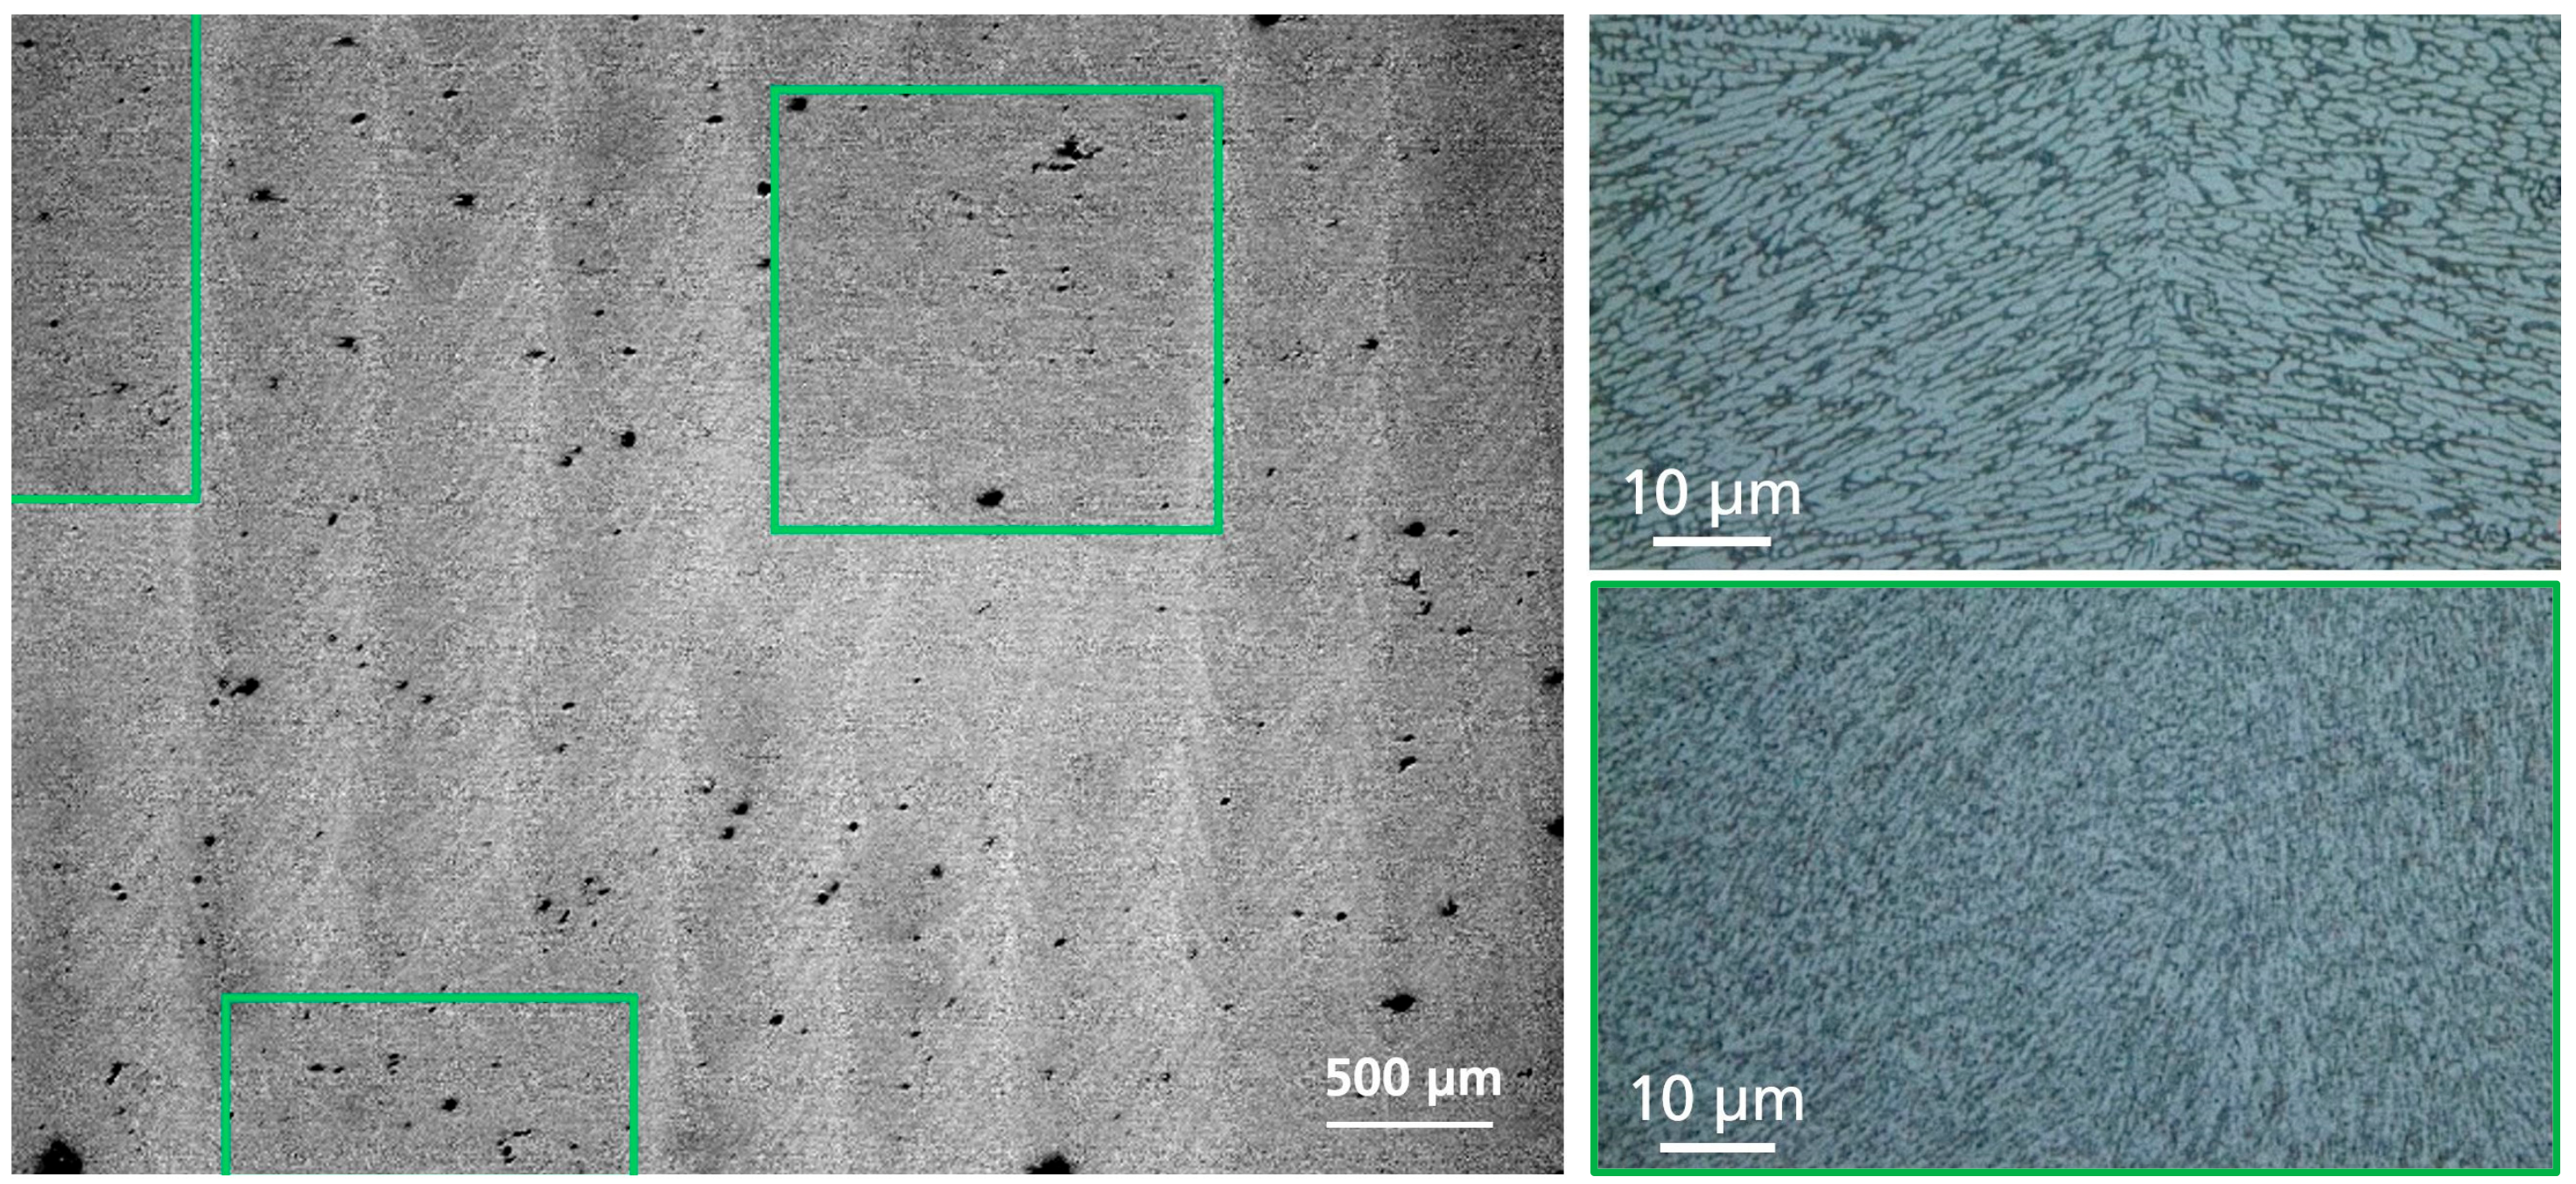
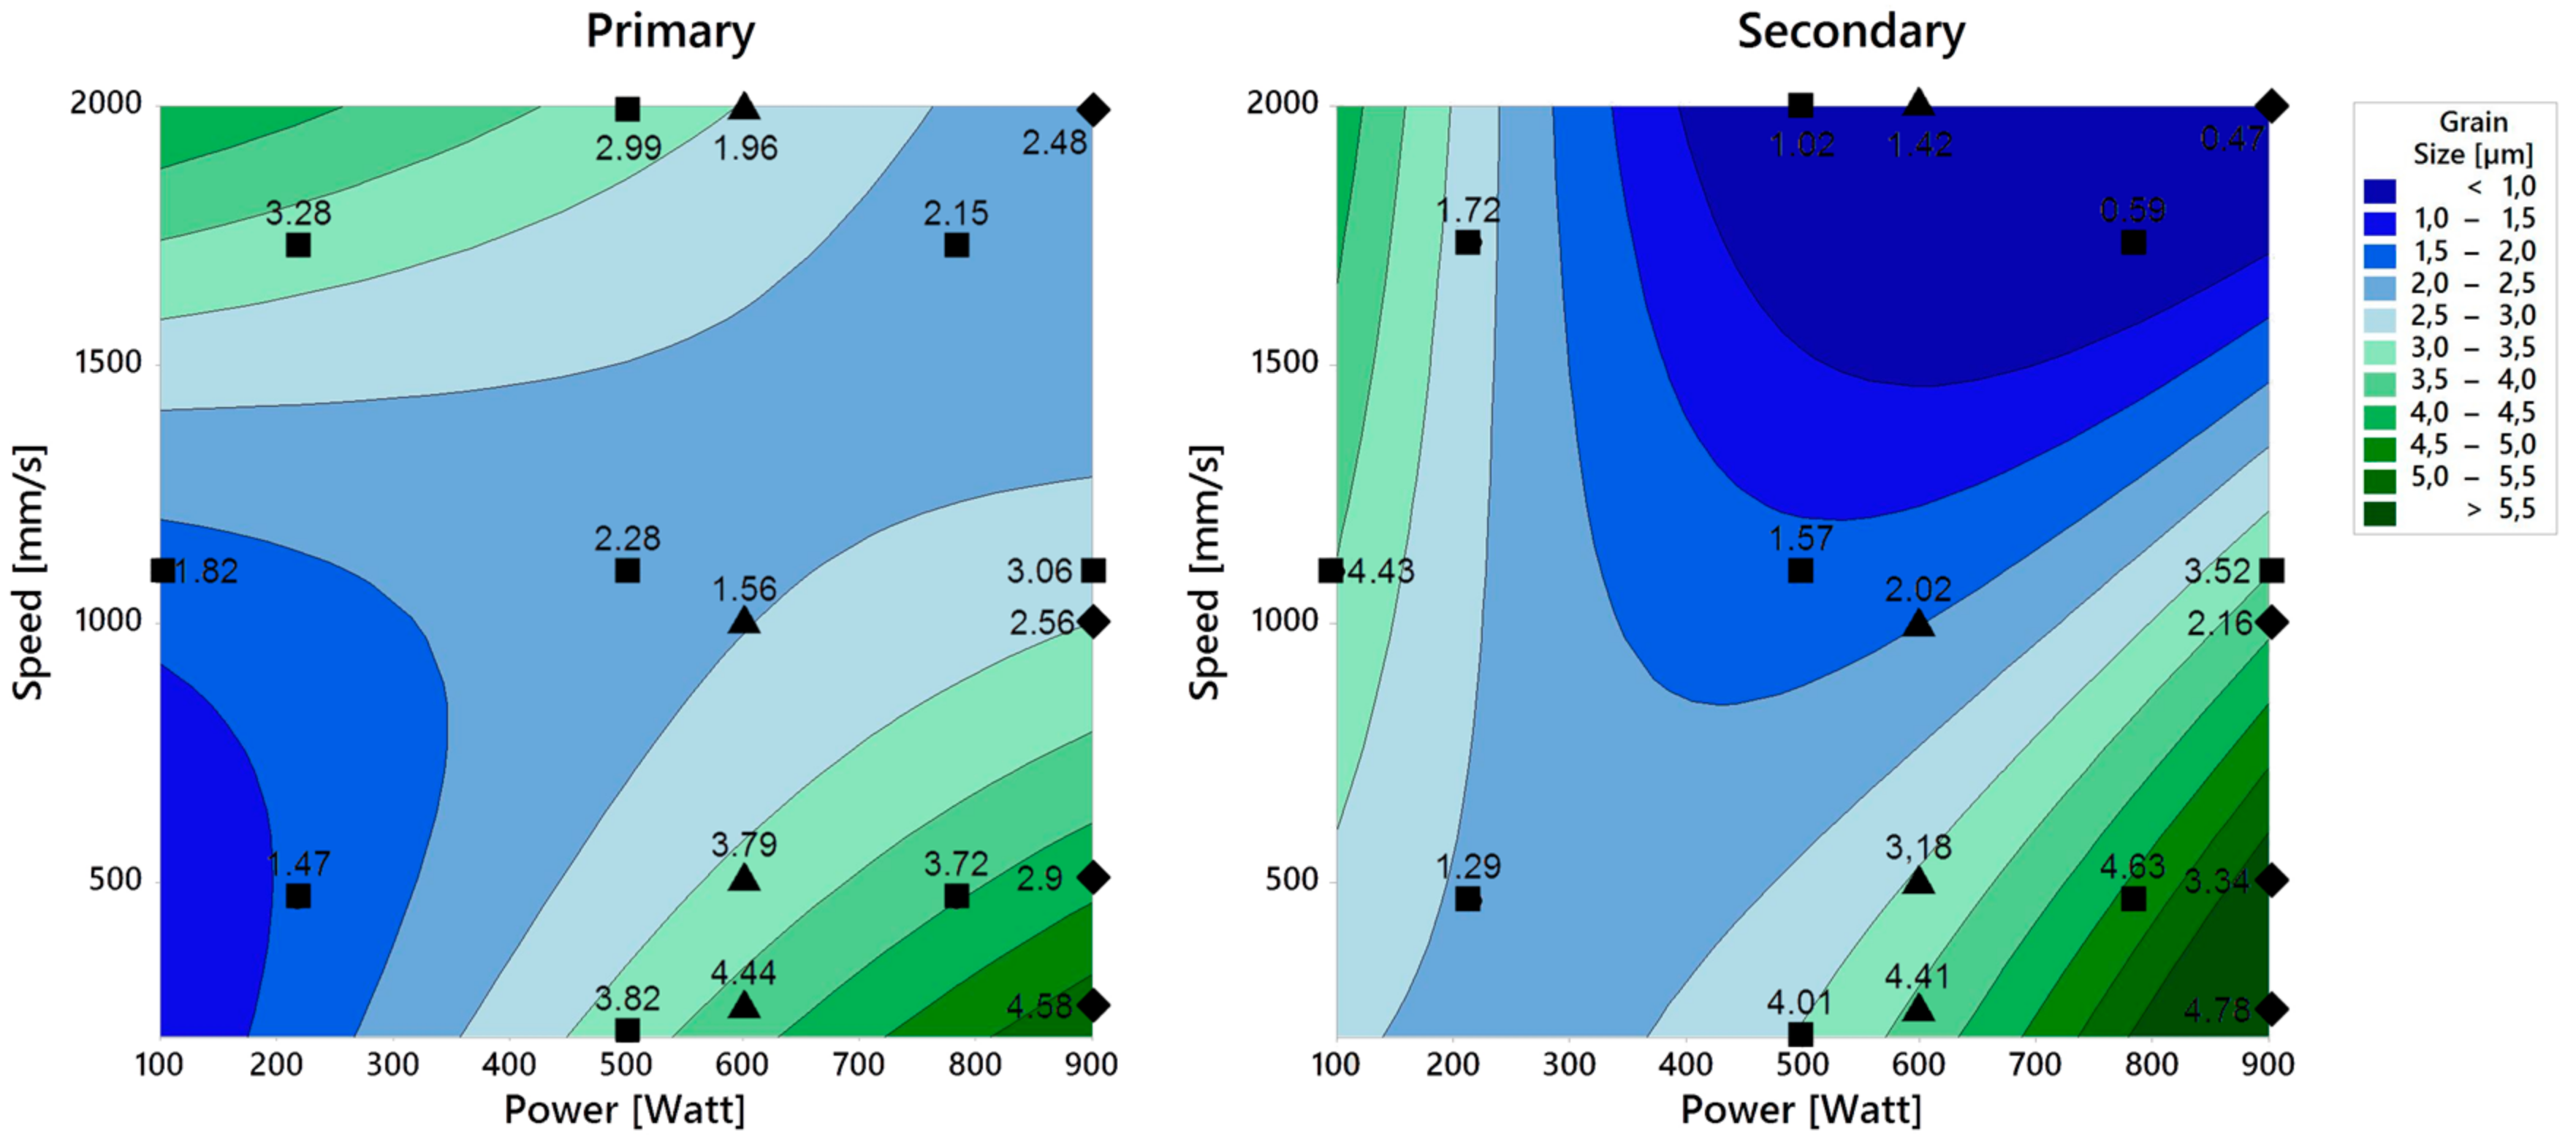
Figure 5 illustrates the melt pool dimensions for the single parameter variation regarding secondary laser tracks. The results show an increased standard deviation for slower exposure speeds at 250 and 500 mm/s. This could be due to a plasma cloud resulting from the laser–matter interaction, as described in Poprawe [12], which causes the laser beam to dissipate, resulting in an irregular application of energy. In contrast, increased exposure speeds result in a reduced interaction between plasma and laser beam and can therefore stabilize the process. Furthermore, the results show an increased impact of the laser power on the penetration depth in comparison to the width. The exposure speed reduces the melt pool depth more strongly than the width. The effect can be explained by the heat and wave propagation specified by Bliedtner [13], in combination with the laser’s Gaussian TEM00 mode. For a better visualization of the data, an exponential fit was applied. The single parameter variation for primary laser tracks shows similar results (see Appendix A).
Figure 6 and Figure 7 show the visual results and used data of the quadratic regressions regarding the melt pool dimensions for primary and secondary laser tracks. For an interpretation of the regression results, it should be kept in mind that the regression model is only an approximation. In general, the results show a larger melt pool size with increasing laser power and decreasing exposure speed. As in Figure 5, the exposure speed shows a higher impact on the melt pool depth than on the width. Primary laser tracks cause an increased melt pool size compared to secondary tracks, especially regarding the depth. This could be due to a lower thermal conductivity for Q ˙ RS induced by the isolating powder layer (see Figure 2), as well as the different enthalpy of fusion. The effect is less concise for the width. However, the impact of the process parameters is dominant in comparison to the change of thermal boundary conditions (see Figure 2). Results regarding the single parameter variation at 600 and 900 Watts are within the coefficient of determination R2 and therefore do support the regression model (see Table 2). Based on the retrieved data, spheres of influence can be defined precisely. In order to influence deeper or wider areas of the material, the power should be increased or the exposure speed decreased. It should be kept in mind, especially for secondary laser tracks, that the exposure of following powder layers can result in an overlap of laser tracks in the building direction, causing a change in the intended microstructure. This effect can be considered based on the retrieved data and, therefore, compensated for.
Keyhole-induced porosity resulting from an application of a high amount of energy or balling phenomena resulting from a low energy application were not observed as reported by Gong [14]. This could be due to several factors. Gong’s method is based on single laser tracks applied in the building platform. Therefore, Gong’s results do not represent the re-melting of created LBM material. Furthermore, a different alloy is used, the process window is limited to low laser powers, and the layer thickness is not considered. These factors also seem to lead to a different melt pool shape, as well as a different size of the HAZ, which is hardly recognizable for AlSi10Mg (see Figure 3).
Table 2 contains the derived quadratic regression model based on Equation (1). In all regarded cases, the models show a good adaption with a coefficient of determination R² between 80% and 95%. The equations regarding the grain size reveal the highest deviation towards the regression points (80% and 82%). This could be due to the fact that the grain size is determined by a statistical method with an increased standard deviation. The melt pool width is significantly impacted by laser power and exposure speed (coefficients C2, C3, and C5). The depth is also impacted by an interaction of the two process parameters (C6).

3.3. Grain Size

Figure 8 illustrates the results regarding the grain length for primary tracks in comparison to secondary tracks. The measured results show an increased standard deviation due to the statistical nature of the method. In total, the measurements exhibit an average standard deviation of σ = 0.98. The results reveal that the biggest grain sizes occur at high laser powers and low exposure speeds. A slow application of intense laser power and the resulting increased melt pool size enables a slower cooling rate, resulting in increased grain sizes. However, the results also show an increased grain size for smaller melt pools and lesser energies. The effect could be caused by a different melt pool ratio (depth relative to width, see Figure 3), which results in a different influence ratio of the heat flows Q ˙ LS, Q ˙ RS, Q ˙ T, and Q ˙ IGF (see Figure 2). A smaller melt pool decreases the dominant impact of the heat flows Q ˙ LS, Q ˙ RS, and Q ˙ T due to a reduced surface, leading to a slower cooling rate. For primary tracks, this effect is dominated by the parameter exposure speed, while secondary tracks are more strongly impacted by the laser power. This could be caused by different melt pool ratios as well as different thermal boundary conditions (see Figure 2). Nonetheless, the reason for this difference between primary and secondary laser tracks could also be found in the extensive standard deviation (σ = 0.98).
Increased laser power and low exposure speed causing a deep melt pool show similar results in grain length for primary and secondary laser tracks. Due to the deep melt pool penetration of up to 20 powder layers (~1800 µm melt pool depth), the change in the heat flow Q ˙ RS (due to the rather insulating powder layer in comparison to solid material) seems to have an insignificant impact. In contrast, a parameter setting causing a shallow melt pool (less than ~3 powder layers/~300 µm melt pool depth) shows significant difference in grain length. The existence of a thermally insulating powder layer and, therefore, a change in Q ˙ RS, seems to have a significant impact, causing the melt pool to cool down more slowly for primary laser tracks, resulting in increased grain length in comparison to secondary laser tracks. Secondary laser tracks could therefore be of potential value to create a material consisting of a refined microstructure. However, as for the results regarding the melt pool dimensions, the impact of a change in laser power or exposure speed is dominant in comparison to the change of thermal boundary conditions (see Figure 2). The results regarding the single parameter variation at 600 and 900 Watts are within the coefficient of determination R² and therefore do support the regression model (see Table 2). The retrieved data suggest that grain size variations between ~0.5 µm and ~5 µm are realizable.

3.4. Application of Retrieved Data

To demonstrate the application of the retrieved data, the results were used to manufacture a first Designed Material consisting of a controlled arrangement of different grain size distributions. The melt pool dimensions were used to precisely affect the intended volume elements. Quadratic areas consisting of a refined microstructure were implemented in a surrounding consisting of coarser grains (see Figure 9). A laser power of 900 Watts was applied in both areas. A reduced exposure speed was used in order to increase the grain length. The material was manufactured by primary laser tracks and shows increased porosities compared to usual LBM materials. This could be caused by a bad choice of laser track arrangement (e.g., hatch distance). In further studies, the porosity could be minimized by the use of secondary laser tracks. Manufacturing parameters optimized for a high material density could be used as primary laser tracks followed by the secondary exposure as an in situ heat treatment. An alternative approach would be the adaption of exposure strategies and manufacturing parameters.

4. Conclusions

The retrieved data demonstrates the correlation between laser power and exposure speed, and the resulting grain size and melt pool dimensions. The derived parameter sheets and regression models support the process of finding the fitting parameter settings for a precise placement of a desired grain structure (see Table 2, Figure 6, Figure 7 and Figure 8). This method has been tested to create a first Designed Material consisting of areas of different grain sizes.
While the geometrical findings regarding the melt pool geometry are similar for primary and secondary laser tracks, the grain size results reveal different effects for increased exposure speeds in combination with low laser powers. This could be explained by the changing thermal boundary conditions (see Figure 2) and melt pool size. The effect should be validated in further investigations. Compared to the parameters of laser power and exposure speed, the impact of the thermal boundary conditions described in Figure 2 show a minor impact. However, the use of secondary laser tracks and, therefore, changing thermal boundary conditions in combination with shallow melt pool penetration depths (less than ~3 powder layers/~300 µm melt pool depth) results in a significant reduction of grain size length. Therefore, secondary laser tracks could enable an in situ heat treatment in order to obtain a refined microstructure.
Continuing studies should analyze the impact of the parameter choice on the density for the regarded process window of increased laser power and layer thickness, since the current literature is concentrating on lower laser powers and layer thicknesses. Further parameters like hatch distance or exposure strategies should be taken into account in order to include the full n-dimensional space and obtain a comprehensive understanding.

Author Contributions

A.P. conceived and designed the experiments, manufactured the samples, and analyzed and refined the data; M.J. prepared the samples; M.J. and A.P. executed the measurements and wrote the paper; K.H. and M.W. accompanied the work in advising and consultant discussions.

Funding

This research received no external funding.

Acknowledgments

Self-financed study. No additional grants were received.

Conflicts of Interest

The authors declare no conflict of interest. This work is self-financed.

Appendix A

Table A1. Measured values regarding melt pool dimension and grain size. Results regarding melt pool dimensions represent the arithmetic mean of three measured specimens. The application of an Anderson Darling test confirms a normal distribution for the results.
Exposure ParametersPrimary Laser TracksSecondary Laser Tracks
Heat Affected Zone [µm]Grain Length [µm]Heat Affected Zone [µm]Grain Length [µm]
Power [Watt]Speed [mm/s]Depth WidthAl-MatrixAlSi-EutecticDepth WidthAl-MatrixAlSi-Eutectic
Full Factorial Design of Experiment217464953611.480.491053281.300.81
2171736882063.290.68661791.730.85
78346411204423.721.0610035344.640.69
50011001962322.230.681922621.480.57
50011002352602.880.752163161.570.88
78317363203392.150.623232870.600.78
50011002493022.521.001943771.460.48
50011002182811.900.492283221.601.99
50011002133141.950.492482531.571.30
1001100581801.830.49321394.431.09
50020001703203.000.752032241.030.81
50020010586903.830.899467084.011.27
90011007133233.060.605033313.520.83
50011002282712.290.682382551.570.75
Single Variation25060017826864.440.661782104.410.80
50060012735173.790.574093813.180.81
10006006863221.560.627185052.020.80
20006003303001.960.7810186561.420.76
25090011456564.580.622983004.780.75
5009007765052.900.766623223.340.73
10009003553812.560.6611755172.160.75
20009001742102.480.7216256860.470.77

References

  1. Wohler, T.; Campbell, R.I.; Caffrey, T.; Agarwala, M.; Alves, N.; Balc, N.; Beaman, J.; Benster, T.; Bernard, A.; Boivie, K.; et al. Wohlers Report 2016. 3D Printing and Additive Manufacturing State of the Industry. Annual Worldwide Progress Report; Wohlers Assoziation Inc.: Fort Collins, CO, USA, 2016; ISBN 978-0-9913332-2-6. [Google Scholar]
  2. Buchbinder, D. Selective Laser Melting von Aluminiumgusslegierungen. Ph.D. Thesis, Rheinisch-Westfälische Technische Hochschule Aachen, Aachen, German, 2013. [Google Scholar]
  3. Ensthaler, J.; Grimm, T.; Marquardt, B.; Munsch, M.; Müller, A.; Lohmeier, K. VDI Handlungsfelder Additive Fertigungsverfahren; VDI: Düsseldorf, Germany, 2016; ISBN 978-3-931384-82-1. [Google Scholar]
  4. Gartner, J. FI-JKU Bericht 2014: Generative Fertigungsverfahren Technologiefolgenabschätzung; Johannes Kepler Universität Linz: Linz, Austria, 2014. [Google Scholar]
  5. Popovich, V.A.; Borisov, E.V.; Popovich, A.A.; Sufiiarov, V.; Masaylo, D.V.; Alzina, L. Functionally graded Inconel 718 processed by additive manufacturing: Crystallographic texture, anisotropy of microstructure and mechanical properties. Mater. Des. 2017, 114, 441–449. [Google Scholar] [CrossRef]
  6. Zhang, Z.; Orlov, D.; Vajpai, S.K.; Tong, B.; Ameyama, K. Importance of Bimodal Structure Topology in the Control of Mechanical Properties of a Stainless Steel. Adv. Eng. Mater. 2016, 17, 791–795. [Google Scholar] [CrossRef]
  7. Zhang, D. Entwicklung des Selective Laser Melting (SLM) für Aluminiumwerkstoffe. Ph.D. Thesis, Rheinisch-Westfälische Technische Hochschule Aachen, Aachen, German, 2004. [Google Scholar]
  8. Aboulkhair, N.T.; Everitt, N.M.; Ashcroft, I.; Tuck, C. Reducing porosity in AlSi10Mg parts processed by selective laser melting. Addit. Manuf. 2014, 4, 77–86. [Google Scholar] [CrossRef]
  9. Read, N.; Wang, W.; Essa, K.; Attallah, M.M. Selective laser melting of AlSi10Mg alloy: Process optimisation and mechanical properties development. Mater. Des. 2014, 65, 417–424. [Google Scholar] [CrossRef]
  10. Brandl, E.; Heckenberger, U.; Holzinger, V.; Buchbinder, D. Additive manufactured AlSi10Mg samples using Selective Laser Melting (SLM). Mater. Des. 2012, 34, 159–169. [Google Scholar] [CrossRef]
  11. Thijs, L.; Verhaeghe, F.; Craeghs, T.; van Humbeeck, J.; Kruth, J. A study of the microstructural evolution during selective laser melting of Ti–6Al–4V. Acta Mater. 2010, 58, 3303–3312. [Google Scholar] [CrossRef]
  12. Poprawe, R. Lasertechnik für die Fertigung. Grundlagen, Perspektiven und Beispieles für den Innovativen Ingenieur; Springer: Berlin, Germany, 2005; ISBN 3-540-21406-2. [Google Scholar]
  13. Bliedtner, J.; Müller, H.; Barz, A. Lasermaterialbearbeitung. Grundlagen, Verfahren, Anwendungen, Beispiele; Carl-Hanser-Verlag: München, Germany, 2013; ISBN 9-783-44642929-1. [Google Scholar]
  14. Gong, H.; Gu, H.; Zeng, K.; Dilip, J.J.S.; Pal, D.; Stucker, B. Melt Pool Characterization for Selective Laser Melting of Ti-6Al-4V Pre-alloyed Powder. In Proceedings of the 25th Annual International Solid Freeform Fabrication Symposium, Austin, TX, USA, 4–6 August 2014; pp. 256–267. [Google Scholar]
  15. Kruth, J.P.; Froyen, L.; van Vaerenbergh, J.; Mercelis, P.; Rombouts, M.; Lauwers, B. Selective laser melting of iron-based powder. J. Mater. Process. Technol. 2003, 149, 616–622. [Google Scholar] [CrossRef]
  16. Yadroitsev, I.; Krakhmalev, P.; Yadroitsava, I. Selective laser melting of Ti6Al4V alloy for biomedical applications: Temperature monitoring and microstructural evolution. J. Alloy. Compd. 2014, 583, 404–409. [Google Scholar] [CrossRef]
  17. Vasinonta, A.; Beuth, J.; Griffith, M. Process Maps for Controlling Residual Stress and Melt Pool Size in Laser-Based SFF Processes. J. Manuf. Sci. Eng. 2007, 129, 101–109. [Google Scholar] [CrossRef]
  18. Tradowsky, U.; White, J.; Ward, R.M.; Read, N.; Reimers, W.; Attallah, M.M. Selective laser melting of AlSi10Mg. Mater. Des. 2016, 105, 212–222. [Google Scholar] [CrossRef]
  19. Hegde, S.; Prabhu, K.N. Modification of eutectic silicon in Al–Si alloys. J. Mater. Sci. 2008, 43, 3009–3027. [Google Scholar] [CrossRef]
Figure 1. Proposed levels of influence to create a Designed Material. Based on these approaches, a material can be designed and optimized for a specific purpose or demand.
Metals 08 00491 g001
Figure 2. The two examined cases under different thermal boundary conditions. Left: Primary laser track. Illustrating the first exposure and melting of powder particles covering one layer thickness of 90 µm. Right: Secondary laser track. Illustrating the re-exposure of already-created dense material.
Metals 08 00491 g002
Figure 3. The two examined types of laser tracks. Left: Primary track. Right: Secondary track.
Metals 08 00491 g003
Figure 4. Linear intercept method used on binarized images under a magnification of 150×.
Metals 08 00491 g004
Figure 5. Melt pool dimensions for single parameter variation using secondary laser tracks.
Metals 08 00491 g005
Figure 6. Melt pool width and depth for primary laser tracks. Topographical representation is based on the regression data. Data points of the full factorial design, which were used for the regression, are marked by squares. Data points of the single parameter variations marked by triangles and rhombs.
Metals 08 00491 g006
Figure 7. Melt pool width and depth for secondary laser tracks. Topographical representation based on the regression data. Data points of the full factorial design, which were used for the regression, are marked by squares. Data points of the single parameter variations marked by triangles and rhombs.
Metals 08 00491 g007
Figure 8. Grain length of Al phase for primary and secondary laser tracks. Topographical representation based on the regression data.
Metals 08 00491 g008
Figure 9. Application of results. Designed Material consisting of coarse- (top right) and fine-grained areas (bottom right marked in green).
Metals 08 00491 g009
Table 1. EDX point analysis results.
SpectrumAl (wt %)Si (wt %)
Al matrix97.052.95
AlSi eutectic57.8141.22
Table 2. Coefficients for the quadratic regression model visualized in Figure 6, Figure 7 and Figure 8. The quality of the derived equation is quantified by the coefficient of determination R².
Type of laser trackMelt pool characteristicC1C2C3C4C5C6R2 [%]
Primary Laser TracksWidth6260.258−0.66000.000203087
Depth1172.176−0.76400.0004140.001195
Grain Size2.2990.356000.491000−0.84582
Secondary Laser TracksWidth6550.184−0.72700.000261090
Depth6990.805−1.24300.000407087
Grain Size1.6610−0.9780.90701.11980

