Article

Dissolution and Precipitation Behavior for Hot Forming of 7021 and 7075 Aluminum Alloys

1
Chair of Materials Science, Faculty of Mechanical Engineering and Marine Technology, University of Rostock, Albert-Einstein-Str. 2, 18059 Rostock, Germany
2
Competence Center °CALOR, Department Life, Light &Matter, Faculty of Interdisciplinary Research, University of Rostock, Albert-Einstein-Str. 25, 18059 Rostock, Germany
3
Light Metals Technologies Ranshofen, Austrian Institute of Technology, Lamprechtshausener Str. 61, P.O. Box 26, 5282 Ranshofen, Austria
4
Magna Steyr AG & Co KG, Liebenauer Hauptstraße 317, 8041 Graz, Austria
*
Author to whom correspondence should be addressed.
Metals 2018, 8(7), 531; https://doi.org/10.3390/met8070531
Submission received: 29 May 2018 / Revised: 12 June 2018 / Accepted: 22 June 2018 / Published: 9 July 2018
(This article belongs to the Special Issue Heat Treatment of Aluminum Alloys)

Abstract

:
Due to their high strength, 7xxx aluminum sheets are increasingly used for structural automobile components. One of the major challenges is the formability of these alloys during the production process while retaining high strengths in service. One promising method is forming at elevated temperatures directly after solution annealing; this is known as hot forming. However, this thermomechanical process requires a detailed comprehension of the dissolution and precipitation behavior during heating, solution annealing, and subsequent combination of forming and cooling processes. Therefore, the kinetics of solid-solid phase transformations during continuous heating and continuous cooling of the aluminum alloys EN AW-7021 and EN AW-7075 were determined with differential scanning calorimetry and hardness testing. The suitable solution annealing conditions and the critical cooling rates were specified for both alloys and compared to the real hot forming processes.

1. Introduction

In the automotive industry, mass reduction is one of the most important aims to reduce fuel consumption and achieve higher emission standards. Therefore, the use of high-strength aluminum sheets is currently in focus. The highest strengths with up to 700 MPa are offered by Al-Zn-Mg(-Cu) alloys, which so far are mostly used in aerospace applications. One of the major challenges is to achieve a sufficient formability of these alloys during the production process, while by the same process ensure high strengths in service. The alloys are processed in a certain heat-treatment state, which provides a certain level of strength and formability. Typically, in automotive applications, the final strength for the used alloys is adjusted at the end of the process chain during the paint bake cycle. Thus, the previous process-steps typically use a naturally aged (T4) or stabilized condition (PX). However, those conditions might provide insufficient levels of formability. Some promising methods for increasing the formability are retrogression and re-aging treatments (RRA), warm forming, and so-called hot forming [1,2,3]. Among the three, hot forming (forming at elevated temperature and simultaneous quenching directly after solution annealing) seems to be the most promising method [2,4]. This thermomechanical process requires a detailed knowledge about the microstructural behavior, i.e., the kinetics of solid-solid phase transformations along the process chain including heating, solution annealing, and subsequent cooling processes. Those solid-solid phase transformations particularly include dissolution and precipitation of relevant secondary phases. In the considered alloying system AlZnMg(-Si/-Cu), those precipitation reactions are highly complex as several sequences of the phases MgZn2, Al2CuMg, and Mg2Si are potentially involved [5,6].
Investigations about the dissolution and precipitation behavior of 7075 with combined calorimetric and electron microscopy studies have already been carried out in the 1970s by Adler and DeIasi [7,8]. This work was later on intensified by Lloyd and Chaturvedi, Papazian and Park and Ardell [9,10,11]. These calorimetric studies consist of reheating experiments of different initial material conditions. An investigation of the influence of heat treatment on microstructure and the mechanical properties in the commercial aluminum alloy 7020 was carried out by Paulisch et al. [12].
The main mechanism controlling strength and ductility in AlZnMg(-Si/-Cu) alloys is precipitation strengthening. During heat treatments, the relevant secondary phases can precipitate and dissolve. Either process is controlled by diffusion and thus has a certain time dependency, i.e., they are kinetic in nature. The aim of an appropriate adaption of heat treatment parameters requires a detailed knowledge of those solid-solid phase transformation kinetics. The latter can, for instance, be achieved by in situ differential scanning calorimetry (DSC) measurements [13,14,15]. These methods also could yield continuous cooling precipitation diagrams of 7049A, 7150 and 7020 [16,17,18]. Osten et al. developed continuous heating dissolution diagrams of several 6xxx aluminum alloys in order to investigate the heating process [19].
The aim of this work is to investigate solid-solid phase transformation kinetics of the aluminum alloys 7021 and 7075 with the aforementioned DSC technique and hardness tests. This is in order to develop appropriate heat treatment parameters for hot forming applications of these alloys. The heat treatment parameters developed concern the heating, the solution treatment, and the cooling operation.

2. Materials and Methods

The investigated materials are the two AlZnMg(-Si/-Cu) alloys EN AW-7021 and EN AW-7075. The initial states of both alloys are as plates with a thickness of 2.0 mm in the conditions T4 for EN AW-7021 and T6 for EN AW-7075. The nominal alloying element concentrations for both alloys according to EN 573-3 and for EN AW-7075 the alloying element concentrations measured by optical emission spectroscopy are shown in Table 1. The investigated version of EN AW-7021 is modified by a content of zinc slightly above the upper standard limit of EN 573-3.
In order to cover a wide dynamic range, two DSC instruments with different heating and cooling rate ranges were used (Table 2). Heating experiments were performed with heating rates of 0.01 K/s, 0.1 K/s, and 1.0 K/s. Basing on preliminary melting experiments the maximum temperatures of the heating experiments were chosen to ensure the sample to stay in the solid state. The alloy EN AW-7075 was thus heated up to 490 °C and EN AW-7021 up to 525 °C. Two sample measurements and one baseline measurement were performed per parameter setup. The analysis of the dissolution and precipitation reactions was done according to Osten et al. [19].
The cooling experiments were performed with the parameter setup shown in Table 3. Solution annealing of EN AW-7021 was performed at 515 °C with a duration of 5 min as a result of the heating and soaking experiments discussed below. The solution annealing of EN AW-7075 was performed at 480 °C with a duration of 15 min, which is also a result of the heating and soaking experiments. The analysis of the precipitation reactions was done according to Milkereit et al. [20].
DSC results which compare different scanning rates generally are given as specific excess heat capacity. This unit normalizes the heat flow for the different sample masses and scanning rates used. In most cases, at the highest temperatures of the heating experiments, no reaction free zone was identified. Therefore, no zero-level correction as was introduced earlier [13,19], but instead a vertical shift of the very beginning of the curves to zero level was done, as there should be no reaction. Afterward, the different peaks were labeled with lower case letters for dissolution reactions and upper case letters for precipitation reactions.
For the isothermal DSC experiments, this normalization is not applicable. Hence in this case, differential heat flow curves representing a heat flow subtraction of sample and baseline run are presented. Hardness tests HV1 were performed after aging. Heat treatments for hardness testing were performed in a calorimeter or in a quenching dilatometer (particularly fast cooling rates 10–300 K/s), parameters are given in Table 4. Figure 1 schematically shows the time temperature profiles of the performed experiments.

3. Results & Discussion

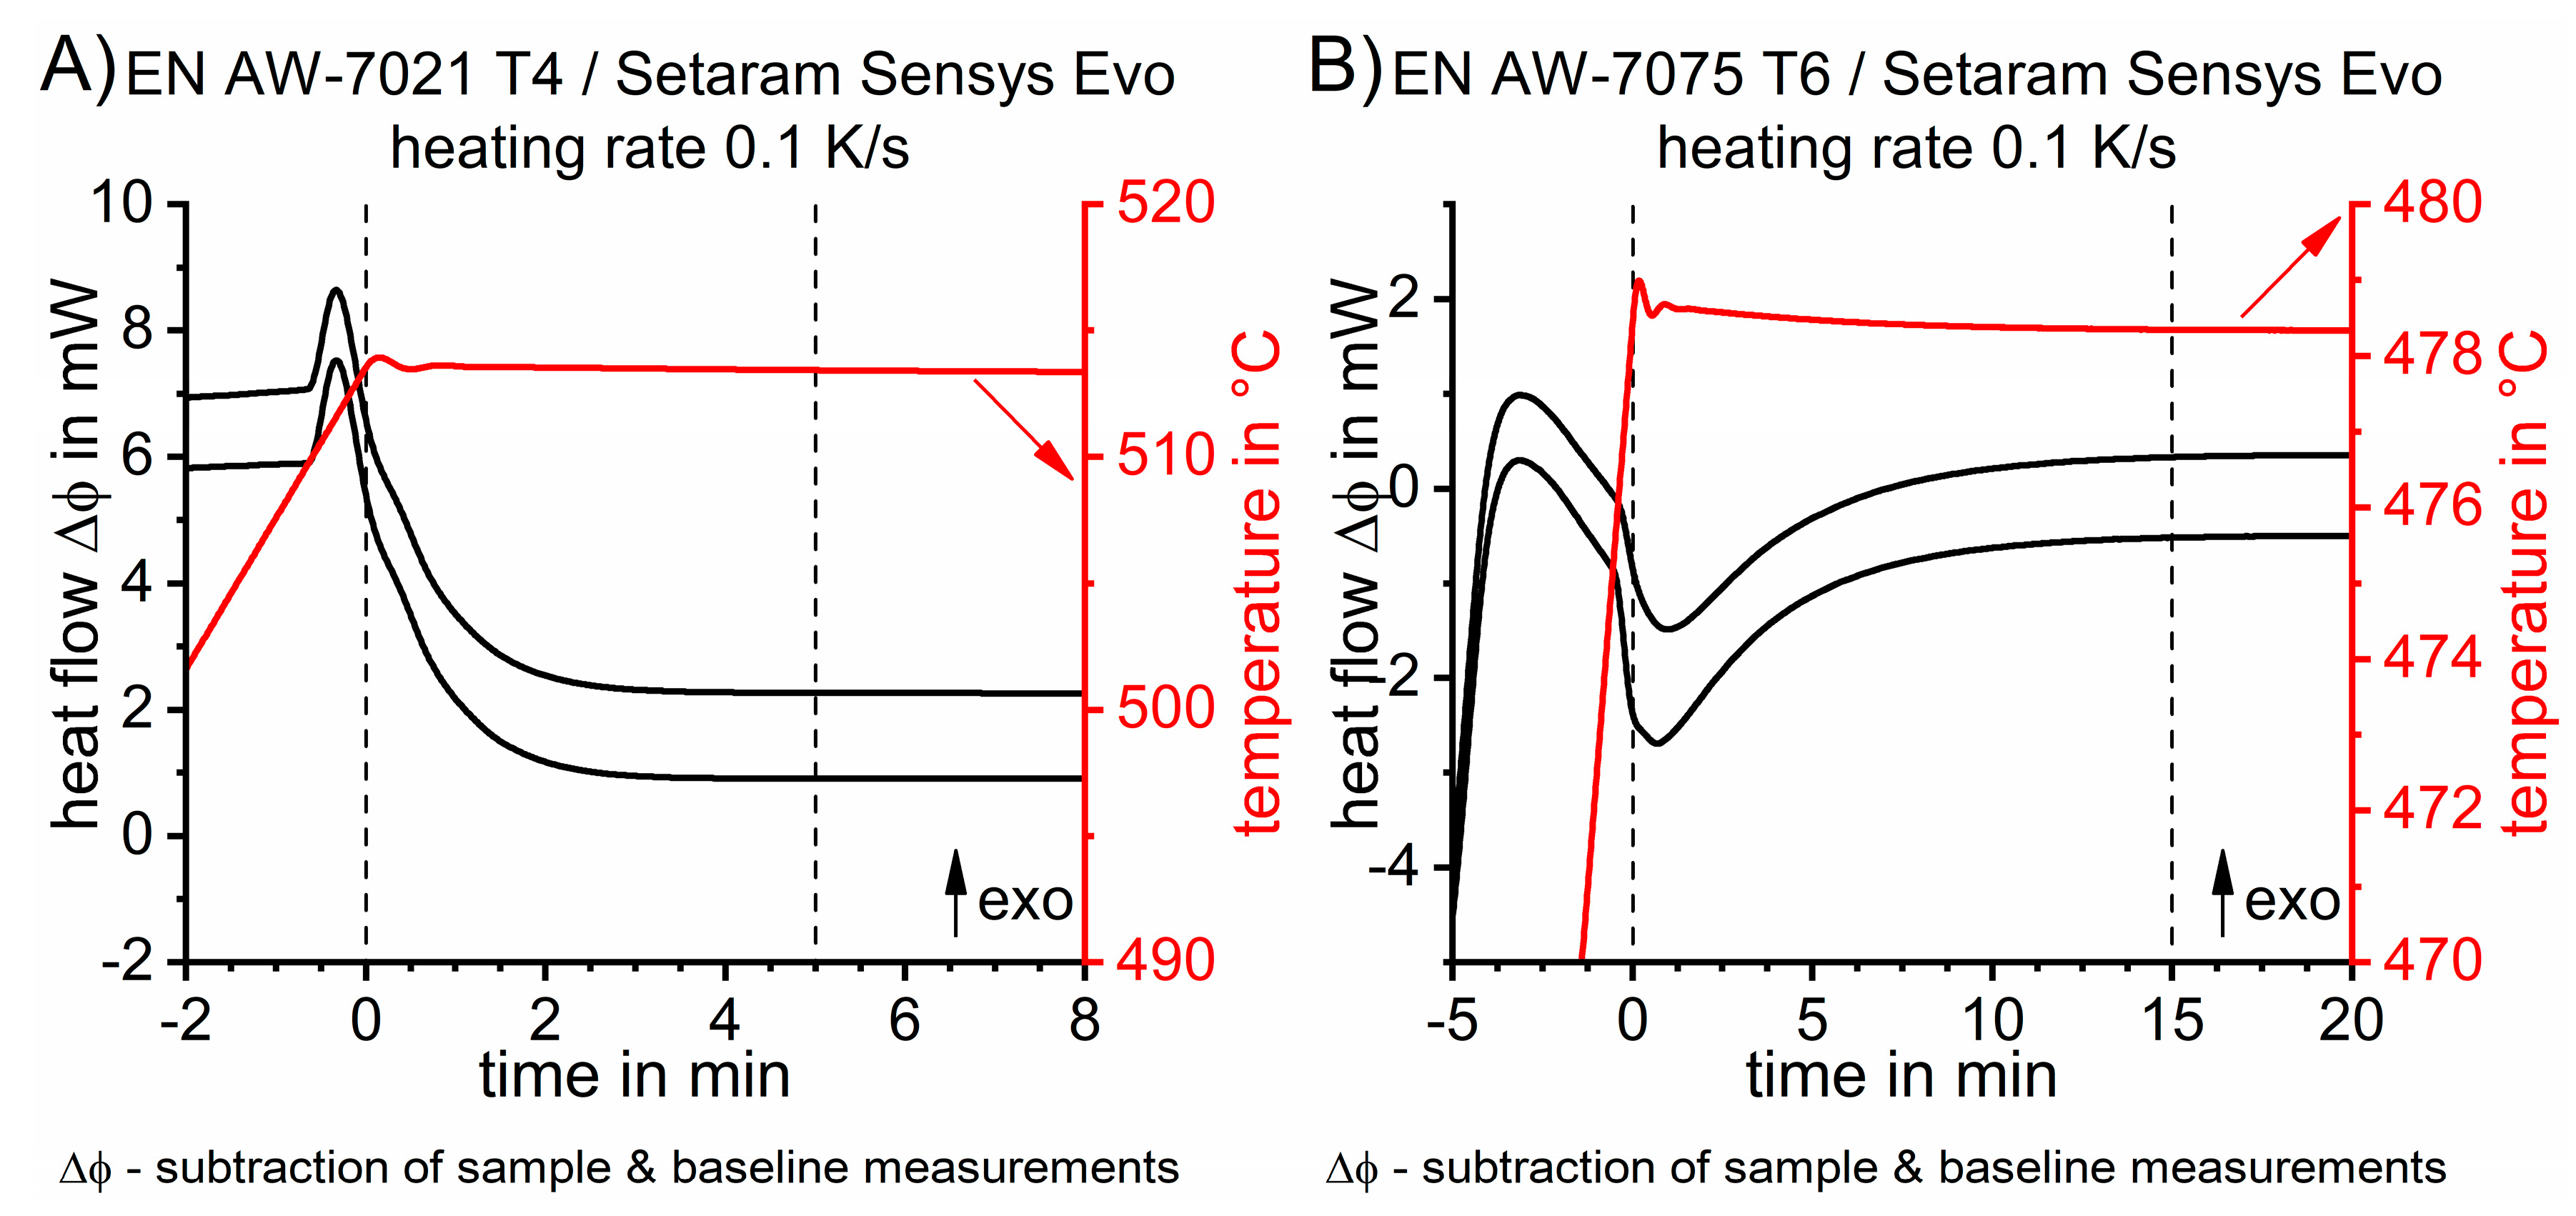
3.1. Heating Experiments

The age hardening treatment comprises three major steps: solution annealing, quenching, and aging. The solution annealing and the involved heating operation towards the soaking temperature are required to establish the basis for the age hardening by generating a complete solid solution. Therefore, the first task is to define appropriate solution treatment temperatures. Therefore, DSC heating curves of various heating rates can give information about when the dissolution is potentially completed during heating to a certain temperature by a certain heating rate. DSC heating experiments as function of temperature on EN AW-7021 T4 with different heating rates are shown in Figure 2A).
The DSC curves of different heating rates are shifted above each other starting with the slowest rate on top. For each DSC curve, its related zero-level is given by a dotted horizontal straight line. Deviations of the DSC signal above those zero-levels indicate, that endothermic dissolution reactions are dominating at a specific temperature. When the main dissolution at higher temperatures is completed the DSC signal typically drops back to zero [19]. The DSC curve of 0.01 K/s shows a first endothermic peak a, which shifts from 110 °C at 0.01 K/s to 160 °C at 1.0 K/s. The peak area of a increases with increasing heating rate. That is due to changes in the overlapping of dissolution and precipitation reactions in the relevant temperature range of peak a. Similar findings on DSC peak overlapping were made on AlMgSi alloys in Ref. [19]. The following exothermic part consists of peaks B, C and D. The peak areas of the peaks B and D decrease with increasing heating rate and at a heating rate of 1.0 K/s these peaks disappear, whereas the peak area of peak C seems to stay constant. All three exothermic peaks shift to higher temperatures with increasing heating rates.
At temperatures above 230 °C at 0.01 K/s and 280 °C at 1.0 K/s, only endothermic peaks can be identified. At the lowest heating rate, five endothermic peaks (e, f, g, h, i) are labeled. The dissolution peaks e, f, and g probably refer to the dissolution of the Al-, Zn-, Mg-, and Cu-rich phases. Although this batch of 7021 contains very little Si, it is known to contain a Mg2Si phase and that its incomplete dissolution will be detrimental. DSC peaks h and i probably relate to the dissolution of Mg2Si. At a heating rate of 0.1 K/s, peak i disappears and all reactions except peak f are increasingly suppressed. At the highest heating rate of 1.0 K/s, only peak f can be clearly identified as a high-temperature peak at about 420 °C. All reactions shift to higher temperatures with increasing heating rates. Basing on preliminary test, the heating of 2 mm thick sheets out of 7xxx Al alloys on average results in a heating rate of about 1 K/s. This is why the DSC curve of 1 K/s is used to select the temperature for the isothermal soaking. In order to allow complete dissolution of β-Mg2Si, we chose a relatively high temperature of 515 °C. At this heating rate and that maximum temperature, most of the main alloying elements needed for the age hardening have already dissolved. This may shorten the soaking duration.
The dissolution behavior of EN AW-7075 T6 is analyzed in the exact same way. The DSC heating curves of EN AW-7075 T6 are shown in Figure 2B). Here too, the first peak a is endothermic and shifts from about 150 °C at a heating rate of 0.01 K/s to 220 °C at a heating rate of 1.0 K/s. The intensity of a increases with increasing heating rate, which is similar to the dissolution at lower temperatures for EN AW-7021 T4. Again the increasing peak is relating to an alteration in the superposition of dissolution and subsequent precipitation reactions. The dissolution peak a is followed by two smaller exothermic precipitation reaction peaks B and C. These peaks become smaller and shift to higher temperatures with increasing heating rate. This is in agreement to effects described by Papazian and by Lloyd and Chaturvedi [9,10].
At temperatures above 230 °C at a heating rate of 0.01 K/s to 310 °C at a heating rate of 1.0 K/s, the excess specific heat capacities are dominated by endothermic peaks. At a heating rate of 0.01 K/s, the two peaks d and e could be identified. With increasing heating rates, peak e disappears and the intensity of peak d seems to decrease. In general, our heating DSC experiments on EN AW-7075 T6 are in good agreement with the results of Adler and DeIasi and by Park and Ardell [7,11]. They supposed that the dissolution of GP zones is the predominant reaction of the first endothermic peak a at low temperatures [7,11]. The two following exothermic peaks B and C are possible results of superimposed formation and growth of η-MgZn2 and η′ [7]. According to Adler and DeIasi, the last broad endothermic peak d at high temperatures is probably caused by a dissolution of η-MgZn2 [7]. It can be assumed that there are several overlaps, which makes it hardly possible to clearly separate the mentioned reactions.
For the assumed furnace heating rate of 1 K/s, it is seen that the major dissolution is completed at about 465 °C. However, slower rates indicate that additional dissolution might occur at even higher temperatures. The solidus temperature of this alloy has been determined to be close above 490 °C. Thus we chose a temperature of 480 °C for the isothermal solution treatment in order to avoid incipient melting.

3.2. Experiments on Isothermal Soaking

In order to identify the appropriate isothermal soaking durations, DSC samples of EN AW-7021 were heated up to 515 °C and held for 60 min in a power-compensated DSC. In this case of an isothermal DSC experiment, the generally preferred data normalization to the specific excess heat capacity is not applicable, as the scanning rate equals zero during the isothermal holding. Hence, we show that the sample heat flow from which the baseline heat flow is subtracted. For EN AW-7021 T4 heated to 515 °C (Figure 3A), the differential heat flow signal approaches a constant value already after a relatively short soaking duration of 5 min. That indicates the completion of the dissolution process. Such a short soaking was expected based on the finding that the major dissolution of the initial T4 condition is already completed at about 440 °C during heating with 1 K/s. Based on those results, a solution treatment at 515 °C with a soaking duration of 5 min is defined for EN AW-7021 T4.
In order to identify the necessary soaking duration for EN AW-7075 T6, samples were heated up to 480 °C and also hold for 60 min (Figure 3B). In case of 7075 T6, the heat flow signal approaches a constant value after a soaking duration of 15 min. This again indicates that the dissolution process is nearly finished. Thus, for the batch of EN AW-7075 T6 investigated here, a solution treatment at 480 °C with a soaking duration of 15 min is defined.

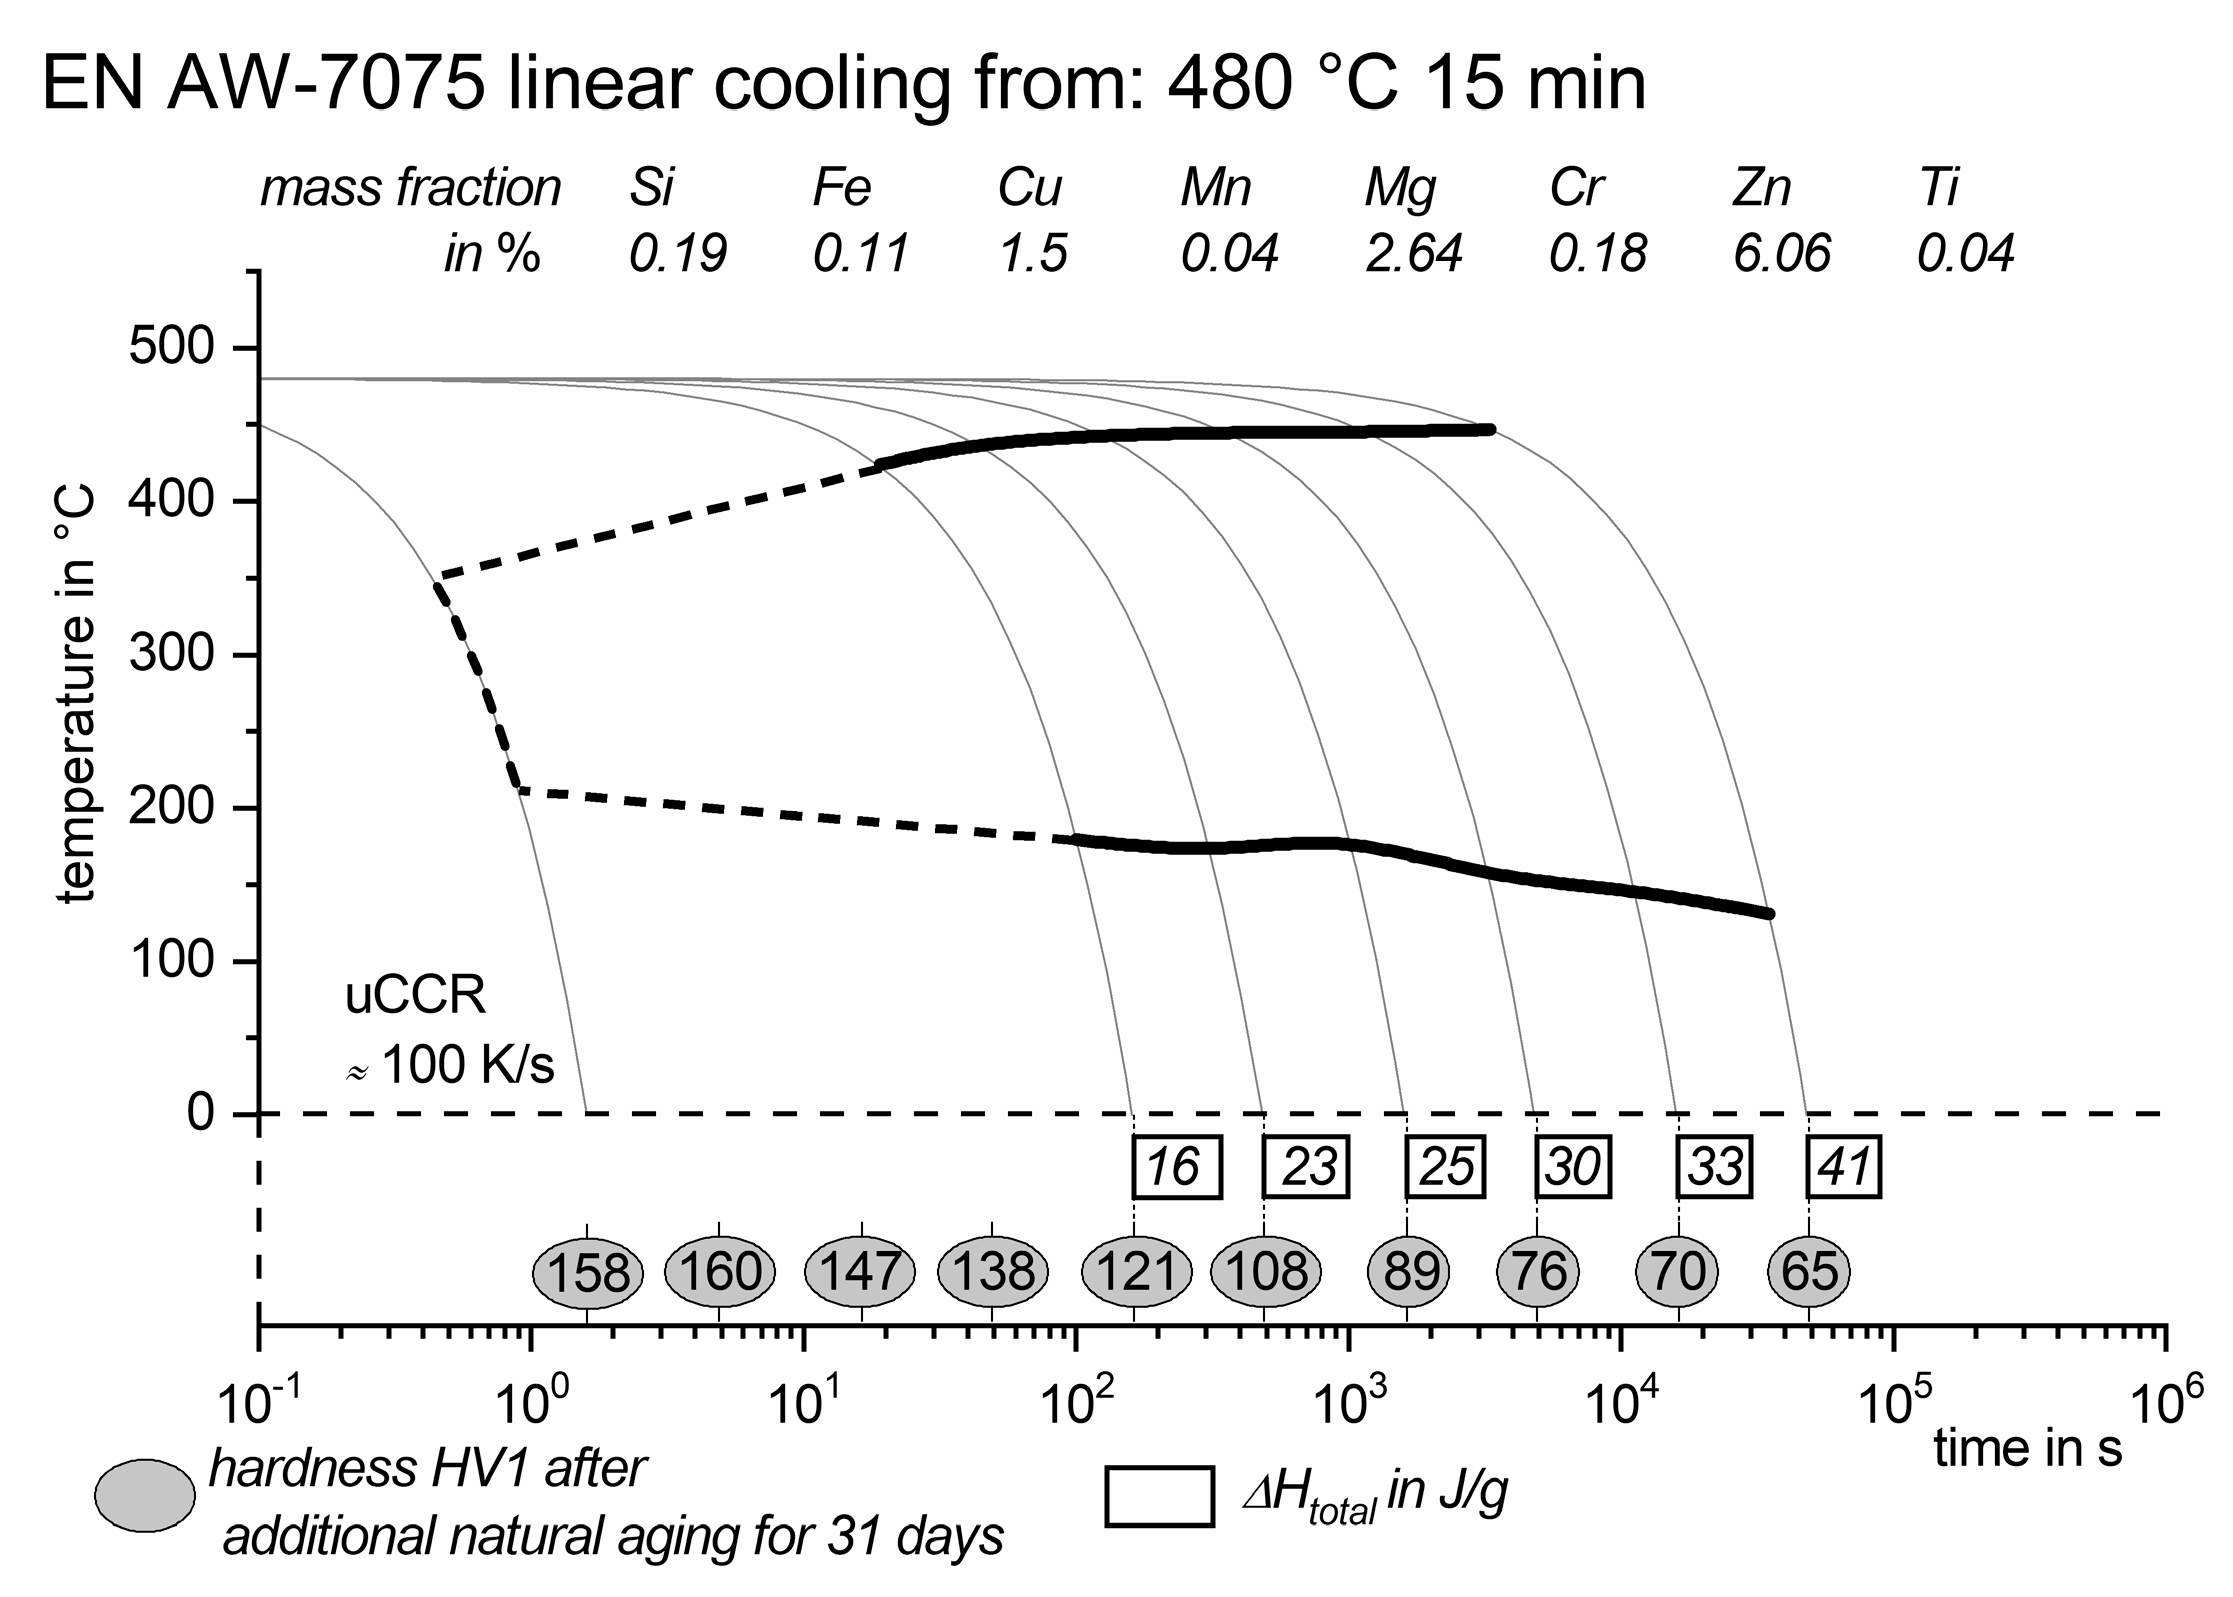
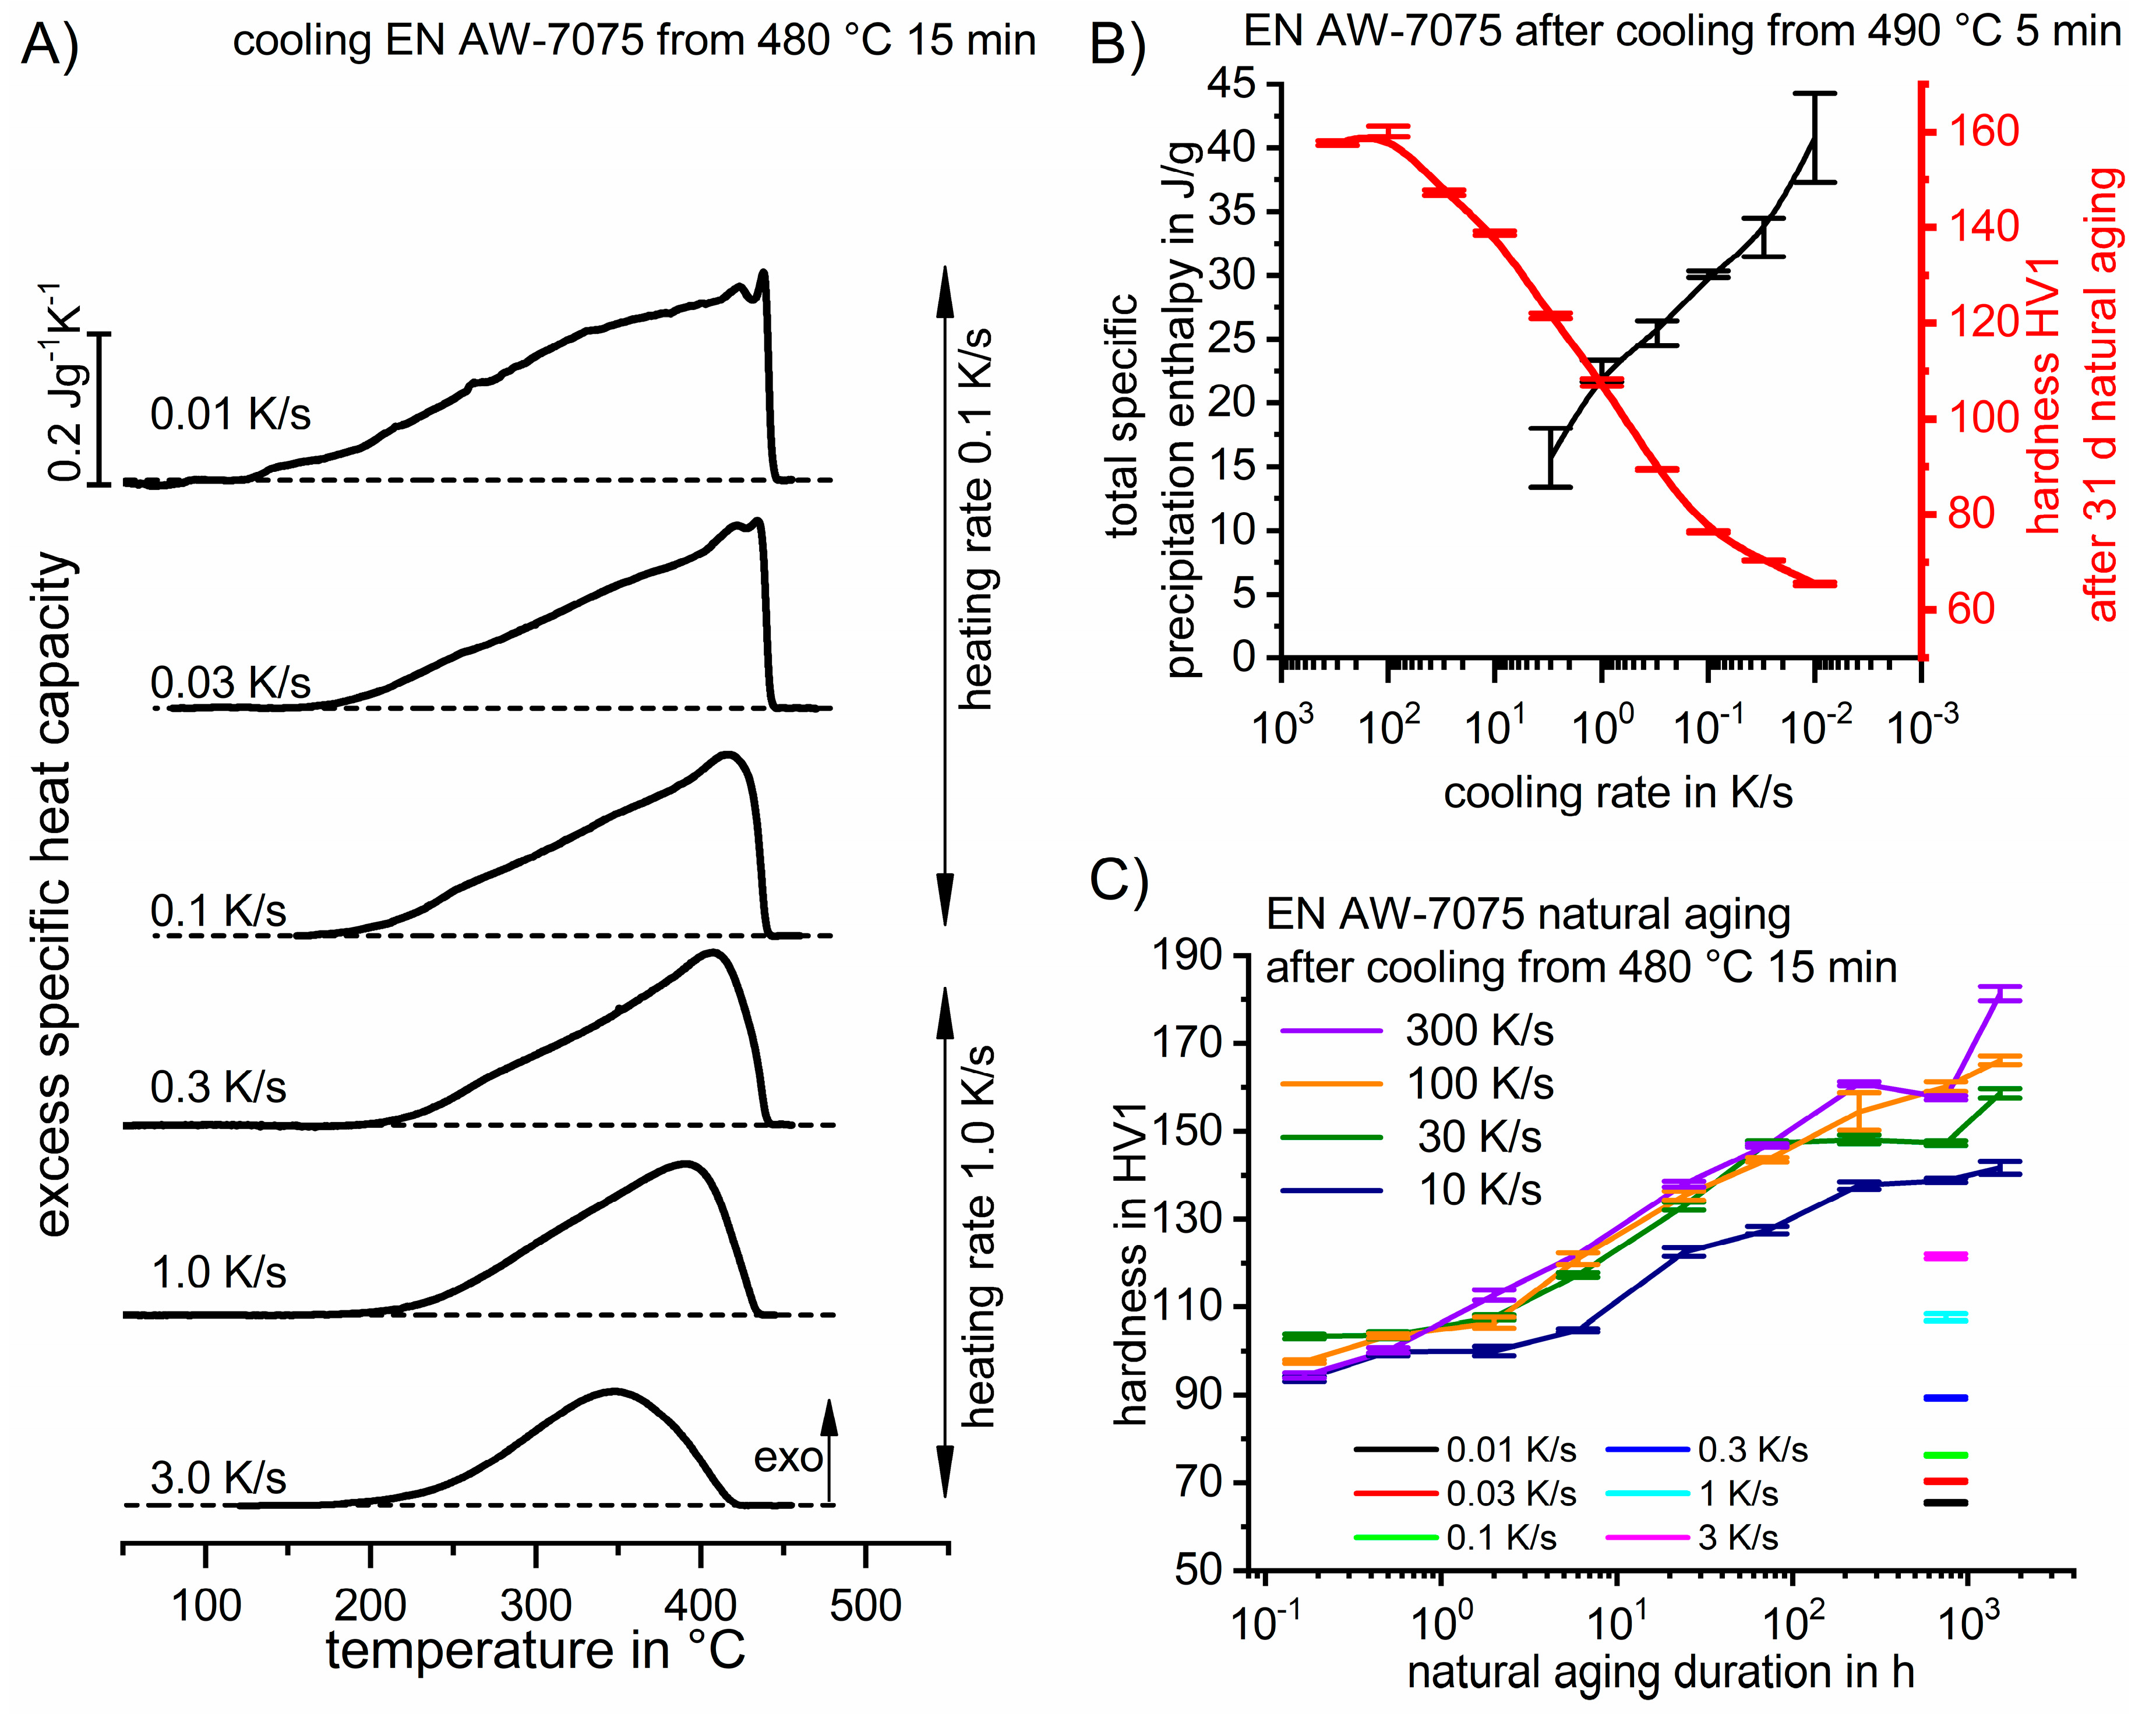
3.3. Cooling Experiments

After defining appropriate solution treatment parameters, the kinetics of quench-induced precipitation of the two alloys is analyzed. For both alloys, the main results of the cooling experiments are given in two similar figures. In Figure 4A and Figure 5A, DSC cooling curves of EN AW-7021 and -7075 after solution annealing as a function of temperature are shown, respectively. Again, beneath each DSC curve, its related zero level is given. In this case of cooling experiments, only exothermic precipitation can occur. Deviations of the DSC curve exceeding the zero level, therefore, indicate the occurrence of exothermic precipitation reactions. The peak area reflects the total specific precipitation enthalpy and is related to the atomic fraction precipitated during cooling. Thus, Figure 4B and Figure 5B plot the total specific precipitation enthalpies released during cooling as well as the hardness after cooling and additional natural aging for 31 days. Additionally, the natural aging behavior after applying different cooling rates is plotted in Figure 4C and Figure 5C for the two alloys, respectively.
For EN AW-7021, four partially overlapped exothermic peaks can be seen during cooling. Some of those are only seen at some specific cooling rates. During slow cooling, the peak at the highest temperature occurs at about 495 °C. This peak is relatively weak and could only be identified at the lowest cooling rate. The high-temperature peak at about 450 °C is also relatively weak and appears at cooling rates between 0.01 K/s and 0.1 K/s. Its peak temperature decreases from about 450 °C to 420 °C with increasing cooling rate. The middle-temperature peak reaction by far has the highest intensity (peak area) and appears at all investigated cooling rates. Its peak temperature decreases from 360 °C at the slowest cooling to 285 °C at the fastest cooling. The corresponding peak area constantly decreases with increasing cooling rate, thus indicating a steadily increased suppression of the referring precipitation reactions. At cooling rates of 0.3 K/s and 1.0 K/s, a precipitation reaction at low temperatures is identified; its peak is at about 90 °C.
The total enthalpy released from EN AW-7021 by quench-induced precipitation steadily decreases from about 25 J/g at a cooling rate of 0.01 K/s to 2 J/g at a cooling rate of 3 K/s (Figure 4B). The upper critical cooling rate (uCCR) would be approached if the enthalpy of quench-induced precipitation reaches zero. This could not be detected within the cooling rate range accessible by conventional DSC. Nevertheless, the hardness after cooling and additional natural aging (Figure 4B,C) indicates an uCCR of about 10 K/s for this batch of EN AW-7021. The hardness increases from 66 HV1 at a cooling rate of 0.01 K/s to 140 HV1 at 10 K/s. A further increase in the cooling rate does not result in a higher hardness.
The natural aging behavior of EN AW-7021 by means of hardness development is shown in Figure 4C. During natural aging, the hardness increases with time. Moreover, the differences between 10 K/s, 30 K/s, and 100 K/s are found to be marginal, especially at long aging durations. This again indicates, that the uCCR of this alloy EN AW-7021 is about 10 K/s, which is in good agreement to the uCCR of 3 K/s found for a similar alloy EN AW-7020 in Ref. [17].
DSC cooling curves of EN AW-7075 are shown in Figure 5A as a function of temperature. Within the whole cooling rate range, only one broad exothermic peak can be identified. At 0.01 K/s this peak reaches from about 450 °C to 130 °C. It is very likely that this broad peak is the sum of several overlapping precipitation reactions. This is argued by the fact that for several similar AlZnMgCu alloys up to four quench induced precipitation reaction DSC peaks have been identified earlier [6,17]. However, for such highly concentrated alloys it was also found earlier that cooling DSC revealed one major broad peak [16]. In a previous study, we examined a different batch of EN AW-7075, which was subjected to a solution treatment of 465 °C for 30 min. This batch yielded highly similar DSC curves, whereby just one broad exothermic reaction was detected [21]. The intensity of the overall reaction decreases with increasing cooling rate. This can be discerned by the total specific precipitation enthalpy, which decreases from about 41 J/g at a cooling rate of 0.01 K/s to 15 J/g at a cooling rate of 3.0 K/s and is plotted in Figure 5B. The fact that the total specific precipitation enthalpy still is about 15 J/g at the highest investigated cooling rate of 3.0 K/s indicates that the uCCR of this alloy 7075 will be well above 3 K/s. This assumption is supported by the hardness after cooling and natural aging. The hardness increases from 65 HV1 at a cooling rate of 0.01 K/s to 160 HV1 at 100 K/s. An increase of the cooling rate to 300 K/s does not result in a higher hardness after 31 days of natural aging. Thus, the uCCR of EN AW-7075 is estimated to be in the order of 100 K/s. This is in good agreement with similarly high-concentration AlZnMgCu alloys, for which the uCCR tend to be in the order of some hundreds of K/s [6,18,21]. For the batch of 7075 investigated in Ref. [21] an uCCR of about 100 K/s was found. The hardness of EN AW-7075 increases with increasing natural aging duration (Figure 5C). If naturally aged for more than two hours, higher cooling rates result in higher hardness. It is found that at a natural aging duration of 31 d (744 h) the hardness after cooling with 300 K/s is similar to the hardness of cooling with 100 K/s. At the longest investigated natural aging duration of 63 d (1512 h) the resultant hardness from cooling with 300 K/s is slightly higher than after cooling with 100 K/s. A recent work on the influence of the solution treatment on quench induced precipitation in AlMgSi alloys points out the importance of appropriate solution annealing parameters [22]. Considering the findings of Ref. [22], the solution treatment parameters chosen in this work for EN AW-7021 and 7075, respectively, seem to result in a complete dissolution of the major alloying elements, because a certain undercooling precedes quench induced precipitation in both cases (see Figure 4A and Figure 5A). This hints on the adequacy of the parameters chosen for the solution treatments.
Based on the results discussed above the continuous cooling precipitation diagrams (CCP diagrams) of the two alloys EN AW-7021 and -7075 are derived and plotted in Figure 6 and Figure 7, respectively. CCP diagrams describe the precipitation behavior of aluminum alloys during continuous cooling from solution annealing as a function of temperature and time in a condensed form (Ref. [21]). A very broad time (cooling-rate) range is physically and technologically relevant and thus necessitates the time axis to be scaled logarithmically. The time axis ranges from 0.1 to 1 × 16 s, while the plotted temperature range is fixed on 550 to 0 °C. Some selected cooling curves of constant cooling rates are provided to indicate the time-temperature development of the linear cooling processes. Continuous cooling precipitation diagrams are only valid for the given alloy composition investigated and the specific solution treatment applied. Be aware, that CCP diagrams must be read following continuous cooling, they are not valid for isothermal conditions. Precipitation start and finish temperatures that depend on quench rate are shown in bold lines. In almost any case, several precipitation reactions during cooling occur sequentially or overlapping. Precipitation start of the first reaction and precipitation finish of the last reaction could be determined exactly and are shown in continuous black lines. Overlapping reactions are hard to separate by DSC [13,14]. Therefore, intermediate precipitation start and finish temperatures have been estimated using the procedure outlined in [14]. Sometimes, precipitation start and finish temperatures have been extrapolated for readability by dashed black lines. To provide information about precipitation intensity, the total precipitation enthalpy ΔHtotal was recorded; its values are plotted below certain cooling paths in rectangles. The total precipitation enthalpy is proportional to the volume fraction of precipitates formed during cooling. In addition, the Vickers hardness HV1 after cooling and additional aging is provided in ovals. Precipitation enthalpy is high for slow cooling, whereas hardness after aging is high for rapid quenching. Substantial precipitation of quench induced precipitates during cooling causes a loss of alloying elements in supersaturation available for subsequent aging. For both enthalpy and hardness values, thin vertical lines indicate the exact time of validity. The slowest cooling rate at which a certain precipitation reaction is suppressed completely during cooling is defined as the upper critical cooling rate (UCCR) [14]. These values are provided in the lower-left corner of the diagrams. In cases where (in situ) DSC measurements were not possible up to the cooling rates above the UCCR, the latter is estimated based on the hardness results (Figure 4B and Figure 5B).

3.4. Comparison with Real Hot Forming Processes

Hot forming has been tested on a hat-type profile (Figure 8). The 2 mm thick sheets of 7021 respectively 7075 were heated to their above-mentioned solution heat treatment conditions and subsequently either quenched in a water bath or in the cold dies during hot forming. The temperature used during cold die quenching was recorded by placing type K thermocouples into two small bores that have been drilled into the blanks. The position of the bores was chosen to be in the center of bottom and flange area of the hat-type profile respectively. Three measurements were carried out for each alloy to ensure reproducibility.
Figure 9 shows the cooling curves recorded for the water and cold die quenching of 7021. For die quenching, the averaged curves from three experiments at the flange and bottom area are presented. As can be seen, the cold die quenching process takes about 25 s from manually taking the blanks out of the furnace until the start of die quenching. The sheets cool from 515 °C down to about 445 °C during this time span, resulting in a cooling rate of about 2–3 K/s. Compared to Figure 4A, this temperature loss seems to be noncritical; considering those particular cooling rates, all precipitation reactions during cooling of 7021 start below 380 °C. As seen from Figure 5A, the majority of quench induced precipitation, which substantially reduces the age hardening potential, will occur in the critical temperature interval about from 380 °C to 200 °C. In this temperature interval, die quenching resulted in cooling rates of about 180 K/s, which is clearly above the critical cooling rate of 10 K/s for 7021. In summary, the die quenching of 2 mm 7021 thick sheets can be realized with large safety margins to critical process parameters.
Figure 10 shows the cooling curves recorded for water and cold die quenching of 7075. The sheets cool from 480 °C down to about 425 °C during this time span, resulting in a cooling rate of about 2–3 K/s. Compared to Figure 5A, this temperature loss seems to be tolerable, but at the limit, because the major quench induced precipitation reactions during cooling of 7075 start just below 425 °C. A critical temperature interval for precipitation during cooling of 7075 can be estimated from 425 °C to 180 °C. In this temperature interval, die quenching resulted in cooling rates of about 120 K/s, which is exactly in the critical cooling rate range of 100 K/s for 7075. Quenching rates at the bottom area are slightly higher than at the flange area. This is due to the longer contact of the bottom area with the tool, which starts already during positioning. To summarize, the die quenching of 2 mm 7075 thick sheets can be realized but is very close to the critical process parameters.
For water quenching, the handling times are significantly shorter and quenching already starts 5 to 7 s after taking the sheets out of the furnace. The temperature loss during transfer is therefore limited to 10–20 K. The critical temperature ranges of both alloys are run through with rates of about 400 K/s, i.e. higher quenching rates compared to cold die quenching.
A further adjustment of quenching rates to avoid unnecessary warping or residual stress has not been conducted within the investigations described. This issue must, however, be addressed during the design of production lines. This also applies for room temperature storage between hot forming and final artificial aging, which can negatively influence on strength [23,24,25,26,27]. Adapted stabilization heat treatments have already been developed [28].

4. Conclusions

The above considerations on the AlZnMg(Cu/Si) wrought alloys EN AW-7021 and -7075 have led to the following conclusions:
Applying a heating rate of 1 K/s results in the following solution annealing parameters to be appropriate for:
EN AW-7021 T4: 515 °C for 5 min
EN AW-7075 T6: 480 °C for 15 min
Cooling from solution treatment might lead to substantial quench induced precipitation resulting in a severe loss of age hardening potential. If using the above-mentioned solution temperatures, the transfer of parts from the solution treatment furnace to the quenching operation must not exceed a loss down to 380 °C for 7021 and down to 425 °C for 7075 (for the given cooling rate of calm air cooling).
The critical cooling rate to avoid any quench induced precipitation or loss of age hardening potential is about 10 K/s for EN AW-7021 and about 100 K/s for EN AW-7075.
Those relatively high cooling rates should be retained down to below 200 °C to avoid quench induced precipitation or loss of age hardening potential.
Real hot forming of 2 mm thick sheet is suitable to fulfill the above mentioned critical process parameters, for 7021 with a large safety margin, for 7075 near the borderline.

Author Contributions

M.Ö. performed the DSC experiments; P.S. and G.K. performed the hot forming experiments, M.Ö., B.M. and O.K. analyzed the data and wrote the paper. All authors checked the manuscript and have given their approval for the latest version.

Funding

This research was funded by the Austrian Research Promotion Agency (FFG) as part of the framework of the priority program AMOREE. The authors gratefully acknowledge this funding.

Conflicts of Interest

The authors declare no conflict of interest.

References

  1. Jaburek, N.; Merklein, M. Influence of a retrogression and reaging (RRA)-treatment on the mechanical and microstructural characteristics of the aluminium alloy AlZn4, 5Mg1. Prod. Eng. Res. Dev. 2015, 9, 161–166. [Google Scholar] [CrossRef]
  2. Bardelcik, A.; Bouhier, A.; Worswick, M.J. Three Point Bend Performance of Solutionized, Die Quenched and Heat Treated AA7075 Beam Members. MSF 2014, 794–796, 431–436. [Google Scholar] [CrossRef]
  3. Kumar, M.; Sotirov, N.; Chimani, C.M. Investigations on warm forming of AW-7020-T6 alloy sheet. J. Mater. Process. Technol. 2014, 214, 1769–1776. [Google Scholar] [CrossRef]
  4. Keci, A.; Harrison, N.R.; Luckey, S.G. Experimental Evaluation of the Quench Rate of AA7075. In Proceedings of the SAE 2014 World Congress & Exhibition, Detroit, MI, USA, 8–10 April 2014; SAE International400 Commonwealth Drive: Warrendale, PA, USA, 2014. [Google Scholar]
  5. Polmear, I.J. Light Alloys. From Traditional Alloys to Nanocrystals, 4th ed.; Elsevier Butterworth-Heinemann: Amsterdam, The Netherlands, 2006. [Google Scholar]
  6. Starink, M.J.; Milkereit, B.; Zhang, Y.; Rometsch, P.A. Predicting the quench sensitivity of Al-Zn-Mg-Cu alloys: A model for linear cooling and strengthening. Mater. Des. 2015, 88, 958–971. [Google Scholar] [CrossRef]
  7. Adler, P.N.; DeIasi, R. Calorimetric studies of 7000 series aluminum alloys: II. Comparison of 7075, 7050 and RX720 alloys. Metall. Trans. A 1977, 8, 1185–1190. [Google Scholar] [CrossRef]
  8. DeIasi, R.; Adler, P.N. Calorimetric studies of 7000 series aluminum alloys: I. Matrix precipitate characterization of 7075. Metall. Mater. Trans. A 1977, 8, 1177–1183. [Google Scholar]
  9. Lloyd, D.J.; Chaturvedi, M.C. A calorimetric study of aluminium alloy AA-7075. J. Mater. Sci. 1982, 17, 1819–1824. [Google Scholar] [CrossRef]
  10. Papazian, J.M. Calorimetric studies of precipitation and dissolution kinetics in aluminum alloys 2219 and 7075. Metall. Mater. Trans. A 1982, 13, 761–769. [Google Scholar] [CrossRef]
  11. Park, J.K.; Ardell, A.J. Correlation between microstructure and calorimetric behavior of aluminum alloy 7075 and Al-Zn-Mg alloys in various tempers. Mater. Sci. Eng. A 1989, 114, 197–203. [Google Scholar] [CrossRef]
  12. Paulisch, M.C.; Wanderka, N.; Haupt, M.; Selve, S.; Driehorst, I.; Reimers, W. The influence of heat treatments on the microstructure and the mechanical properties in commercial 7020 alloys. Mater. Sci. Eng. A 2015, 626, 254–262. [Google Scholar] [CrossRef]
  13. Milkereit, B.; Kessler, O.; Schick, C. Recording of continuous cooling precipitation diagrams of aluminium alloys. Thermochim. Acta 2009, 492, 73–78. [Google Scholar] [CrossRef]
  14. Milkereit, B.; Wanderka, N.; Schick, C.; Kessler, O. Continuous cooling precipitation diagrams of Al-Mg-Si alloys. Mater. Sci. Eng. A 2012, 550, 87–96. [Google Scholar] [CrossRef]
  15. Milkereit, B.; Giersberg, L.; Kessler, O.; Schick, C. Isothermal time-temperature-precipitation diagram for an aluminum alloy 6005A by in situ DSC experiments. Materials 2014, 7, 2631–2649. [Google Scholar] [CrossRef] [PubMed]
  16. Zohrabyan, D.; Milkereit, B.; Schick, C.; Kessler, O. Continuous cooling precipitation diagram of high alloyed Al-Zn-Mg-Cu 7049A alloy. Trans. Nonferrous Met. Soc. China 2014, 24, 2018–2024. [Google Scholar] [CrossRef]
  17. Zhang, Y.; Milkereit, B.; Kessler, O.; Schick, C.; Rometsch, P.A. Development of continuous cooling precipitation diagrams for aluminium alloys AA7150 and AA7020. J. Alloy. Compd. 2014, 584, 581–589. [Google Scholar] [CrossRef]
  18. Yang, B.; Milkereit, B.; Zhang, Y.; Rometsch, P.A.; Kessler, O.; Schick, C. Continuous cooling precipitation diagram of aluminium alloy AA7150 based on a new fast scanning calorimetry and interrupted quenching method. Mater. Charact. 2016, 120, 30–37. [Google Scholar] [CrossRef]
  19. Osten, J.; Milkereit, B.; Schick, C.; Kessler, O. Dissolution and precipitation behaviour during continuous heating of Al-Mg-Si alloys in a wide range of heating rates. Materials 2015, 8, 2830–2848. [Google Scholar] [CrossRef]
  20. Milkereit, B.; Beck, M.; Reich, M.; Kessler, O.; Schick, C. Precipitation kinetics of an aluminium alloy during Newtonian cooling simulated in a differential scanning calorimeter. Thermochim. Acta 2011, 522, 86–95. [Google Scholar] [CrossRef]
  21. Milkereit, B.; Kessler, O. Continuous-Cooling Precipitation Diagrams. In ASM Handbook Volume 4E: Heat Treating of Nonferrous Alloys; Totten, G.E., Ed.; ASM International: Materials Park, OH, USA, 2016; pp. 191–197. [Google Scholar]
  22. Fröck, H.; Milkereit, B.; Wiechmann, P.; Springer, A.; Sander, M.; Kessler, O.; Reich, M. Influence of Solution-Annealing Parameters on the Continuous Cooling Precipitation of Aluminum Alloy 6082. Metals 2018, 8, 265. [Google Scholar] [CrossRef]
  23. Poznak, A.; Thole, V.; Sanders, P. The Natural Aging Effect on Hardenability in Al-Mg-Si. A Complex Interaction between Composition and Heat Treatment Parameters. Metals 2018, 8, 309. [Google Scholar] [CrossRef]
  24. Banhart, J.; Chang, C.S.T.; Liang, Z.; Wanderka, N.; Lay, M.D.H.; Hill, A.J. Natural Aging in Al-Mg-Si Alloys—A Process of Unexpected Complexity. Adv. Eng. Mater. 2010, 12, 559–571. [Google Scholar] [CrossRef]
  25. Chang, C.S.T.; Wieler, I.; Wanderka, N.; Banhart, J. Positive effect of natural pre-ageing on precipitation hardening in Al–0.44 at% Mg–0.38 at% Si alloy. Ultramicroscopy 2009, 109, 585–592. [Google Scholar] [CrossRef]
  26. Pogatscher, S.; Antrekowitsch, H.; Leitner, H.; Ebner, T.; Uggowitzer, P.J. Mechanisms controlling the artificial aging of Al-Mg-Si Alloys. Acta Mater. 2011, 59, 3352–3363. [Google Scholar] [CrossRef]
  27. Serizawa, A.; Hirosawa, S.; Sato, T. Three-Dimensional Atom Probe Characterization of Nanoclusters Responsible for Multistep Aging Behavior of an Al-Mg-Si Alloy. Metall. Mater. Trans. A 2008, 39, 243–251. [Google Scholar] [CrossRef]
  28. Österreicher, J.A.; Kirov, G.; Gerstl, S.S.A.; Mukeli, E.; Grabner, F.; Kumar, M. Stabilization of 7xxx aluminium alloys. J. Alloy. Compd. 2018, 740, 167–173. [Google Scholar] [CrossRef]
Figure 1. Schematic time temperature profiles of the experiments. (A) linear heating experiments. (B) Experiments on isothermal soaking. (C) Continuous cooling experiments.
Metals 08 00531 g001
Figure 2. DSC heating experiments on (A) 7021 T4 and (B) 7075 T6.
Metals 08 00531 g002
Figure 3. Differential heat flow of each two measurements on (A) EN AW-7021 respectively -7075 (B) versus pure Al during the last minutes of the heating and first minutes of the isothermal soaking at 515 °C respectively 480 °C.
Metals 08 00531 g003
Figure 4. (A) Cooling DSC curves of EN AW-7021 for various cooling rates; (B) Total specific precipitation enthalpy and hardness after cooling and natural aging as functions of cooling rate; (C) Natural aging behavior of EN AW-7021 for various cooling rates.
Metals 08 00531 g004
Figure 5. (A) Cooling DSC curves of EN AW-7075 for various cooling rates; (B) Total specific precipitation enthalpy and hardness after cooling and natural aging as functions of cooling rate; (C) Natural aging behavior of EN AW-7075 for various cooling rates.
Metals 08 00531 g005
Figure 6. CCP diagram of EN AW-7021 for cooling from 515 °C for 5 min. The diagram plots the start- and end-temperatures of the high-, medium- and low-temperature reactions (HTRs/MTRs/LTRs) as evaluated from continuous cooling DSC.
Metals 08 00531 g006
Figure 7. CCP diagram of EN AW-7075 for cooling from 480 °C for 15 min.
Metals 08 00531 g007
Figure 8. Hat-type profile for hot forming. The cover plate of 6016 is not relevant for die quenching. Dimensions in mm.
Metals 08 00531 g008
Figure 9. Cooling curves for hot forming and water quenching of 7021.
Metals 08 00531 g009
Figure 10. Cooling curves for hot forming and water quenching of 7075.
Metals 08 00531 g010
Table 1. Mass fractions of the main alloying elements of the investigated aluminum alloys EN AW-7021 and EN AW-7075 in %.
AlloysSiFeCuMnMgZnCrTiZr
EN AW-7075-T60.190.111.500.042.646.060.180.040.02
EN AW-7021-T4max. 0.25max. 0.40max. 0.16max. 0.101.60–2.106.00–6.80max. 0.05max. 0.1max. 0.18
Table 2. Used differential scanning calorimeters with scanning rate ranges and samples geometries.
Setaram Sensys EvoPerkin Elmer Pyris 1 DSC
typeheat flowpower compensating
heating ratemax. 0.1 K/smax. 5 K/s
cooling rate0.01–0.1 K/s0.3–5 K/s
sample geometryØ 6.0 mm × 9.0 mm
(6 × 1.5 mm stacked) [19]
Ø 6.4 mm × 1.0 mm
Table 3. Parameter setup for cooling experiments.
Heat Treating DeviceSetaram Sensys EvoPerkin Elmer Pyris 1 DSC
heating rate in K/s0.11.0
cooling rates in K/s0.01, 0.03, 0.10.3, 1.0, 3.0
number of measurements per cooling rateat least twoat least six
Table 4. Parameter setup for hardness test samples.
Calorimeter Perkin Elmer Pyris 1Dilatometer Bähr DIL 805
sample geometryØ 6.4 mm × 1.0 mmØ 6.4 mm × 1.0 mm
heating rate in K/s1.0
solution annealing480 °C/15 min (EN AW-7075)
515 °C/5 min (EN AW-7021)
cooling rates in K/s0.01/0.03/1.0/3.010/ 30/100/300 1
natural aging duration31 d10 min/30 min/2 h/6 h/1 d/3 d/10 d/30 d
1 only for EN AW-7075.

