Influences of Compression Ratios on Sound Absorption Performance of Porous Nickel–Iron Alloy


1
College of Field Engineering, Army Engineering University, No. 1 Haifu Street, Nanjing 210007, Jiangsu, China
2
Department of Industrial and Systems Engineering, The Hong Kong Polytechnic University, Hung Hom, Kowloon 999077, Hong Kong, China
*
Author to whom correspondence should be addressed.
Metals 2018, 8(7), 539; https://doi.org/10.3390/met8070539
Submission received: 25 June 2018
/
Revised: 10 July 2018
/
Accepted: 11 July 2018
/
Published: 12 July 2018
Abstract
:The improvement of sound absorption performance of porous metal is a focus of research in the field of noise reduction. Influences of compression ratios on sound absorption performance of a porous nickel-iron (Ni-Fe) alloy were investigated. The samples were compressed with ratios from 10% to 80% at an interval of 10%. Based on the standing wave method, sound absorption coefficients of compressed samples with different thicknesses were obtained. It could be found that with the same compression ratio, sound absorption performance was improved with the increase of thickness. Based on the modified Johnson-Allard model with a correction factor, the sound absorption coefficient of the porous Ni-Fe with a thickness of 20 mm for different compression ratios was derived, whose aim was to quantificationally analyze influences of the compression ratio. The results indicated that the sample with a compression ratio of 70% exhibited optimal sound absorption performance, and its average sound absorption coefficient reached 88.97% in a frequency range of 1000–6000 Hz. Meanwhile, the section morphologies of compressed samples were investigated by a scanning electron microscope, which studied the sound absorption performance by analyzing structures of the porous Ni-Fe samples with different compression ratios. The obtained achievements will promote the application of the porous Ni-Fe alloy in the field of acoustics.
1. Introduction
Applications of porous metal in pollution control of urban noise make it a focus of research in the field of acoustics, because noise pollution greatly damages physical and mental health of humans and it can generate some diseases [1,2]. Relative to other porous materials, porous nickel-iron (Ni-Fe) alloy has the advantages of a high sound absorption coefficient, fine machinability, excellent thermal conductivity, good breathability, and outstanding fire resistance, which makes it a promising material for noise reduction [3,4]. In order to further improve the sound absorption performance of a porous Ni-Fe alloy in limited dimension, the sample was compressed. Wang et al. [5] studied the influence of compression ratios on the sound absorption property of foamed aluminum, and the results showed that the best sound absorption property was obtained at a critical compressive ratio of 40%.
Although compression can improve the sound absorption performance of porous metals with a limited dimension in general, the sample cannot be infinitely compressed and the sound absorption coefficient cannot be improved in full spectrum. Therefore, modeling sound absorption performance of the porous material is a critical approach for optimization of the parameter. Liang et al. [6] and Atalla et al. [7] conducted quantitative analysis for acoustic characteristics of porous materials with Kolmogorov’s turbulence theory, and the model was adopted to analyze wave propagation in the porous metal. Chevillotte et al. [8] and Venegas et al. [9] studied the effects of the three-dimensional microstructure on the sound absorption of foams, and the transport and sound absorption properties were numerically studied as a function of throat size, pore size, and sample thickness. Yang et al. [10] and Kino [11] modified the Johnson-Allard model by introducing a correction factor, which could efficiently improve the prediction accuracy of the sound absorption coefficient of the porous metal.
In this study, the sound absorption coefficient of the porous Ni-Fe alloy with a compression ratio from 0% to 80% at an interval of 10% was obtained according to the standing wave method [12,13]. In order to quantificationally analyze influences of the compression ratio, the sound absorption coefficient of the porous Ni-Fe with a different compression ratio at the same thickness of 20 mm was calculated based on the modified Johnson-Allard model [10,14,15,16]. Afterwards, section morphologies of the compressed samples were studied with scanning electron microscopy (SEM), which could qualitatively explain influences of the compression ratio on the sound absorption performance of the porous Ni-Fe alloy.
2. Experimental Design
2.1. Preparation of Porous Ni-Fe Samples
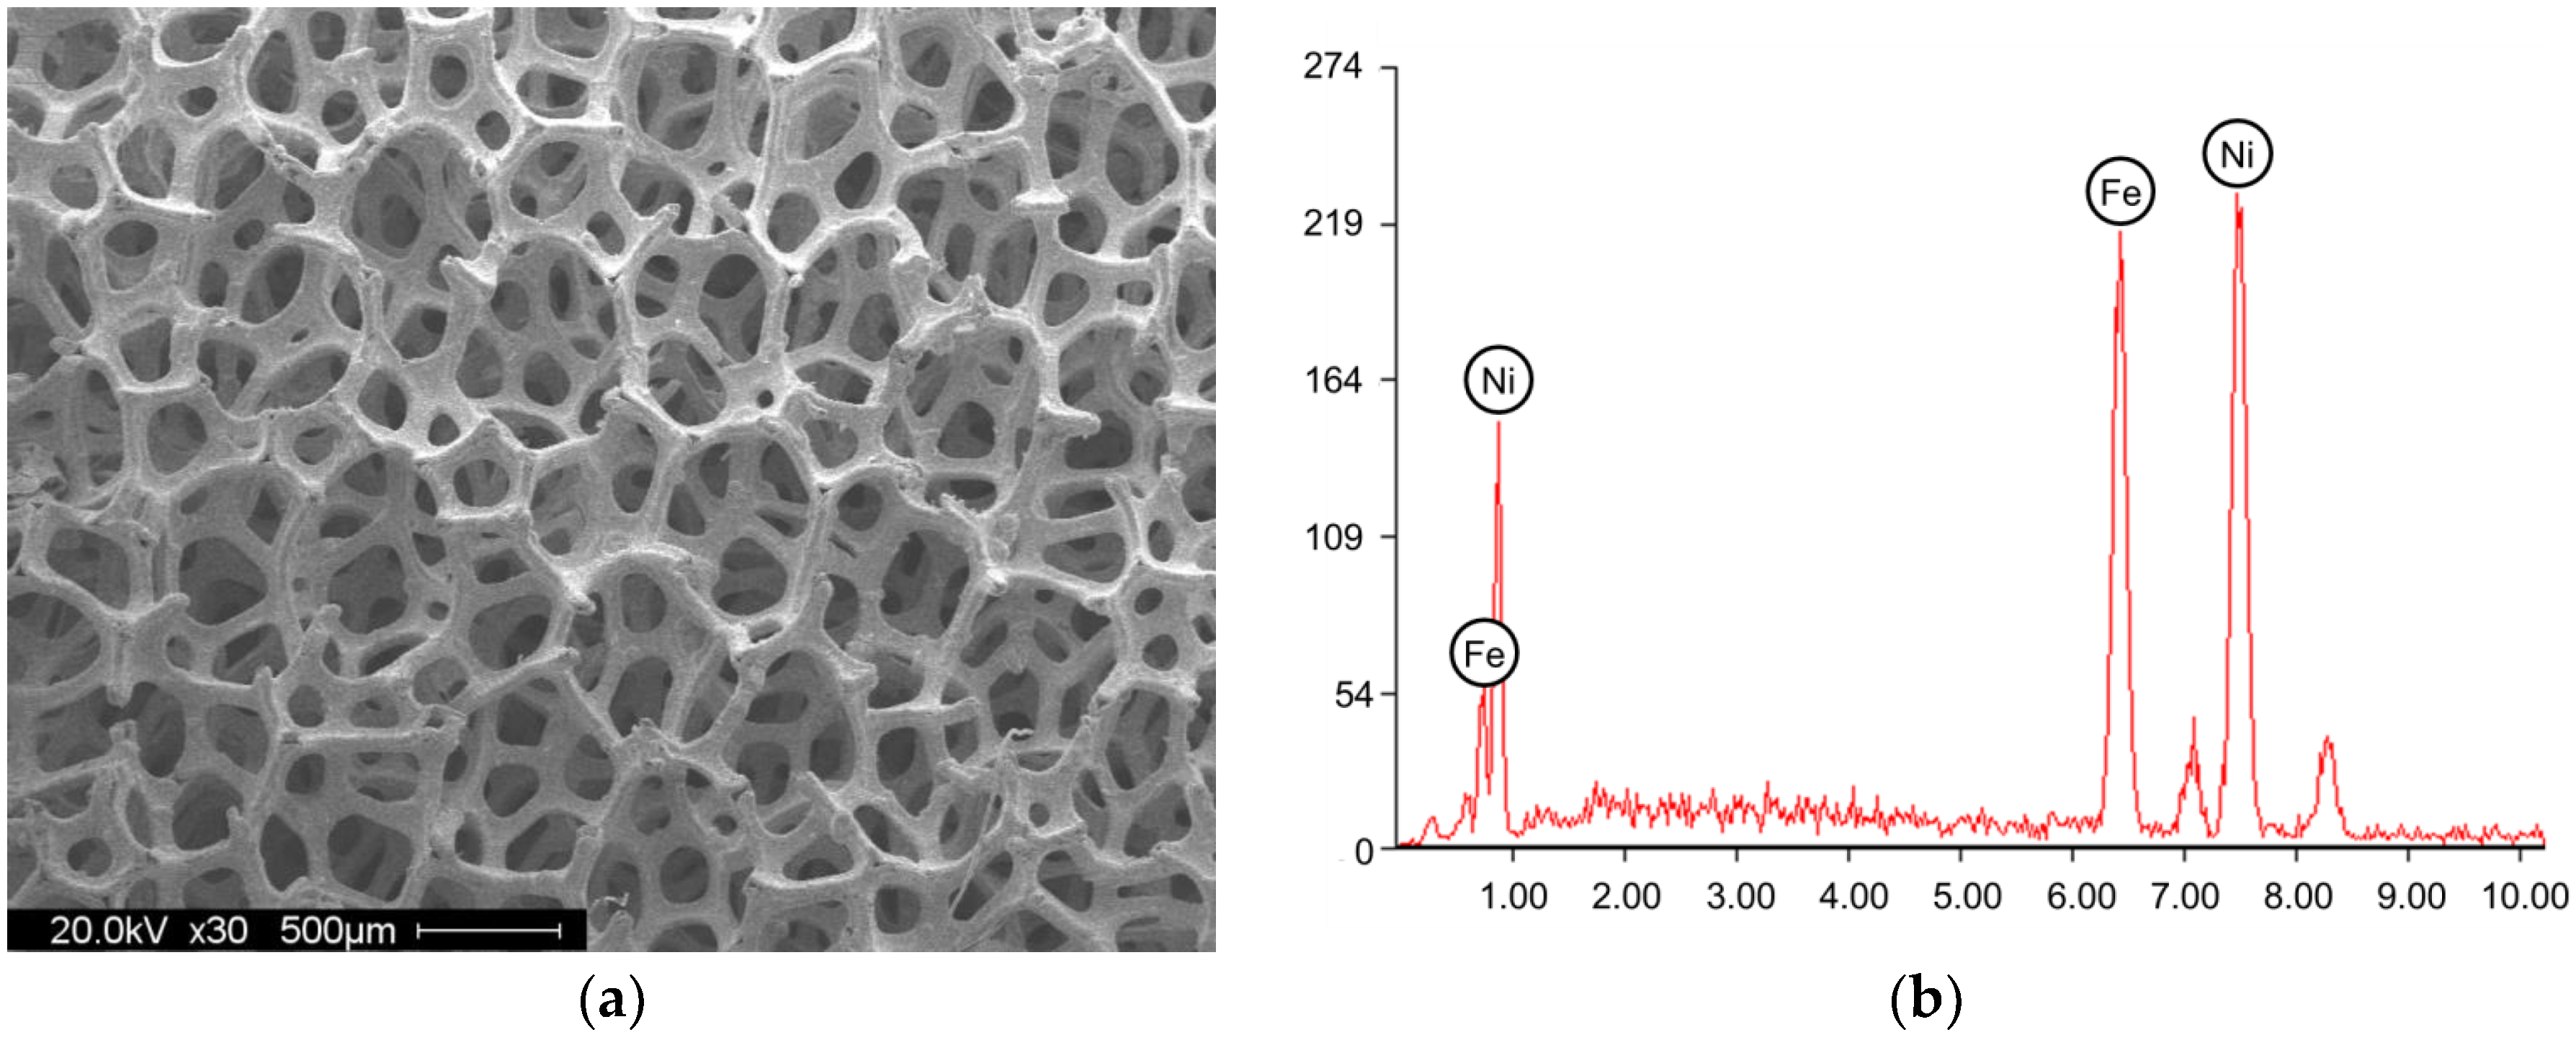
The porous Ni-Fe samples applied in this research were prepared with the electrodeposition method [17,18], and their initial thickness, porosity, pore-per-inch (PPI), and bulk density were 5 mm, 75%, 90, and 0.3 g/cm3, respectively. Detection of the chemical composition of the porous Ni-Fe sample was realized by scanning electron microscopy with energy dispersive X-ray spectroscopy (JSM-6360LV (JEOL Ltd., Tokyo, Japan) and Genesis2000XM60S (EDAX Inc., Mahwah, NJ, USA)), as shown in Figure 1. It could be calculated that the weight percent of the nickel and iron were 65.99 wt. % and 34.01 wt. %, respectively, and the corresponding atomic percentages were 64.86 at. % and 35.14 at. %, respectively.
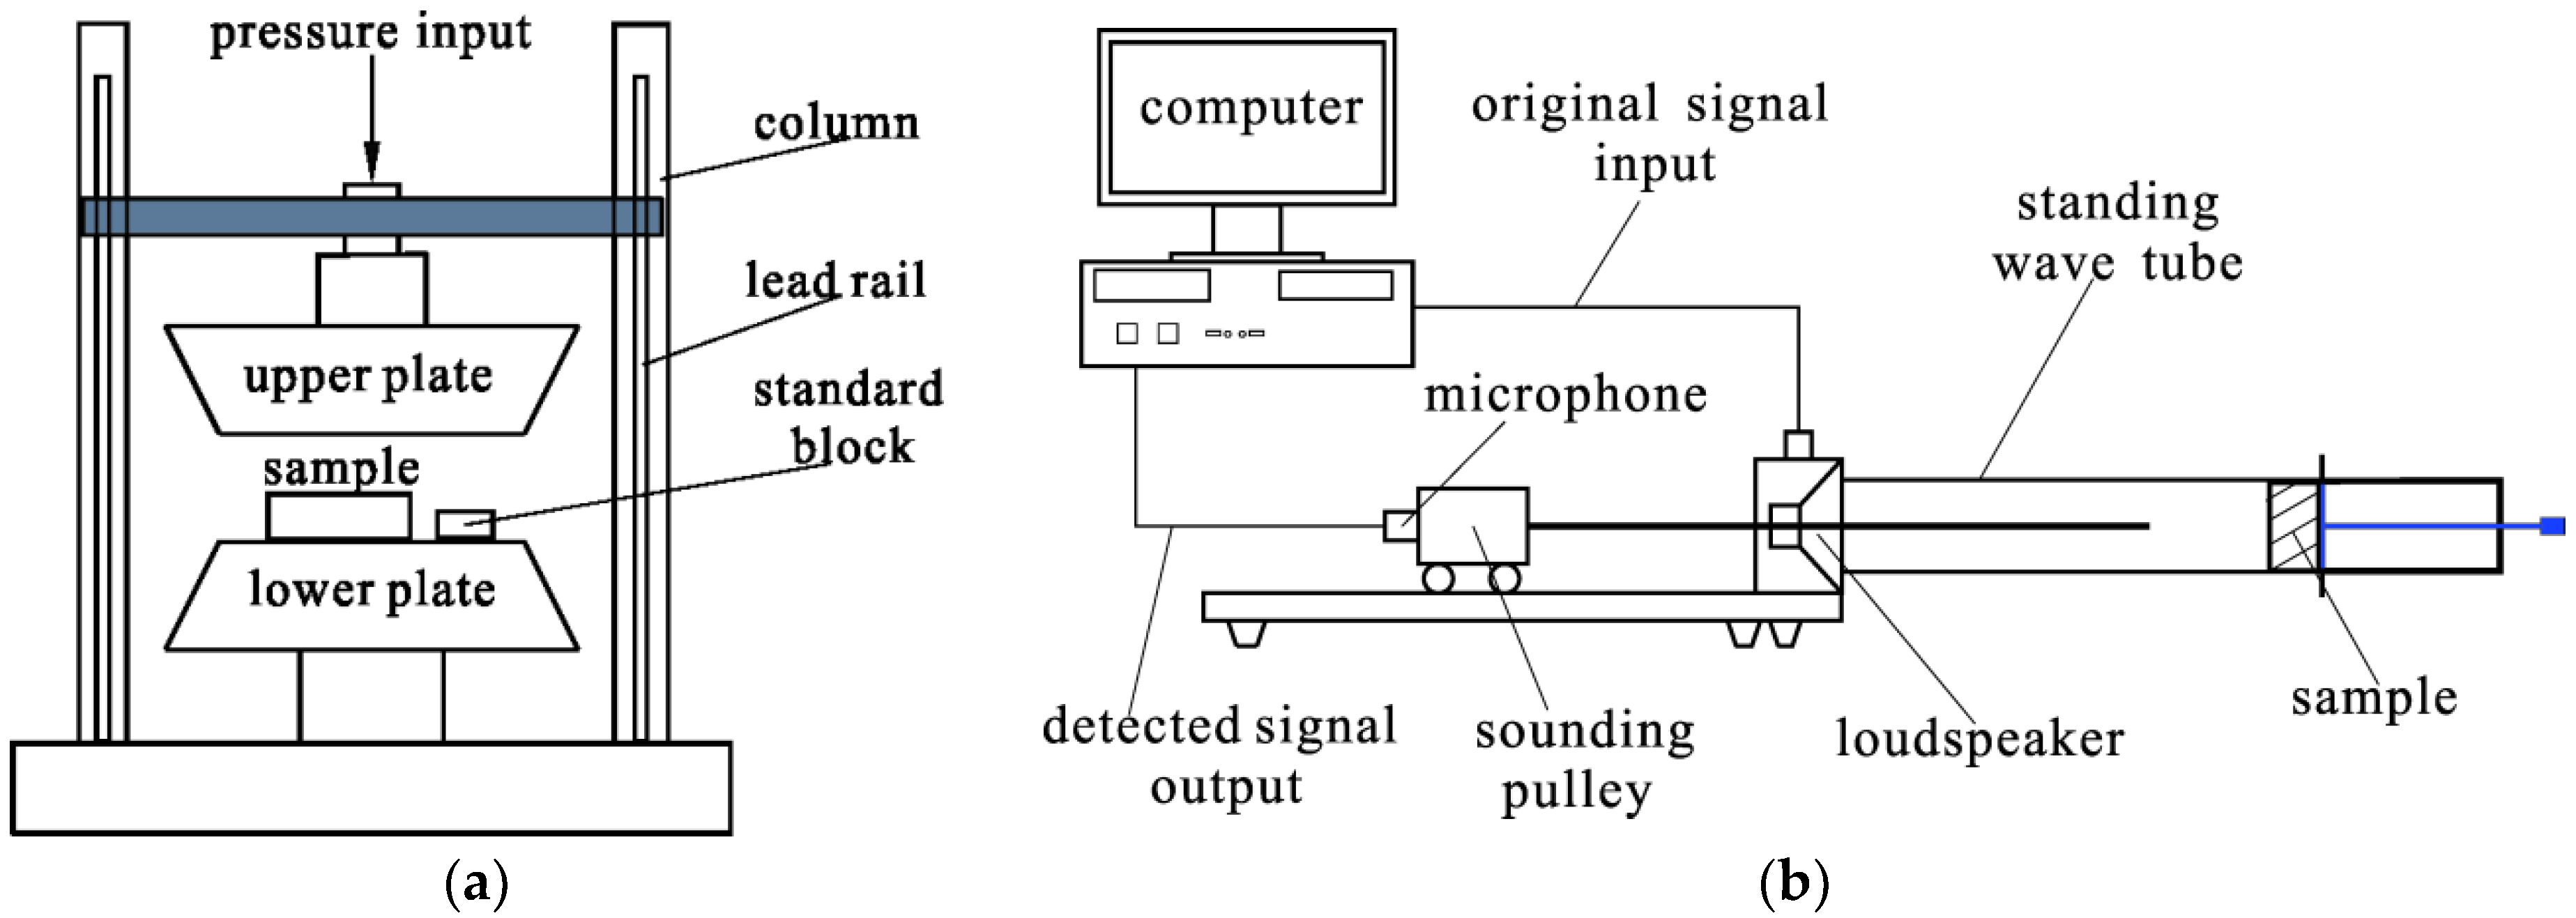
These samples were extruded with a CTM2050 universal testing machine (Wuxi City Bleecker Trading Co., Ltd., Wuxi, Jiangsu, China) with a pressure of 10 KN, as shown in Figure 2a. In order to overcome the influence of elastic deformation, the samples were extruded for 30 min [19,20]. Standard blocks with thicknesses from 1 mm to 4.5 mm at the interval of 0.5 mm were used to control the compression ratio. For example, when the compression ratio was set to 40%, the corresponding residual thickness of the Ni-Fe sample would be 3 mm (5 mm × (1–40/100)). Thus, standard blocks with a thickness of 3 mm were set around the sample to keep the distance at 3 mm between the upper plate and the lower plate. In this way, compressed porous Ni-Fe samples with compression ratios from 10% to 80% at an interval of 10% were obtained, and their corresponding residual thickness was from 4.5 mm to 1 mm at an interval of −0.5 mm.
2.2. Measurement of Sound Absorption Coefficients at Normal Incidence
Sound absorption coefficients of the Ni-Fe samples at normal incidence were measured by the AWA6128A detector (Hangzhou Aihua Instruments Co., Ltd., Hangzhou, Zhejiang, China) according to the GB/T18696.1-2004 (ISO10534-1:1996), and schematic diagram of the measurement system, as shown in Figure 2b. The original signal was introduced into the standing wave tube through the loudspeaker. The data with a detected signal were obtained by the microphone mounted on a sounding pulley that could move on the slide. By data processing and theoretical analysis, sound absorption coefficients of the samples could be achieved. According to the measurement principle of the AWA6128A detector, measurement of the sound absorption coefficients of the porous Ni-Fe required samples with two sizes, diameters of which were 96 mm and 30 mm, respectively [10]. The samples with a diameter of 96 mm were used in the measurements with the low frequency band from 90 Hz to 2075 Hz, and those with a diameter of 30 mm were used in the measurements with the high frequency band from 1500 Hz to 6640 Hz. In order to scientifically compare the sound absorption performance of the porous Ni-Fe samples with different parameters, the detected frequencies in the low frequency band were 100 Hz, 200 Hz, 300 Hz, 400 Hz, 500 Hz, 600 Hz, 700 Hz, 800 Hz, 950 Hz, 1100 Hz, 1300 Hz, 1500 Hz, and 1800 Hz, respectively, and those in the high frequency band were 2000 Hz, 2300 Hz, 2600 Hz, 2900 Hz, 3200 Hz, 3500 Hz, 3800 Hz, 4100 Hz, 4400 Hz, 4700 Hz, 5000 Hz, 5300 Hz, 5600 Hz, and 6000 Hz, respectively. Parameters in the measuring process were summarized and shown in Table 1. The detected thickness was realized by combining the single sample. For example, the detected thickness of 12 mm consisted of three pieces of the 4 mm compressed samples in the experimental serial 1003. The influence of gaps in different combinations of single samples was investigated and evaluated, and the results indicated that the influence of gaps in the combination process was inconspicuous [10].
2.3. Investigation of the Section Morphologies
In order to further investigate the influence of compression ratios on the sound absorption performance of the compressed porous Ni-Fe alloy, section morphologies of the compressed Ni-Fe samples with different compression ratios were investigated by the SEM (SU8010, Hitachi, Tokyo, Japan). Cross sections of the samples were obtained with the laser cutting system [21], which could cut the Ni-Fe samples efficiently without generations of deformation, damage, or residual stress.
3. Results and Discussions
3.1. Evolutions of Sound Absorption Coefficients with Same Compression Ratio
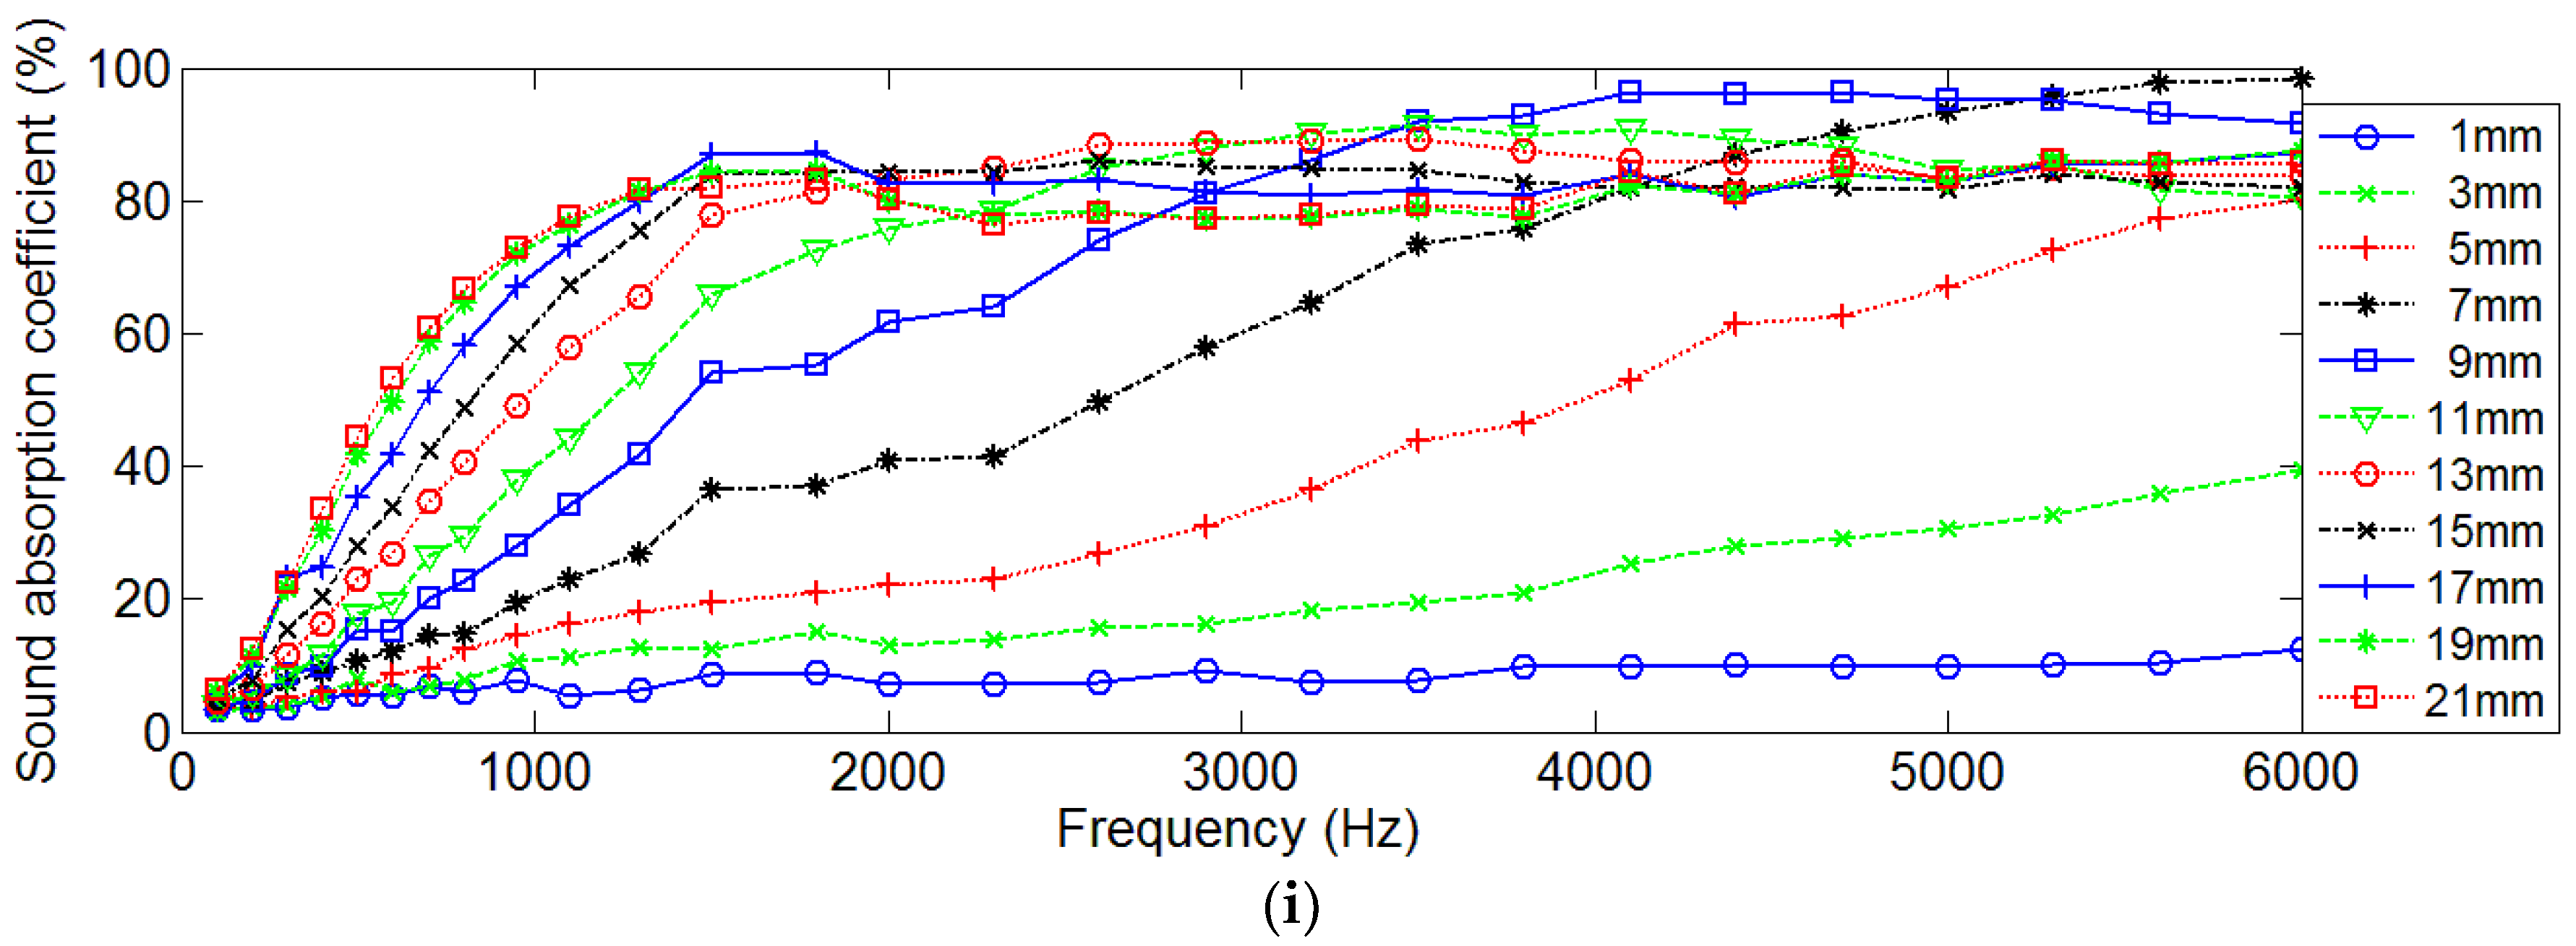
The obtained data of the sound absorption coefficients of the samples were shown in Figure 3, and Figure 3a–i corresponded to the experimental series from 1001 to 1009 in Table 1. It could be found that for a constant compression ratio, the sound absorption coefficient was improved along with increasing the thickness of the sample, which was consistent with the normal sound absorption performance of the common porous metal [10,22,23]. However, improvement of the sound absorption coefficient by increasing thickness of the sample was finite, which was especially obvious in high band frequencies, as shown in Figure 3c–i. Taking the samples with a compression ratio of 50%, for example, sound absorption coefficients of the samples with thicknesses from 2.5 mm to 22.5 mm at the interval of 2.5 mm were shown in Figure 3f. When thickness of the sample increased from 2.5 mm to 10 mm, sound absorption coefficients in full spectrum became increasingly larger. Further increasing thicknesses of the samples from 12.5 mm to 22.5 mm, absorption coefficients still increased in the low frequency band, but there existed a downwardness from the turning point in the high frequency band. The sound absorbing effect of porous copper was realized by the sticky effect and heat conduction. When the sound wave diffused in the porous material, there existed velocity gradations among the different particles, which resulted in the relative motion between vibrant air and material. The sticky effect of the air could generate friction force and viscous resistance, which blocked the motion of the particles. The friction and viscous effect could transform the partial sound energy into heat energy, and the heat energy was consumed in the conduction process. Thus, increase of the detected thickness would be propitious to promote sound absorption coefficients of the porous media normally, because the sound absorbing volume was correspondingly improved, which was consistent with the results in Figure 3. That was the major reason for improvement of the sound absorption coefficient along with increasing thickness of the porous Ni-Fe sample with the same compression ratio. However, this improvement was not applicable to the full spectrum, especially in the high frequency band, as shown in the results in Figure 3, because the sound wave with a higher frequency indicated a larger straightness, and its absorption was majorly realized in the primary layers of the porous media.
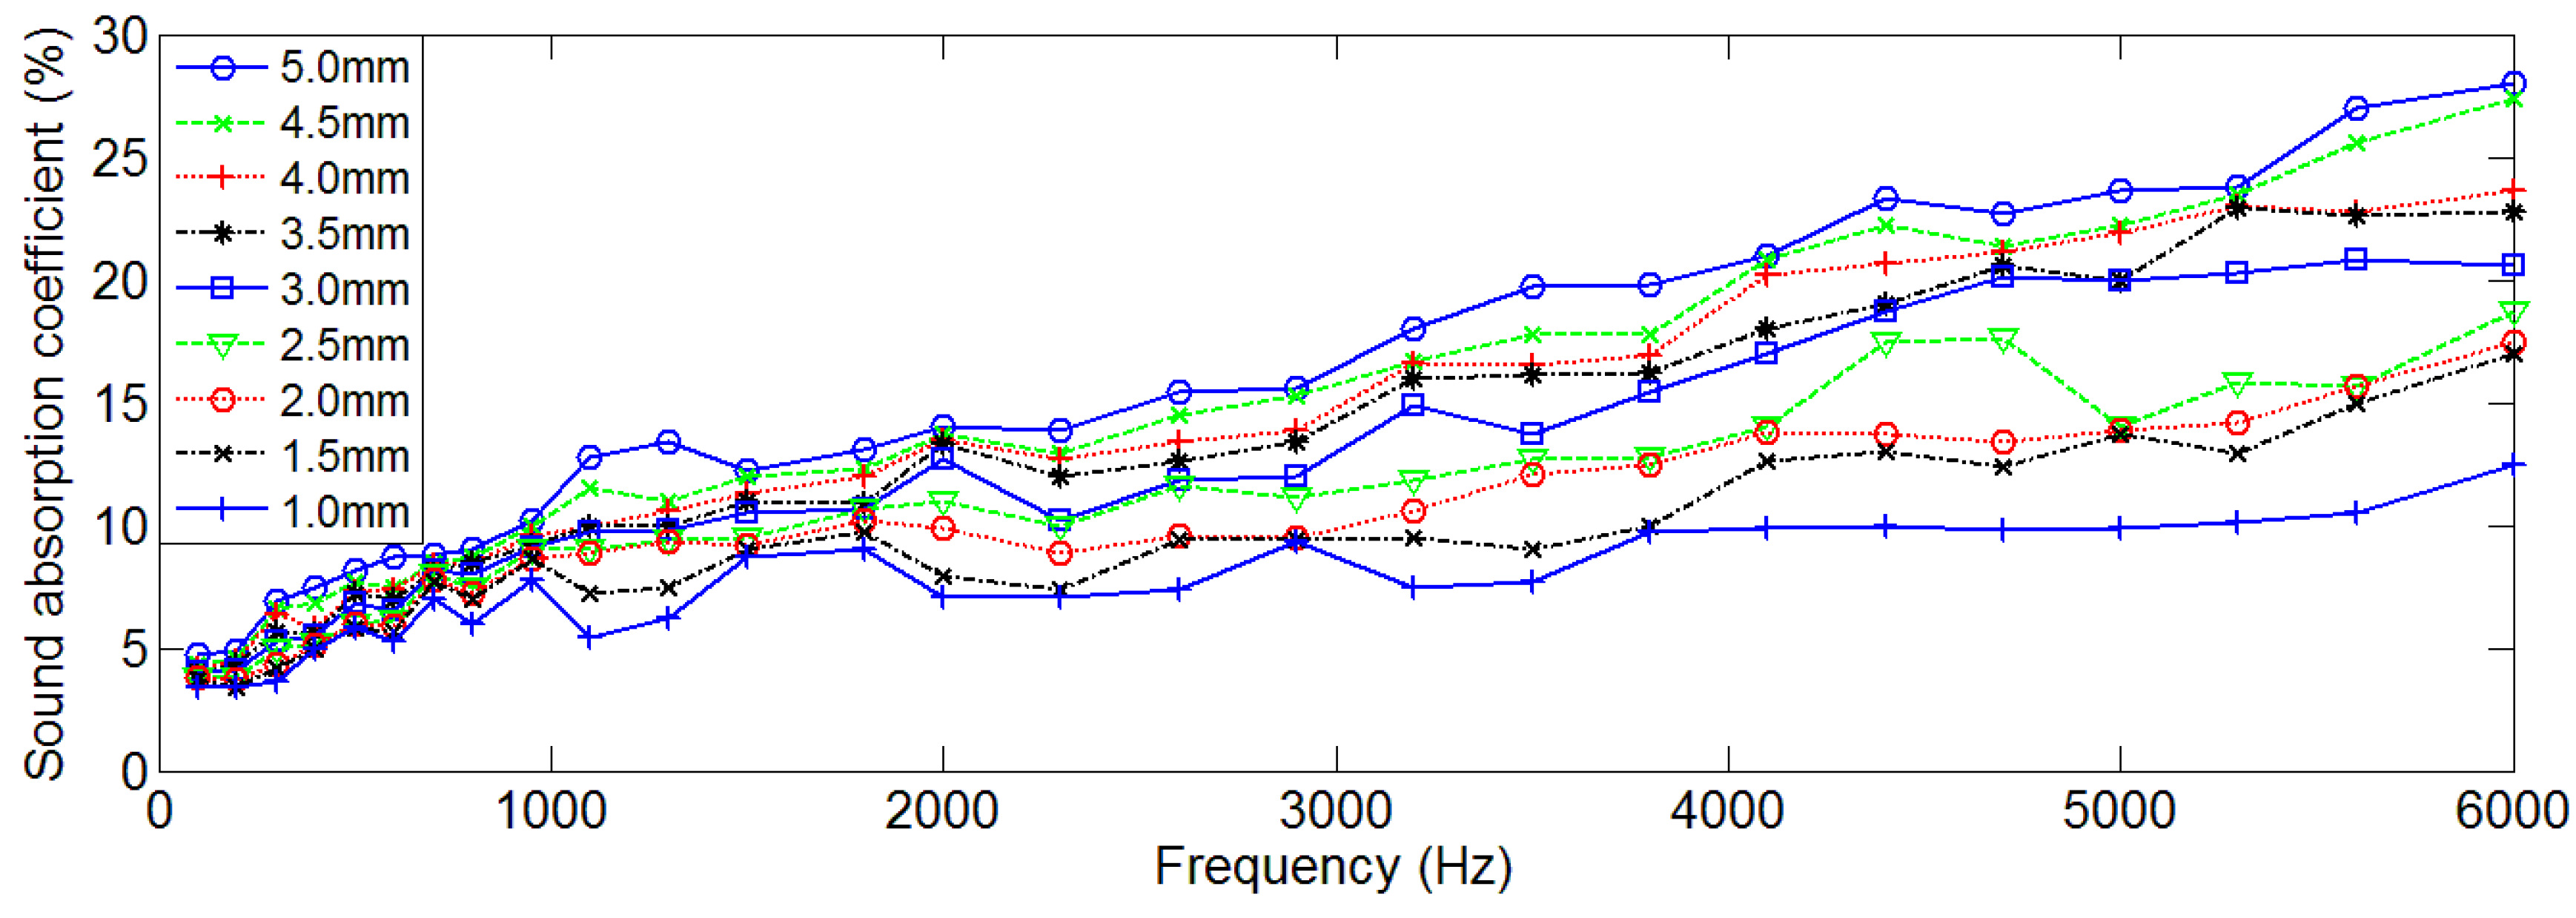
Meanwhile, along with the increase of the compression ratio, thickness of the single sample decreased from 5 mm to 1 mm, and the corresponding sound absorption performance deteriorated, which could be judged from the data in Figure 4. However, sound absorption efficiency was normally improved by compression when thickness was equal. For example, when thickness of the detected sample was limited to 15 mm, there existed five types: 3 × 5 mm (compression ratio 0%), 5 × 3 mm (compression ratio 40%), 6 × 2.5 mm (compression ratio 50%), 10 × 1.5 mm (compression ratio 70%), and 15 × 1 mm (compression ratio 80%), and their sound absorption performances were summarized in Figure 5. It could be found that influences of compression ratios on sound absorption coefficients were uncertain, which indicated that there existed a best compression ratio for optimal sound absorption performance.
3.2. Influences of Compression Ratios with Same Thickness
Quantitative analysis of the influence of the compression ratio on sound absorption performance was conducted by comparing sound absorption coefficients of the compressed samples with the same thickness of 20 mm, which was the limit of the sound absorber for certain engine equipment. In order to improve prediction accuracy and optimization efficiency, taking samples with a compression ratio of 50%, for example, the relationship between sound absorption coefficient and thickness could be obtained by the Johnson-Allard model [10,14,15,16], as shown in Equation (1), and parameters in Equation (1) could be obtained by the equations in Equation (2). Here, is the characteristic impedance of the compressed porous Ni-Fe sample; is the number of the wave in the compressed porous Ni-Fe sample; is the thickness of the compressed porous Ni-Fe sample; is the porosity of the compressed porous Ni-Fe sample; is the characteristic impedance of the air, ; is the effective density; is the effective bulk modulus; is the angular frequency; is the frequency of the acoustic wave; is the density of the air, ; is sound speed in air, ; is the static flow resistivity of the compressed porous Ni-Fe, ; is the specific heat ratio of the air, 1.40; is the static pressure of the air, ; is the Nusselt number, 4.36; and is the Prandtl number, 0.71 [10,14,15,16]. By putting these parameters into Equations (1) and (2), a numerical relationship could be obtained, as shown in the Equations (3) and (4).
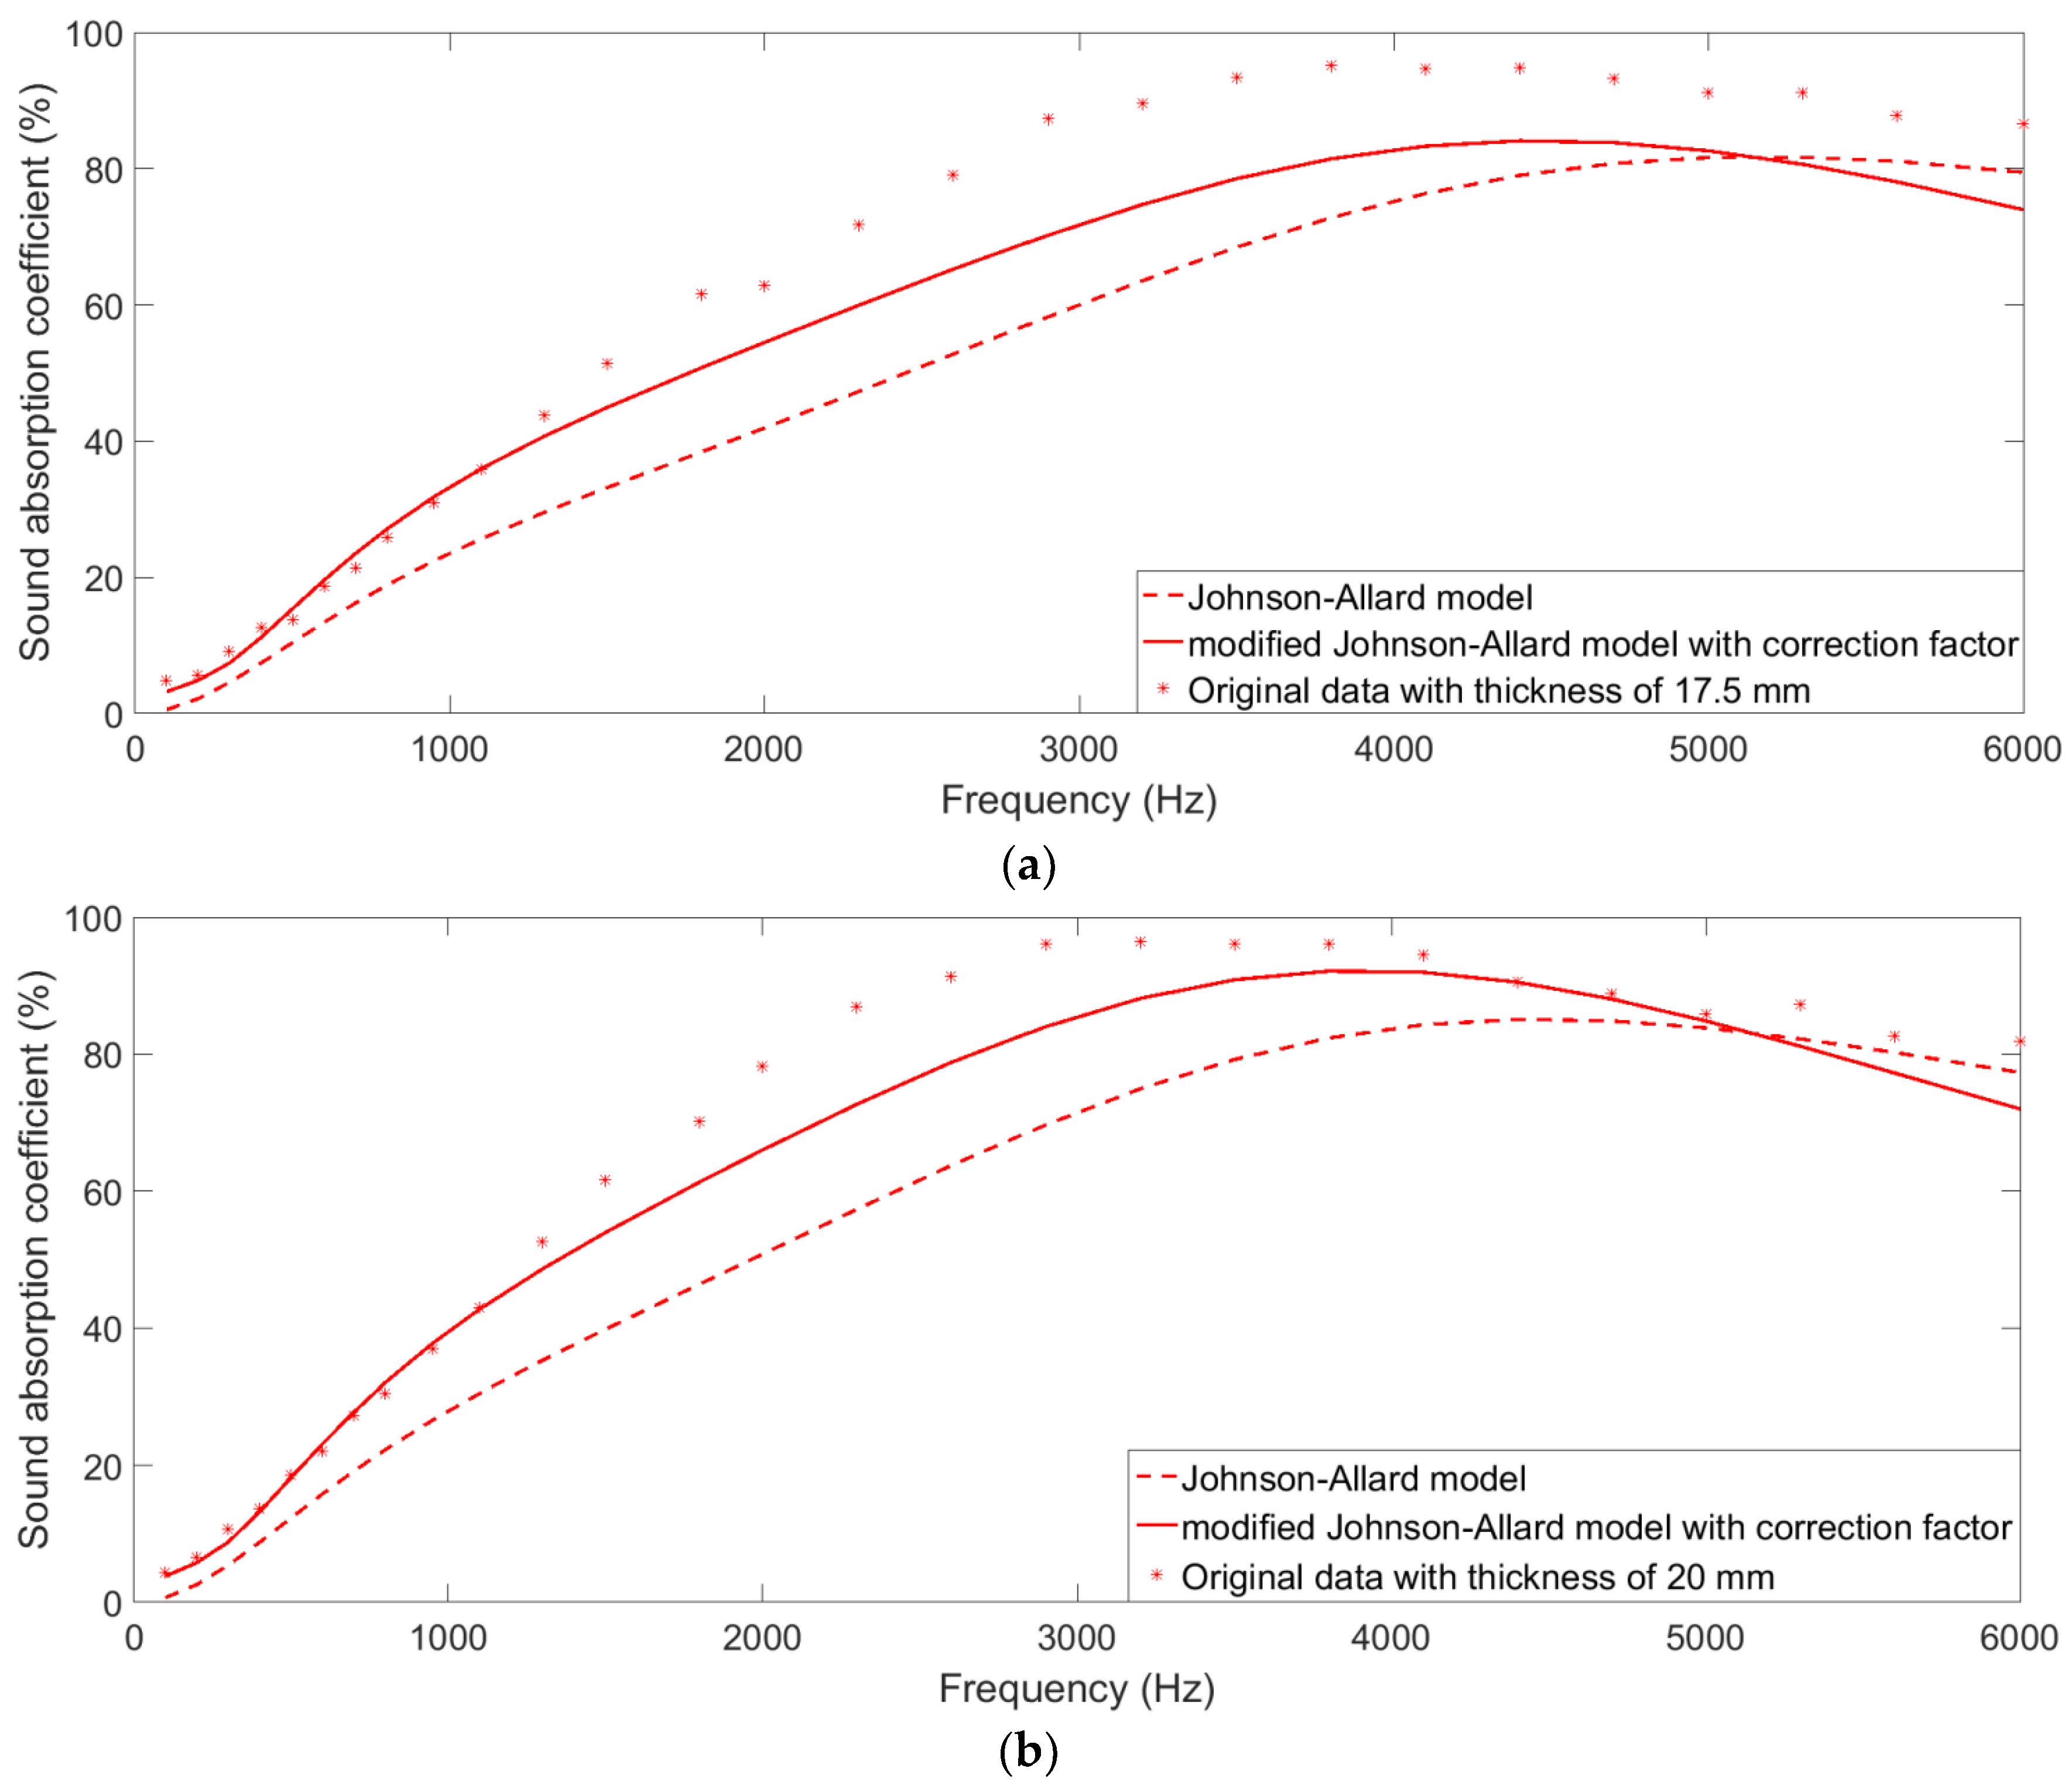
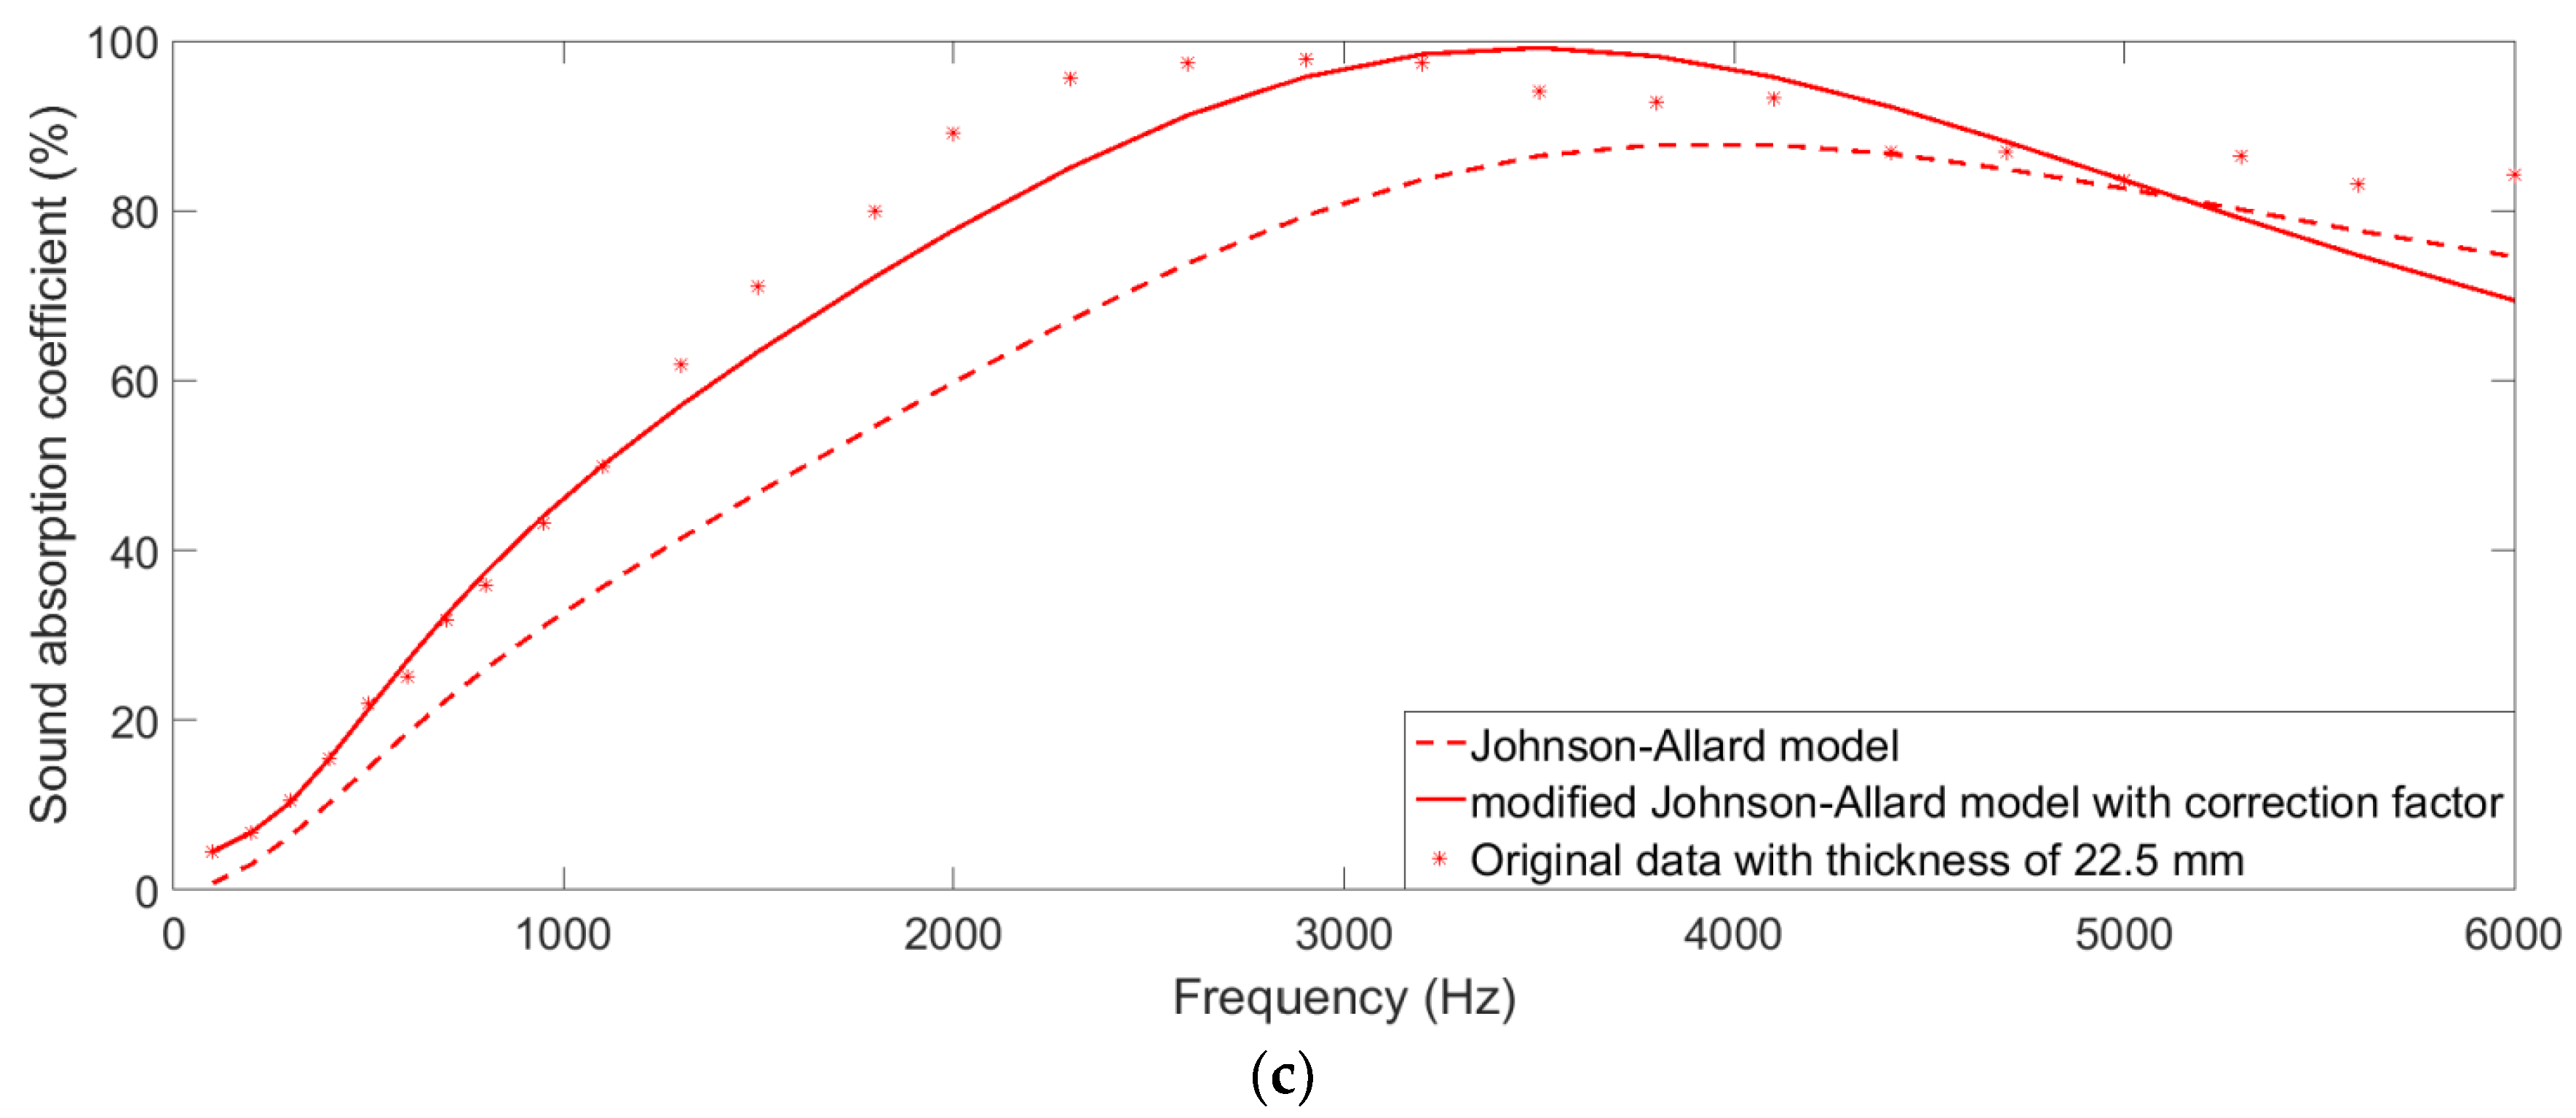
However, compression was not taken into consideration in the Johnson-Allard model, which indicated that the prediction and analysis of sound absorption coefficients of the compressed porous Ni-Fe sample had large deviations, as shown in Figure 6. The investigated thicknesses of the compressed porous Ni-Fe sample with compression ratio 50% were 17.5 mm, 20 mm, and 22.5 mm. A correction factor was introduced to the Johnson-Allard model to represent influence of the compression, as shown in Equation (5), which was a two-terms exponential correction factor [10]. Parameters , , , and were calculated by data fitting according to the Levenberg–Marquardt algorithm [10], and the correction factor in the modified Johnson-Allard model was shown in Equation (6). Therefore, the new predicted sound absorption coefficient could be obtained by Equation (7).
Comparisons of the experimental data, the predicted result obtained by the Johnson-Allard model, and that obtained by the modified Johnson-Allard model with a correction factor were shown in Figure 6. It could be observed that the prediction accuracy of sound absorption coefficients was improved significantly by introducing the correction factor. The total departure of the regressive average value was used to quantitatively evaluate prediction accuracy of the model, and it could be obtained by Equation (8). Here, is the actual sound absorption coefficient obtained by the experiment; is the predicted absorption coefficient achieved by the model; is the numbers of the detected frequency points, 27, which includes 14 points in the low band and 13 points in the high band.
The summarized values were shown in Table 2. A larger indicated higher reliability of the model. It could be found that the calculated for the Johnson-Allard model ranged from 0.9424 to 0.9610, and that for the modified Johnson-Allard model with a correction factor ranged from 0.9809 to 0.9937. The average of the calculated was improved from 0.9521 to 0.9887 by introducing the correction factor. Thus, it could be concluded that reliability and creditability of the Johnson-Allard model was improved by introducing the correction factor.
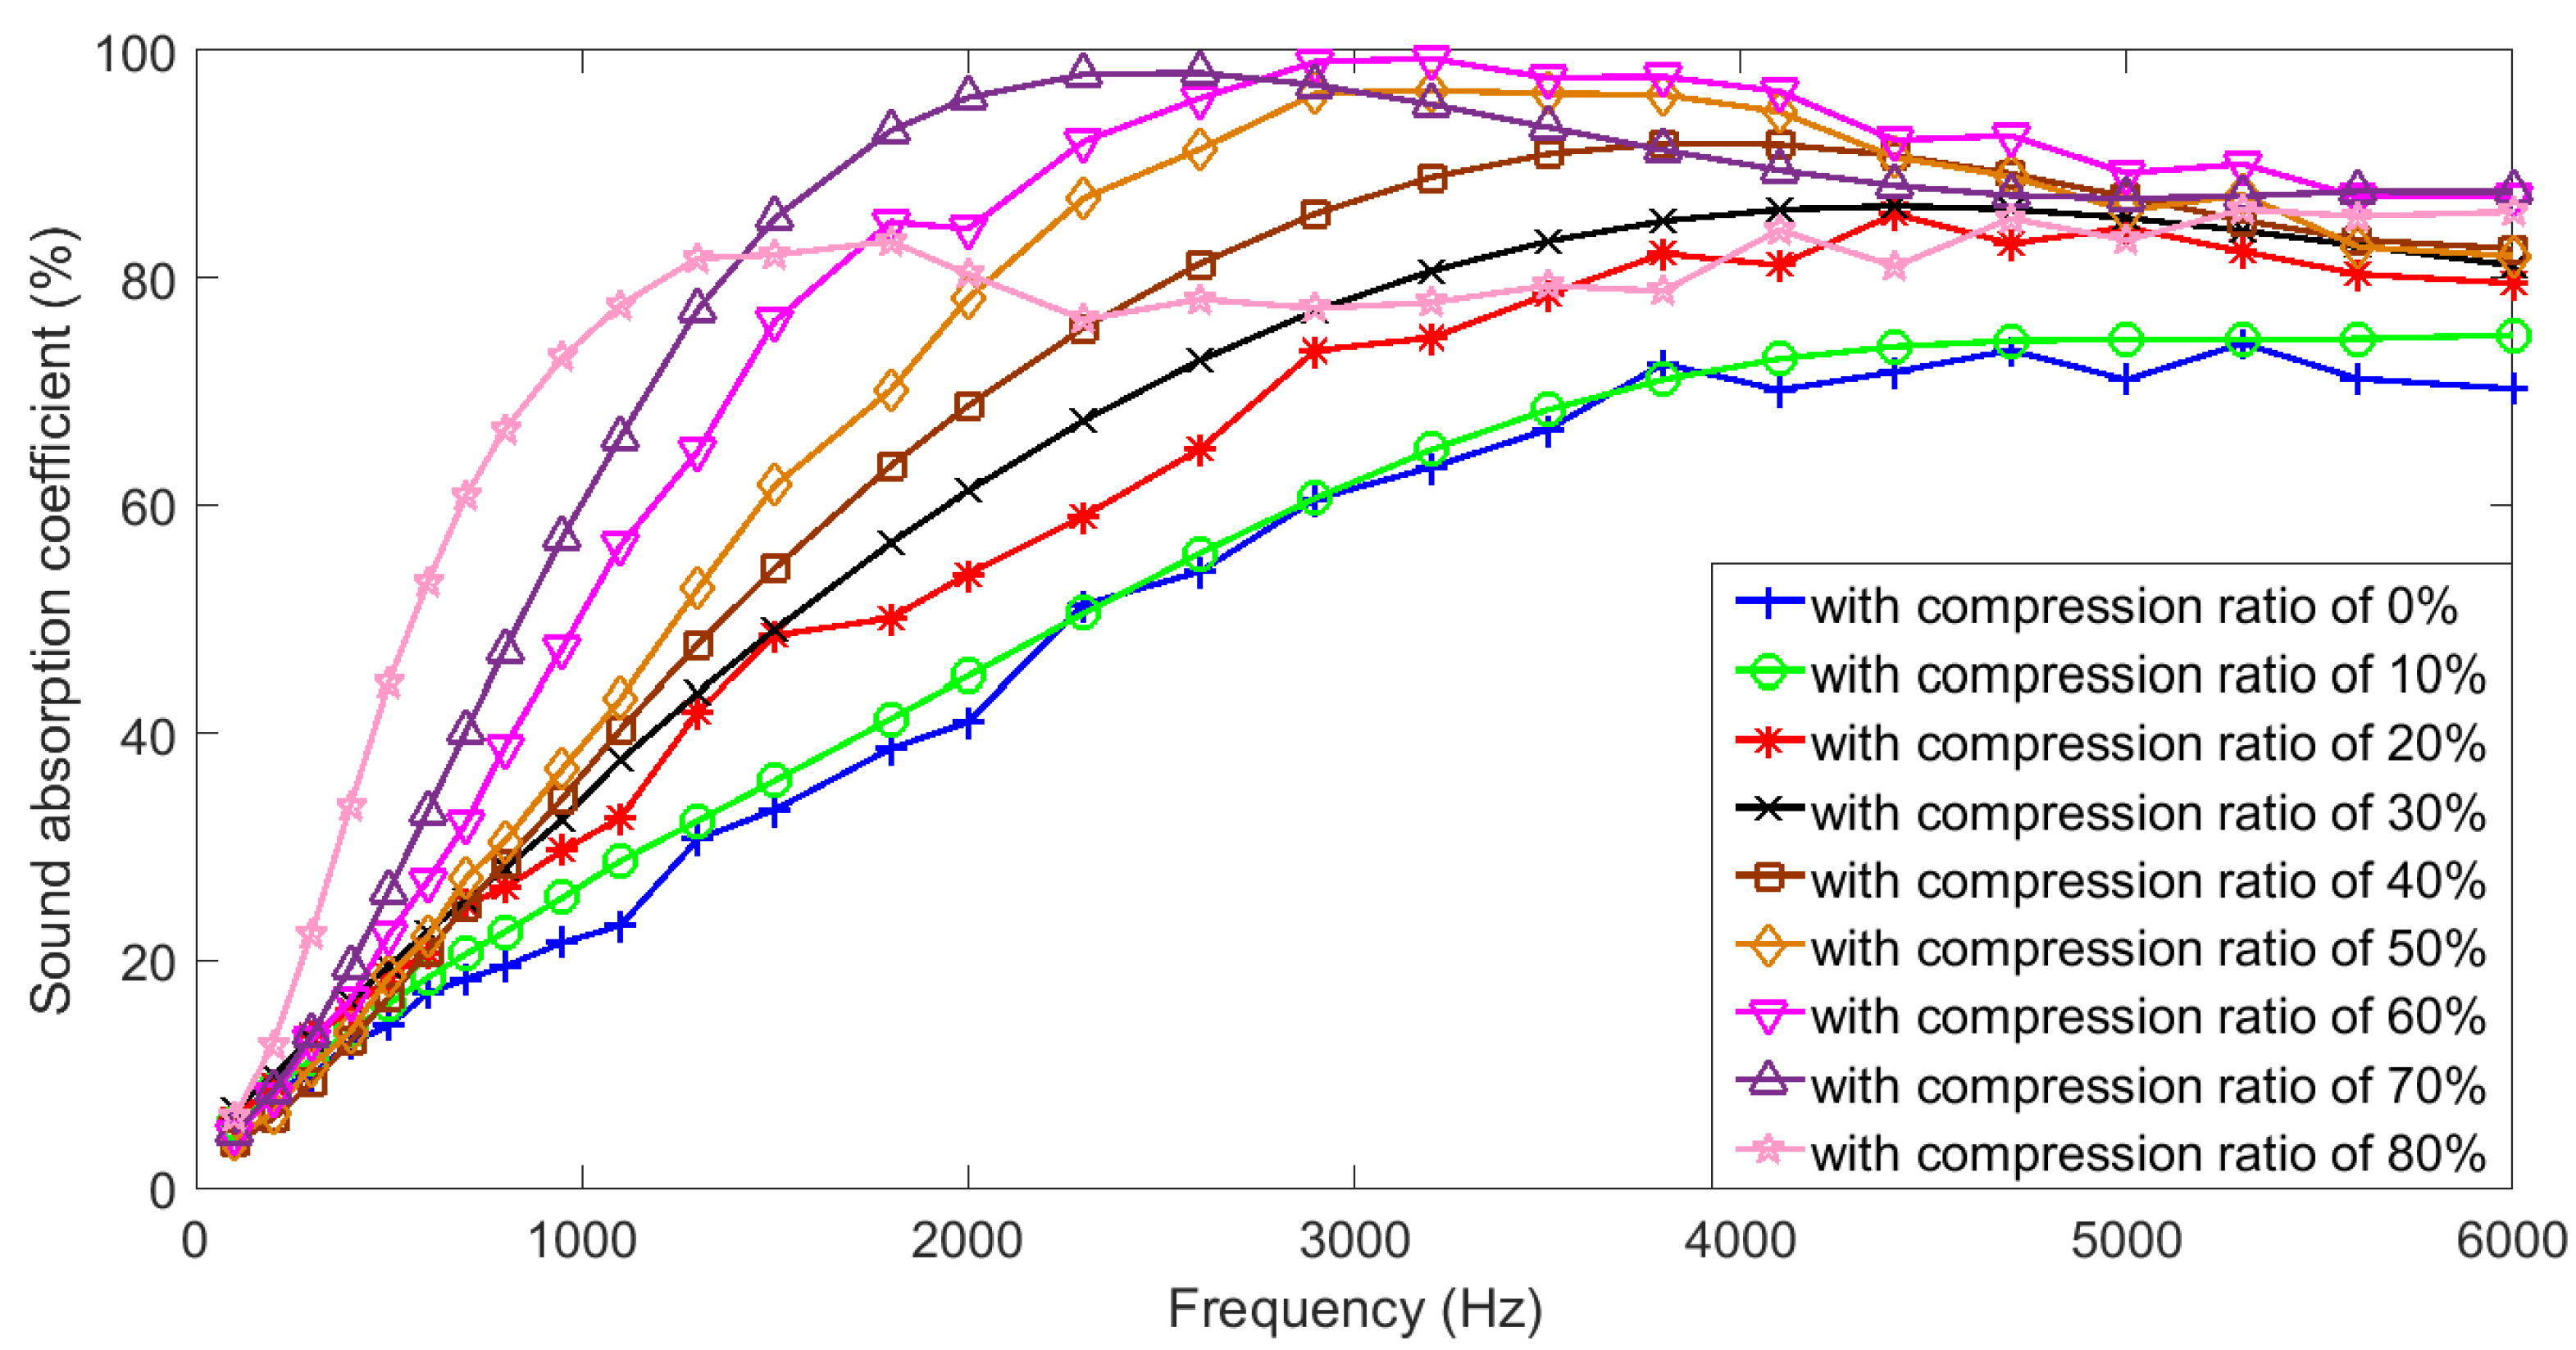
In this way, the other eight modified Johnson-Allard models with correction factors for the conditions with different compression ratios were derived, and sound absorption coefficients of the compressed samples with same thickness of 20 mm were predicted when the compression ratio was 10%, 30%, 40%, 70%, and 80%. Combined with the experimental data when the compression ratio of the sample was 0%, 20%, 50%, and 60%, comparisons of sound absorption coefficients of Ni-Fe samples with different compression ratios when the thickness was 20 mm were obtained, as shown in Figure 7. It could be observed that sound absorption performance was improved in full spectrum along with an increase of the compression ratio from 0% to 40%. When the compression ratio was further increased from 40% to 80%, there existed a reduction of sound absorption in some frequencies. When the compression was raised from 60% to 80%, there were especially many intersections among the three conditions.
In order to quantificationally compare sound absorption performance, mean value, and variance of sound absorption coefficients in the frequency range of 1000 Hz to 6000 Hz, the Ni-Fe samples with different compression ratios were calculated by Equations (9) and (10), and the results were shown in Table 3. The mean value rose along with an increase in the compression ratio from 0% to 70%, and there was a slight reduction when the compression ratio was 80%. Meanwhile, the trend of the variance went down along with an increase of the compression ratio, especially when the compression ratio was larger than 50%. Furthermore, it could be observed that the variance was down to 11.87 when the compression ratio was 80%, which indicated that sound absorption coefficients kept steady along with an increase of the frequency when the compression ratio was high. Therefore, it could be observed that the Ni-Fe sample with a compression ratio of 70% exhibited the optimal sound absorption performance, because it had the largest mean value of 88.97% and its variance was relatively low.
3.3. Section Morphologies of the Compressed Sample
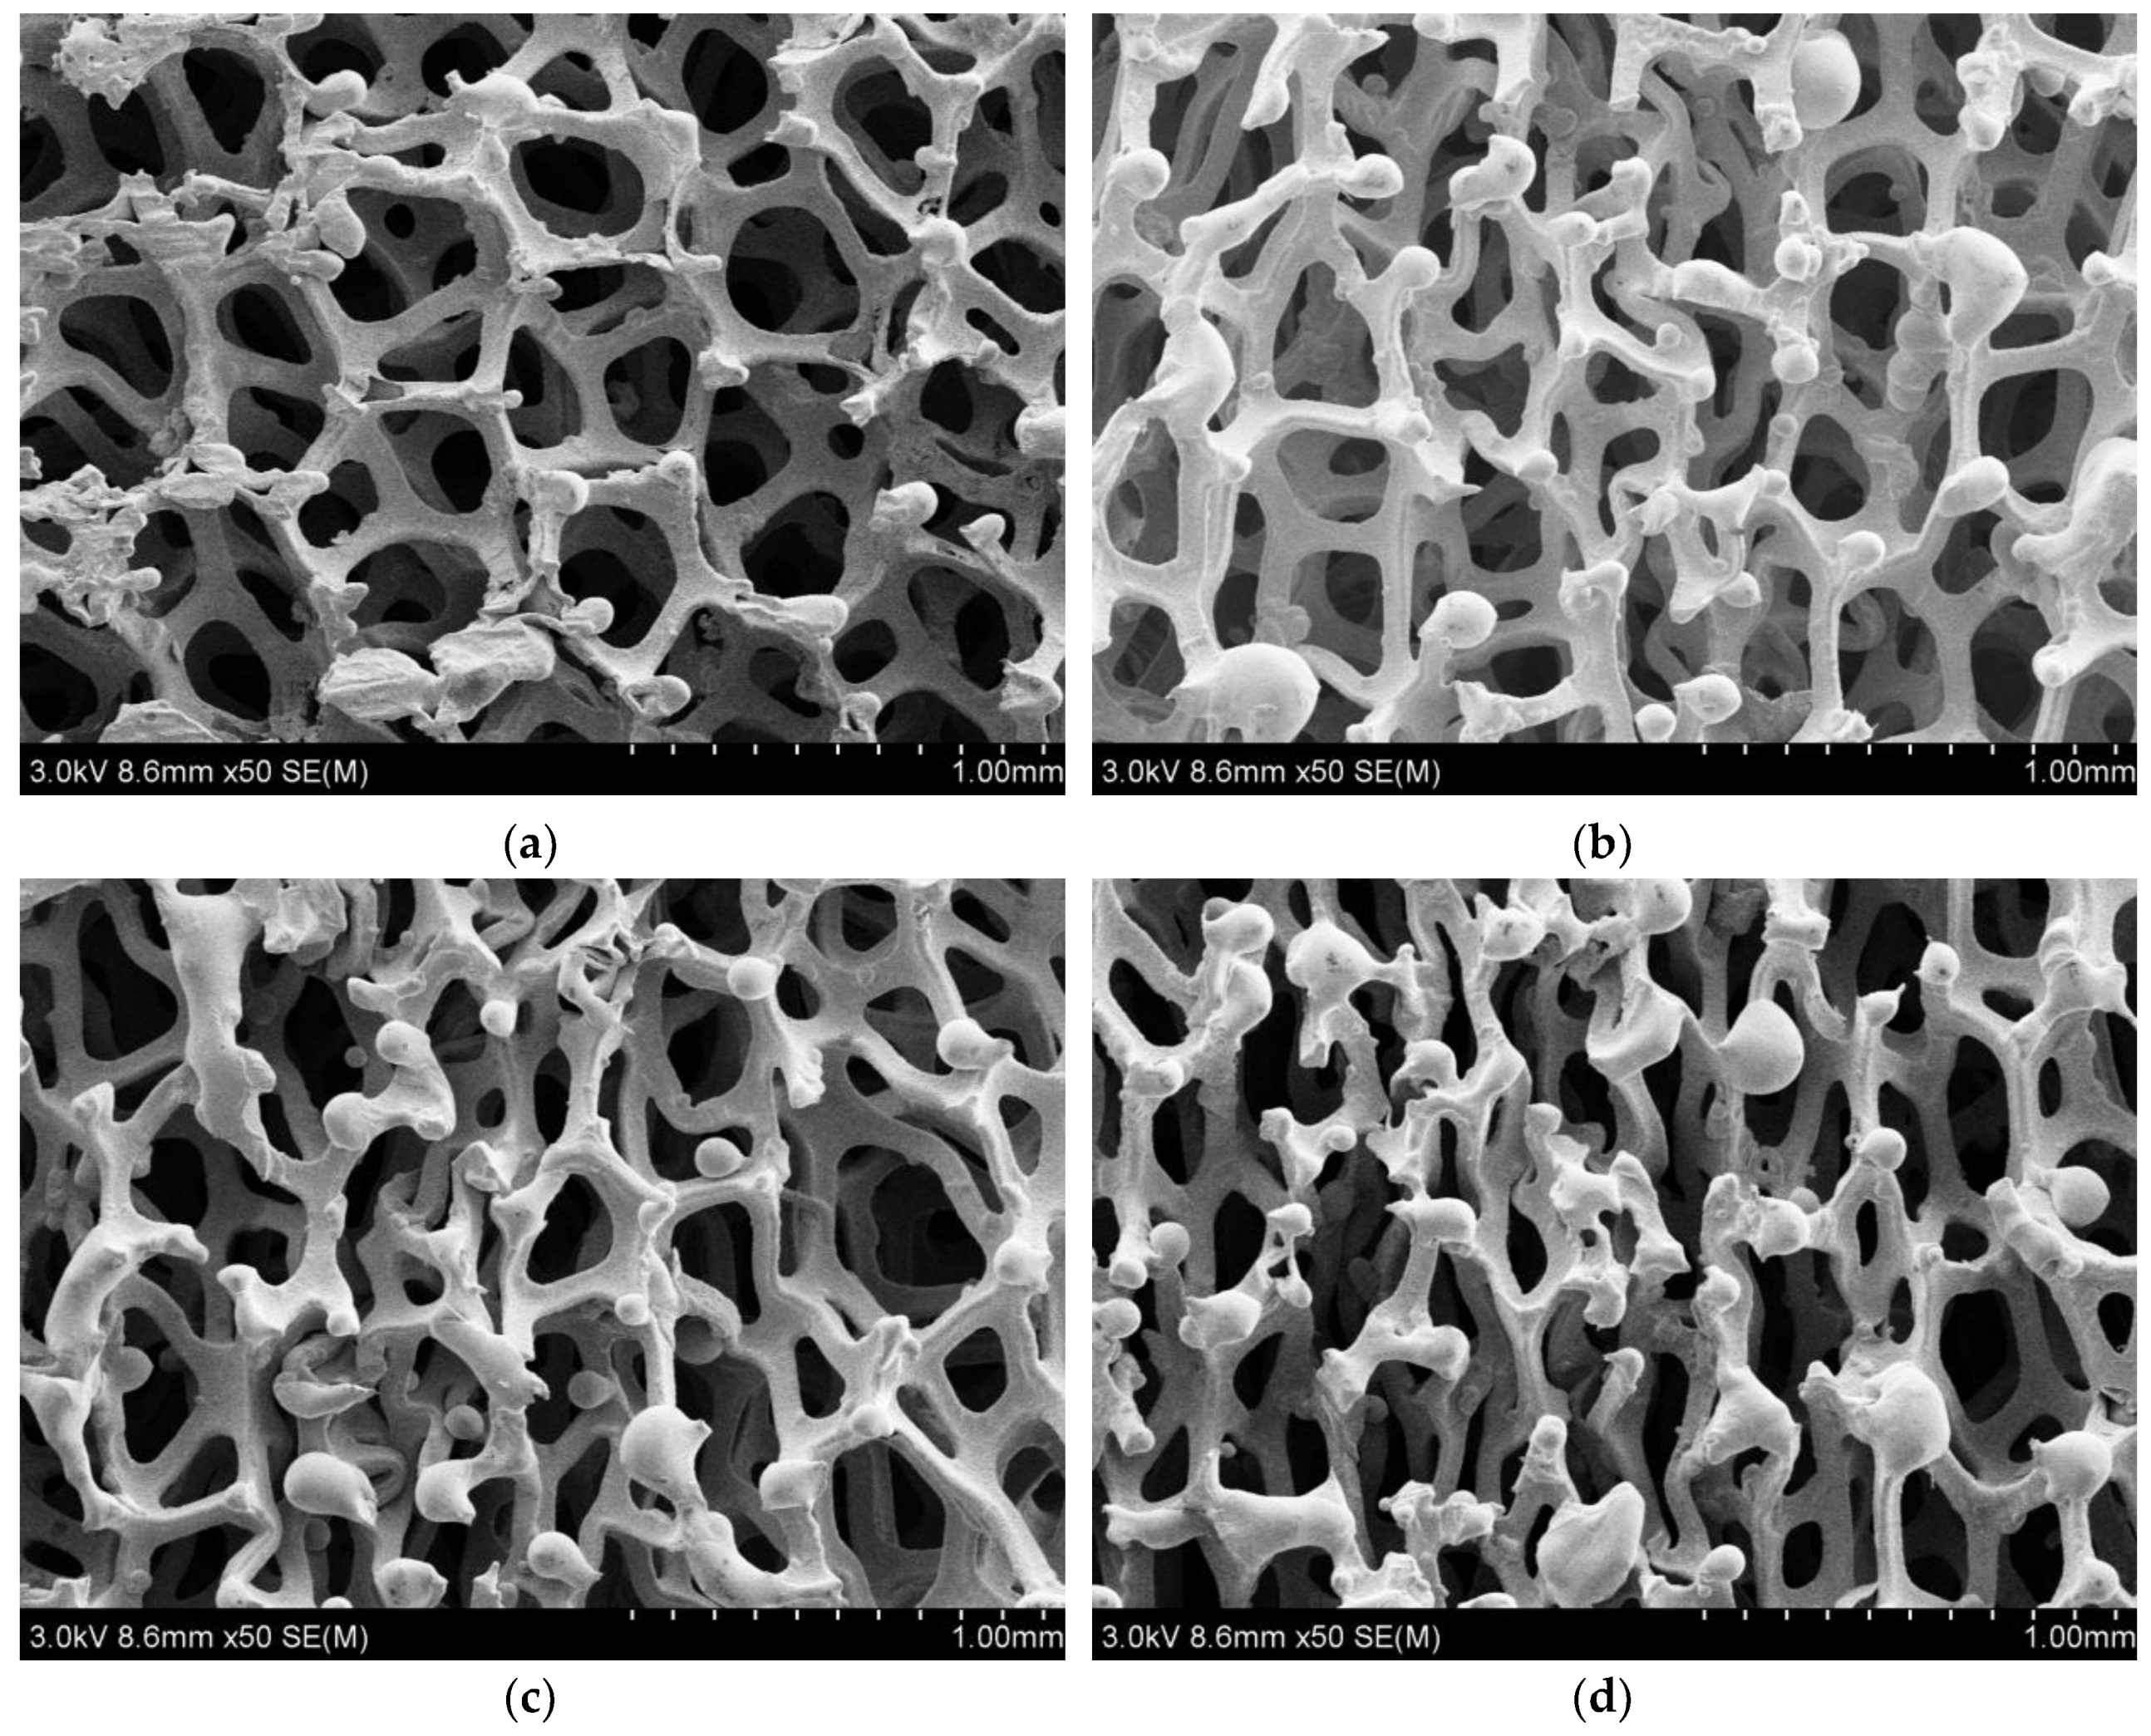
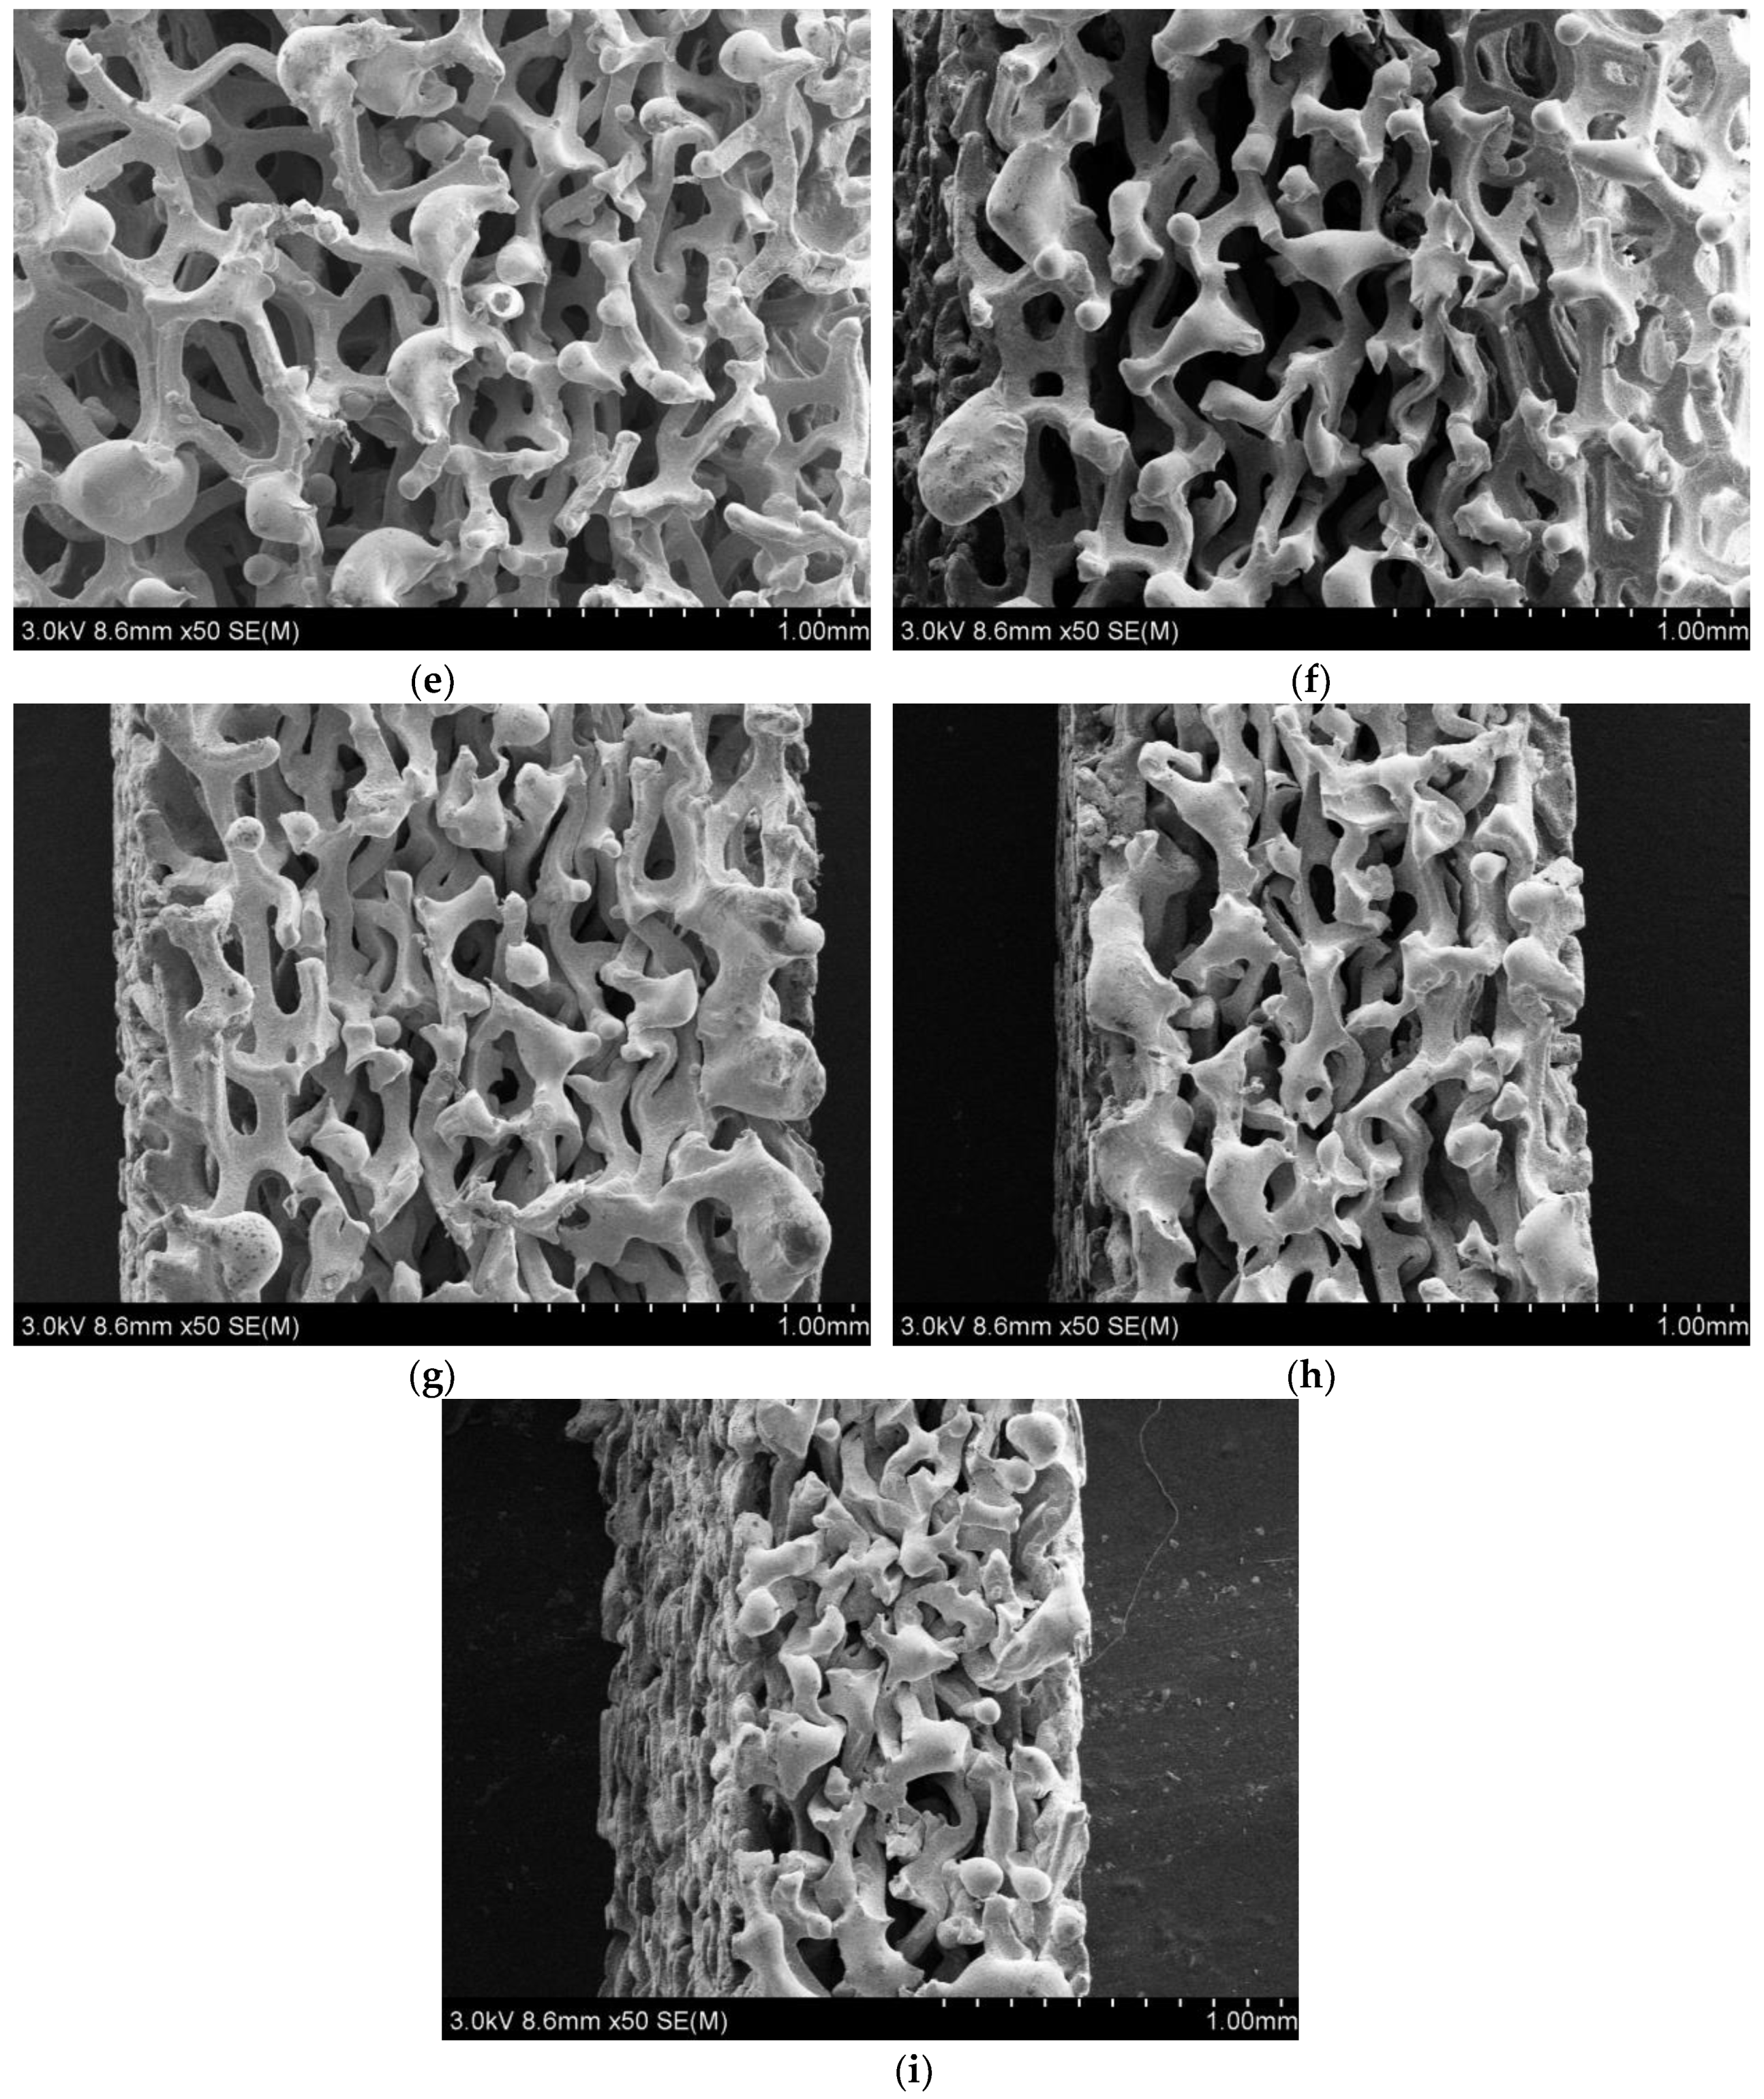
For the purpose of qualitatively explaining the influence of compression ratios on the sound absorption performance of the porous Ni-Fe alloy, section morphologies of the compressed samples were further investigated by SEM with the magnification of 50, and the results were shown in Figure 8. Due to the melting of the Ni-Fe alloy during the laser cutting, there were some spherical solidified particles on the cross section, which were not the characters of the compressed porous Ni-Fe sample. It can be observed that there were standard pore structures in the section of the original porous Ni-Fe sample in Figure 8a, and the average diameter of the pore was 300 μm–600 μm. Along with an increase of the compression ratio from 10% to 80%, it could be observed that deformation of the pore was gradually aggravated. When the compression ratio was smaller than 40%, as shown in Figure 8b–e, porous structures would still be observed, and the frameworks were increasingly compact. The compacted porous structures were propitious to achieve better sound absorption performance, which was consistent with the phenomenon that sound absorption performances were improved in full spectrum along with an increase of the compression ratio from 0% to 40%. Meanwhile, when the compression ratio of the sample reached 50%, porous structures of the Ni-Fe alloy were a little destroyed, and some of the frameworks were broken, as shown in Figure 8f. However, there existed gaps in the sample, which indicated that absorption of the sound based on the classical Biot theory still worked effectively. Meanwhile, the broken tiny frameworks could also absorb sound by vibration, especially at some resonance frequencies of the framework structures, which could increase the corresponding sound absorption coefficients at these frequency points. Further, an increase of the compression ratio from 60% to 80% resulted in the serious collapsing of the porous structure, as shown in Figure 8g–i. Spaces in the porous samples were seriously compressed, and especially when the compression ratio was 80%. The compressed spaces would lead to a reduction of sound absorption coefficients in the high frequency band, which could be judged from the experimental data in Figure 7.
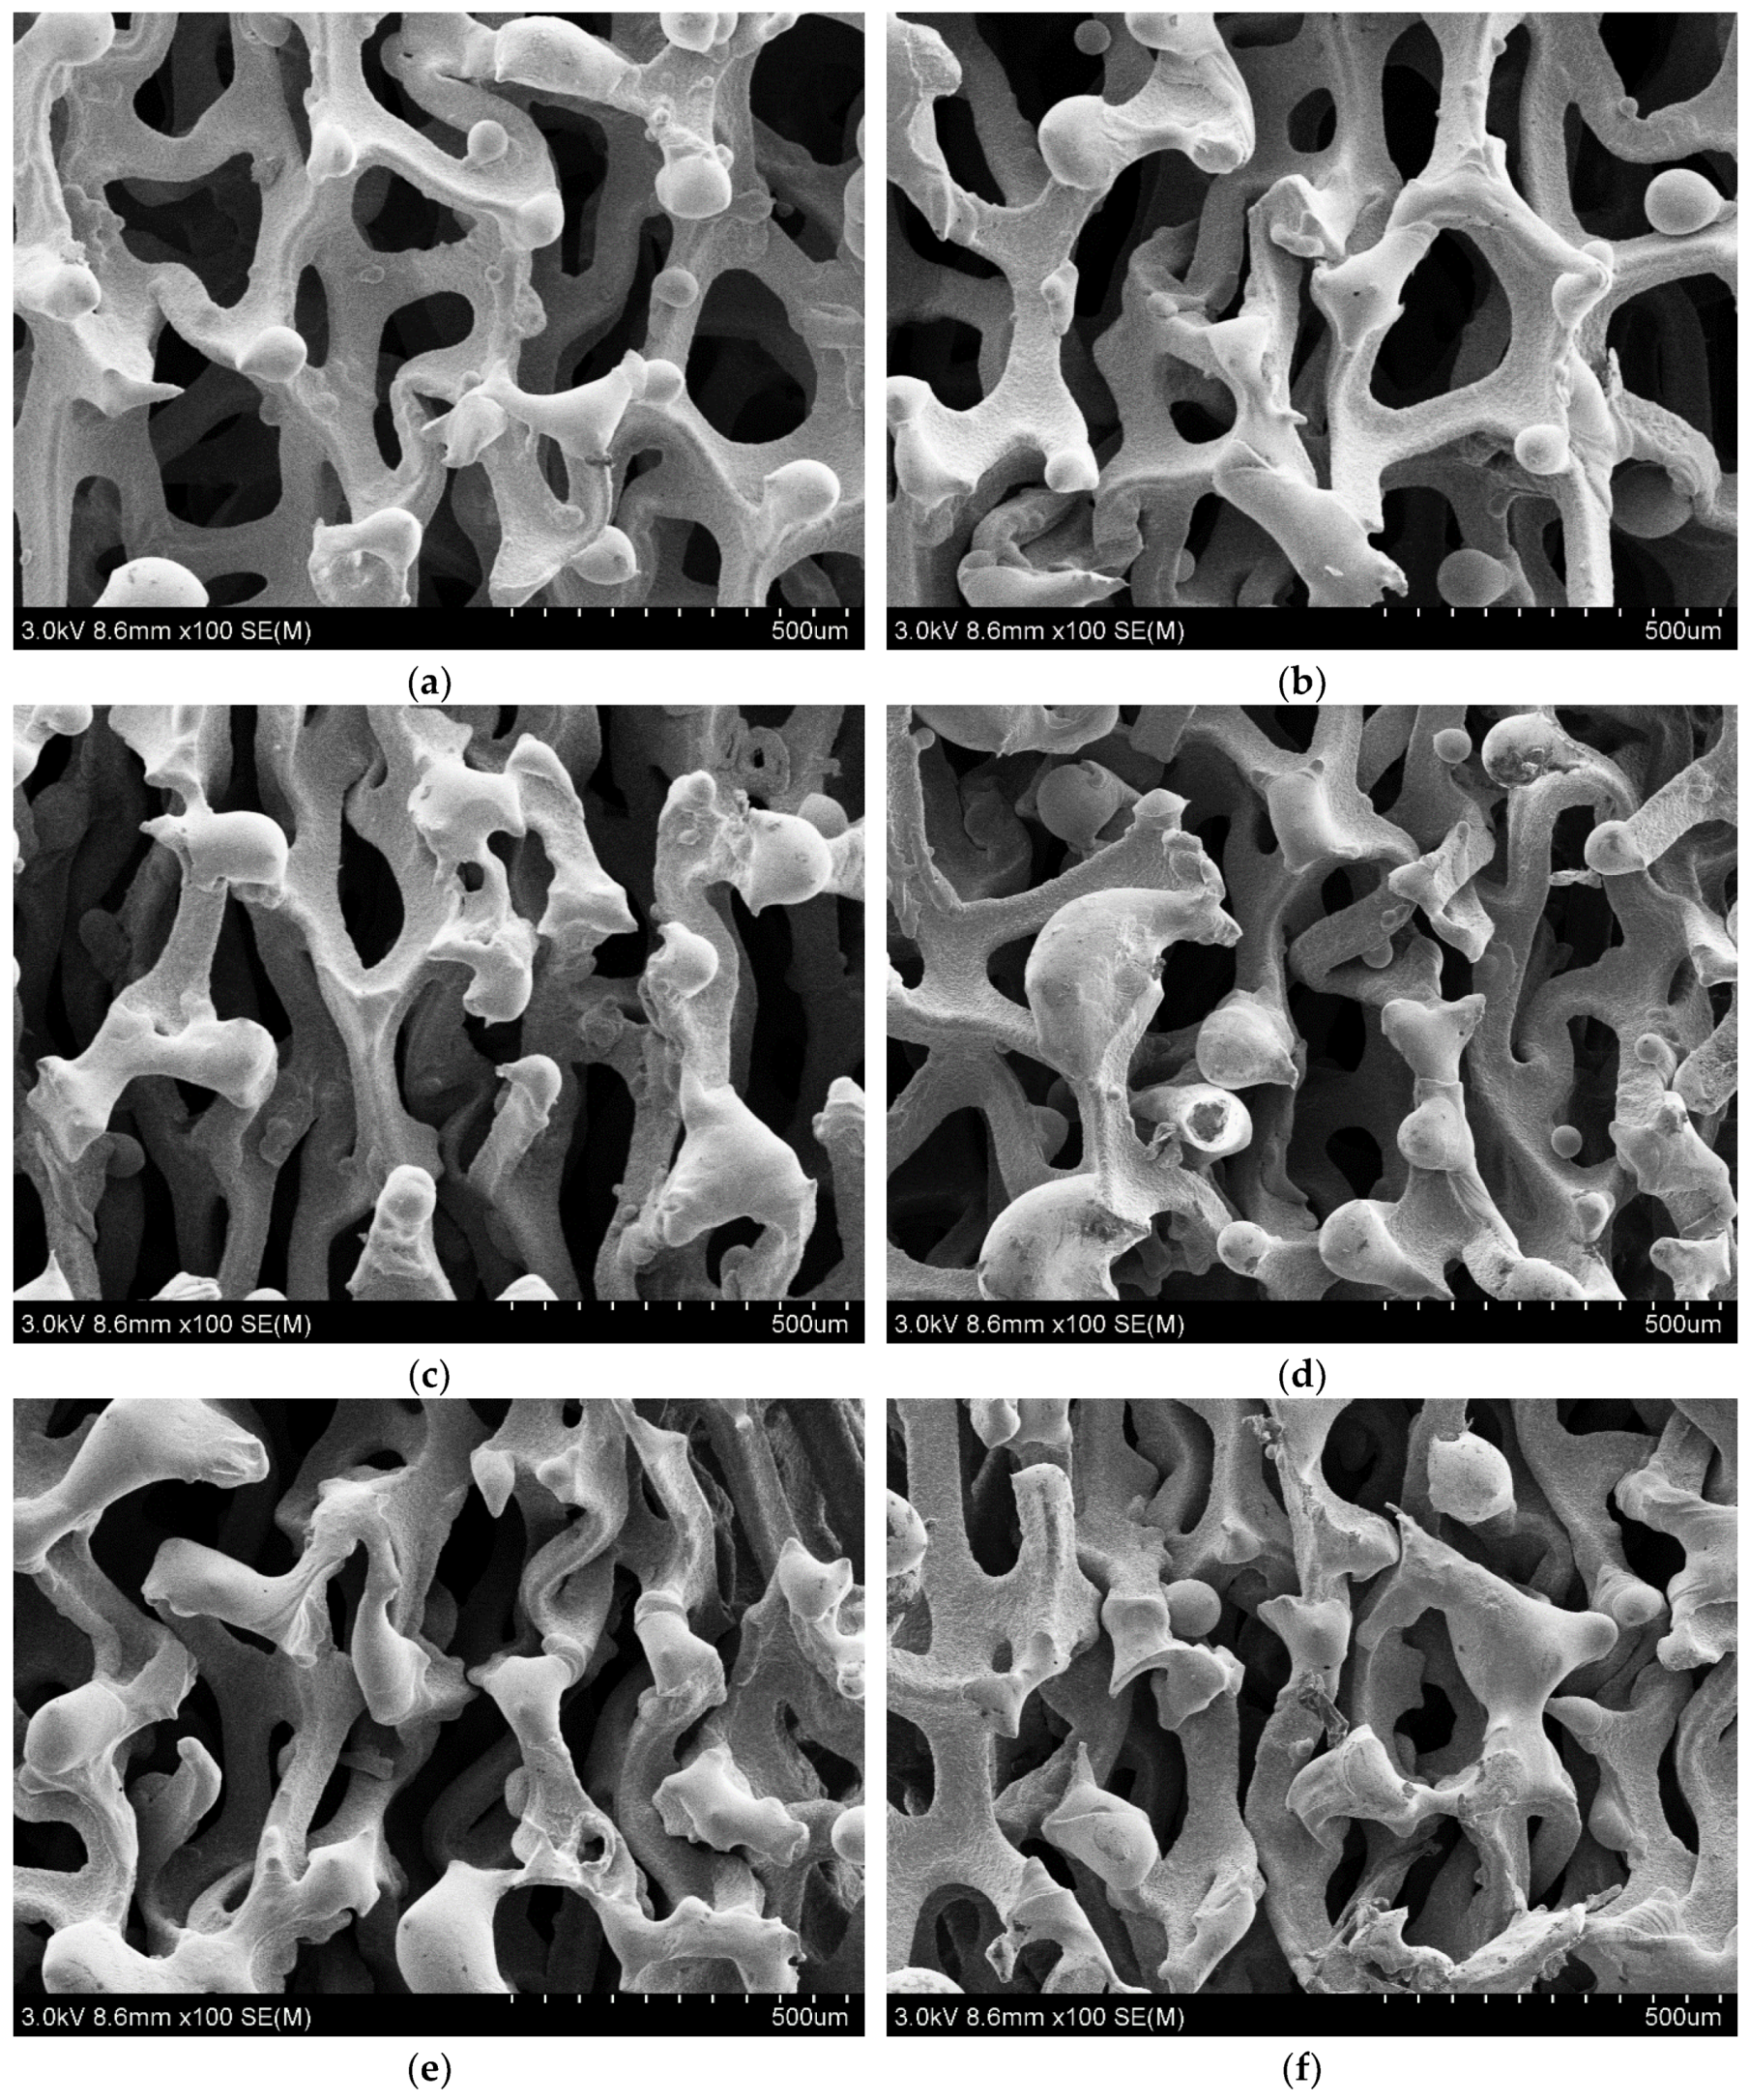
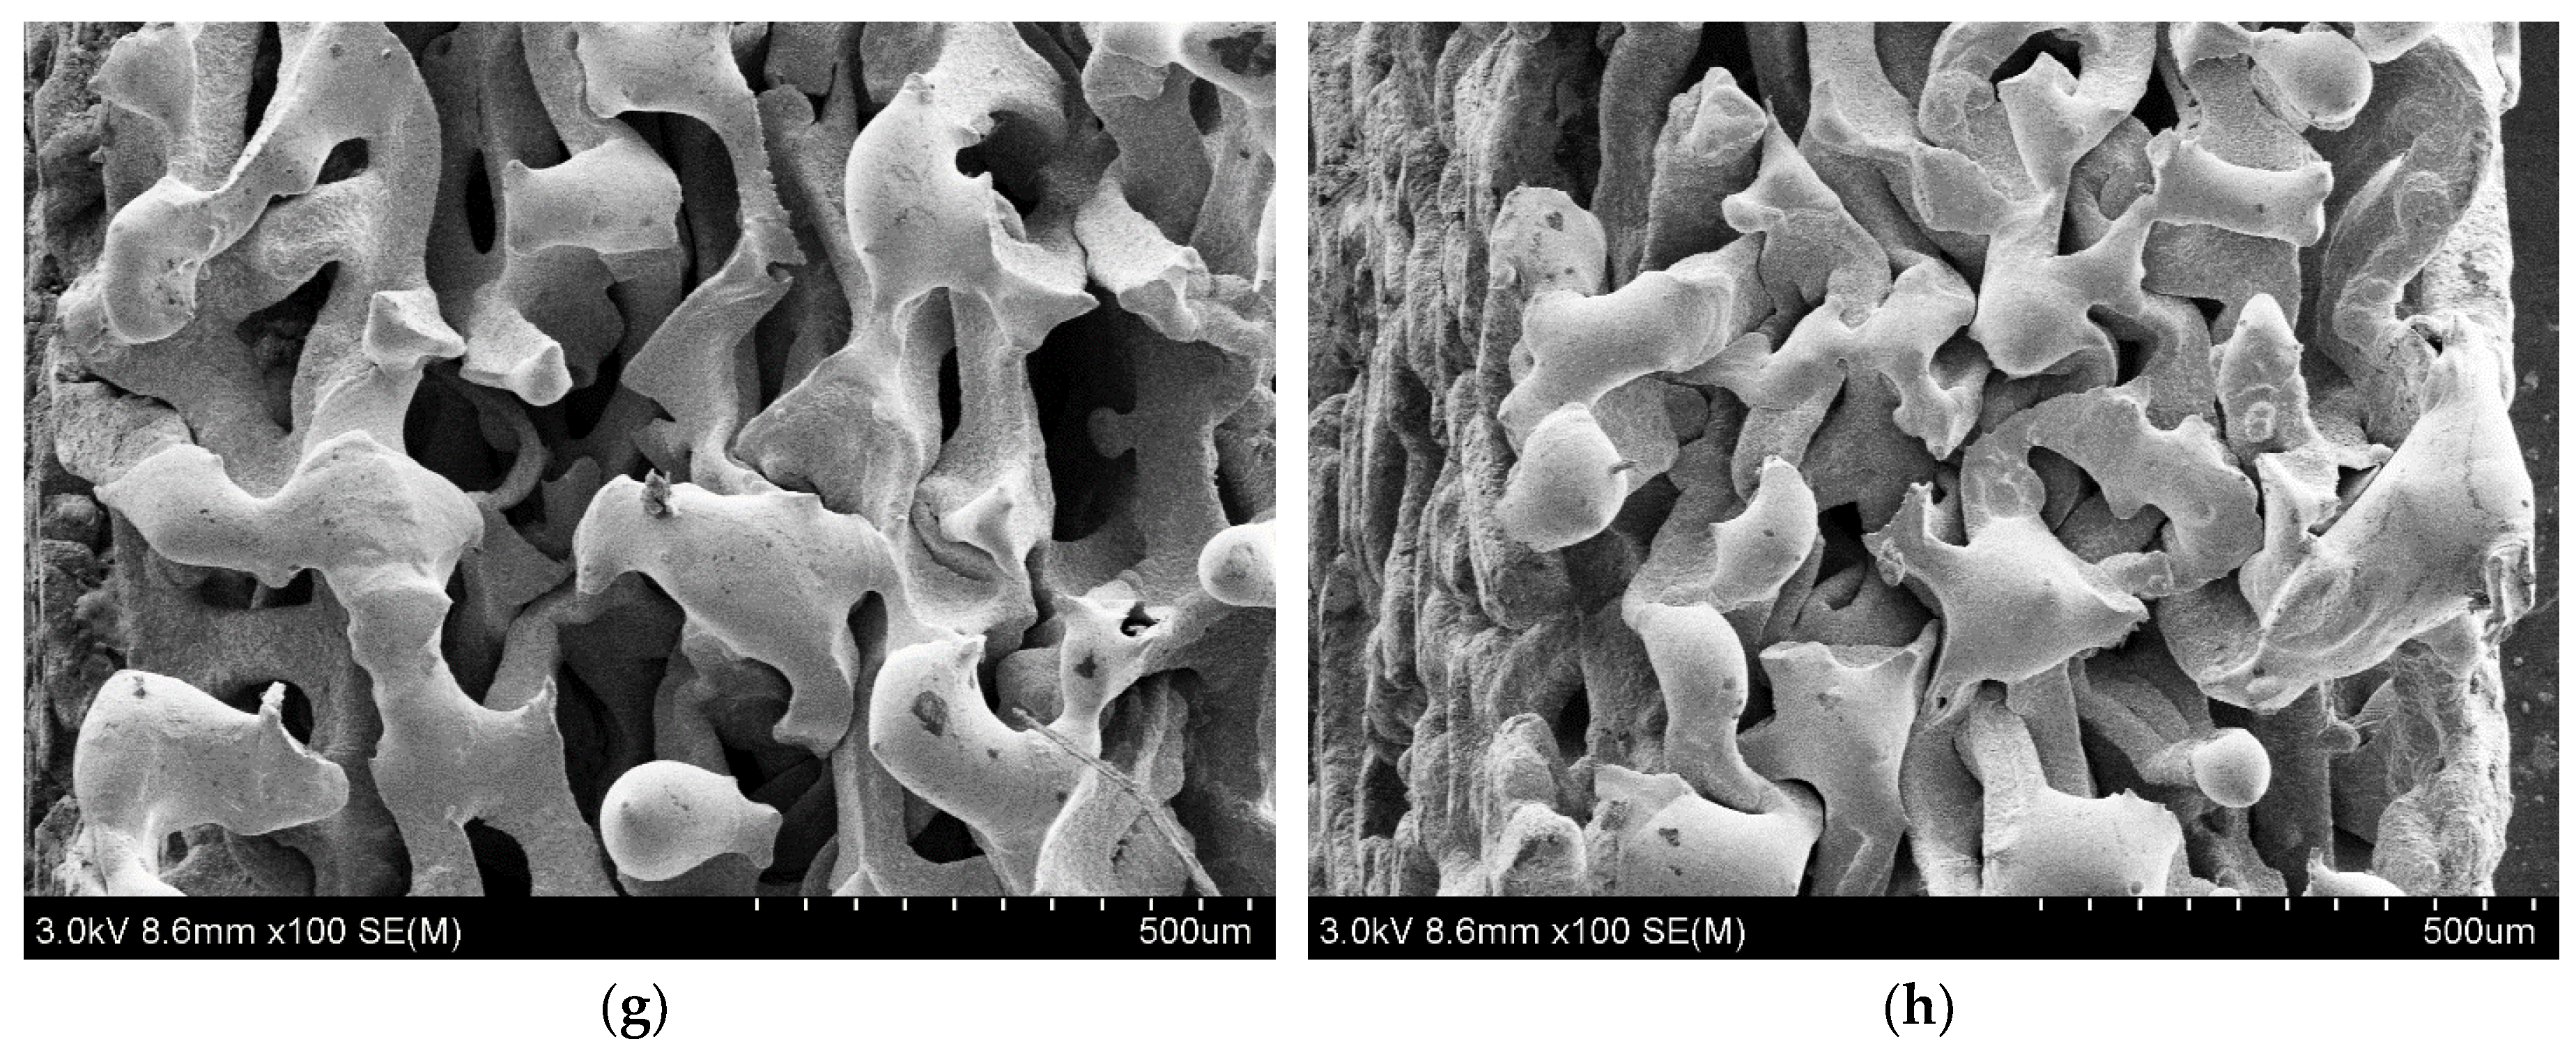
Detailed section morphologies of the Ni-Fe samples with compression ratios from 10% to 80% were studied by SEM with a high magnification of 100, as shown in Figure 9. It could be more obviously observed that the porous structures were gradually destroyed along with an increase of the compression ratio. When the compression ratio was 80%, the sample was almost completely compacted. Sound absorption performance of the sample was decided by its structure. Based on the Biot theory, the sound absorption coefficient was mainly influenced by the thickness of the porous sample in the low frequency band [24]. Although detected thicknesses of the samples were all 20 mm, the compression ratio was different, which indicated that the initial thicknesses before compression were 22.2 mm, 25 mm, 28.6 mm, 33.3 mm, 40 mm, 50 mm, 66.7 mm, and 100 mm, corresponding to the compression ratio of 10%, 20%, 30%, 40%, 50%, 60%, 70%, and 80%, respectively. Thus, it could be found in Figure 7 that sound absorption performance improved along with an increase of the compression ratio when the frequency was in the low band from 100 Hz to 1800 Hz. Meanwhile, for the high frequency band from 2000 Hz to 6000 Hz, the number of the effective pore gradually influenced the sound absorption coefficient of the sample. When the compression ratio was low, the effective pores were added by compression and the structures of the pores were not seriously destroyed. According to these two principles, sound absorption performance was gradually improved and reached its peak when the compression ratio was 70%. When the compression ratio continued up to 80%, it could be judged from Figure 8i and Figure 9h that the structures were seriously damaged, which led to a reduction of the effective pores in the compressed sample. Therefore, sound absorption performance of the sample with a compression ratio of 80% was relatively worse than that of the sample with a compression ratio of 70%. Judging from the curves in Figure 7 and the experimental data in Table 3, it could also be concluded that 70% was the optimal compression ratio.
4. Conclusions
Influences of compression ratios on the sound absorption performance of the porous Ni-Fe alloy were investigated in this study. The following conclusions were obtained by this research:
- (1)
- The experimental result indicated that for the constant compression ratio, the sound absorption coefficient was improved along with increasing the thickness of the sample, and it could be improved by the compression process under the same detected thickness.
- (2)
- Through measurements of the sound absorption coefficients of the porous Ni-Fe samples with a different compression ratio, the modified Johnson-Allard model with a correction factor was built, which could improve prediction accuracy of sound absorption coefficients.
- (3)
- By comparing the sound absorption coefficients of samples with different compression ratios when the thickness of the sample was 20 mm, it could be observed that the optimal compression ratio was 70%. The corresponding mean sound absorption coefficient was 88.97% in a frequency range of 1000–6000 Hz, which was an obvious improvement to the 56.89% of the sample without compression.
- (4)
- According to the investigation of section morphologies of the sample by SEM, influence of the compression ratio was preliminarily studied through analyzing the evolution of structures of samples with different compression ratios, which was consistent with the experimental results.
Author Contributions
Methodology, P.B. and X.S.; Resources, Q.Y.; Supervision, X.S.; Original draft of manuscript, P.B., X.Z., and X.Y.; Review and editing of manuscript, X.S. and A.L.
Funding
This work was supported by a grant from National Natural Science Foundation of China (Grant No. 51505498), a grant from the Natural Science Foundation of Jiangsu Province (Grant No. BK20150714), and a grant from the Hong Kong Scholars Program (No. XJ2017025).
Acknowledgments
Thanks for the support from National Natural Science Foundation of China and Natural Science Foundation of Jiangsu Province. Xinmin Shen was grateful for support from the Hong Kong Scholars Program.
Conflicts of Interest
The authors declare no conflicts of interest.
References
- Sueki, T.; Takaishi, T.; Ikeda, M.; Arai, N. Application of porous material to reduce aerodynamic sound from bluff bodies. Fluid Dyn. Res. 2010, 42, 015004. [Google Scholar] [CrossRef]
- Ikeda, M.; Mitsumoji, T.; Sueki, T.; Takaishi, T. Aerodynamic Noise Reduction of a Pantograph by Shape-Smoothing of Panhead and Its Support and by the Surface Covering with Porous Material. Noise Vib. Mitig. Rail Transp. Syst. 2012, 118, 419–426. [Google Scholar]
- Greiner, C.; Oppenheimer, S.M.; Dunand, D.C. High strength, low stiffness, porous NiTi with superelastic properties. Acta Biomater. 2005, 1, 705–716. [Google Scholar] [CrossRef] [PubMed]
- Parvanian, A.M.; Panjepour, M. Mechanical behavior improvement of open-pore copper foams synthesized through space holder technique. Mater. Des. 2013, 49, 834–841. [Google Scholar] [CrossRef]
- Wang, Y. Influence of Compressive Ratio and Density on Sound Absorbing Property of Foamed Aluminum. Mater. Mech. Eng. 2002, 26, 29–31. [Google Scholar]
- Liang, X.; Wu, J.H.; Zhou, G.J. Quantitative analysis for acoustic characteristics of porous metal materials by improved Kolmogorov’s turbulence theory. Appl. Acoust. 2018, 130, 210–215. [Google Scholar] [CrossRef]
- Atalla, Y.; Panneton, R. Inverse acoustical characterization of open cell porous media using impedance tube measurements. Can. Acoust. 2005, 33, 11–24. [Google Scholar]
- Chevillotte, F.; Perrot, C. Effect of the three-dimensional microstructure on the sound absorption of foams: A parametric study. J. Acoust. Soc. Am. 2017, 142, 1130–1140. [Google Scholar] [CrossRef] [PubMed] [Green Version]
- Venegas, R.; Umnova, O. Acoustical properties of double porosity granular materials. J. Acoust. Soc. Am. 2011, 130, 2765–2776. [Google Scholar] [CrossRef] [PubMed]
- Yang, X.C.; Peng, K.; Shen, X.M.; Zhang, X.N.; Bai, P.F.; Xu, P.J. Geometrical and Dimensional Optimization of Sound Absorbing Porous Copper with Cavity. Mater. Des. 2017, 131, 297–306. [Google Scholar] [CrossRef]
- Kino, N. Further investigations of empirical improvements to the Johnson-Champoux-Allard model. Appl. Acoust. 2015, 96, 153–170. [Google Scholar] [CrossRef]
- Emanov, A.F.; Krasnikov, A.A. Use of the standing wave method to study seismically insulated buildings. Seism. Instrum. 2016, 52, 323–349. [Google Scholar] [CrossRef]
- Hou, S.X.; Luo, J.J.; He, B.; Li, R.S.; Shen, T. The treatment of radioactive wastewater by ultrasonic standing wave method. J. Hazard. Mater. 2014, 274, 41–45. [Google Scholar]
- Kino, N.; Ueno, T. Improvements to the Johnson-Allard model for rigid-framed fibrous materials. Appl. Acoust. 2007, 68, 1468–1484. [Google Scholar] [CrossRef]
- Johnson, D.L.; Koplik, J.; Dashen, R. Theory of dynamic permeability and tortuosity in fluid-saturated porous media. J. Fluid Mech. 1987, 176, 379–402. [Google Scholar] [CrossRef]
- Champoux, Y.; Allard, J.-F. Dynamic tortuosity and bulk modulus in air-saturated porous media. J. Appl. Phys. 1991, 70, 1975–1979. [Google Scholar] [CrossRef]
- Lu, X.Y.; Zhao, C. Electrodeposition of hierarchically structured three-dimensional nickel-iron electrodes for efficient oxygen evolution at high current densities. Nat. Commun. 2015, 6, 6616. [Google Scholar] [CrossRef] [PubMed]
- Bac, L.H.; Kim, B.K.; Kong, Y.M. A Novel Method for Fabricating Fe-Cr-Al Open-cell Metallic and Alloyed Foams. Curr. Nanosci. 2014, 10, 86–88. [Google Scholar] [CrossRef]
- Kim, W.Y.; Matsumoto, R.; Utsunomiya, H. Deformation and Density Change of Open-Cell Nickel Foam in Compression Test. Mater. Trans. 2017, 58, 1373–1378. [Google Scholar] [CrossRef]
- Qiao, J.C.; Xi, Z.P.; Tang, H.P.; Wang, J.Y.; Zhu, J.L. Compressive Property and Energy Absorption of Porous Sintered Fiber Metals. Mater. Trans. 2008, 49, 2919–2921. [Google Scholar] [CrossRef] [Green Version]
- Thawari, G.; Sundar, J.K.S.; Sundararajan, G.; Joshi, S.V. Influence of process parameters during pulsed Nd:YAG laser cutting of nickel-base superalloys. J. Mater. Process. Technol. 2005, 170, 229–239. [Google Scholar] [CrossRef]
- Ru, J.M.; Kong, B.; Liu, Y.G.; Wang, X.L.; Fan, T.X.; Zhang, D. Microstructure and sound absorption of porous copper prepared by resin curing and foaming method. Mater. Lett. 2015, 139, 318–321. [Google Scholar] [CrossRef]
- Xie, Z.K.; Ikeda, T.; Okuda, Y.; Nakajima, H. Sound absorption characteristics of lotus-type porous copper fabricated by unidirectional solidification. Mater. Sci. Eng. A 2004, 386, 390–395. [Google Scholar] [CrossRef]
- Depollier, C.; Allard, J.F.; Lauriks, W. Biot theory and stress-strain equations in porous sound-absorbing materials. J. Acoust. Soc. Am. 1988, 84, 2277–2279. [Google Scholar] [CrossRef]
Figure 1.
Detection of the chemical composition of the porous Ni-Fe sample. (a) Morphology of the sample; (b) Components of the sample.
Figure 1.
Detection of the chemical composition of the porous Ni-Fe sample. (a) Morphology of the sample; (b) Components of the sample.

Figure 2.
Schematic diagrams of the compression system and the measurement system. (a) CTM2050 for sample compression; (b) AWA6128A for sound absorption measurement.
Figure 2.
Schematic diagrams of the compression system and the measurement system. (a) CTM2050 for sample compression; (b) AWA6128A for sound absorption measurement.

Figure 3.
Evolutions of sound absorption coefficients of the compressed porous Ni-Fe samples. (a) With compression ratio of 0%; (b) With compression ratio of 10%; (c) With compression ratio of 20%; (d) With compression ratio of 30%; (e) With compression ratio of 40%; (f) With compression ratio of 50%; (g) With compression ratio of 60%; (h) With compression ratio of 70%; (i) With compression ratio of 80%.


Figure 4.
Comparisons of sound absorption coefficients of single sample with different compression ratios.
Figure 4.
Comparisons of sound absorption coefficients of single sample with different compression ratios.

Figure 5.
Comparisons of sound absorption coefficients of the samples with same thickness of 15 mm.

Figure 6.
Comparisons of the predicted sound absorption coefficients of the compressed porous Ni-Fe sample by the Johnson-Allard model and those by the modified Johnson-Allard model with a correction factor. (a) Sample with thickness of 17.5 mm; (b) Sample with thickness of 20 mm; (c) Sample with thickness of 22.5 mm.


Figure 7.
Comparisons of sound absorption coefficients of the samples with different compression ratios when thickness of the detected sample was 20 mm.
Figure 7.
Comparisons of sound absorption coefficients of the samples with different compression ratios when thickness of the detected sample was 20 mm.

Figure 8.
Section morphologies of the compressed Ni-Fe samples with different compression ratios. (a) 0%; (b) 10%; (c) 20%; (d) 30%; (e) 40%; (f) 50%; (g) 60%; (h) 70%; (i) 80%.
Figure 8.
Section morphologies of the compressed Ni-Fe samples with different compression ratios. (a) 0%; (b) 10%; (c) 20%; (d) 30%; (e) 40%; (f) 50%; (g) 60%; (h) 70%; (i) 80%.


Figure 9.
Detailed section morphologies of the compressed samples by SEM with high magnification. (a) 10%; (b) 20%; (c) 30%; (d) 40%; (e) 50%; (f) 60%; (g) 70%; (h) 80%.
Figure 9.
Detailed section morphologies of the compressed samples by SEM with high magnification. (a) 10%; (b) 20%; (c) 30%; (d) 40%; (e) 50%; (f) 60%; (g) 70%; (h) 80%.


Table 1.
Parameters in the measuring process of the sound absorption coefficient.
| Experimental Serial Number | Material | Compression Ratio | Thickness of Single Sample | Detected Thickness |
|---|---|---|---|---|
| 1001 | Porous Ni-Fe | 0% | 5 mm | 5 mm, 10 mm, 15 mm, 20 mm, 25 mm |
| 1002 | Porous Ni-Fe | 10% | 4.5 mm | 4.5 mm, 9 mm, 13.5 mm, 18 mm, 22.5 mm |
| 1003 | Porous Ni-Fe | 20% | 4 mm | 4 mm, 8 mm, 12 mm, 16 mm, 20 mm, 24 mm |
| 1004 | Porous Ni-Fe | 30% | 3.5 mm | 3.5 mm, 7 mm, 10.5 mm, 14 mm, 17.5 mm, 21 mm |
| 1005 | Porous Ni-Fe | 40% | 3 mm | 3 mm, 6 mm, 9 mm, 12 mm, 15 mm, 18 mm, 21 mm |
| 1006 | Porous Ni-Fe | 50% | 2.5 mm | 2.5 mm, 5 mm, 7.5 mm, 10 mm, 12.5 mm, 15 mm, 17.5 mm, 20 mm, 22.5 mm |
| 1007 | Porous Ni-Fe | 60% | 2 mm | 2 mm, 4 mm, 6 mm, 8 mm, 10 mm, 12 mm, 14 mm, 16 mm, 18 mm, 20 mm, 22 mm |
| 1008 | Porous Ni-Fe | 70% | 1.5 mm | 1.5 mm, 3 mm, 4.5 mm, 6 mm, 7.5 mm, 9 mm, 10.5 mm, 12 mm, 13.5 mm, 15 mm, 16.5 mm, 18 mm, 19.5 mm, 21 mm |
| 1009 | Porous Ni-Fe | 80% | 1 mm | 1 mm, 3 mm, 5 mm, 7 mm, 9 mm, 11 mm, 13 mm, 15 mm, 17 mm, 19 mm, 21 mm |
Table 2.
The summarized for comparisons of prediction accuracy of the model.
| Thickness | The Calculated | |
|---|---|---|
| Johnson-Allard Model | Modified Johnson-Allard Model with Correction Factor | |
| 17.5 mm | 0.9424 | 0.9809 |
| 20 mm | 0.9528 | 0.9915 |
| 22.5 mm | 0.9610 | 0.9937 |
| Average | 0.9521 | 0.9887 |
Table 3.
The calculated mean value and variance of sound absorption coefficients in the frequency range of 1000 Hz to 6000 Hz for the Ni-Fe samples with different compression ratios.
Table 3.
The calculated mean value and variance of sound absorption coefficients in the frequency range of 1000 Hz to 6000 Hz for the Ni-Fe samples with different compression ratios.
| Compression Ratio (%) | 0 | 10 | 20 | 30 | 40 | 50 | 60 | 70 | 80 |
|---|---|---|---|---|---|---|---|---|---|
| Mean value | 56.89 | 58.74 | 68.16 | 71.49 | 77.12 | 81.78 | 87.32 | 88.97 | 80.53 |
| Variance | 292.43 | 271.33 | 282.78 | 259.26 | 255.89 | 243.12 | 138.31 | 60.79 | 11.87 |
© 2018 by the authors. Licensee MDPI, Basel, Switzerland. This article is an open access article distributed under the terms and conditions of the Creative Commons Attribution (CC BY) license (http://creativecommons.org/licenses/by/4.0/).
Share and Cite
MDPI and ACS Style
Bai, P.; Shen, X.; Zhang, X.; Yang, X.; Yin, Q.; Liu, A. Influences of Compression Ratios on Sound Absorption Performance of Porous Nickel–Iron Alloy. Metals 2018, 8, 539. https://doi.org/10.3390/met8070539
AMA Style
Bai P, Shen X, Zhang X, Yang X, Yin Q, Liu A. Influences of Compression Ratios on Sound Absorption Performance of Porous Nickel–Iron Alloy. Metals. 2018; 8(7):539. https://doi.org/10.3390/met8070539
Chicago/Turabian StyleBai, Panfeng, Xinmin Shen, Xiaonan Zhang, Xiaocui Yang, Qin Yin, and Anxin Liu. 2018. "Influences of Compression Ratios on Sound Absorption Performance of Porous Nickel–Iron Alloy" Metals 8, no. 7: 539. https://doi.org/10.3390/met8070539
Note that from the first issue of 2016, this journal uses article numbers instead of page numbers. See further details here.