Behavior Characteristics of Argon Bubbles on Inner Surface of Upper Tundish Nozzle during Argon Blowing Process


1
The State Key Laboratory of Refractories and Metallurgy, Wuhan University of Science and Technology, Wuhan 430081, China
2
Hubei Provincial Key Laboratory for New Processes of Ironmaking and Steelmaking, Wuhan University of Science and Technology, Wuhan 430081, China
*
Author to whom correspondence should be addressed.
Metals 2018, 8(8), 590; https://doi.org/10.3390/met8080590
Submission received: 30 June 2018
/
Revised: 21 July 2018
/
Accepted: 25 July 2018
/
Published: 30 July 2018
(This article belongs to the Special Issue 5th UK-China Steel Research Forum)
Abstract
:During continuous casting of aluminum-killed steel, clogging of tundish nozzle frequently occurs, which seriously disrupts the normal casting sequences and deteriorates strand quality. Generally, argon blowing technology in the form of a stable and continuous argon film on the inner surface of the upper nozzle is employed to prevent the upper nozzle from clogging in the production. To explore the formation mechanism and influence factors of this argon film, a water model of the upper nozzle with blowing argon with a similarity ratio of 1:1 was built. The results show that the number of bubble chains increases gradually with increasing argon flow rate and casting speed, and the argon gas curtain appears at the bottom half of the upper nozzle. For a given argon flow rate, the velocity of argon gas bubbles increased gradually with increasing casting speed, and decreased gradually with increasing distance from the upper nozzle top. For a given casting speed, the average velocity of argon gas bubbles was largest at a distance from the upper nozzle top of 6 mm with argon flow rate of 150 L/h. The results could provide theoretical and technical basis for the optimization of blowing argon parameters in order to prevent the clogging of upper nozzle and improve strand quality.
1. Introduction
Production of high quality steel has always long been a concern to the steelmaking industry. Reducing the amounts of acid soluble content in aluminum-killed steel is important for improving steel quality. Clogging of tundish nozzle frequently occurs during continuous casting of aluminum-killed steel, which not only disrupts the normal sequences of continuous casting but also deteriorates strand quality [1]. Previous research indicated that the clogging of tundish nozzle was mainly due to the adhesion of high melting point inclusions (Al2O3) on the inner nozzle wall [2,3,4]. One approach to prevent clogging in tundish nozzle is the use of an argon film on the inner surface of the upper nozzle, which can separate inclusions in molten steel from the nozzle wall and inhibit the clogging.
It is widely accepted that argon blowing technology can prevent clogging in tundish nozzle because the scattered ruptured argon bubbles from the stopper wash and capture the inclusions on the inner nozzle wall [5]. Extensive studies [6,7,8] focusing on this technology have been conducted. The effect of argon gas on the flow of molten steel and slag entrapment in mold was revealed during the continuous casting process [9,10,11]. The theoretical results of Thomas [12] indicated that the argon bubbles in the nozzle during argon blowing could change the flow of the upper recirculation zone in the mold and move up the impingement point and upper recirculation zone; thus, this argon blowing technology could be applied to improve and control the flow of the molten steel. It was shown that with increasing argon flow rate for a given casting speed, the fluctuation of the mold level gradually increases, and the frequency of flux entrapment firstly decreases and then increases [13]. These studies explored the influence of the parameters of argon blowing in the nozzle on the strand quality. However, reports on the formation behavior of the argon gas film on the nozzle wall and the distribution characteristics of argon bubbles in the nozzle are relatively scarce.
Previous research [14] suggested that the argon film formed between the inner surface of the nozzle and the liquid steel. Thomas [15] investigated the two-phase (liquid steel/argon bubbles) flow in the tundish nozzle during continuous casting by using a numerical simulation method and suggested that the flow changed with the argon flow rate. Bai [16] obtained four kinds of behavior of bubbles in the nozzle with different argon and fluid flow rates during continuous casting using water model experiments, and a stable and continuous gas film could be obtained with reasonable parameters. However, this result was suitable for gas blown from a single pore. However, argon is blown from numerous dispersion pores and the formation and downward migration behaviors of the argon gas film are significantly complicated during continuous casting.
Therefore, the effect of the argon flow rate and casting speed on the behavior characteristics of argon bubbles on the nozzle wall was studied in this paper. The results could provide a theoretical and technical basis for optimizing the process parameters of argon blowing, preventing nozzle clogging, and improving the strand quality.
2. Experiment Theory and Model Establishment
2.1. Experiment Theory
The similarity criterion numbers in fluid dynamics include the Reynolds (Re), Froude (Fr), Euler (Eu), Grashof (Gr), and Mach (Ma) numbers. The liquid steel in the upper nozzle is always in a turbulent flow state during continuous casting, which is dominated by inertia, gravity, and viscous forces. When the Reynolds number for the flow in the water model calculated in Equation (1) reaches a certain value, the similarity principle is ensured because that the flow is in the same self-modeling area, which does not require that the Reynolds number be equal [17]. The viscous force could be ignored in the establishment of the water model because the flow of liquid steel is in the same self-modeling area. Therefore, in the case of geometric similarity, if the Froude numbers of water in the water model and liquid steel in the upper nozzle are equal, as shown in Equation (2), then similar dynamics of the models and prototypes are ensured.
Here, ρ is the density of the flow, kg/m3; µ is the dynamic coefficient of the viscosity of the flow, N·s/m2; L is the characteristic length of the flow field, m; u is the flow velocity of the fluid, m/s; is the flow velocity of water, m/s; is the flow velocity of steel, m/s; g is the acceleration of gravity, 9.8 m/s2; Lp is the feature size of the prototype, m; Lm is the feature size of the water model, m.
For better observation, the size of the upper nozzle in the water model is the same as that in the actual production; thus, the geometric similarity ratio (λ = Lp/Lm) between the water model and the actual tundish is chosen to be 1. After entering the simulated parameters into Equation (2), Equation (3) is obtained. It can be inferred that the flow rate of water is the same as that of liquid steel during continuous casting.
Here, is the flow velocity of water in the water model, m/s; is the casting speed of liquid steel, m/s.
The argon bubbles enter into liquid steel at a high temperature during continuous casting, while they do so at room temperature in the water model; thus, the revised Froude numbers of argon bubbles are selected as shown in Equation (4). According to the similar principle for ensuring equal revised Froude numbers, the velocities of argon bubbles in the actual production and simulation water model are determined according to Equation (5). After entering the simulated parameters into Equation (5), Equation (6) is obtained.
Therefore, in the case of geometric similarity, if the Froude numbers of water in the water model and liquid steel in the upper nozzle are equal, as shown in Equation (2), then dynamics of the models and prototypes are ensured.
Here, ρg is the density of the gas, kg/m3; ρL is the density of the liquid, kg/m3; ρAr(Steel) is the density of argon at liquid steel temperature, kg/m3; ρArm is the density of argon at room temperature, kg/m3; ρSteel is the density of liquid steel, kg/m3; ρWater is the density of water, kg/m3; uAr(Steel) is the velocity of argon bubbles in liquid steel, m/s; uArm is the velocity of argon bubbles at room temperature in the water model, m/s.
Since there is a volume expansion of argon gas under the high-temperature operating conditions, while the water model is carried out at room temperature, a simulation of the argon flow rate needs to be designed. According to the ideal gas state equation and Equation (6), the relationship between the actual production and physical simulation of the argon flow rate is shown in Equations (7) and (8). The densities at normal temperature and standard conditions are assumed to be the same. The simulated conditions are as follows: Troom = 293 K, TSteel = 1773 K, ρArm = 1.784 kg/m3, ρwater = 1000 kg/m3 at room temperature, ρsteel = 7000 kg/m3 and ρAr(Steel) = 0.275 kg/m3, λ = 1. After entering the simulated parameters and Equation (6) into Equation (8), Equation (9) is obtained.
Here, QArp is the actual argon flow rate, L/min; QAr(Steel) is the argon flow rate in liquid steel, L/min; QArm is the argon flow rate in the water model, L/min; Sp is the actual sectional area of argon blowing pipe; Sm is the sectional area of argon blowing pipe in water model.
2.2. Establishment of Water Model of Argon Blowing in Tundish Nozzle
A water model of 1/1 linear scale for a partial tundish was designed; namely, the width and height of the tundish in the water model were the same as those of the tundish in the actual production. Due to the large size of the actual tundish, the size of the tundish was designed as a square box of 520 mm × 520 mm × 510 mm. According to Equation (1), when the casting speeds of flow are 0.4–0.6 m/s, the Reynolds number of liquid steel in the actual nozzle is 25,000–37,500, and that of water in the water model is 19,920–29,880; thus, the flow is in the same self-modeling area.
In order to ensure similar behaviors of the water and liquid steel flows, a box with the size of 300 mm × 90 mm × 350 mm was set up in the tundish model. A demonstration experiment of the tundish water model using methylene blue was conducted; the flow field in the tundish at different times (0 s was set as the beginning outlet time of the liquid) is shown in Figure 1. It is shown that the water enters the box from the long nozzle and then migrates upward to the nozzle area. The flow of liquid steel in the tundish in a limited space could be simulated by using this device, which could avoid the formation of rotational flow in the nozzle zone by using a short distance between inflow and outflow, and ensure accurate experimental simulation results.
A water model of 1/1 linear scale for the upper nozzle was designed as shown in Figure 2a,b. A part of the upper nozzle is made of permeable brick with an arc angle of 150°, surrounded by a semi-circular gas chamber. A photo and the size of the permeable brick structure are shown in Figure 2c,d, respectively. The other part of the upper nozzle is made of polymethyl methacrylate to observe the behavior characteristics of argon bubbles.
The experimental device of argon blowing in the tundish nozzle in the water model is shown in Figure 3, which mainly includes the tundish model, nozzle model, mold model, argon bottles, gas flow meter, liquid flow meter, MEMRECAM HX-7 high-speed camera (NAC, Tokyo, Japan), and a data acquisition system. In this experiment, the behavior characteristics of argon bubbles under different process parameters were recorded using the high-speed camera. Subsequently, the sizes and velocities of argon bubbles on the inner surface of the nozzle were respectively measured using the Nano Measurer software (Chemistry Department of Fudan University, Shanghai, China) and Molysis software (Jundagaoke Company, Hefei, China). Measuring software interfaces are shown in Figure 4, where the length of the upper nozzle bottom in the picture is selected as the ruler.
2.3. Experimental Scheme
According to the actual process conditions in some steel mills, the casting speed is 0.4–0.6 m/min, the section size of the bloom is 390 mm × 510 mm, and the flow rate of argon blowing is about 120–180 L/h. The argon flow rates in the water model were calculated according to Equation (9), which were about 100–160 L/h. Since the flow rate of water is equal to the flow rate of liquid steel, the water flow was calculated according to Equation (10). In order to analyze the effects of the argon flow rate and casting speed on the argon bubble behavior in the nozzle, the experimental scheme is shown in Table 1.
Here, uSteel is the casting speed of liquid steel, m/s; SBloom is the sectional area of the bloom, m2.
3. Results and Discussion
3.1. Effect of Process Parameters on Distribution of Argon Bubbles on Inner Surface of Nozzle
For case 1 in Table 1, the distribution of argon bubbles on the inner surface of the nozzle with different argon flow rates is shown in Figure 5. It is observed that the argon bubbles appear slowly one by one and grow up at the top of the upper nozzle, and bubble chains appear in the pores of the upper nozzle. The reason for the different states of big bubbles and bubble chains is the non-uniform distribution of sizes of effective micropores in the upper nozzle, which is closely related to the production raw materials and process parameters of permeable brick. As seen in Figure 5, with other conditions remaining unchanged, the number of bubble chains increased gradually with increasing argon flow rate. When the superposition of more bubble chains occurred, a gas curtain appeared at the bottom half of the upper nozzle.
The average diameter of argon bubbles on the inner surface of the nozzle with different argon flow rates is shown in Figure 6. When the argon flow rate increases from 8 L/h to 200 L/h, the average diameter of argon bubbles increases from 0.17 mm to 1.44 mm. Since the number of effective micropores in the upper nozzle increases through the impact of gas pressure with the increase in argon blowing, more bubble chains on the inner surface of the nozzle are generated, and more bubbles subsequently combine into larger bubbles; thus, the average diameter of argon bubbles increases.
The distribution of argon bubbles on the inner surface of the nozzle for different casting speeds and an argon flow rate of 100 L/h is shown in Figure 7. It is observed that the number of bubble chains obviously increases with increasing casting speed, and there is a larger gas curtain zone when the casting speed is 0.6 m/min. Because the size of bubbles decreases with increasing casting speed, and the water flow rate near the nozzle wall increases significantly, the frequency of bubbles separating at the upper nozzle is higher and the number of bubble chains increases. At a high casting speed, the gas curtain zone is larger due to the superposition of more bubble chains.
The average diameter of argon bubbles on the inner surface of the nozzle with different casting speeds and an argon flow rate of 100 L/h is shown in Figure 8. When the casting speed increases from 0.4 m/min to 0.6 m/min, the average diameter of argon bubbles decreases from 1.23 mm to 1.09 mm. The flow velocity of the fluid near the inner surface of the nozzle and the fluid drag force applied on the bubble increases with increasing casting speed; thus, the bubble is easier to separate from the micropore in the upper nozzle, which results in a smaller average diameter.
3.2. Effect of Process Parameters on Velocity of Argon Bubbles near Inner Surface of Nozzle
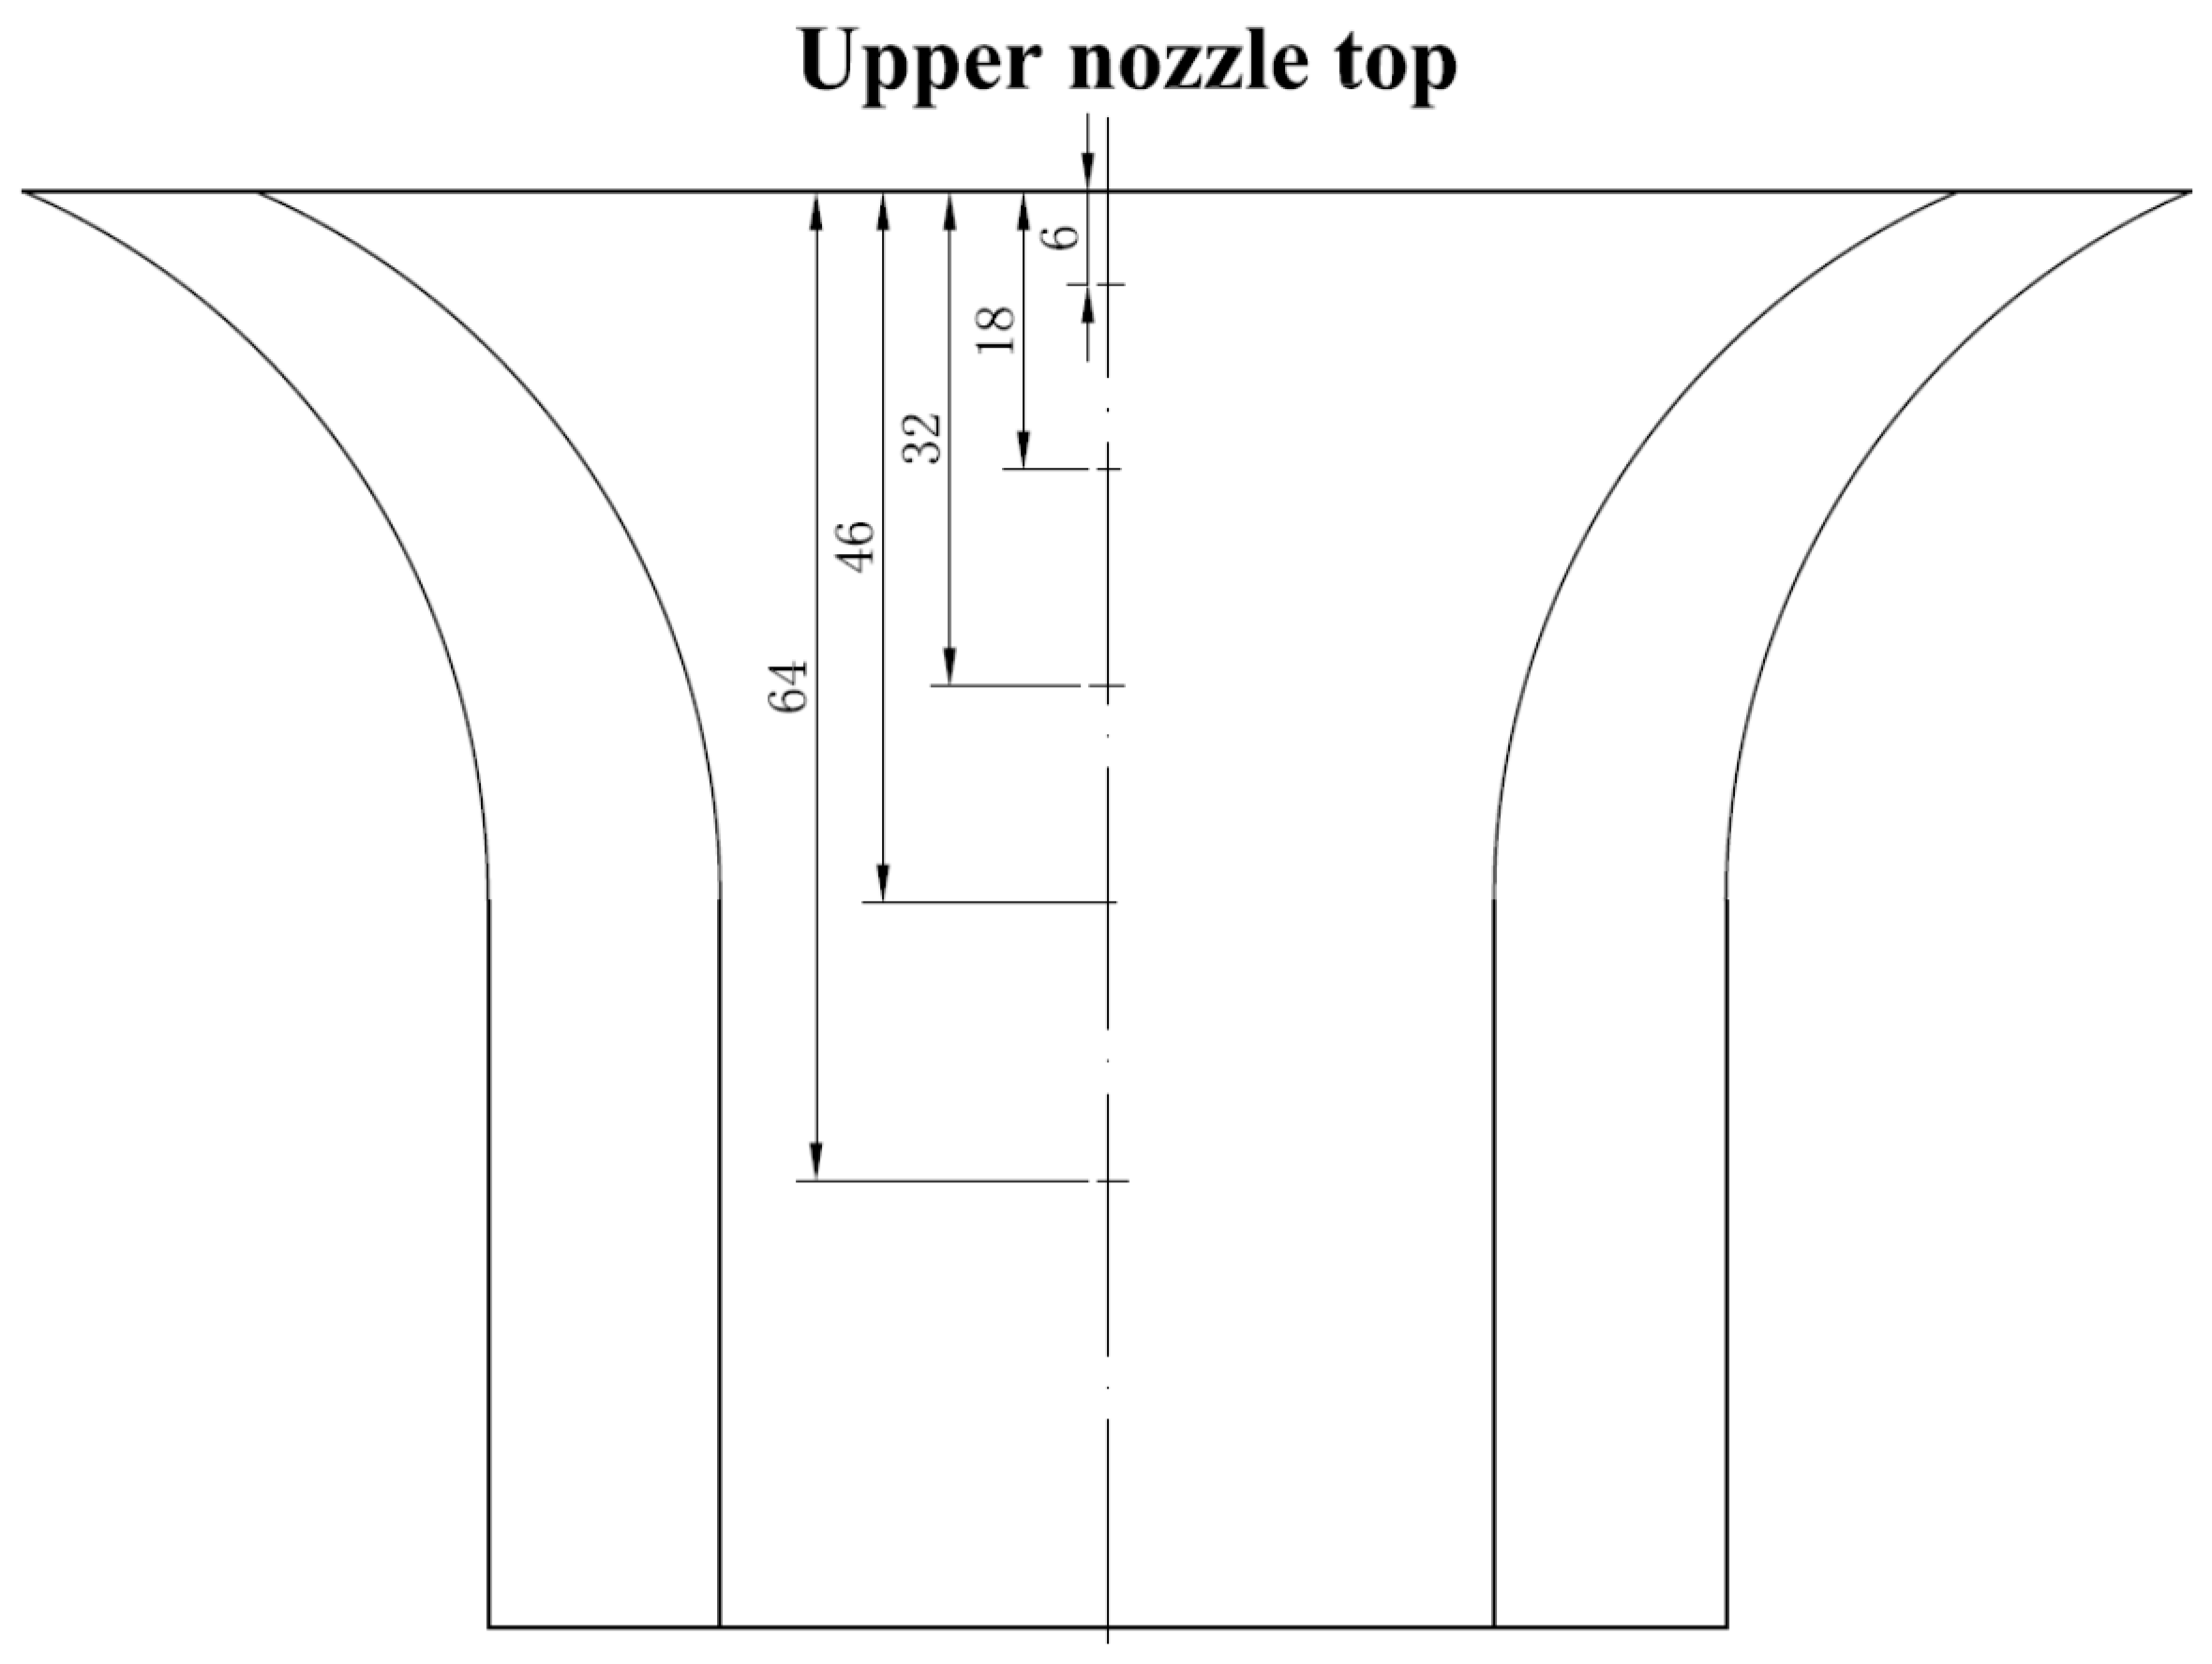
In order to study the velocity distribution of argon bubbles in the upper nozzle, some representative micropores near the edge of the permeable brick with distances from the upper nozzle top of 6 mm, 18 mm, 32 mm, 46 mm, and 63 mm, respectively, were selected, which are shown in Figure 9. The velocities of argon bubbles in the nozzle were analyzed using the Molysis software. The inner diameter of the upper nozzle bottom was used as the characteristic size in the measurement of the velocity of argon bubbles near the nozzle wall. In this paper, we selected the average flow velocity of water at different distances from the upper nozzle top, and this changes with the change in sectional area.
The effect of casting speed on the average velocity of argon gas bubbles at different distances with an argon flow rate of 100 L/h is shown in Figure 10. When the distance from the upper nozzle top is 6 mm, the average velocities of argon gas bubbles are 0.894 m/s, 1.101 m/s, and 1.183 m/s for casting speeds of 0.4 m/min, 0.5 m/min, and 0.6 m/min, respectively. It is shown that the velocity of argon gas bubbles increases gradually with increasing casting speed. This is because the argon bubble detached from the micropore of the nozzle is mainly affected by the fluid drag force, gravity, and buoyancy [18]. When the casting speed is low, the fluid drag force is small due to the low fluid flow rate, which results in a lower velocity of argon gas bubbles.
As shown in Figure 11, when the casting speed is 0.5 m/min, the average velocity of argon gas bubbles is 1.101 m/s at a distance from the upper nozzle top of 6 mm, and 0.791 m/s at a distance from the upper nozzle top of 63 mm. It is shown that the velocity of argon gas bubbles increases gradually with increasing casting speed, and decreases gradually with increasing distance from the upper nozzle top. Since the cone-shape stopper is inserted into the nozzle at a certain depth in the experiment, the corresponding channel of fluid flow in the top half part of the nozzle is smaller than that in its bottom half part. The argon bubble initial velocity is high in the zone under the stopper, but because of the viscous resistance of the fluid, the bubble velocity decreases.
For a given casting speed of 0.5 m/min, the effect of the argon flow rate on the average velocity of argon gas bubbles at different distances from the upper nozzle top is shown in Figure 11. It is shown that the velocity of argon gas bubbles decreases gradually with increasing distance from the upper nozzle top under different argon flow rates. The average velocity of argon gas bubbles is highest at a height of 6 mm with an argon flow rate of 150 L/h, and high at a distance from the upper nozzle top of 63 mm with an argon flow rate of 40 L/h. Overall, the influence of the argon flow rate on the average velocity of argon gas bubbles was not significant, which is related to the argon bubble size and the combination of fluid drag force, gravity, and buoyancy under different conditions.
3.3. Effect of Process Parameters on Distance from Bubble Chains to Inner Surface
The bubble chains detached from nozzle micropores migrate downward along the inner surface of the nozzle. The effect of casting speed and argon flow rate on the distances from bubble chains to the inner surface was studied in this paper. Figure 12 is a schematic diagram of the distances from bubble chains to the inner surface, in which 1, 2, 3, 4 are the selected representative pores; the average distances are measured by drawing four lines along the bubble chain using CAD software.
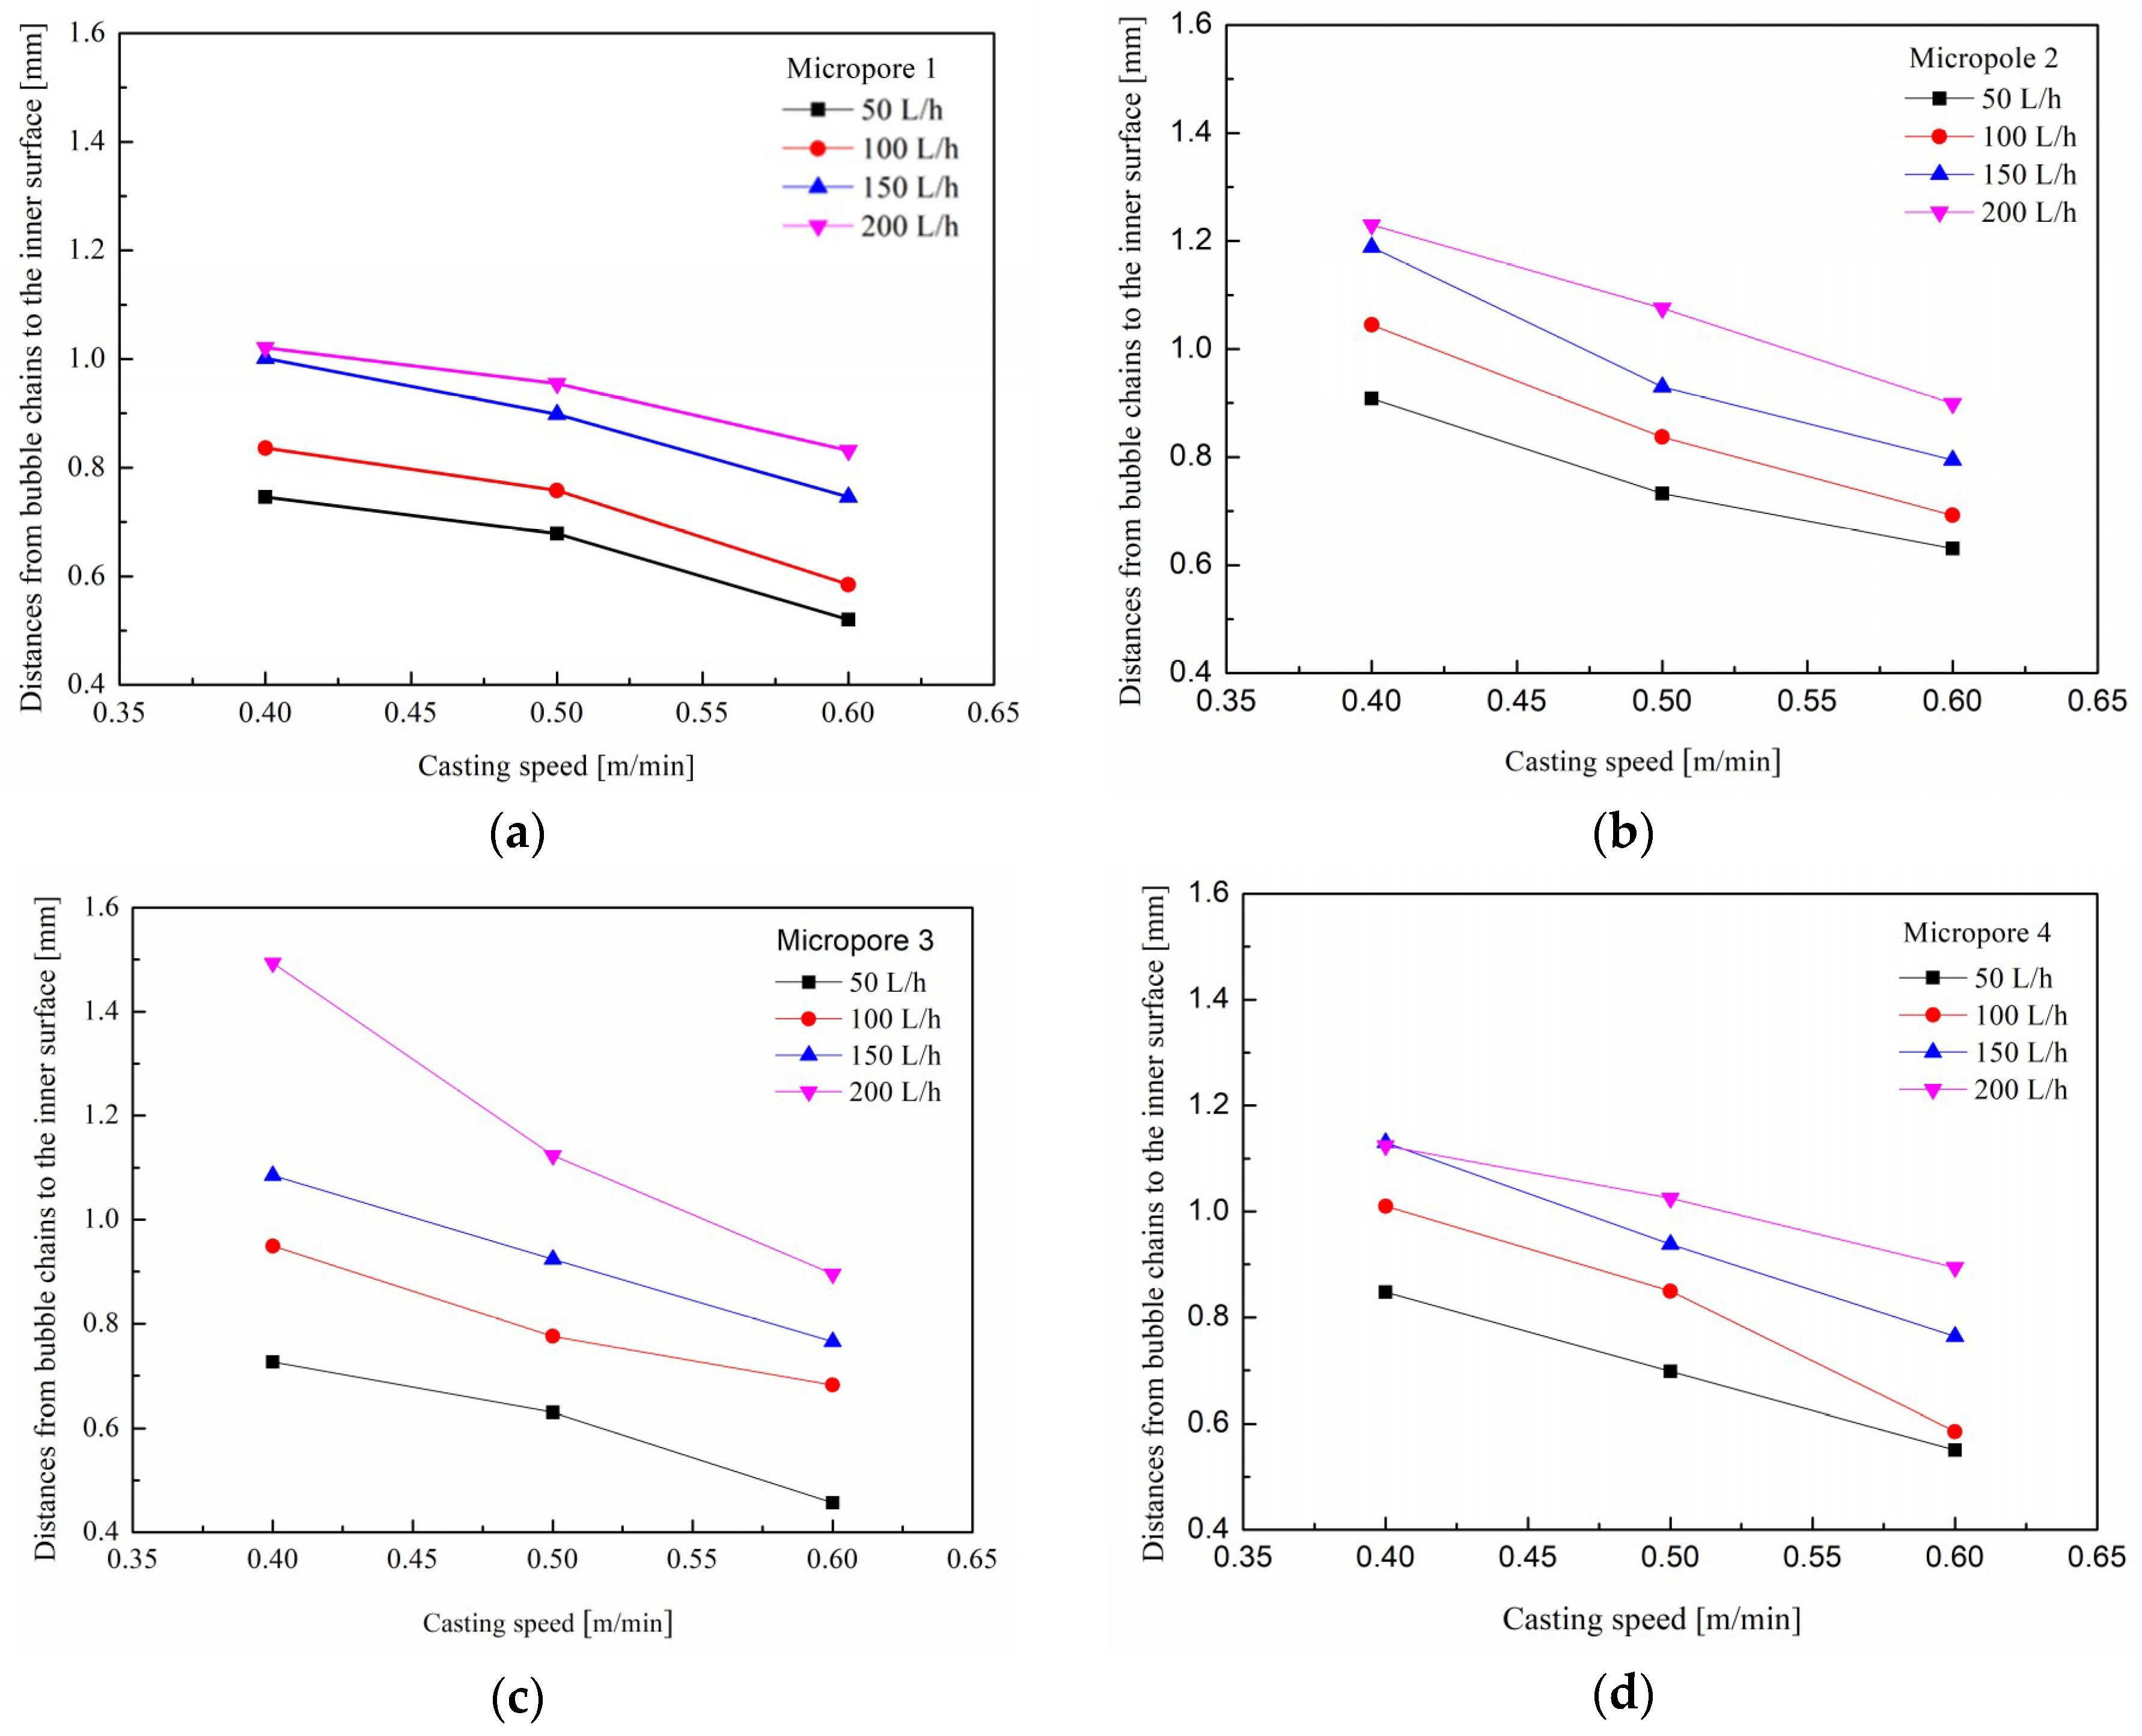
Figure 13 shows the measured distances from bubble chains to the inner surface of the nozzle. For a given argon flow rate, the distance becomes gradually smaller with increasing casting speed. This is because the direction of the resultant force is closer to the inner surface when the fluid drag force is large at high casting speeds. For a given casting speed, the distance becomes gradually larger with increasing argon flow rate. Since the momentum of argon bubbles is large at high argon flow rates, the bubbles could migrate farther from the inner surface of the nozzle following the normal direction.
According to the distribution of argon bubbles on the inner surface of the nozzle, we can also see that more bubble chains superpose and a larger gas curtain zone appears when the distances from bubble chains to the inner surface of the nozzle are small. It is obvious that the casting speed and argon flow rate during the argon blowing process should be suitable. The casting speed should be high for a given argon flow rate, while the argon flow rate should be low for a given casting speed, in order to maintain a sufficient number of bubble chains.
4. Conclusions
(1) The argon bubbles appear one by one slowly and grow up at the top of the inner surface of the tundish nozzle, and bubble chains appear at the pores of the upper nozzle. The number of bubble chains increases gradually with increasing argon flow rate, while the number of bubble chains increases obviously with increasing casting speed. Subsequently, an argon gas curtain will appear at the bottom half of the upper nozzle due to the superposition of sufficient bubble chains. Therefore, an appropriately high argon flow rate and casting speed are propitious to the formation of the argon gas curtain in the tundish upper nozzle.
(2) For a given argon flow rate, the velocity of argon gas bubbles increases gradually with increasing casting speed, and decreases gradually with increasing distance from the upper nozzle top. For a given casting speed, the influence of the argon flow rate on the average velocity of argon gas bubbles is not significant, and the average velocity of argon gas bubbles is highest at a distance from the upper nozzle top of 6 mm with an argon flow rate of 150 L/h.
(3) For a given argon flow rate, the distance becomes gradually smaller with increasing casting speed and fluid flow rate. For a given casting speed, the distance gradually increases with increasing argon flow rate. In order to obtain a continuous gas curtain, the casting speed should be high for a given argon flow rate, while the argon flow rate should be low for a given casting speed, maintaining a sufficient number of bubble chains.
Author Contributions
Y.L. and C.C. conceived and designed the study; Y.L. and M.Y. conducted the experiment; Y.L. analyzed the experimental data and wrote the manuscript with the advice of C.C., M.Y., Z.D., and Z.X.
Funding
This research was funded by the National Nature Science Foundation of China (No. 51504172 and No. 51474163).
Acknowledgments
The authors would like to acknowledge the financial support from National Science Foundation of China (Grant No. 51504172 and No. 51474163).
Conflicts of Interest
The authors declare no conflicts of interest.
References
- Sambasivam, R. Clogging Resistant Submerged Entry Nozzle Design through Mathematical Modelling. Ironmak. Steelmak. 2006, 33, 439–453. [Google Scholar] [CrossRef]
- Yang, M.L.; Cheng, C.G.; Li, Y.; Lu, H.B.; Yan, J. Development of Control Technology and Clogging Mechanism for Tundish Nozzle in Continuous Casting. J. Iron Steel Res. 2017, 29, 773–780. (In Chinese) [Google Scholar]
- Deng, Z.; Zhu, M.; Zhou, Y.; Du, S.C. Attachment of Alumina on the Wall of Submerged Entry Nozzle during Continuous Casting of Al-Killed Steel. Metall. Mater. Trans. B 2016, 47, 2015–2025. [Google Scholar] [CrossRef]
- Trueba, L.; Peaslee, K.D.; Smith, J.D.; Karakus, M. Effect of Nozzle Base Material on the Rate of Clogging during the Continuous Casting of Aluminum-Killed Steels. Steel Res. Int. 2006, 77, 37–48. [Google Scholar] [CrossRef]
- Zheng, S.; Zhu, M. Study on Mechanism of Large Bubble Formation in Slab Continuous Casting Mould with Argon Blowing. Steel Res. Int. 2008, 79, 918–923. [Google Scholar] [CrossRef]
- Singh, V.; Dash, S.K.; Sunitha, J.S.; Ajmani, S.K.; Das, A.K. Experimental Simulation and Mathematical Modeling of Air Bubble Movement in Slab Caster Mold. ISIJ Int. 2006, 46, 210–218. [Google Scholar] [CrossRef] [Green Version]
- Kubo, N.; Ishii, T.; Kubota, J.; Aramaki, N. Two-phase Flow Numerical Simulation of Molten Steel and Argon Gas in a Continuous Casting Mold. ISIJ Int. 2002, 42, 1251–1258. [Google Scholar] [CrossRef]
- Chong, L.; Luo, Z.G.; Zhang, T.; Deng, S.; Wang, N.; Zou, Z.S. Mathematical Modeling of Multi-Sized Argon Gas Bubbles Motion and its Impact on Melt Flow in Continuous Casting Mold of Steel. J. Iron Steel Res. Int. 2014, 21, 403–407. [Google Scholar]
- Esaka, H.; Kuroda, Y.; Shinozuka, K.; Tamura, M. Interaction between Argon Gas Bubbles and Solidified Shell. ISIJ Int. 2004, 44, 682–690. [Google Scholar] [CrossRef] [Green Version]
- Li, Y.; Deng, A.; Li, H.; Yang, B.; Wang, E. Numerical Study on Flow, Temperature, and Concentration Distribution Features of Combined Gas and Bottom-Electromagnetic Stirring in a Ladle. Metals 2018, 8, 76. [Google Scholar] [CrossRef]
- Yin, Y.; Zhang, J.; Dong, Q.; Li, Y. Modelling on Inclusion Motion and Entrapment during the Full Solidification in Curved Billet Caster. Metals 2018, 8, 1–15. [Google Scholar] [CrossRef]
- Thomas, B.G.; Huang, X.; Sussman, R.C. Simulation of Argon Gas Flow Effects in a Continuous Slab Caster. Metall. Mater. Trans. B 1994, 25B, 527–547. [Google Scholar] [CrossRef]
- Liu, Z.; Li, B.; Jiang, M. Transient Asymmetric Flow and Bubble Transport inside a Slab Continuous-Casting. Metall. Mater. Trans. B 2014, 45, 675–697. [Google Scholar] [CrossRef]
- Kumar, D.S.; Rajendra, T.; Sarkar, A.; Karande, A.K.; Yadav, U.S. Slab Quality Improvement by Controlling Mould Fluid Flow. Ironmak. Steelmak. 2007, 34, 185–191. [Google Scholar] [CrossRef]
- Bai, H.; Thomas, B.G. Two Phase Flow in Tundish Nozzles during Continuous Casting of Steel. Mater. Process. Comput. Age 2000, 3, 85–99. [Google Scholar]
- Bai, H.; Thomas, B.G. Effects of Clogging, Argon Injection, and Continuous Casting Conditions on Flow and Air Aspiration in Submerged Entry Nozzles. Metall. Mater. Trans. B 2001, 32B, 707–722. [Google Scholar] [CrossRef]
- Ni, P.; Wang, D.; Jonsson, L.T.I.; Ersson, M.; Zhang, T.A.; Jonsson, P.G. Numerical and Physical Study on a Cylindrical Tundish Design to Produce a Swirling Flow in the SEN During Continuous Casting of Steel. Metall. Mater. Trans. B 2017, 48, 2695–2706. [Google Scholar] [CrossRef] [Green Version]
- Guan, P.; Jia, L.; Yin, L.; Tan, Z. Effect of Bubble Contact Diameter on Bubble Departure Size in Flow Boiling. Exp. Heat Transf. 2016, 29, 37–52. [Google Scholar] [CrossRef]
Figure 1.
Flow field in the tundish at different times: (a) 0 s; (b) 2 s; (c) 6 s; (d) 8 s; (e) 10 s; (f) 12 s.
Figure 1.
Flow field in the tundish at different times: (a) 0 s; (b) 2 s; (c) 6 s; (d) 8 s; (e) 10 s; (f) 12 s.
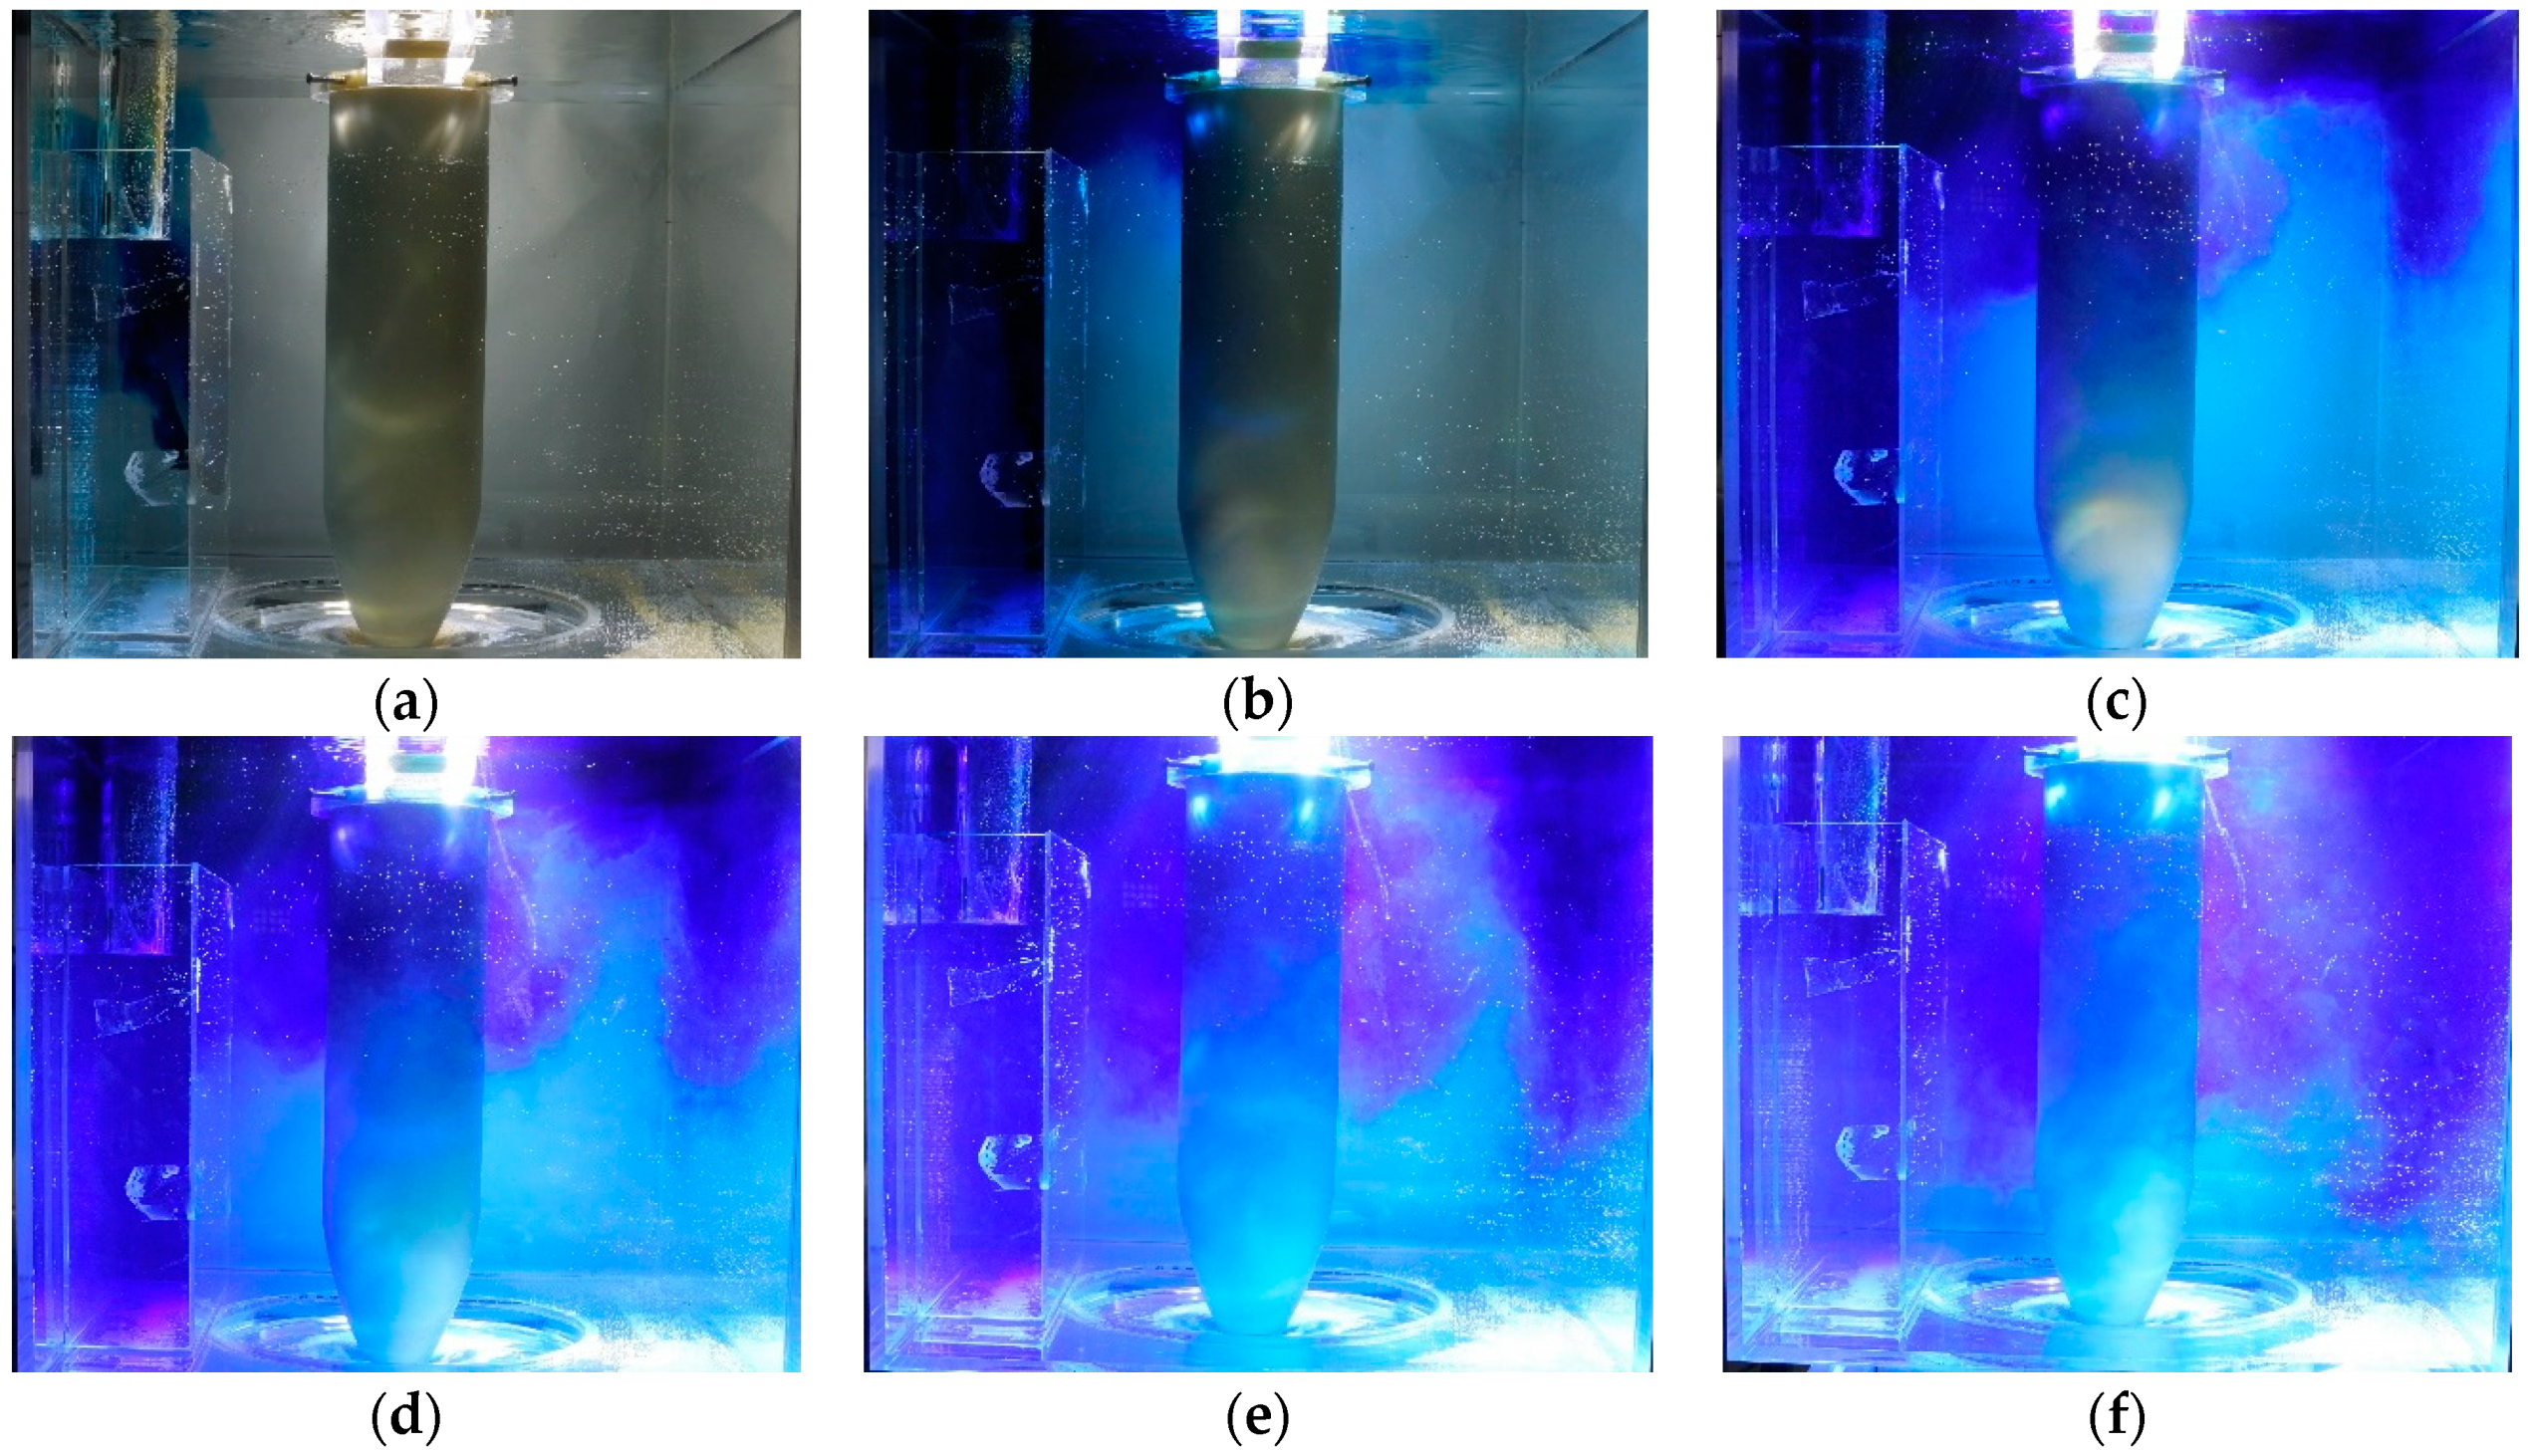
Figure 2.
Tundish nozzle in the water model and the permeable brick component: (a) tundish nozzle in the water model; (b) observation zone; (c) permeable brick component; (d) section size of the permeable brick component.
Figure 2.
Tundish nozzle in the water model and the permeable brick component: (a) tundish nozzle in the water model; (b) observation zone; (c) permeable brick component; (d) section size of the permeable brick component.
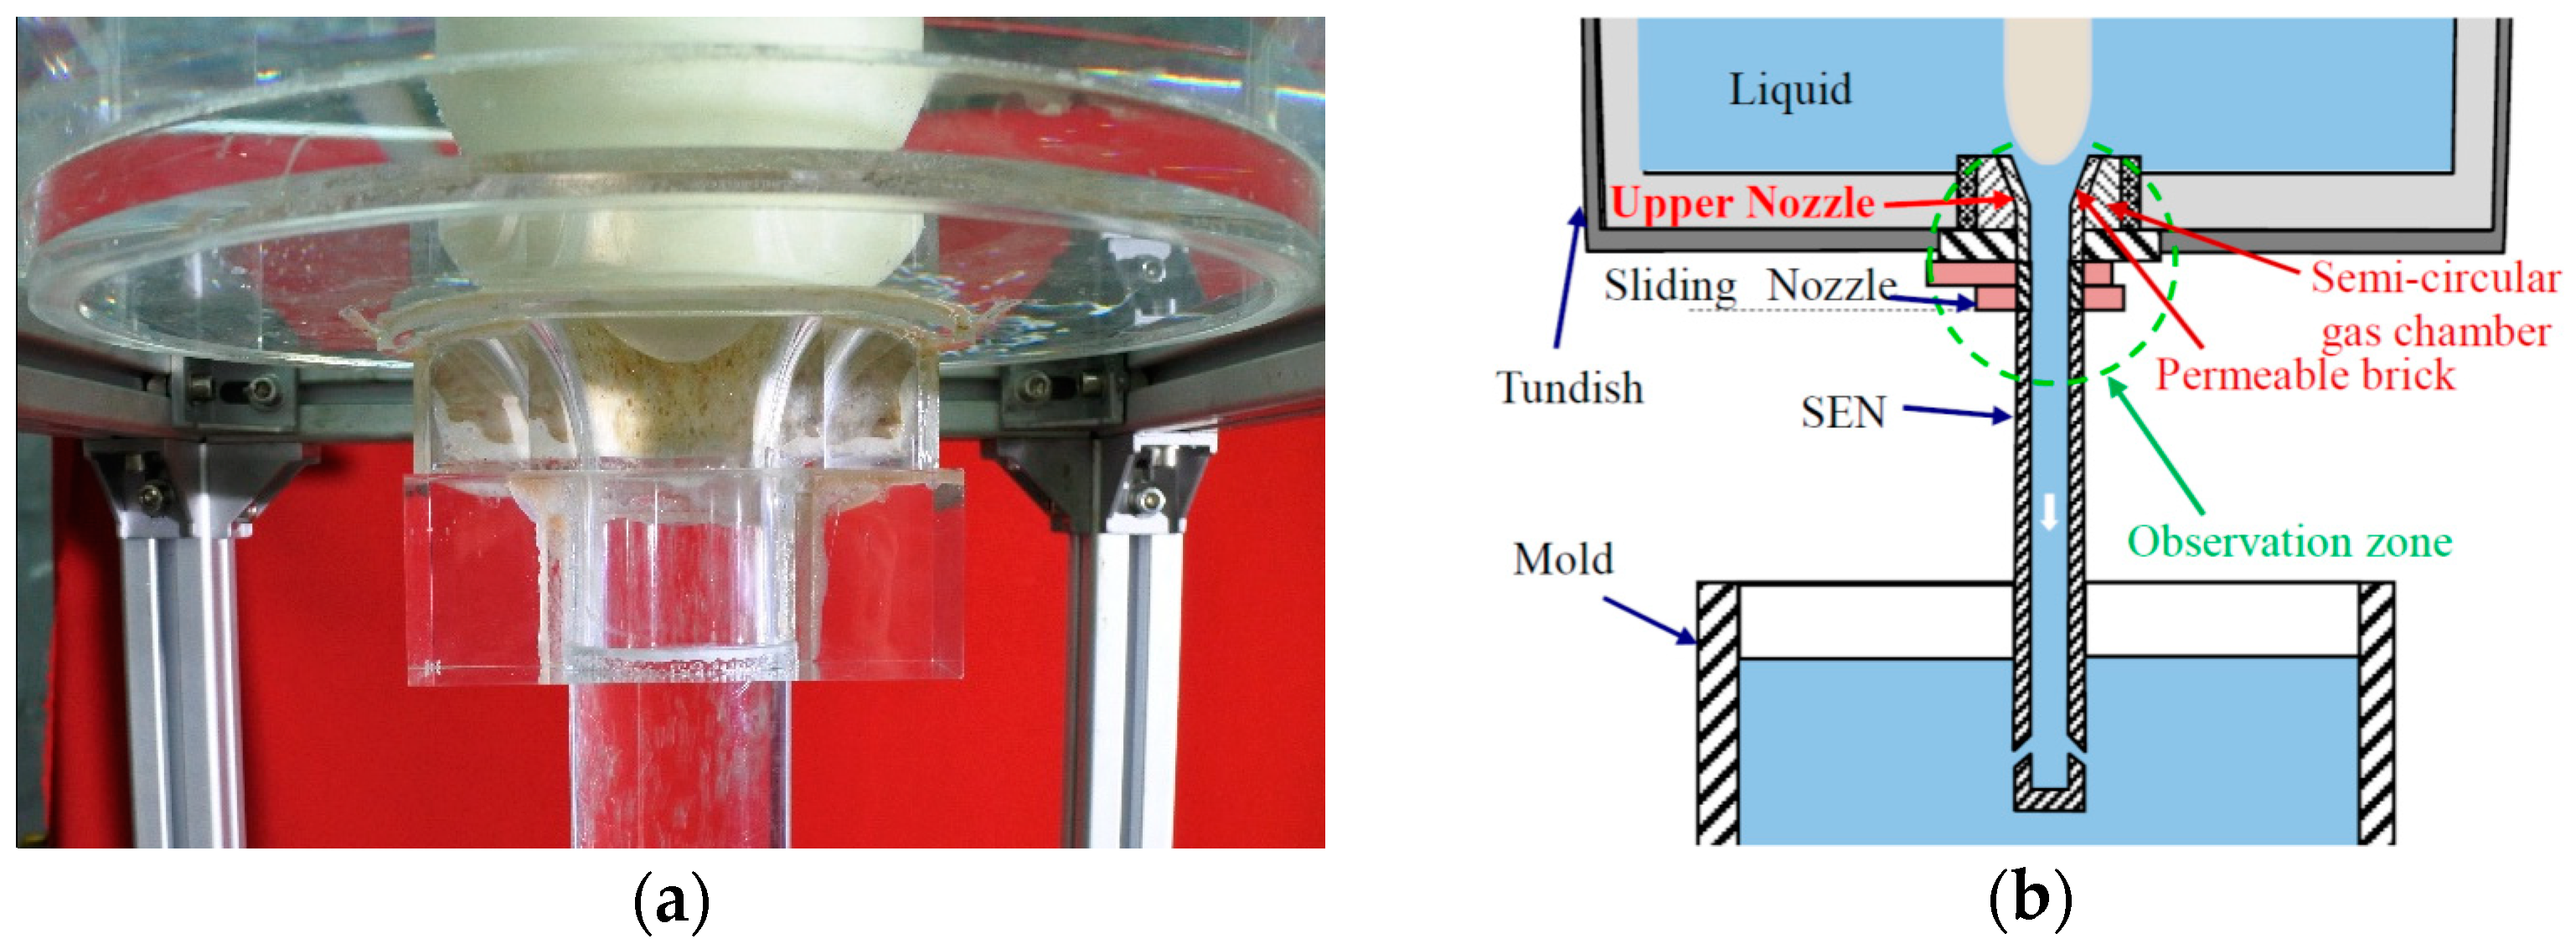
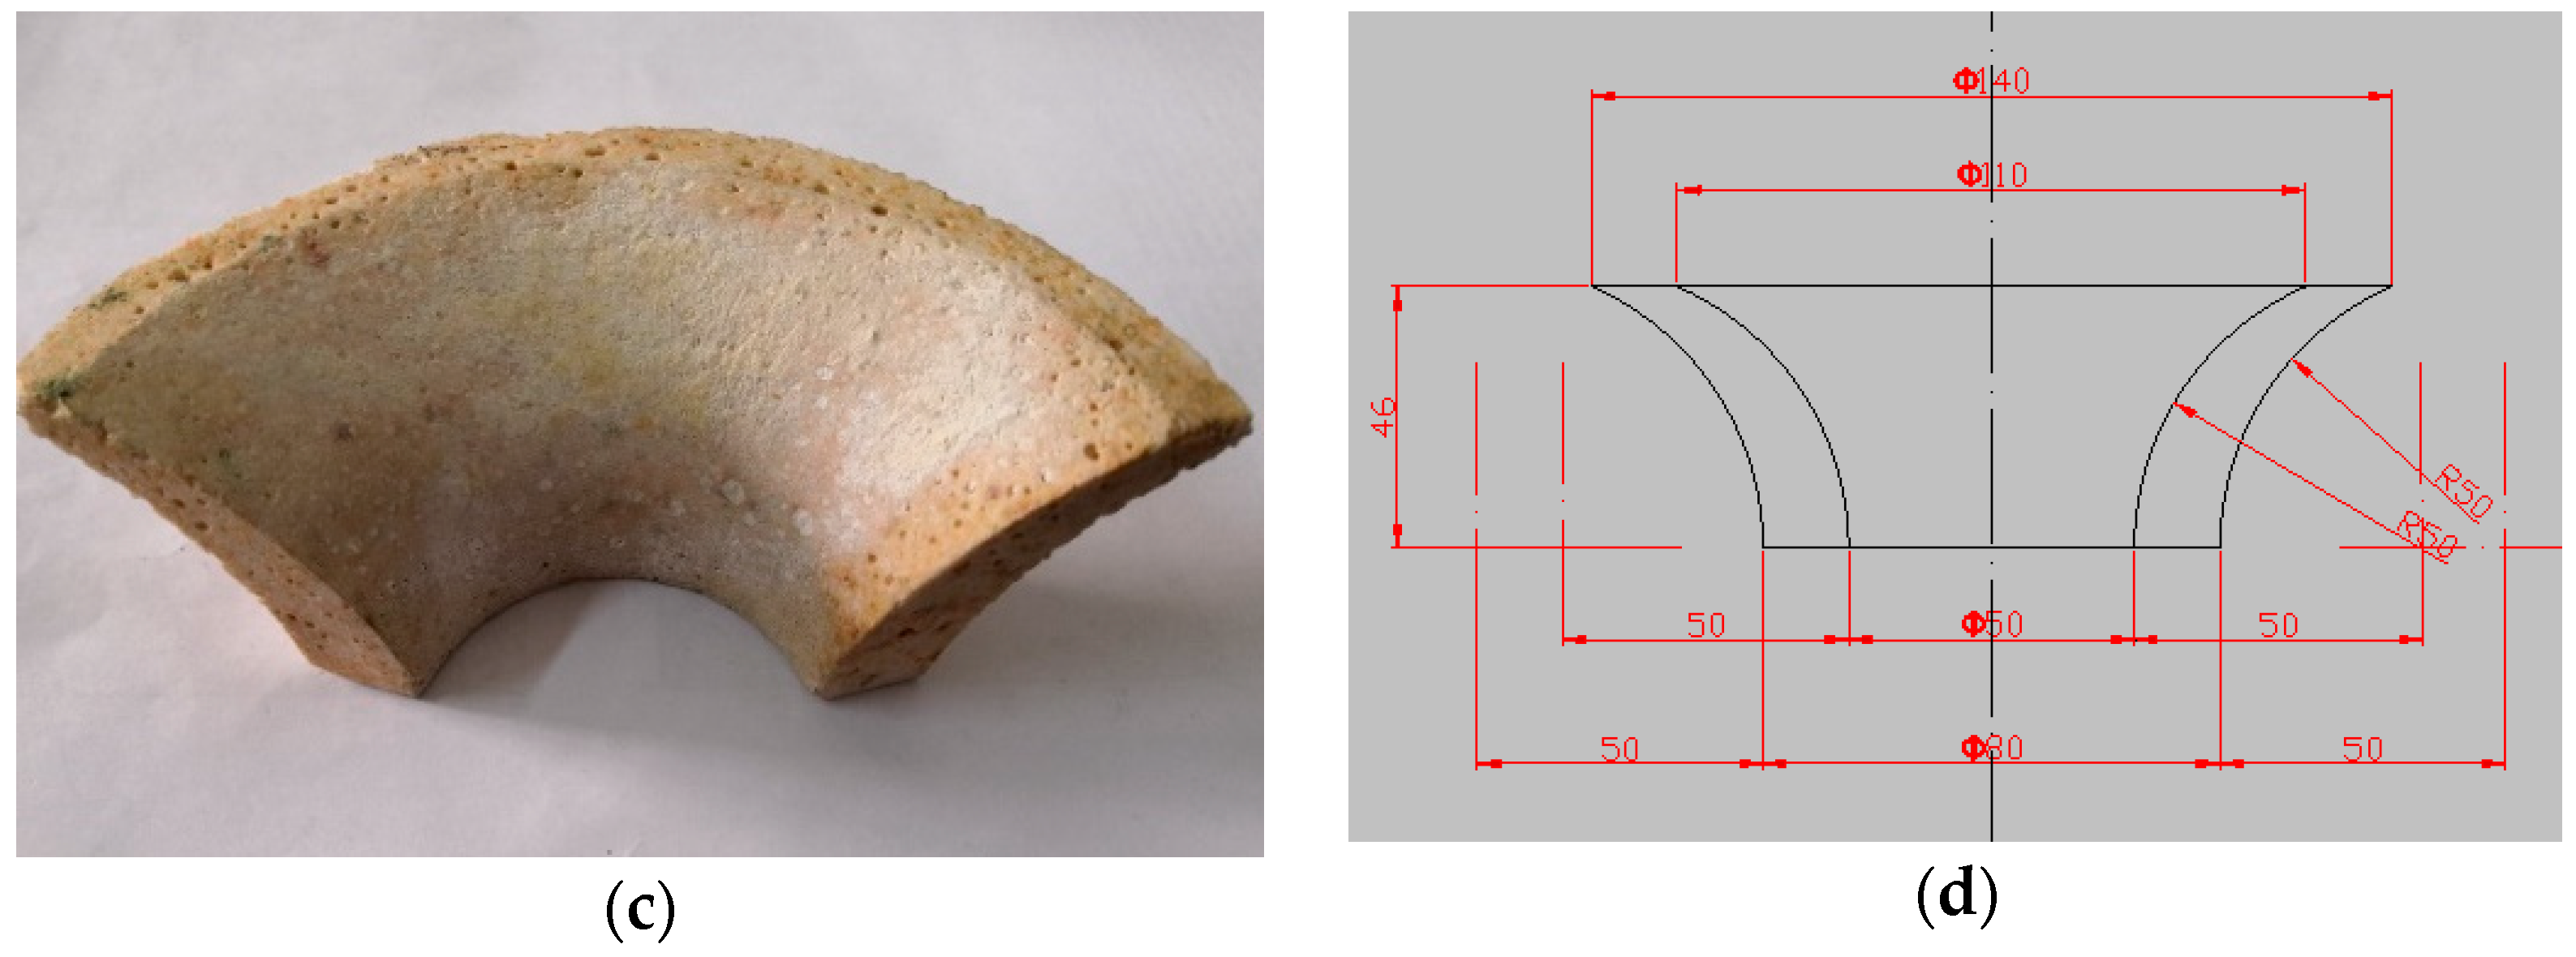
Figure 3.
Experimental device of the water model: (a) schematic diagram of the experimental device; (b) photo of the experimental device.
Figure 3.
Experimental device of the water model: (a) schematic diagram of the experimental device; (b) photo of the experimental device.
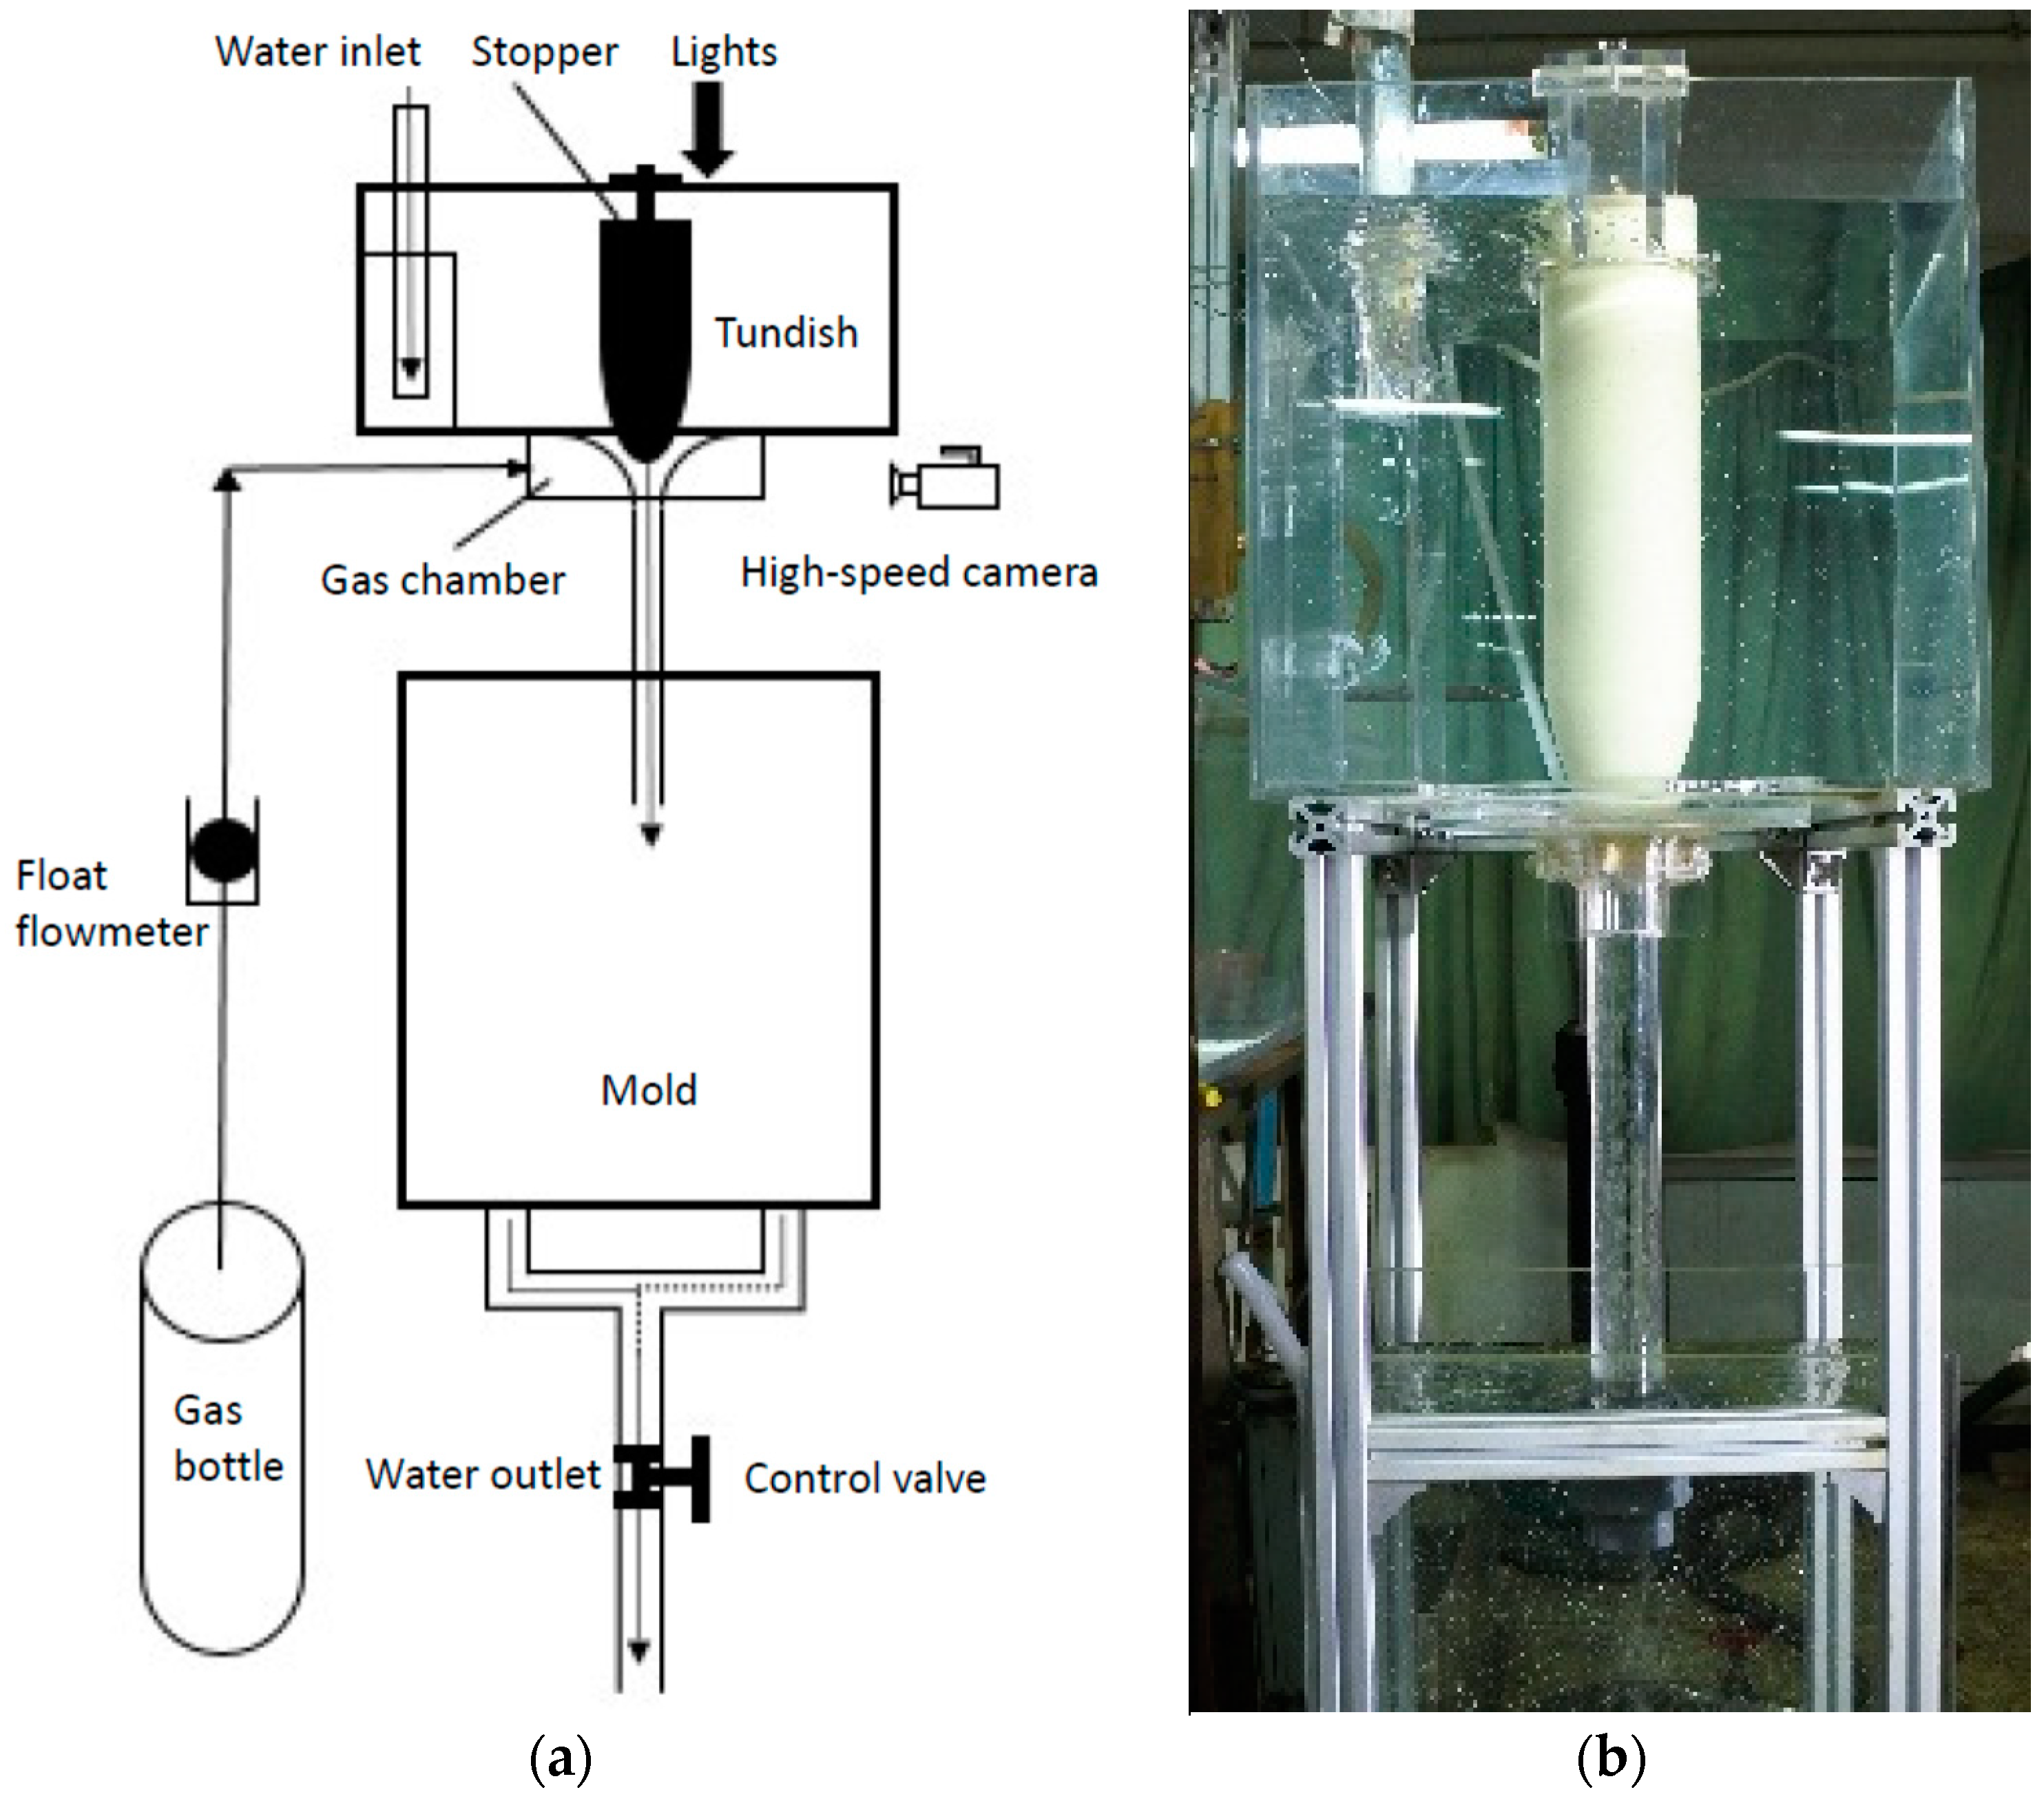
Figure 4.
Operating interface of measuring software: (a) Nano Measurer; (b) Molysis.
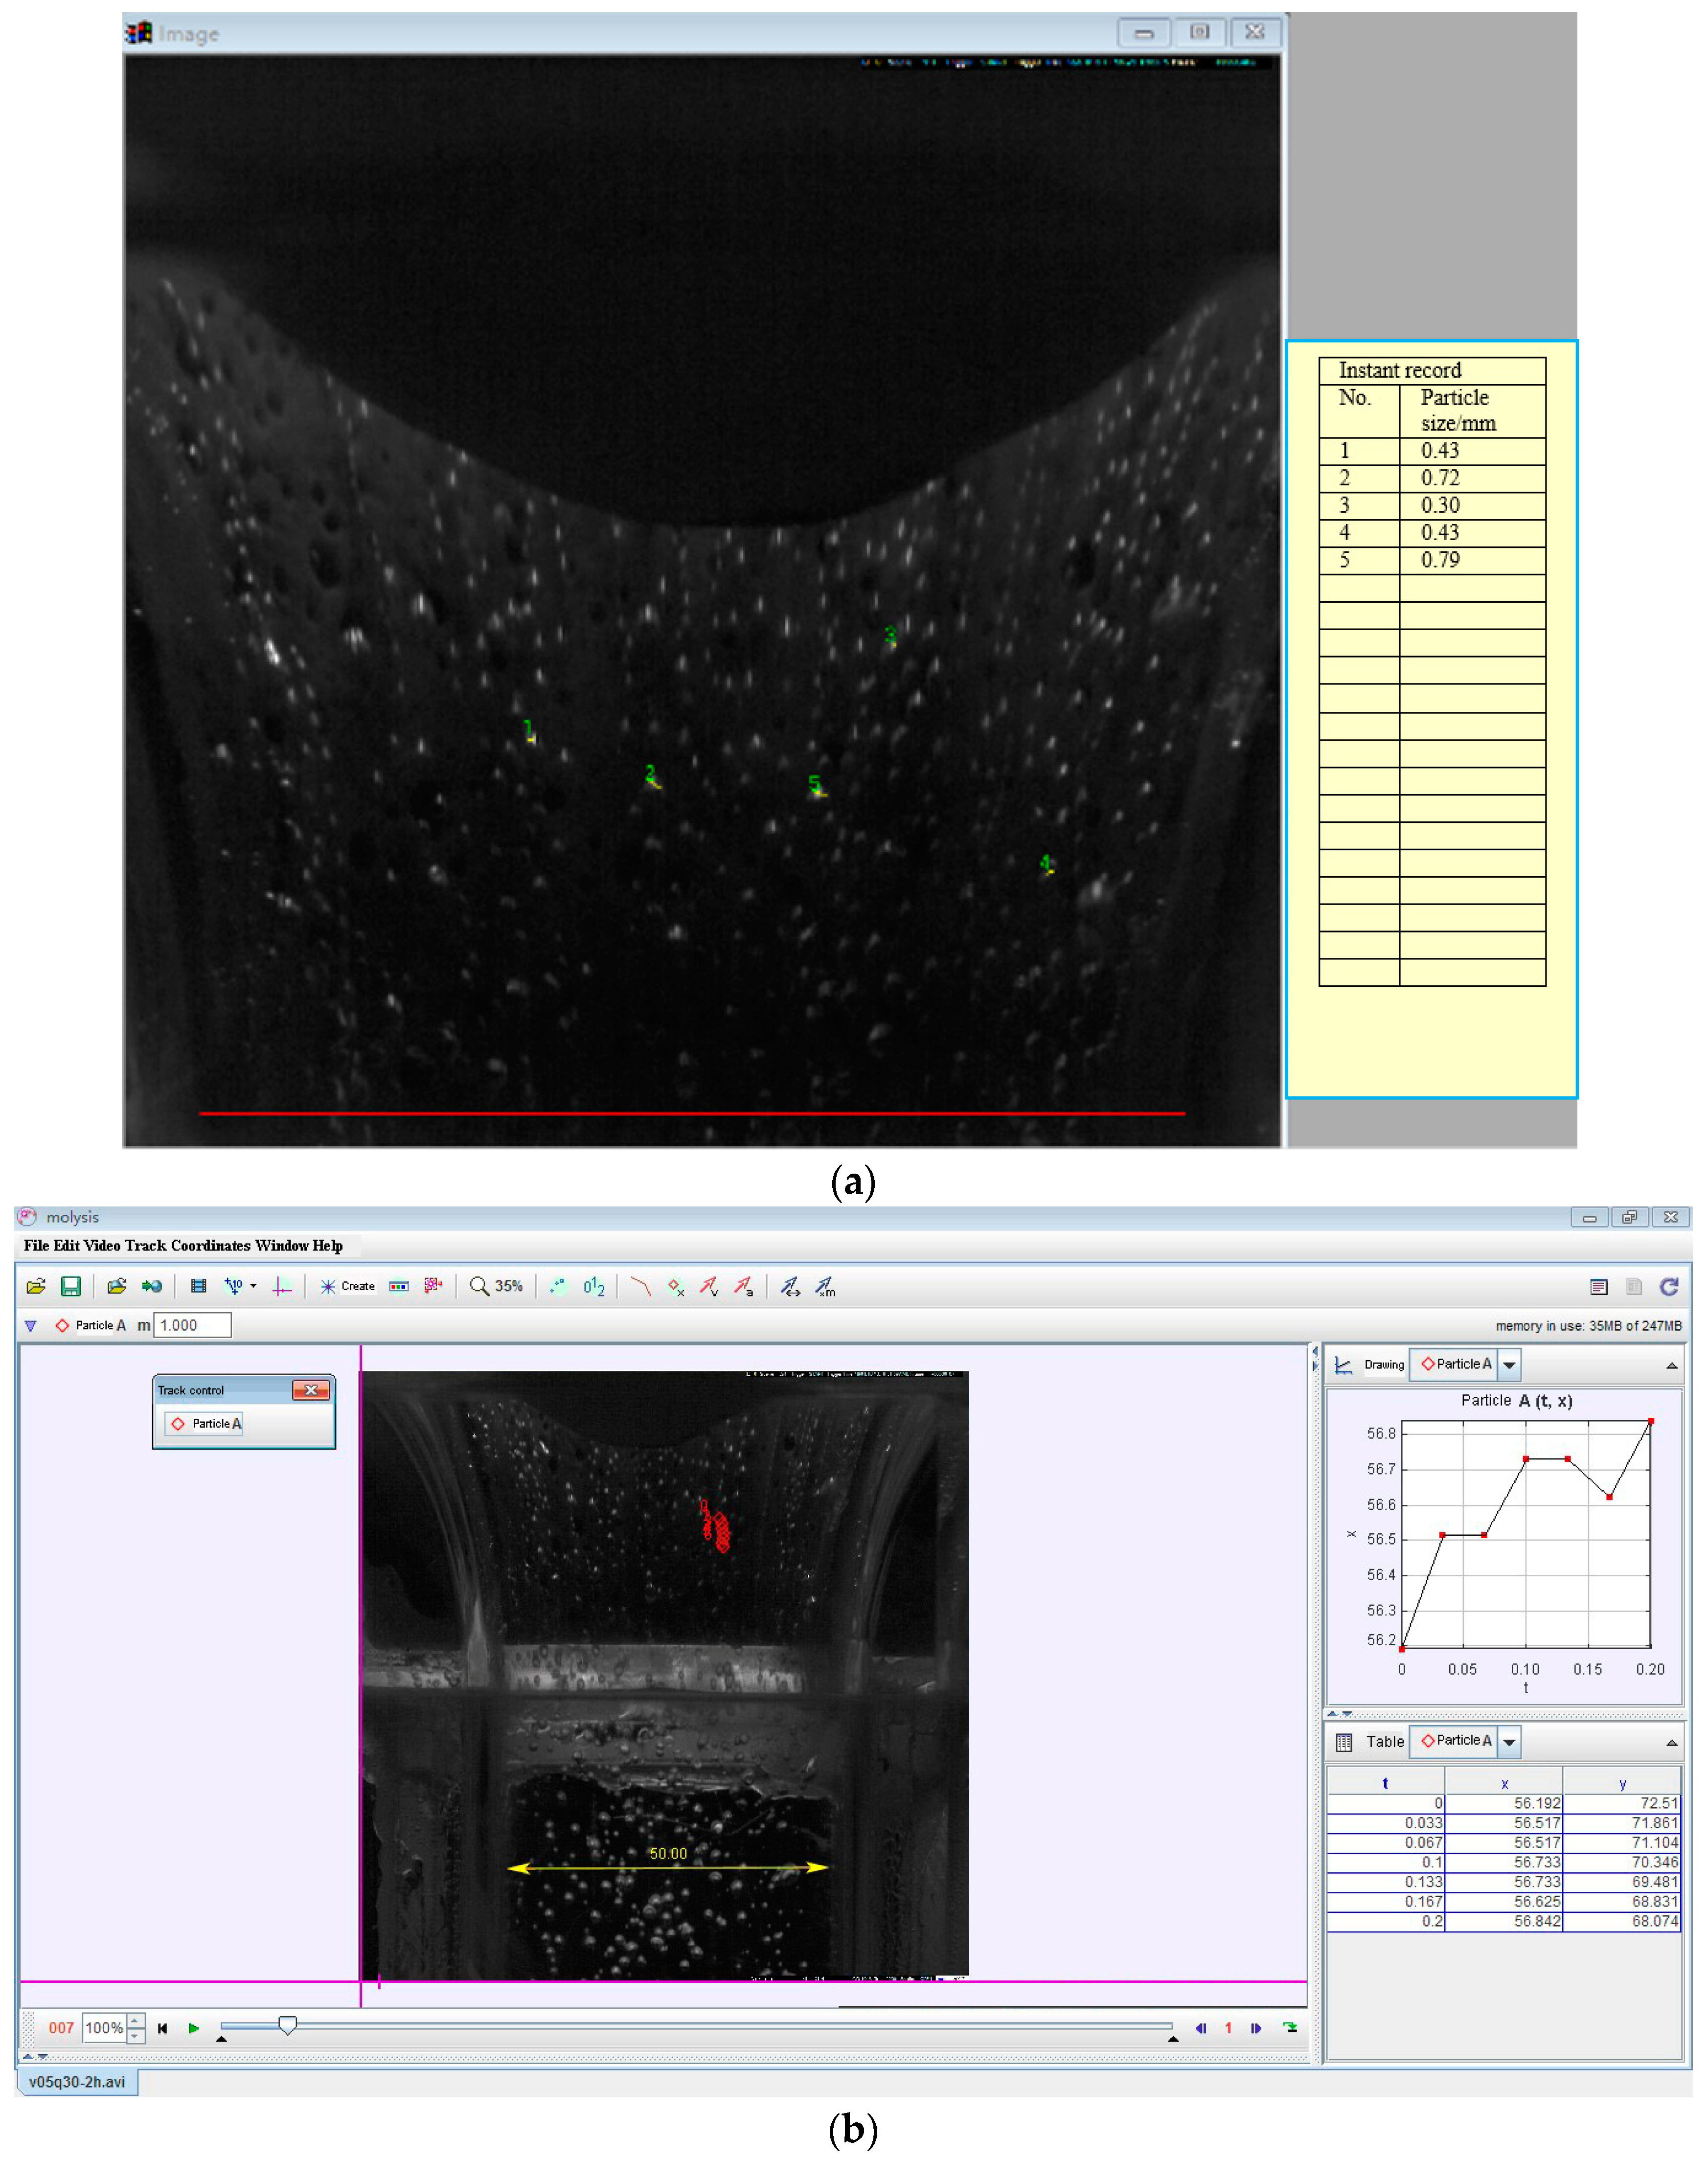
Figure 5.
Distribution of argon bubbles on the inner surface of nozzle for different argon flow rates: (a) 8 L/h; (b) 16 L/h; (c) 24 L/h; (d) 32 L/h; (e) 40 L/h; (f) 50 L/h; (g) 100 L/h; (h) 150 L/h; (i) 200 L/h.
Figure 5.
Distribution of argon bubbles on the inner surface of nozzle for different argon flow rates: (a) 8 L/h; (b) 16 L/h; (c) 24 L/h; (d) 32 L/h; (e) 40 L/h; (f) 50 L/h; (g) 100 L/h; (h) 150 L/h; (i) 200 L/h.
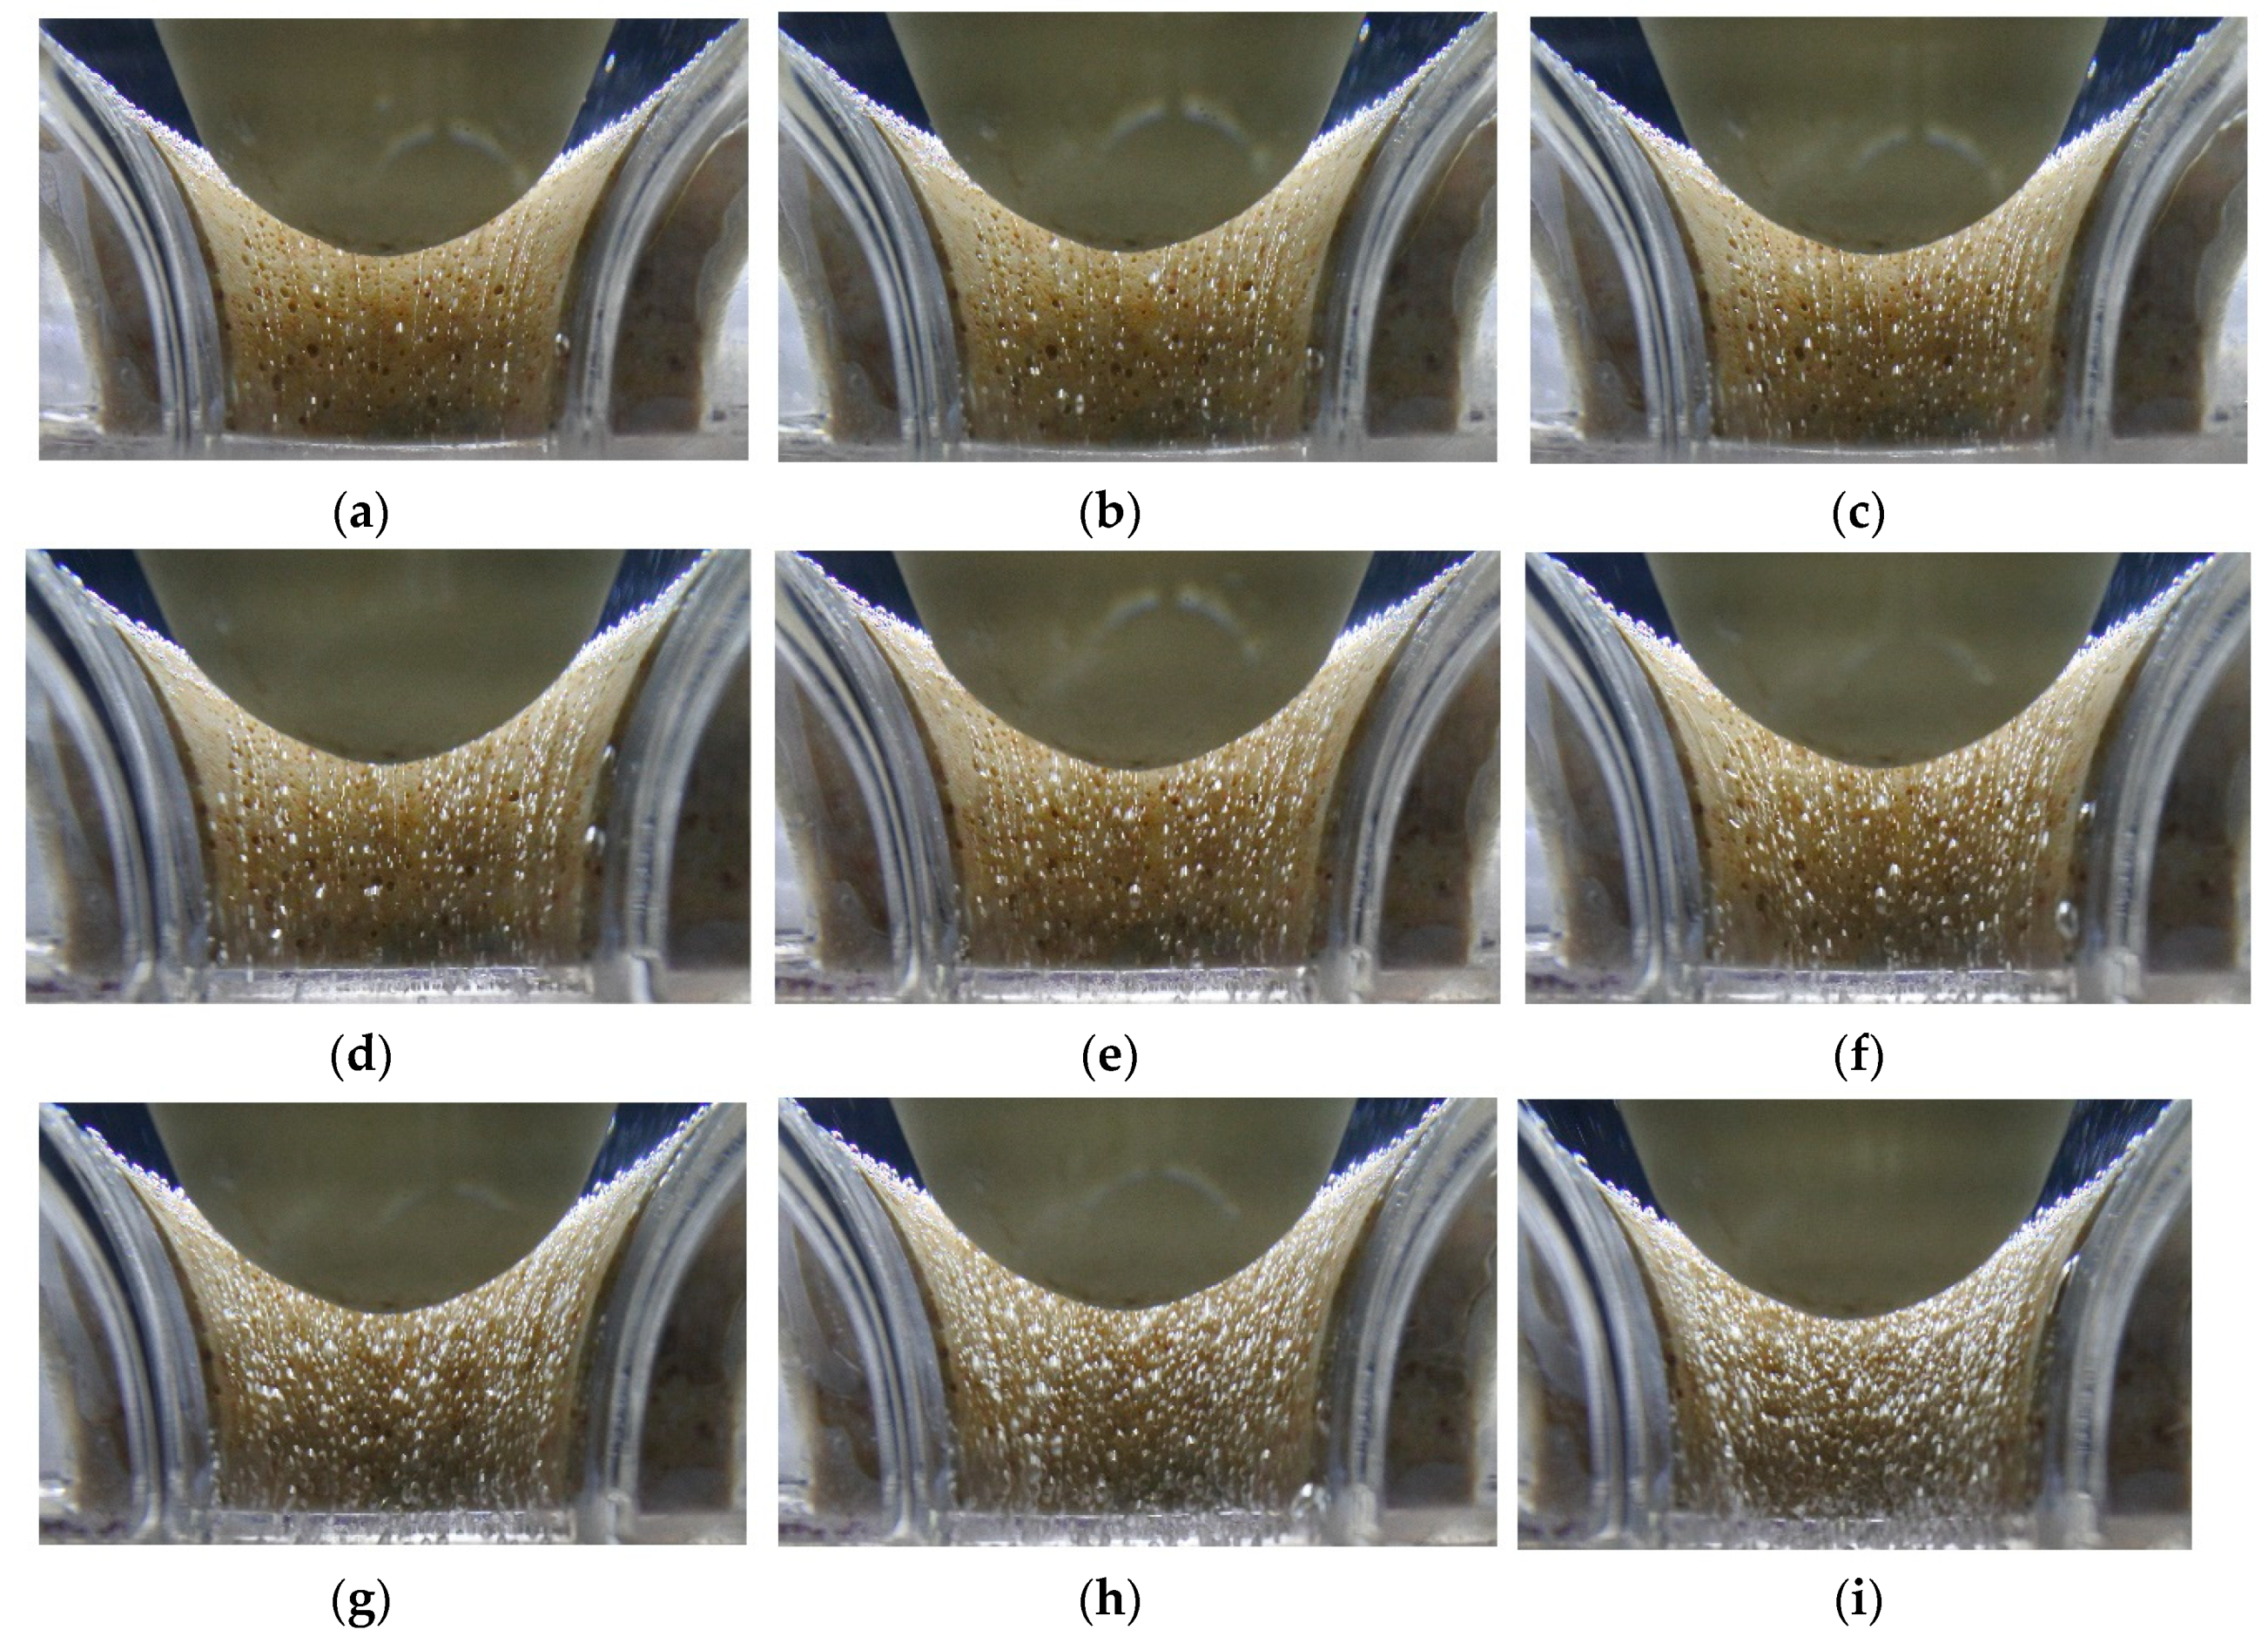
Figure 6.
Average diameter of argon bubbles on the inner surface of the nozzle for different argon flow rates.
Figure 6.
Average diameter of argon bubbles on the inner surface of the nozzle for different argon flow rates.

Figure 7.
Distribution of argon bubbles on the inner surface of the nozzle for different casting speeds: (a) 0.4 m/min; (b) 0.5 m/min; (c) 0.6 m/min.
Figure 7.
Distribution of argon bubbles on the inner surface of the nozzle for different casting speeds: (a) 0.4 m/min; (b) 0.5 m/min; (c) 0.6 m/min.
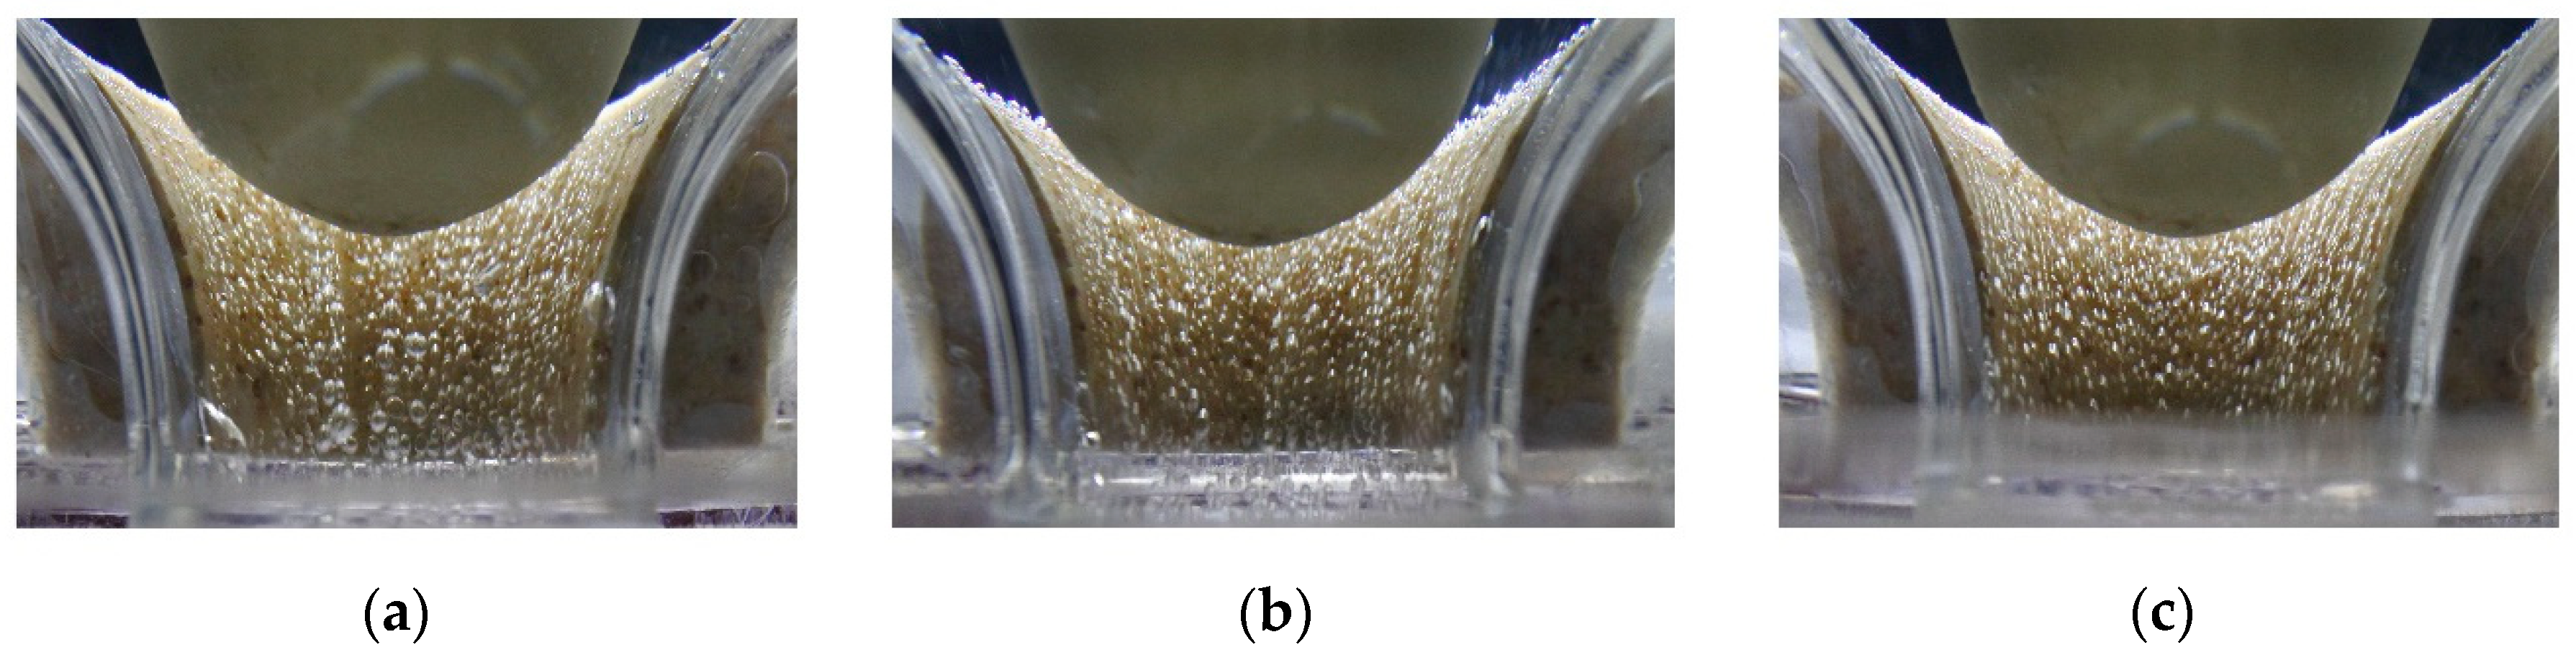
Figure 8.
Average diameter of argon bubbles on the inner surface of the nozzle for different casting speeds.
Figure 8.
Average diameter of argon bubbles on the inner surface of the nozzle for different casting speeds.
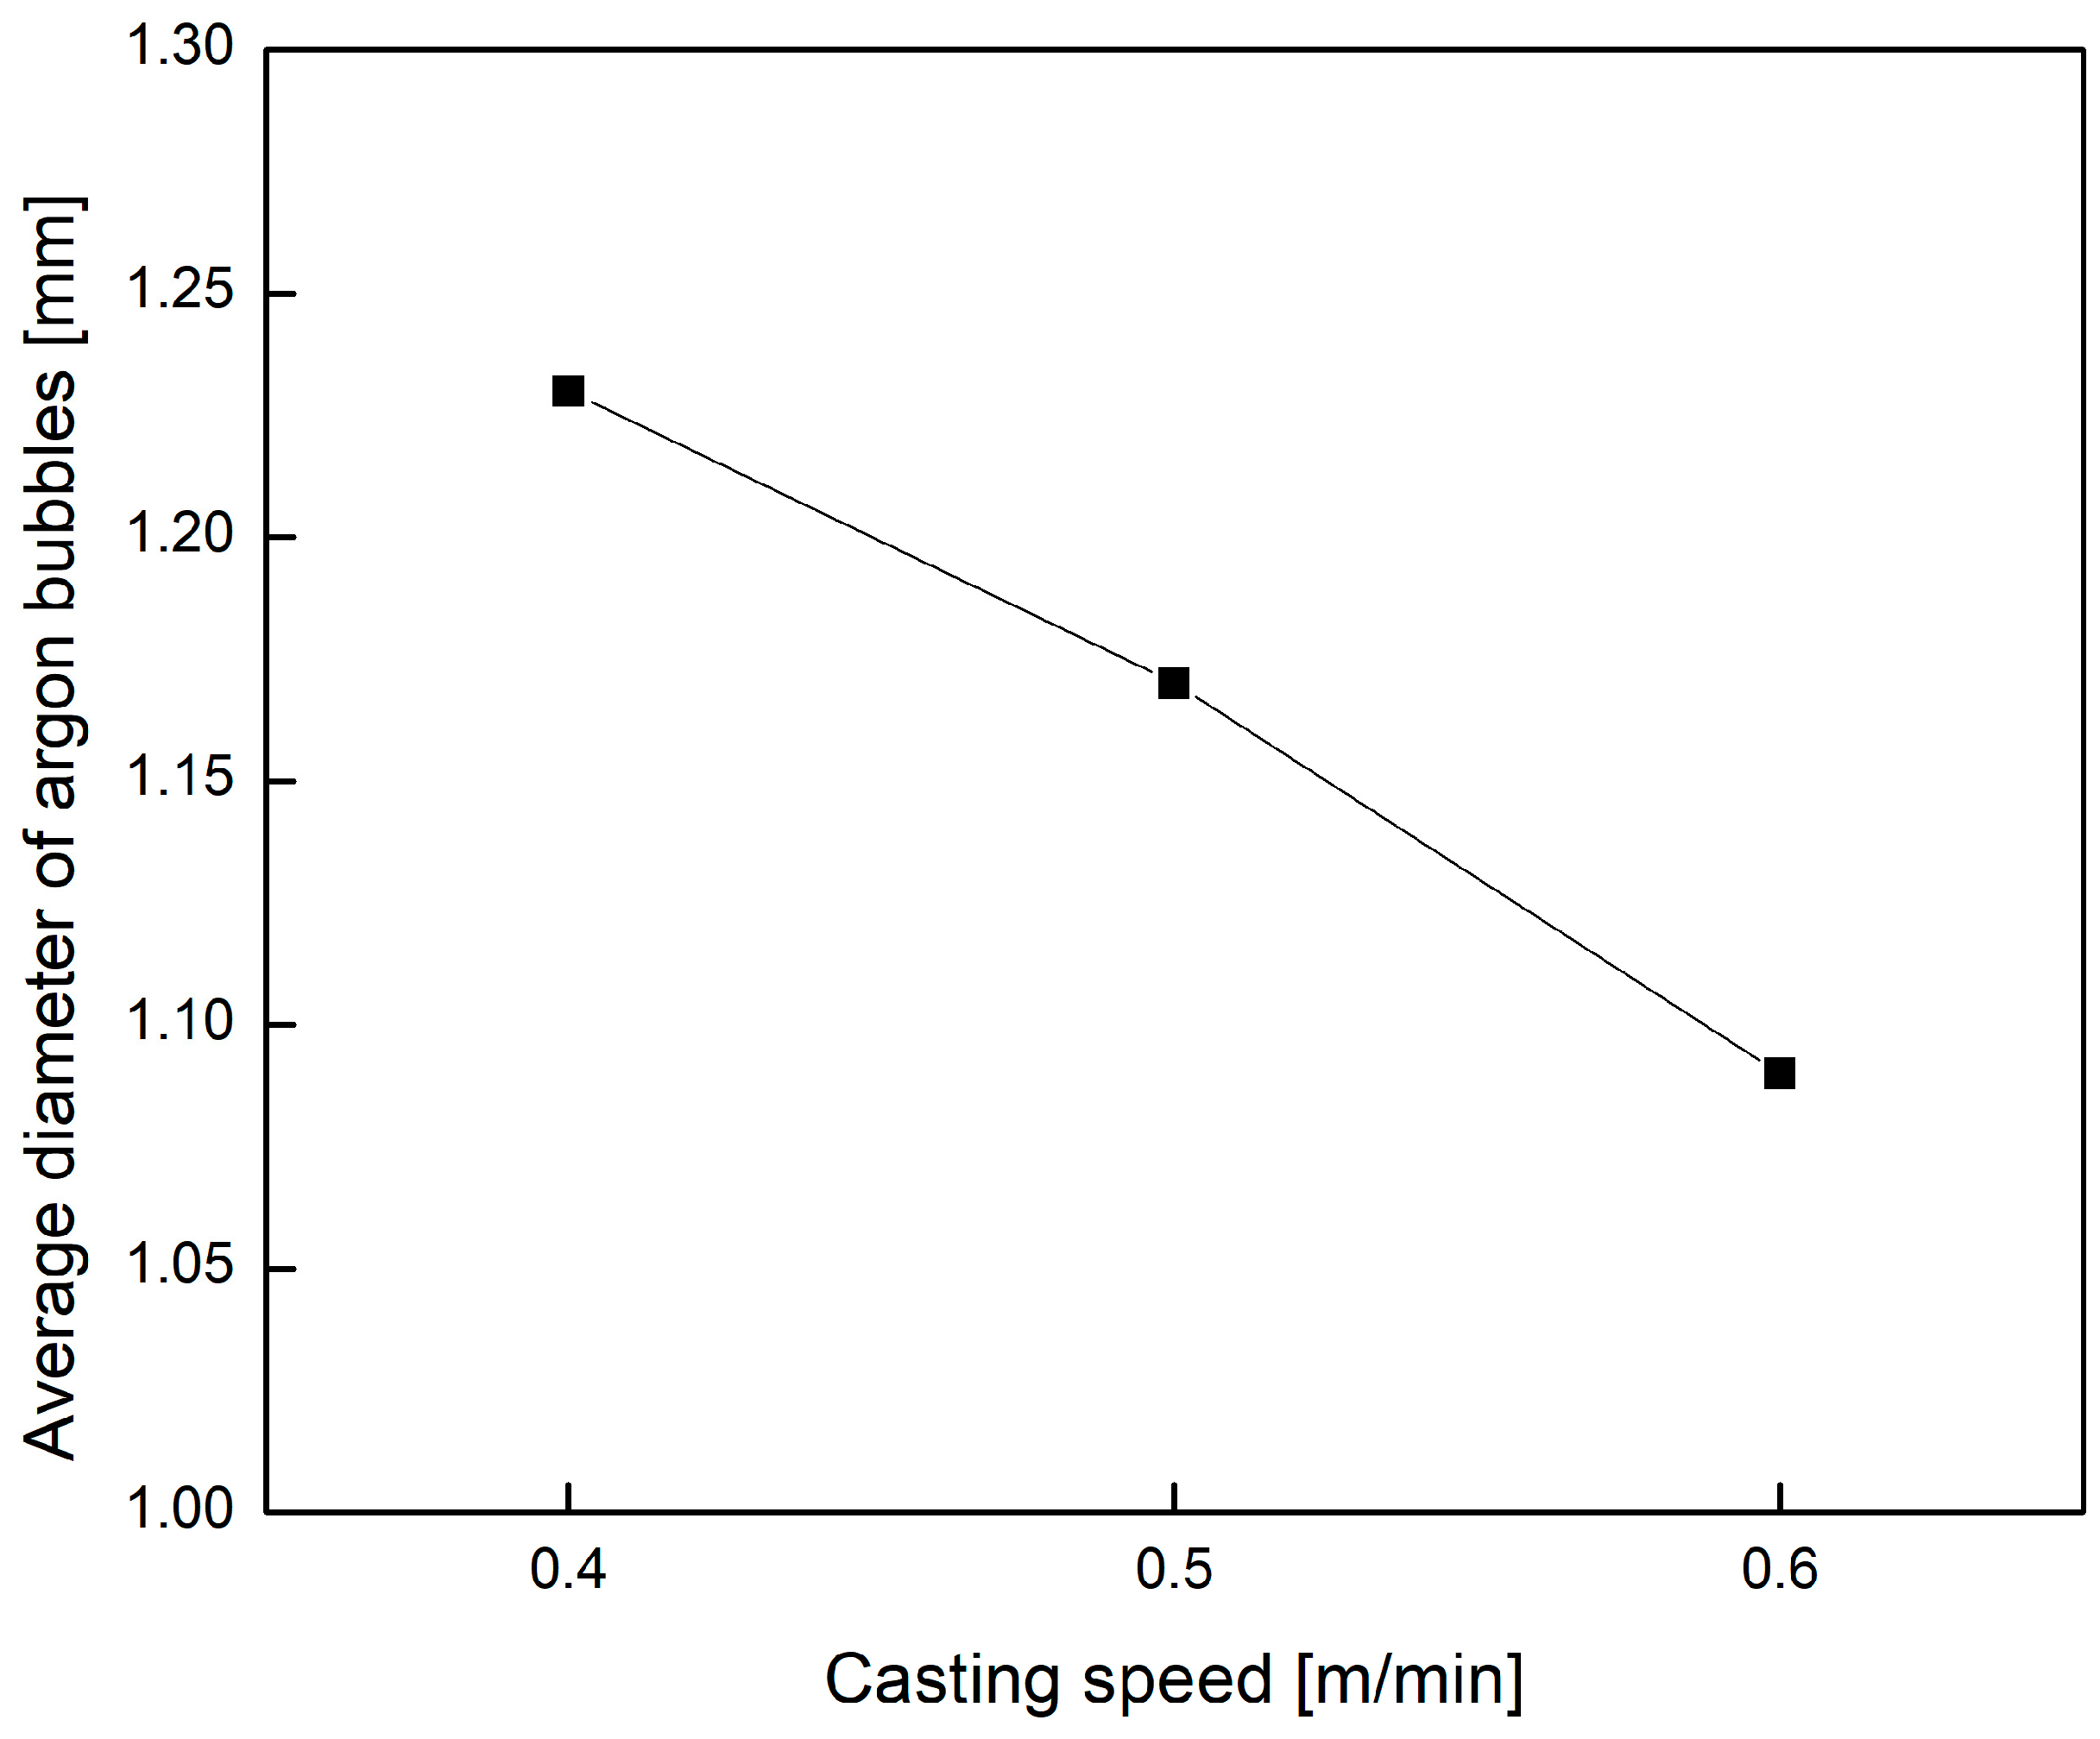
Figure 9.
Different heights of representative micropores generating bubbles.

Figure 10.
Average velocities of argon bubbles at different heights with different casting speeds.
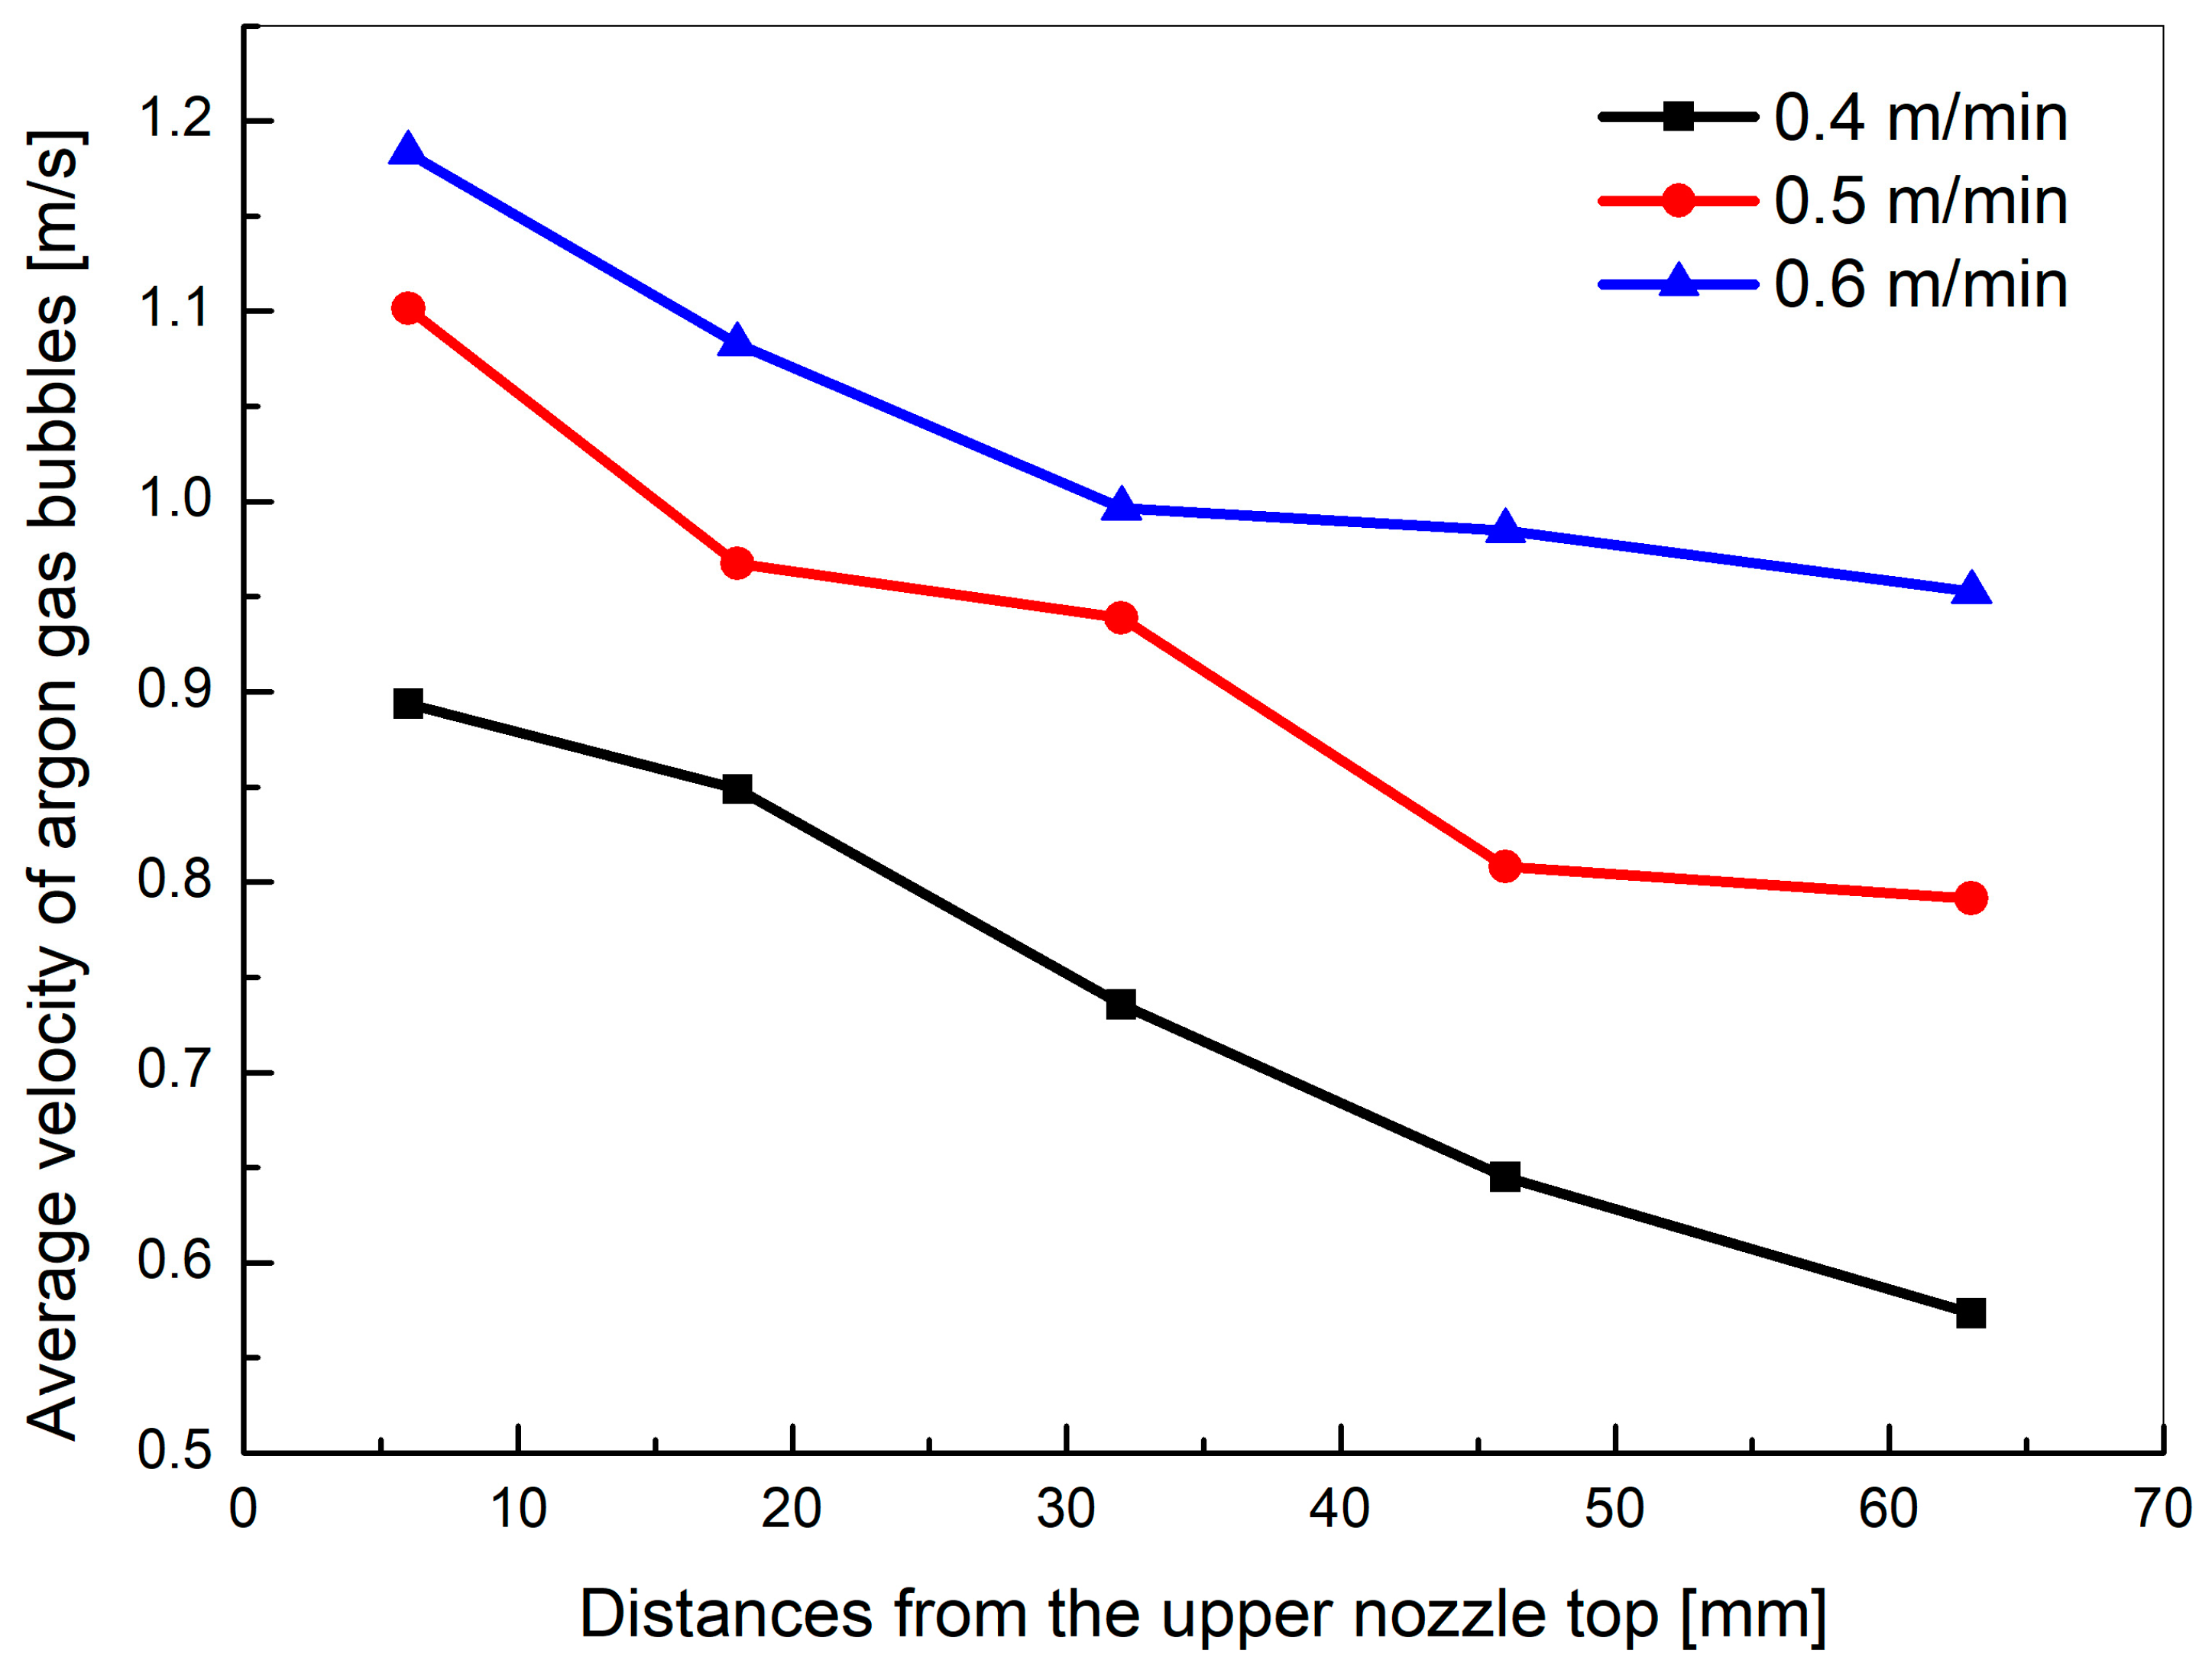
Figure 11.
Average velocities of argon bubbles at different heights for different argon flow rates.
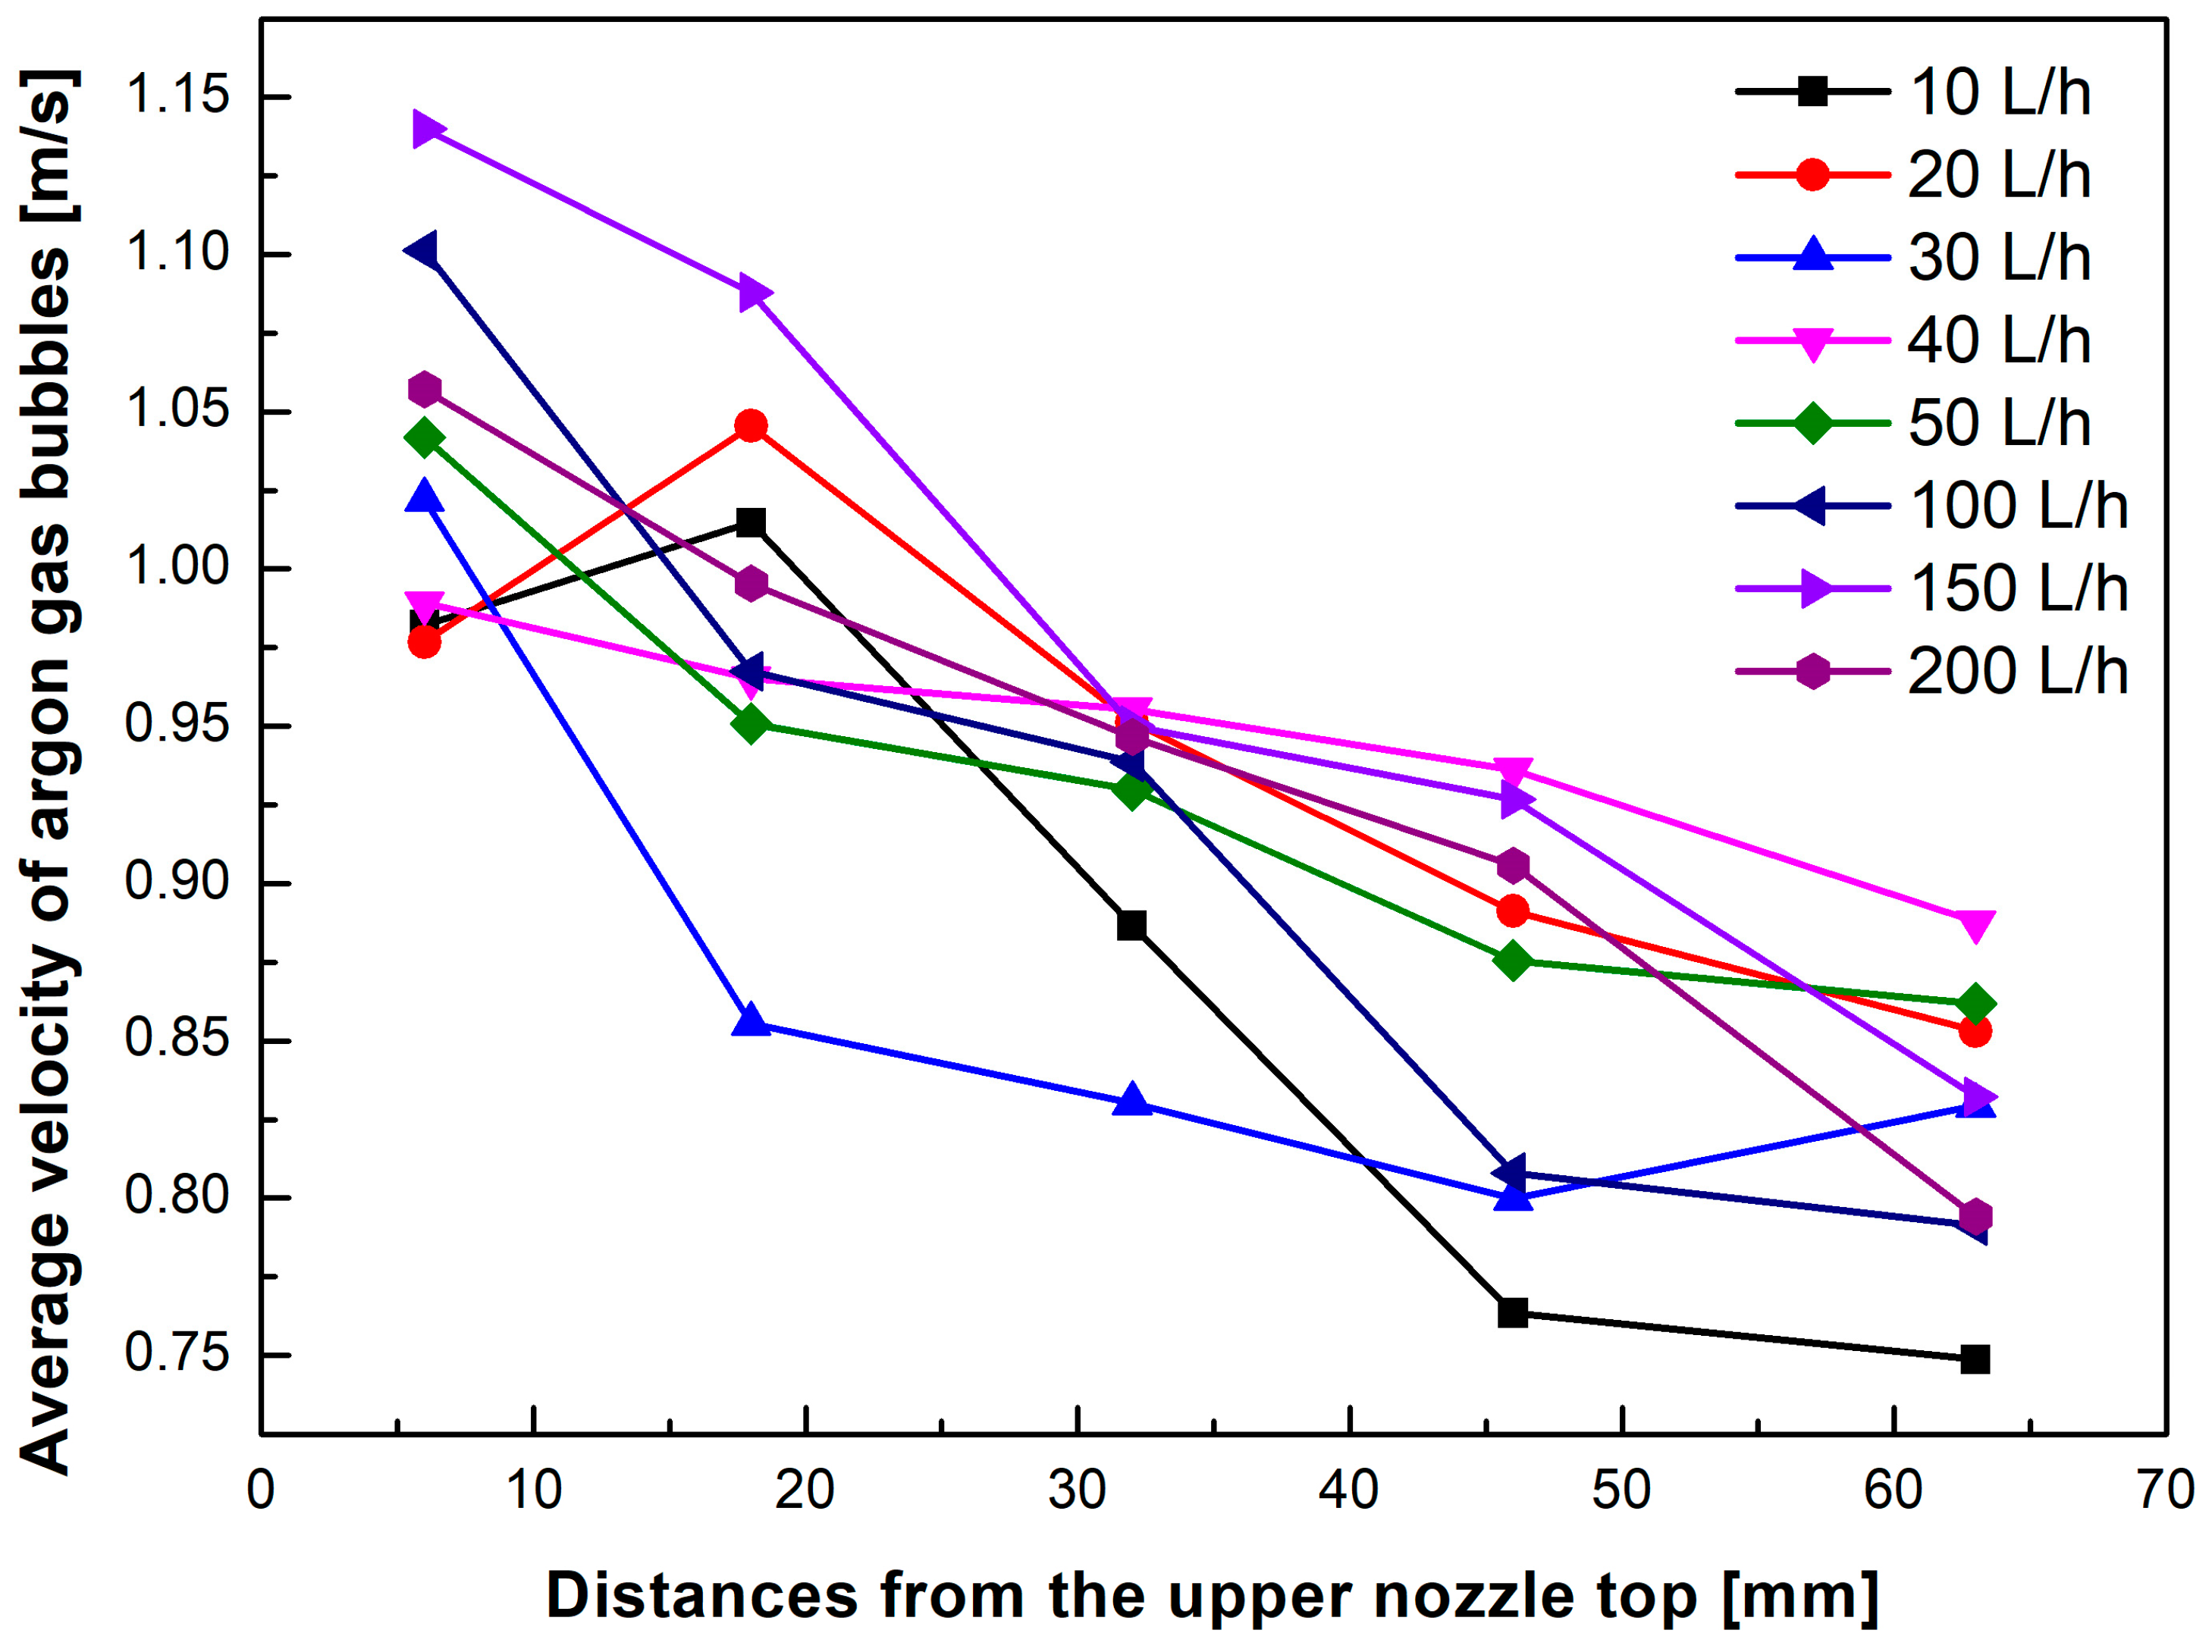
Figure 12.
Schematic diagram of representative pores to measure the distances from bubble chains on the inner surface of the nozzle.
Figure 12.
Schematic diagram of representative pores to measure the distances from bubble chains on the inner surface of the nozzle.
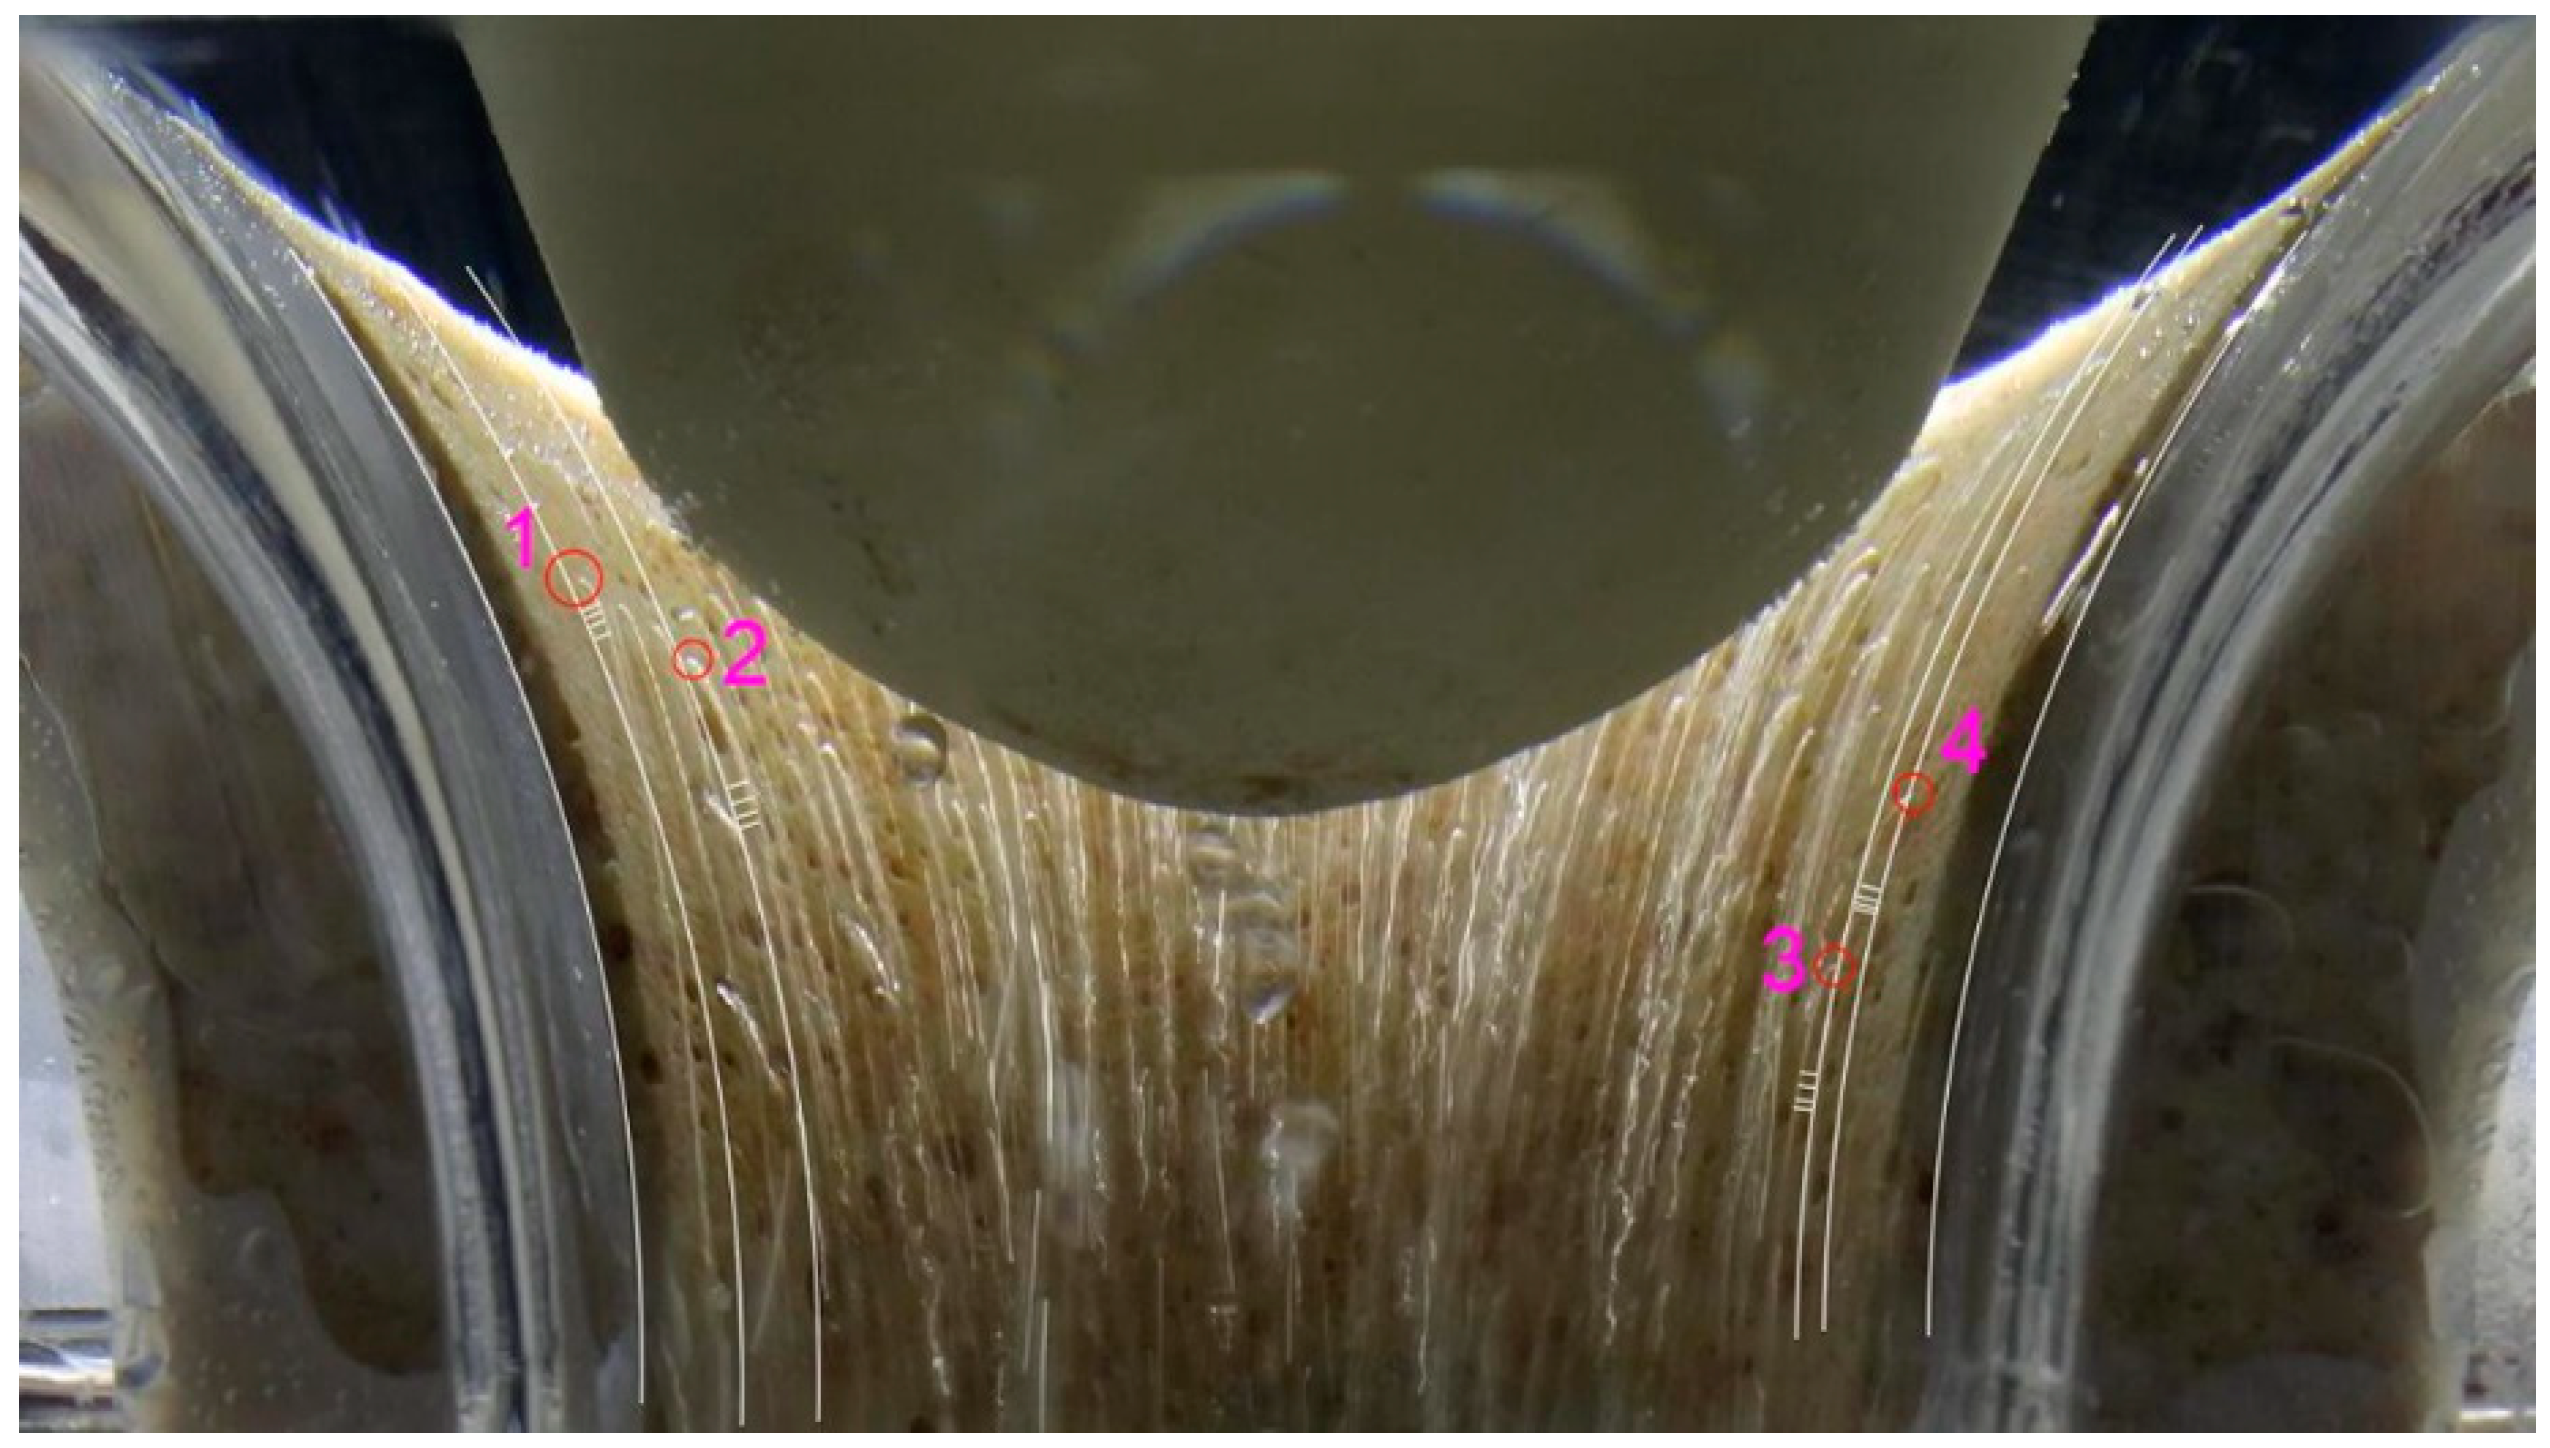
Figure 13.
Measured distances from bubble chains to the inner surface of the nozzle for different casting speeds and argon flow rates: (a) Micropore 1; (b) Micropore 2; (c) Micropore 3; (d) Micropore 4.
Figure 13.
Measured distances from bubble chains to the inner surface of the nozzle for different casting speeds and argon flow rates: (a) Micropore 1; (b) Micropore 2; (c) Micropore 3; (d) Micropore 4.

Table 1.
Experimental scheme of the water model and process conditions.
| Case | Actual Process Conditions | Water Model Parameters | ||
|---|---|---|---|---|
| Casting Speed, m/min | Argon Flow Rate, L/h | Water Flow Rate, L/h | Argon Flow Rate, L/h | |
| 1 | 0.5 | 120–180 | 6000 | 8, 16, 24, 32, 40, 50, 100, 150, 200 |
| 2 | 0.4 | 4800 | 50, 100, 150, 200 | |
| 3 | 0.6 | 7200 | 50, 100, 150, 200 | |
© 2018 by the authors. Licensee MDPI, Basel, Switzerland. This article is an open access article distributed under the terms and conditions of the Creative Commons Attribution (CC BY) license (http://creativecommons.org/licenses/by/4.0/).
Share and Cite
MDPI and ACS Style
Li, Y.; Cheng, C.; Yang, M.; Dong, Z.; Xue, Z. Behavior Characteristics of Argon Bubbles on Inner Surface of Upper Tundish Nozzle during Argon Blowing Process. Metals 2018, 8, 590. https://doi.org/10.3390/met8080590
AMA Style
Li Y, Cheng C, Yang M, Dong Z, Xue Z. Behavior Characteristics of Argon Bubbles on Inner Surface of Upper Tundish Nozzle during Argon Blowing Process. Metals. 2018; 8(8):590. https://doi.org/10.3390/met8080590
Chicago/Turabian StyleLi, Yang, Changgui Cheng, Minglei Yang, Zhixuan Dong, and Zhengliang Xue. 2018. "Behavior Characteristics of Argon Bubbles on Inner Surface of Upper Tundish Nozzle during Argon Blowing Process" Metals 8, no. 8: 590. https://doi.org/10.3390/met8080590
Note that from the first issue of 2016, this journal uses article numbers instead of page numbers. See further details here.