Modeling Bake Hardening Effects in Steel Sheets—Application to Dent Resistance
by
 ,
,
Sandrine Thuillier
1,* ,
,
Shun-Lai Zang
2,
Julien Troufflard
1,
Pierre-Yves Manach
1 and
Anthony Jegat
1 1
Univ. Bretagne Sud, UMR CNRS 6027, IRDL, F-56100 Lorient, France
2
Key Laboratory of Education Ministry for Modern Design and Rotor-Bearing System, Xi’an Jiaotong University, No. 28 Xianning Road, Xi’an 710049, China
*
Author to whom correspondence should be addressed.
Metals 2018, 8(8), 594; https://doi.org/10.3390/met8080594
Submission received: 4 July 2018
/
Revised: 21 July 2018
/
Accepted: 24 July 2018
/
Published: 30 July 2018
(This article belongs to the Special Issue Modelling and Simulation of Sheet Metal Forming Processes)
Abstract
:This study is dedicated to the experimental characterisation and phenomenological modeling of the bake hardening effect of a thin steel sheet, to predict the static dent resistance and perform an experimental validation on a bulged part. In a first step, rectangular samples are submitted to a thermo-mechanical loading to characterise the bake hardening magnitude in tension. A three-step procedure is considered, involving first a pre-strain in tension up to several values followed by unloading. Secondly, a heat treatment during a fixed time and a given temperature is performed, and finally, a reloading in tension in the same direction as the pre-strain is applied. Then, a specific device is developed to perform dent tests on a bulged specimen, to evaluate the influence of bake hardening on the dent resistance. A three-step procedure is also considered, with a pre-strain applied with a hydraulic bulge test followed by a heat treatment and then static dent test at the maximum dome height. An original phenomenological model is proposed to represent the yield stress increase after the heat treatment and the second reloading. Material parameters are identified from the tensile tests and are input data to a finite element model. The numerical prediction of the load evolution during the dent test is then compared with experimental data and shows an overall good correlation.

1. Introduction
Outer automotive panels may be subjected during their service life to the high or low velocity impact of a projectile, the size of which is small compared to the panel dimensions. The resistance of the part to such an impact, or dent resistance, is a major industrial concern. It has led to several academic studies, using specific devices to reproduce at the laboratory scale the impact of the projectile either under static or dynamic conditions. In most of these studies, thin sheet structures are subjected locally to the action of an indenter under an applied load of a few hundreds newtons. For example, large and doubly curved drawn parts representative of a roof panel are submitted in their middle to the action of a flat headed indenter [1]; or a trimmed sample and a hemispherical indenter are used in [2]. The dent resistance is defined as the load corresponding to a permanent dent depth of 0.1 mm. In the area in contact with the indenter, the sheet is subjected to stretching and highly localised plastic strain, whereas the remaining zones are mostly drawn and deformed elastically. The characteristics load-deflection curve of dent tests is highly non linear and exhibits a significant hysteresis, highlighting the non-reversibility of the test [2,3]. Such feature is rather difficult to predict numerically within a classical elasto-visco-plastic scheme especially when considering several points [4]. Introducing mixed hardening in the material model provides a better description of the dent resistance of steel panels [5]. However, the highly non-linear evolution during unloading is difficult to capture, though the description can be improved by considering the chord modulus degradation with plastic strain in balanced biaxial tension [6]. Moreover, the dent resistance is affected by the bake hardening effect, though little evidence or discussion can be found in the literature related to this dependency.
Bake hardening (BH) is a phenomenon occurring in steel materials corresponding to an increase of the flow stress after a pre-strain followed by heat treatment (or annealing) within a specific temperature range. Classical BH magnitudes are from 30 up to 60 MPa [7] after a few percent of pre-strain and heating at around 170 °C ( 443 K) during 20 min. The magnitude of this phenomenon depends on the annealing temperature and time [8]. Specific series of materials are concerned by bake hardening, like series with low carbon contents as E180BH, dual phase and TRIP steels [9,10,11] and also Mg alloys [12]. Carbon atoms are in solid solution in the iron matrix. Their capacity to diffuse, even at room temperature, especially from close-packed areas to areas less close-packed, is at the origin of the bake hardening. Indeed, after the pre-strain, carbon atoms, forming Cottrell atmospheres, move close to the core of the dislocations generated during this step, due to a decrease of the elastic energy of the crystallographic network, leading to a pinning of the dislocations. Secondly, C-rich clusters lead to the precipitation of coherent precipitates, e.g., [13]. Therefore, upon re-straining after the heat-treatment, a stress increase is necessary in order to free the dislocations, leading to a Lüders-like phenomenon of catastrophic slip in macroscopic bands of localised strain. And eventually to overcome the newly-formed precipitates. After a load stagnation corresponding to the band propagation [10], hardening is resumed at a higher level than before thermal treatment. The bake hardening magnitude results both from strain hardening after the pre-strain and thermal ageing. BH magnitude is defined as the difference between the elastic stress upon reloading, after heat treatment, and the stress level reached at the end of the pre-strain.
The bake hardening effect has practical applications in the automotive industry [14,15]. Indeed, the flow stress increase during paint curing, which is a necessary step in outer automotive panel production, leads to an increase of the dent resistance of the panels without altering the forming properties. Indeed, the deep drawing corresponds to the pre-strain; the equivalent plastic strain resulting from this step can differ significantly from one area to the other, e.g., bent areas near the door handle or windows or the trimming line exhibit highly localised strain whereas the center part is less deformed. Therefore, after paint curing, usually at a temperature close to 170 °C ( 443 K), the mechanical properties of the material increase [7,10,16], leading to an improvement of the static dent resistance of the panel. Within a complete virtual forming of metallic sheet parts, it seems relevant to add bake hardening and dent resistance to the list of predicted properties, to improve the design of new materials able to avoid non-aesthetic effects such as the one illustrated in Figure 1.
Berbenni et al. [13] propose a micro-mechanical model of the bake hardening effect that relates the flow stress increase to the dislocation density, content of solute atoms, volume fraction of C-rich coherent clusters and time. It depends on three material parameters, which are identified for E180BH steel using only the homogeneous strain range, after removing the transient part of the stress-strain curve corresponding to Lüders phenomenon. A BH magnitude of around 80 MPa is measured, after the two pre-strain values of 0.02 and 0.05 and 20 min annealing at 170 °C ( 443 K). Ballarin et al. [17] develop also a micro-mechanical model based on the dislocation density and considers also the Piobert-Lüders phenomenon. They obtained a very close description of the bake hardening effect in tension for several annealing times and baking temperatures. This model is further extended to strain path changes between the pre-strain and the subsequent strain path [18]. A neural network approach is proposed in [19,20,21] and information such as the baking temperature and the carbon contents are input data.
The aim of this study is to characterise and predict the magnitude of the bake hardening effect on the dent resistance via a phenomenological approach. In this study, a low carbon steel referred to as E220BH is considered. Firstly, the magnitude of the bake hardening effect is investigated in tension, for fixed time and temperature conditions and several pre-strain values ranging from 0.02 to 0.08. Then, hydraulic bulging of E220BH circular blank is performed and the dent resistance is investigated experimentally, for two different pre-strain amounts and after a heat treatment. Finally, an original phenomenological model is presented, which represents an increase of the stress level after the thermal treatment. As a first step, the model depends only on the pre-strain magnitude. The numerical simulation of these tests is then performed and compared with experimental data. The comparison on the load level and the strain field gives a thorough validation of the numerical model.
2. Materials and Experiments
A low carbon steel referred to as E220BH, that exhibits bake hardening effect, is used in this study. The chemical composition, as given by the supplier, is of 0.06% (in weight) of C and 0.7% of . It is provided in sheets with a thickness of 0.74 mm. The mechanical properties were characterised in tension [22] and are simply recalled in Table 1. Though the influence of anisotropy is out of the scope of the present study, normal and in-plane anisotropy coefficients (respectively and ) are also given as general characteristics of the material.
2.1. Tensile Tests and Thermal Treatment
The three-steps necessary to investigate the bake hardening effect are first a tensile pre-strain followed by a thermal treatment and finally a second tension in the same direction as the previous one; these steps are detailed below. Tensile tests are performed on samples with a rectangular shape, of width 20 mm and gauge length 150 mm, in the rolling direction. The local longitudinal strain is measured with an extensometer (2630 series, INSTRON, Norwood, MA, USA) having a gauge length of 10 mm. Three pre-strain values, corresponding to a total logarithmic strain of 0.02, 0.04 and 0.08, are considered. Tensile tests up to rupture are also performed, in order to characterise the material in its original state.
Then, the samples are heated at an average value of 165 °C during 15 min in an oven. Three thermocouples are used to record the temperature evolution at different locations in the oven, one in the middle of the samples and two others on each side. Three different batches are heat-treated, each of them made of 3 to 5 tensile samples. It can be seen in Figure 2 that the gradient in the oven is lower than 5 °C, whatever the batch of samples. In a first step, the oven is heated up to 170 °C during a time long enough (above 100 min) to reach a stable temperature. Then, samples are settled inside the oven; the temperature drops down to 80 °C and, as soon as the door is closed, goes rapidly up to 160 °C. The samples are then kept during 15 min at a temperature that evolves from 160 °C to a maximum of 170 °C, with an average value of 165 °C (Figure 2). The sample then slowly cools down to room temperature.
The samples are then subjected to a second tensile test in the same direction as the first tension, up to rupture. The reproducibility is investigated over 2 or 3 samples tested in the same conditions. As the global mechanical behavior, before and after the heat treatment, as well as the evolution of BH magnitude with the pre-strain are close, only one test is presented.
2.2. Dent Resistance
The validation test is related to static dent resistance. Indeed, opening parts of cars, like doors and hoods, are first formed and then painted on the outside surface and submitted to baking. Materials exhibiting bake hardening effect are then interesting to use, for the static dent resistance should increase after baking. To reproduce such a multi-step process at an academic laboratory scale, circular blanks are pre-strained by bulging up to several strain levels or pole heights, then submitted to the same thermal treatment as for tension. Finally, a dent test is specifically designed in order to characterise the dent resistance of the bulged blanks after baking. The same procedure is also carried out without the thermal treatment, to investigate the influence of the bake hardening effect on dent resistance. The experiments consist of a three-step process: pre-strain in hydraulic bulging, thermal treatment representative of paint baking and finally static dent test.
2.2.1. Pre-Strain
A hydraulic bulge test, developed at IRDL and already detailed in [23], is used to apply a pre-strain. Circular blanks of diameter of 270 mm are clamped by screws between a blank-holder and a die. A fixed volume of water is pressed under the blank by the displacement of an actuator (Zwick 8803, Zwick Roell, Ulm, Germany). The blank bends over the die radius of 8 mm and then bulges inside the die cavity of diameter 184 mm. A pressure sensor (SensorTechnics, BTE6000 / PTU6000 series, Berlin, Germany) gives the fluid pressure and the strain field is measured by digital image correlation in an area around the center point corresponding to the maximum displacement. The strain state on the surface is recorded during the test; an average of the strain components and over a small area around the specimen center is performed, with and parallel respectively to the rolling and transverse directions. The center of the circular specimen is pencil-marked before the bulge test and checked after bulging and unloading, in order to assess precisely the maximum height of the sample, also output from Digital Image Correlation (DIC, Aramis 4M, GOM mbH, Braunschweig, Germany) measures. DIC data is calculated as a post-treatment and cannot be used to control the test. Therefore, the end criterion of the bulge test is defined on the pressure.
2.2.2. Heat Treatment
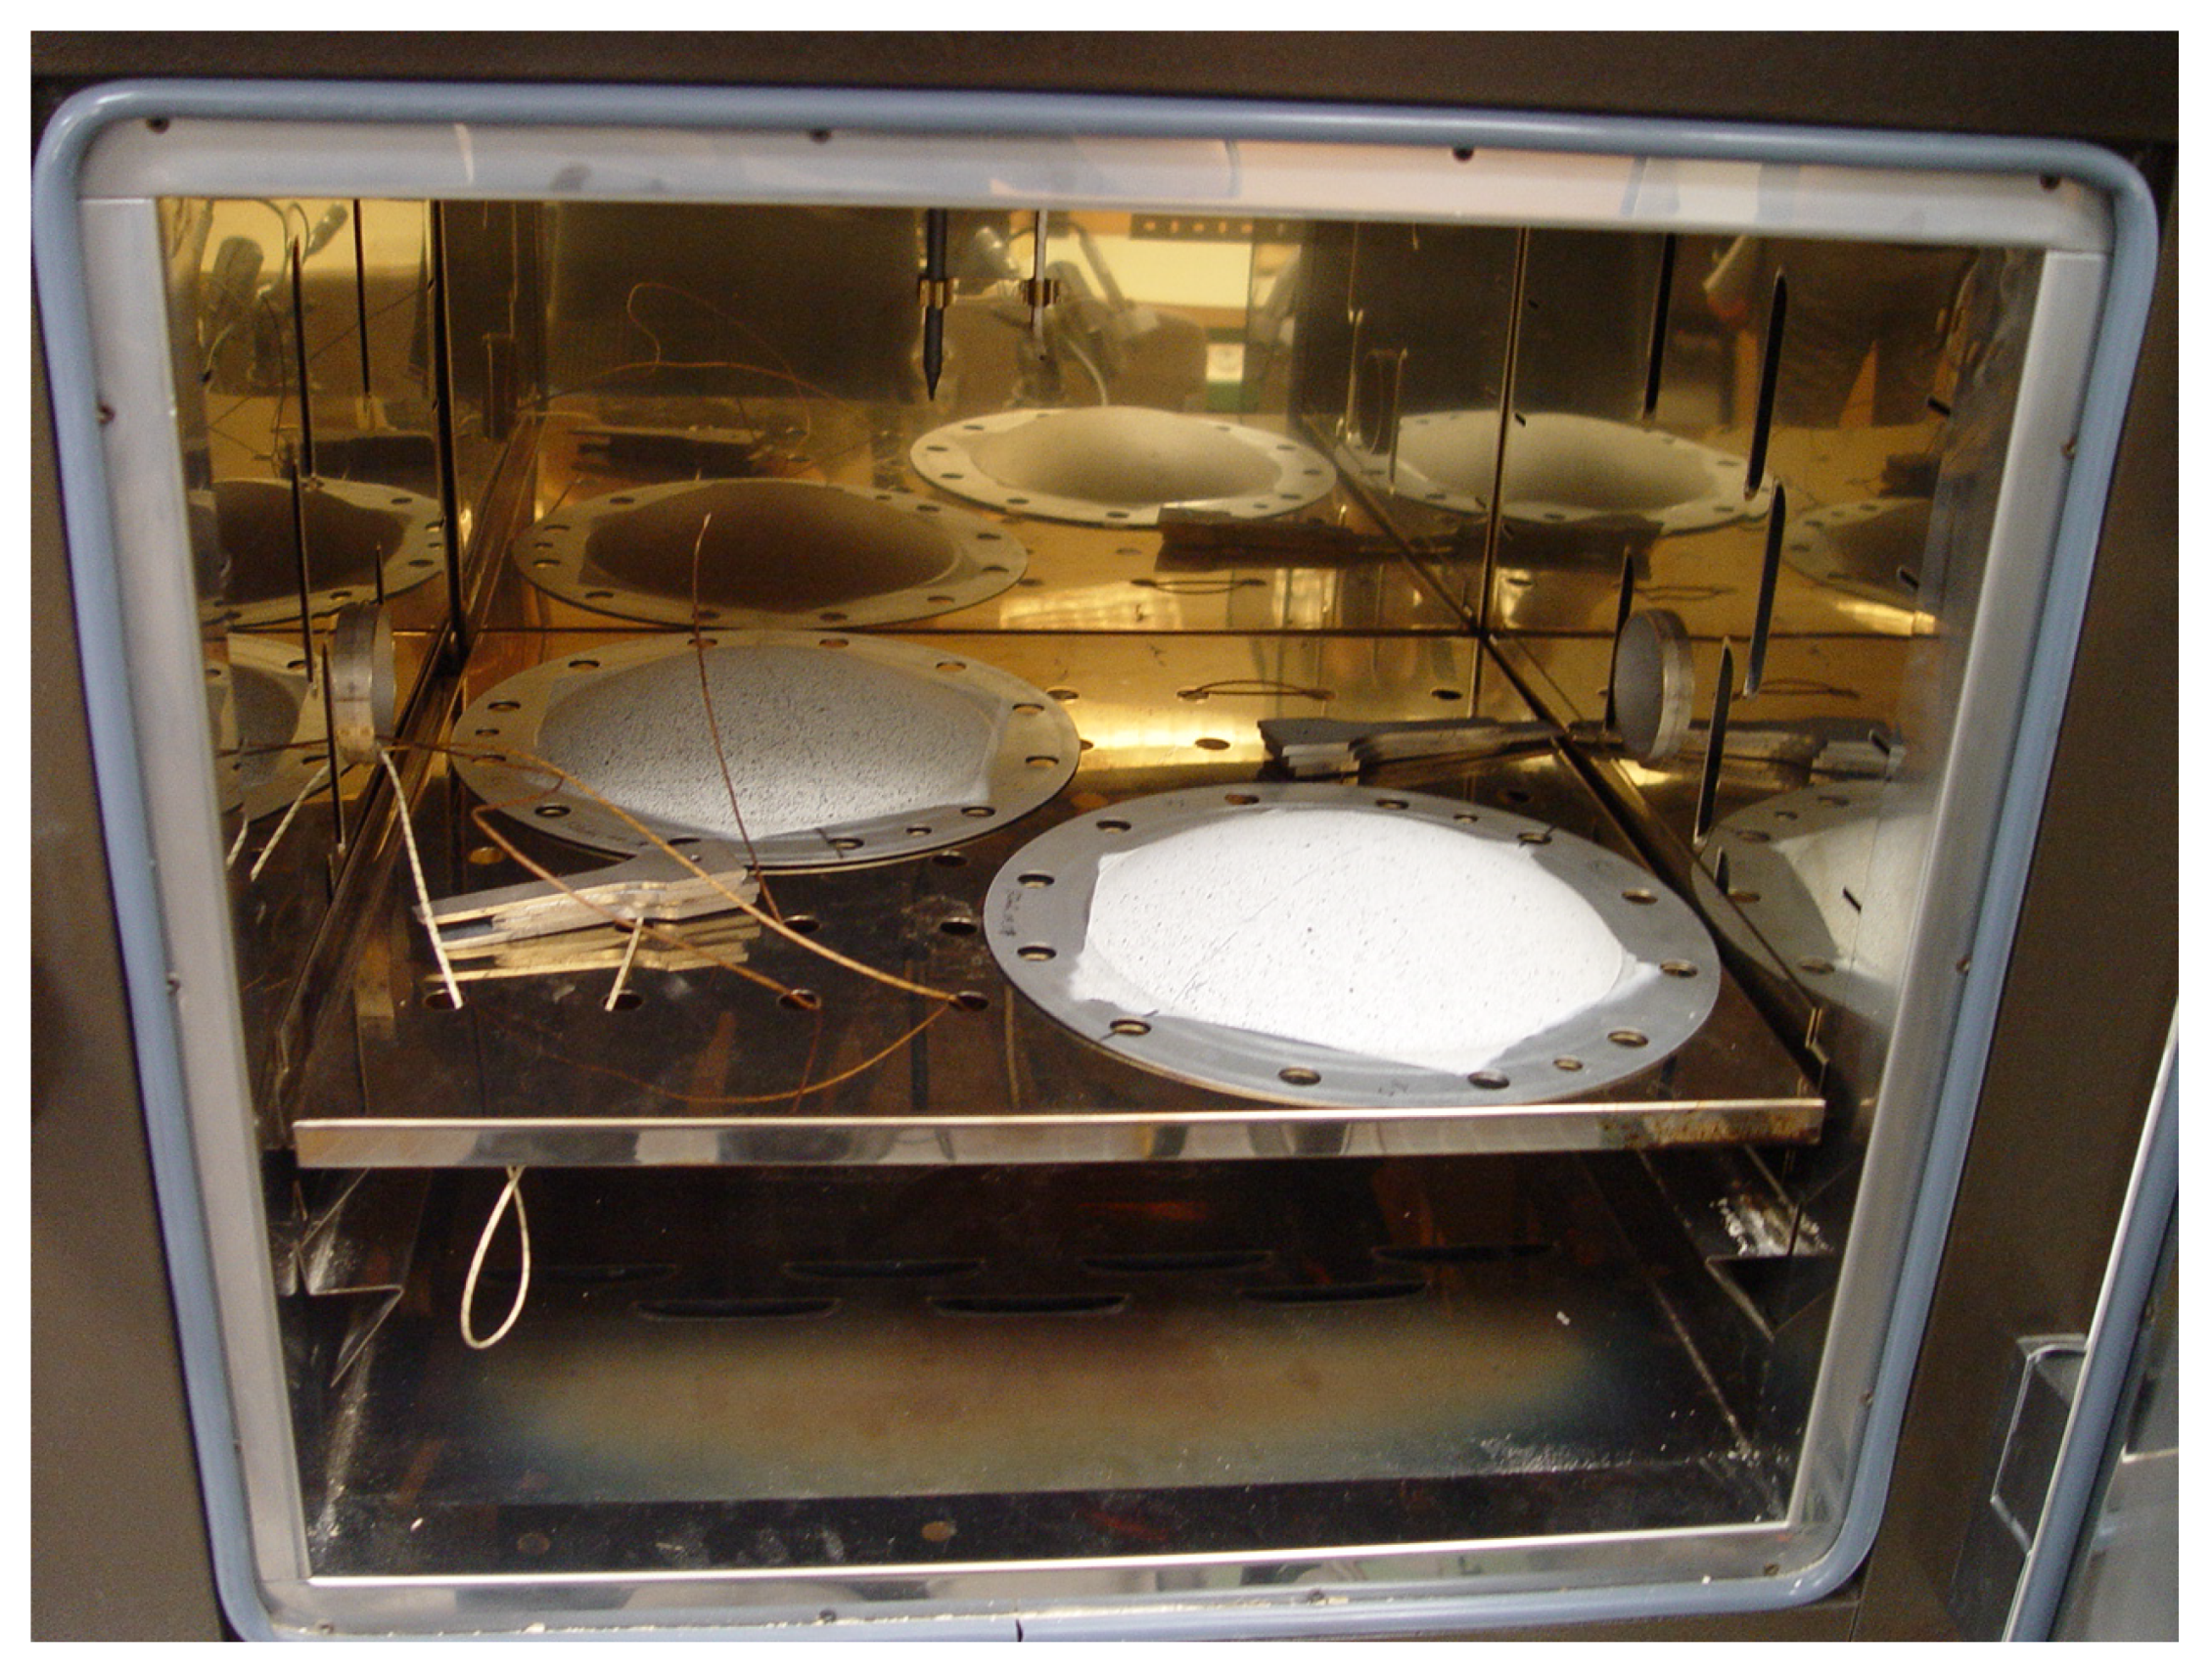
In order to highlight the influence of bake hardening, some bulged specimen are then submitted to the same thermal treatment as the tensile samples. Figure 3 shows the specimen in the oven; two specimen are heat-treated at the same time. Furthermore, some bulged specimen are not subjected to the thermal heat-treatment.
2.2.3. Dent Tests
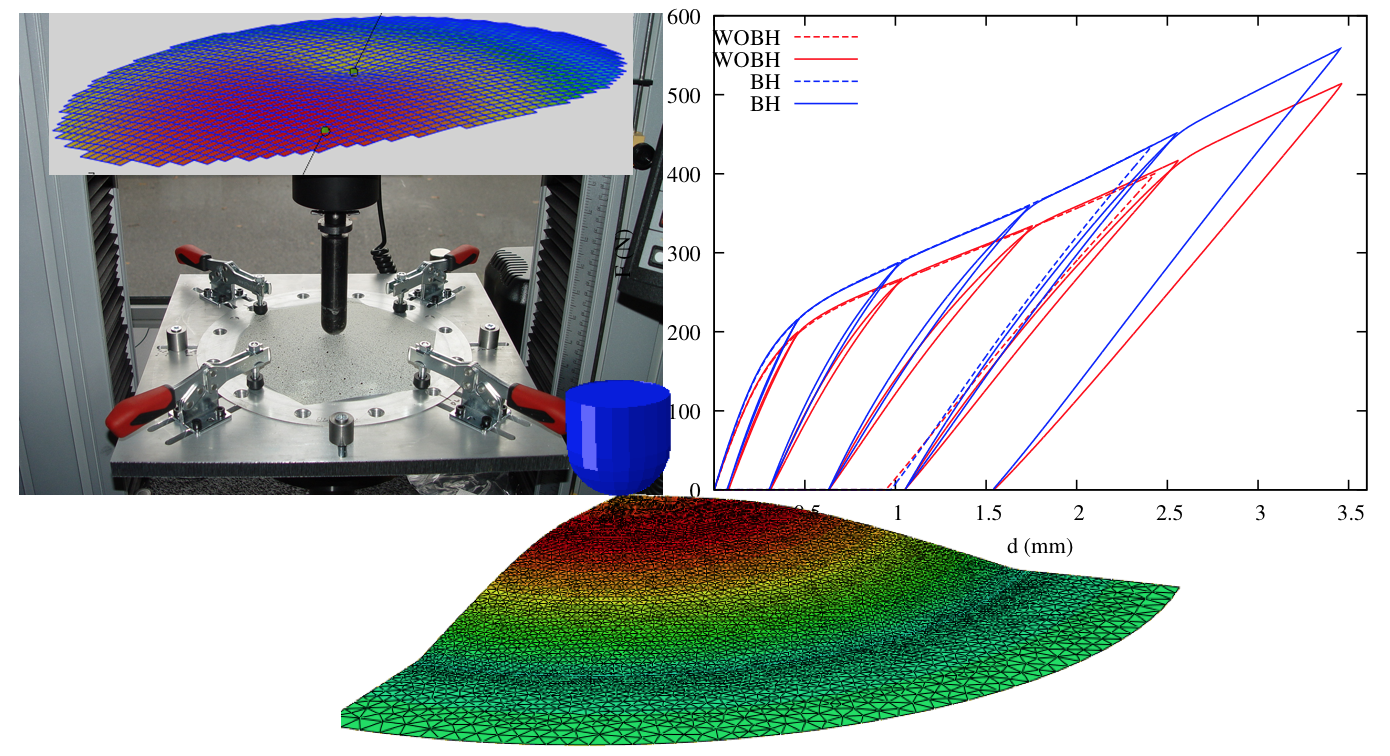
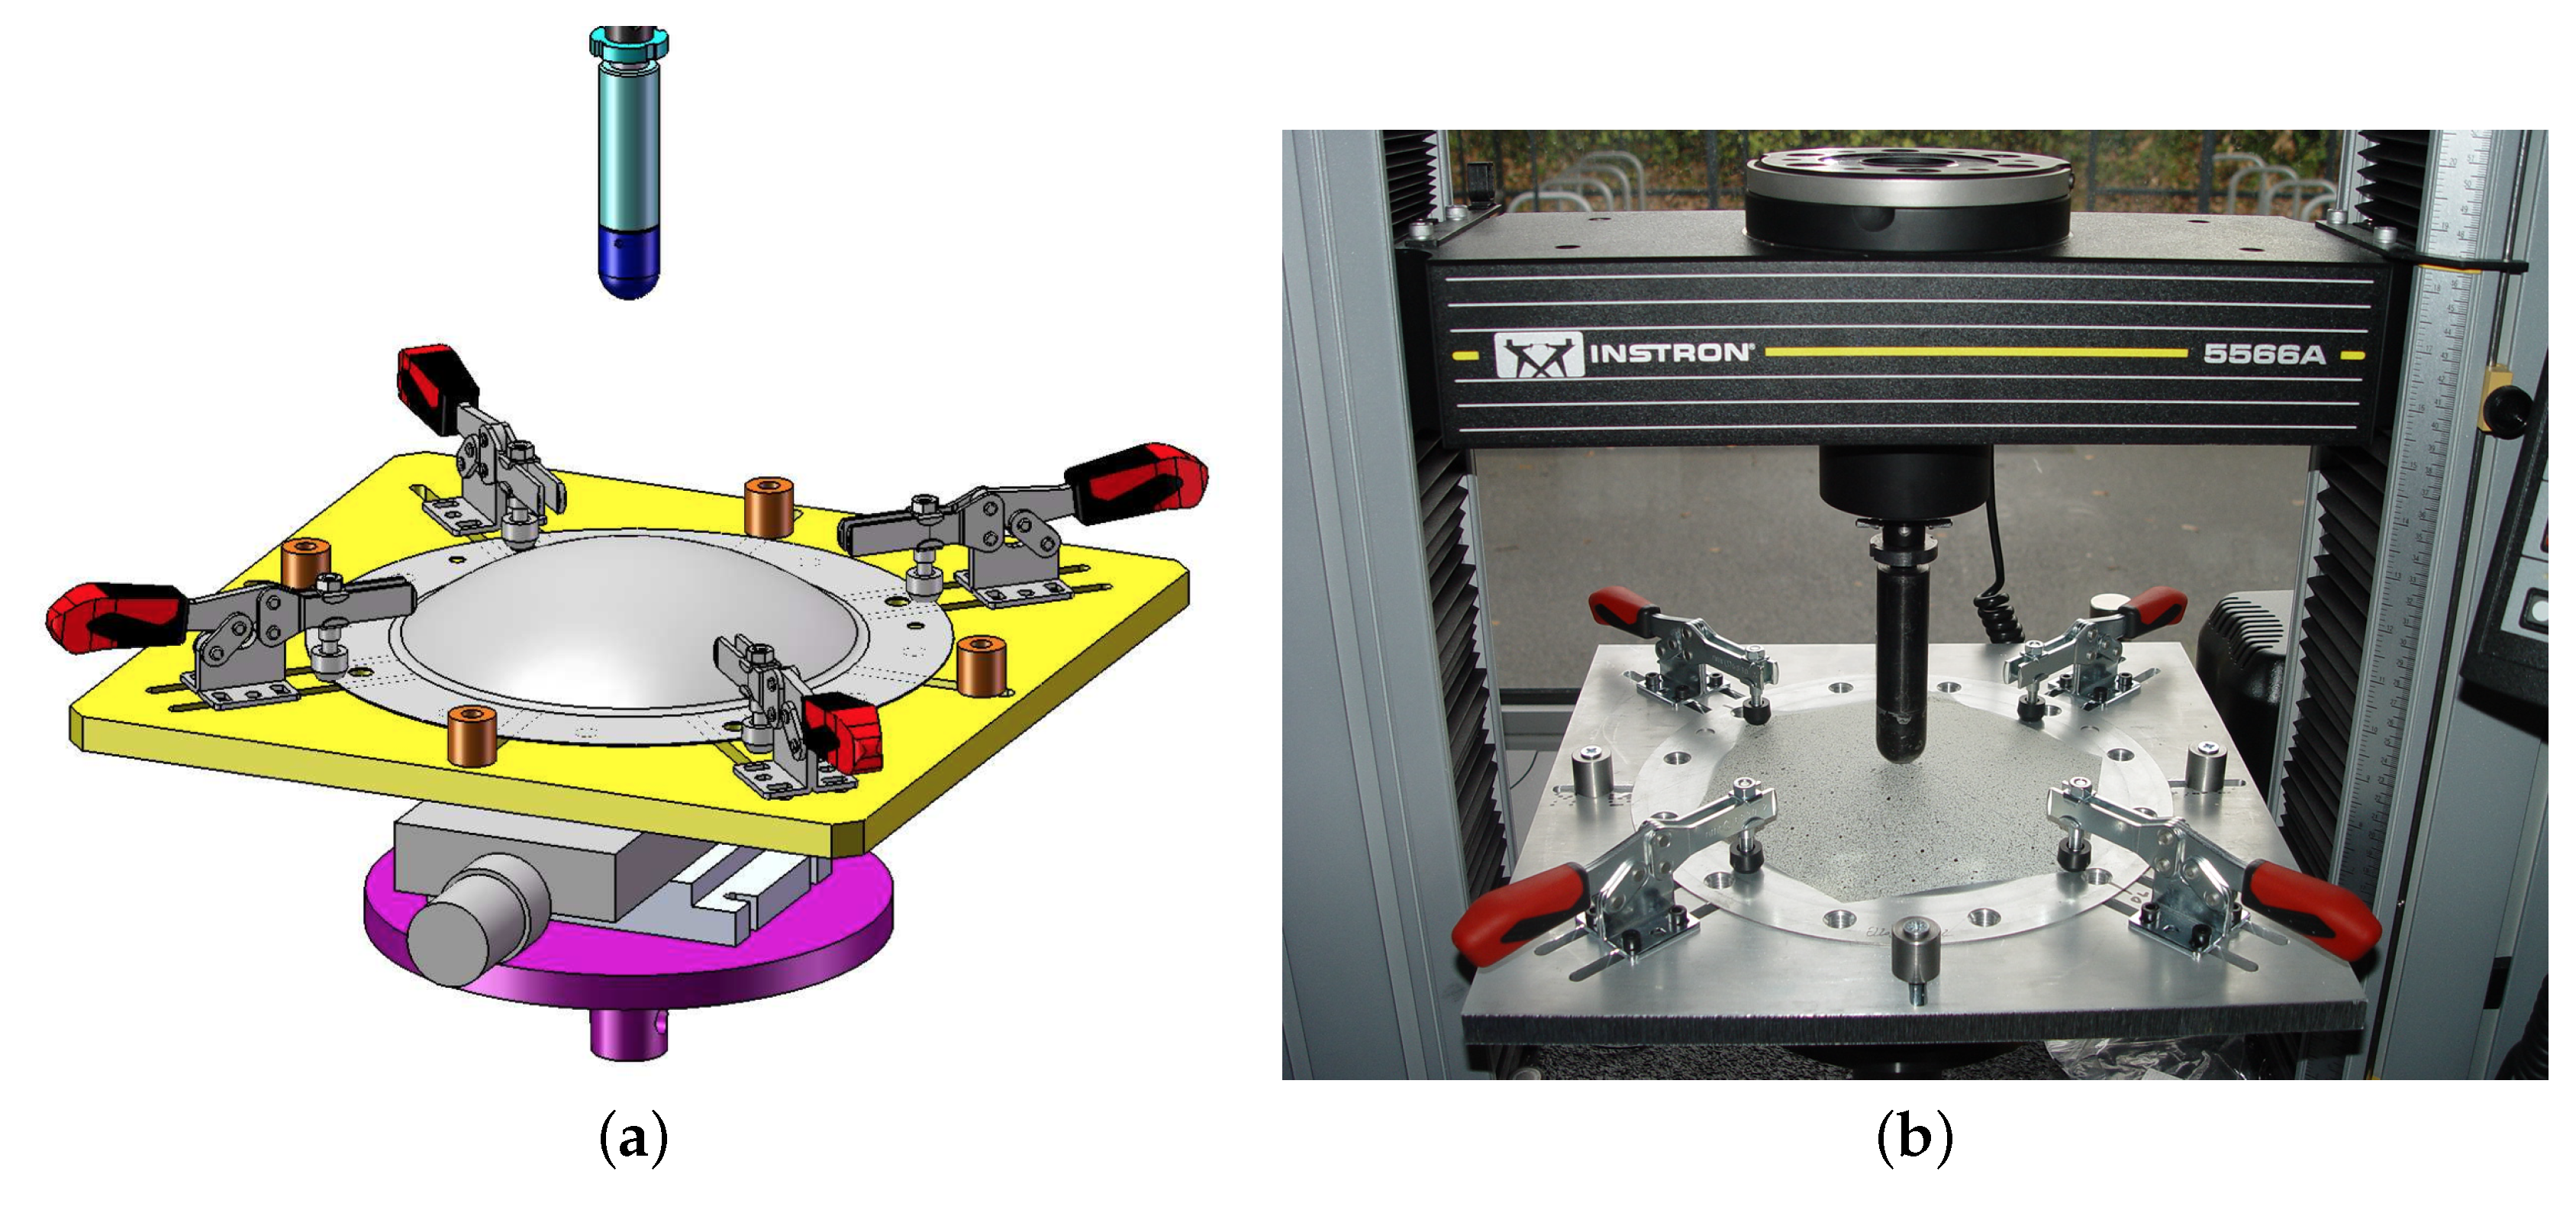
A dedicated device is designed to characterise the dent resistance using a universal tensile machine (INSTRON 5566A, Norwood, MA, USA). Figure 4 shows the different components, i.e., a supporting plate, four clamping devices and a hemispherical punch of radius 12.5 mm connected to the load cell of maximum capacity 1 kN. The supporting plate lies on a precision positioning table to put the sample such as its pole is located right beneath the punch. The displacement of the punch and the applied load are recorded during the test. The stiffness of the device is evaluated by performing tests using a very rigid block as a sample. The corresponding displacement, which is related to gaps and elastic deformation of the tools, is removed from the total displacement, to calculate the real local displacement—or corrected displacement—d imposed to the bulged specimen. This local value is used to plot the results. Tests are conducted up to a maximum displacement of 2.4 mm whatever the time and deformation history. The samples are then unloaded.
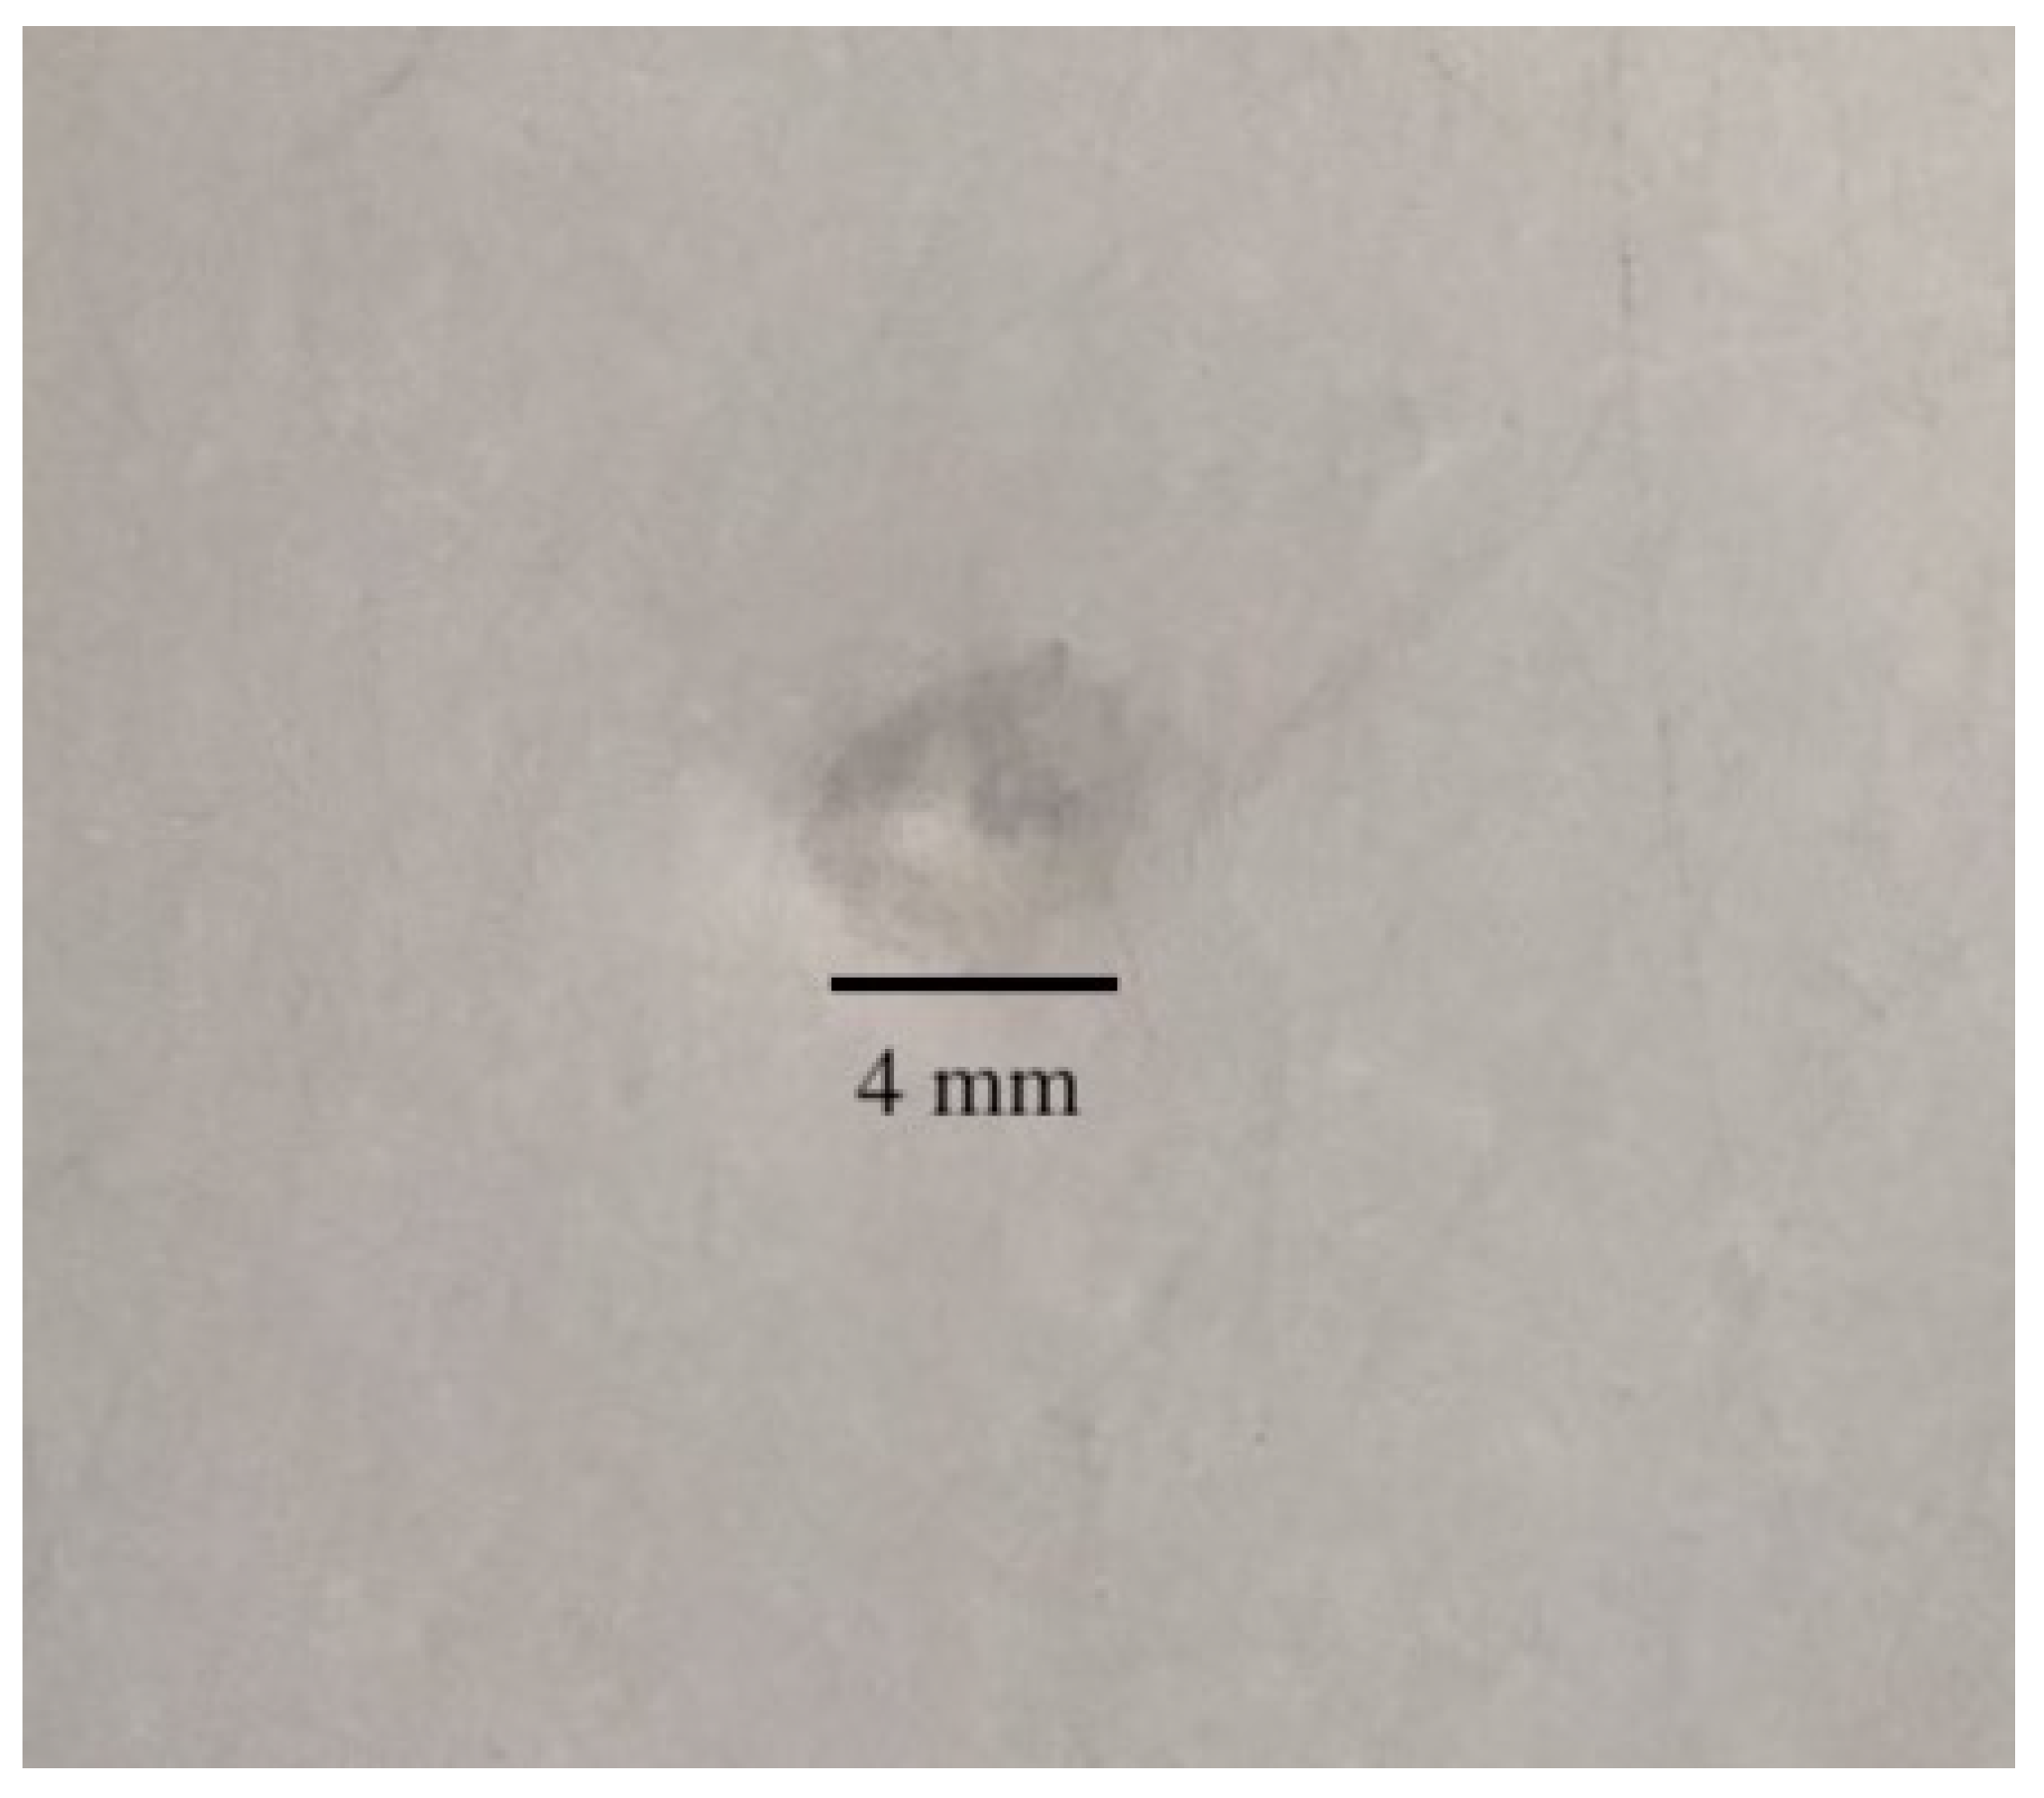
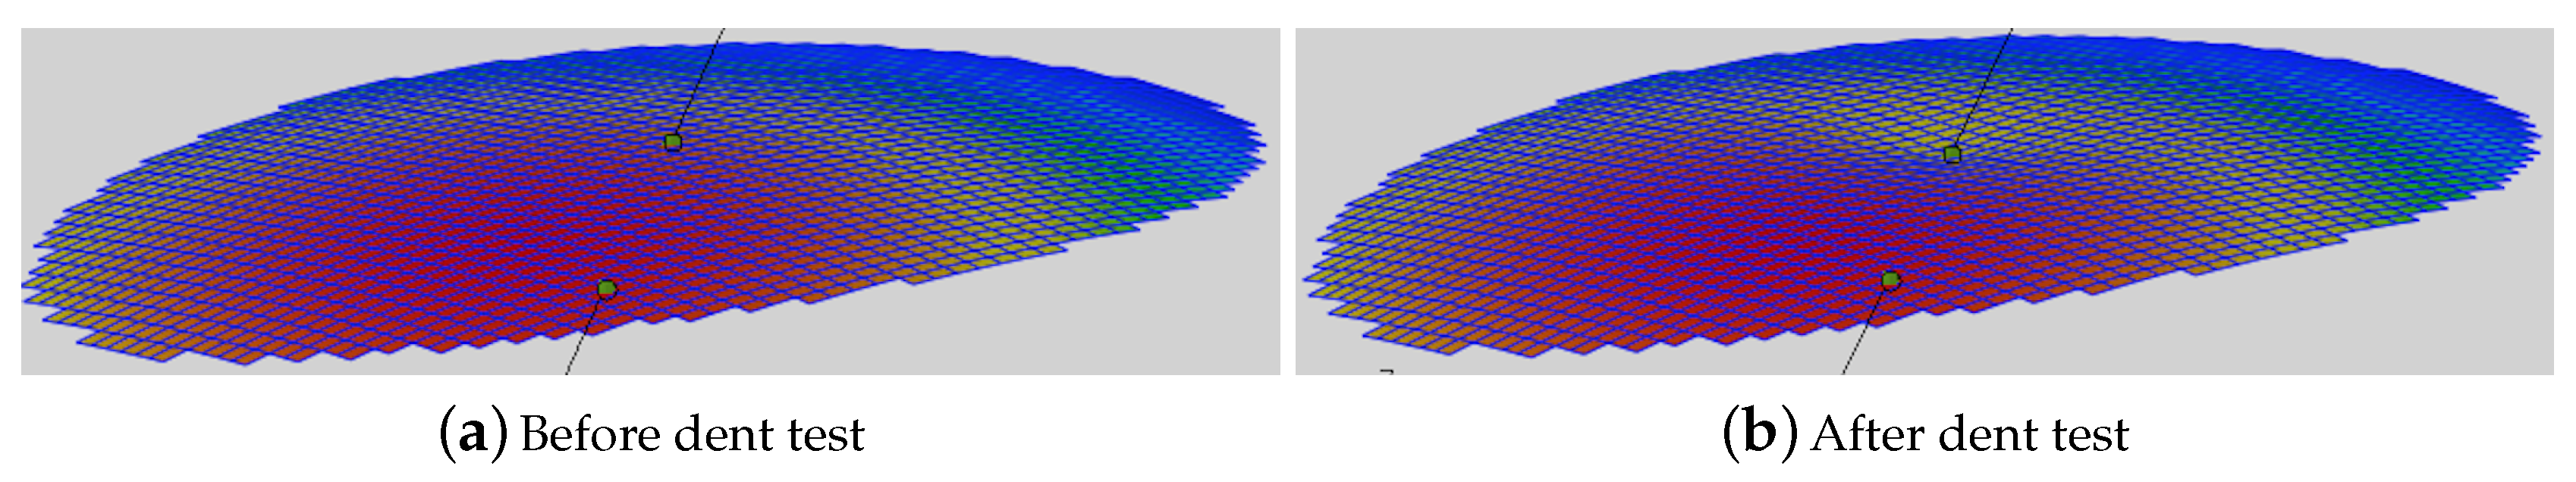
Moreover, specific tests are performed with several loadings-unloadings, for samples without or with a thermal treatment after the pre-strain. DIC is used also to visualise the dent depth, as shown in Figure 5. The pole after bulging corresponds to the point in the middle and the permanent dent in clearly seen.
3. Experimental Results
3.1. Mechanical Behavior in Tension
The influence of heating on virgin samples (without tensile pre-strain) is also investigated and, as expected (though not presented here), the yield stress is not affected but only the intensity of the Piobert-Lüders phenomenon, with an increase of the length of the stress stagnation. Heating results in diffusion of carbon atoms and therefore, to a slight increase of the plateau magnitude.
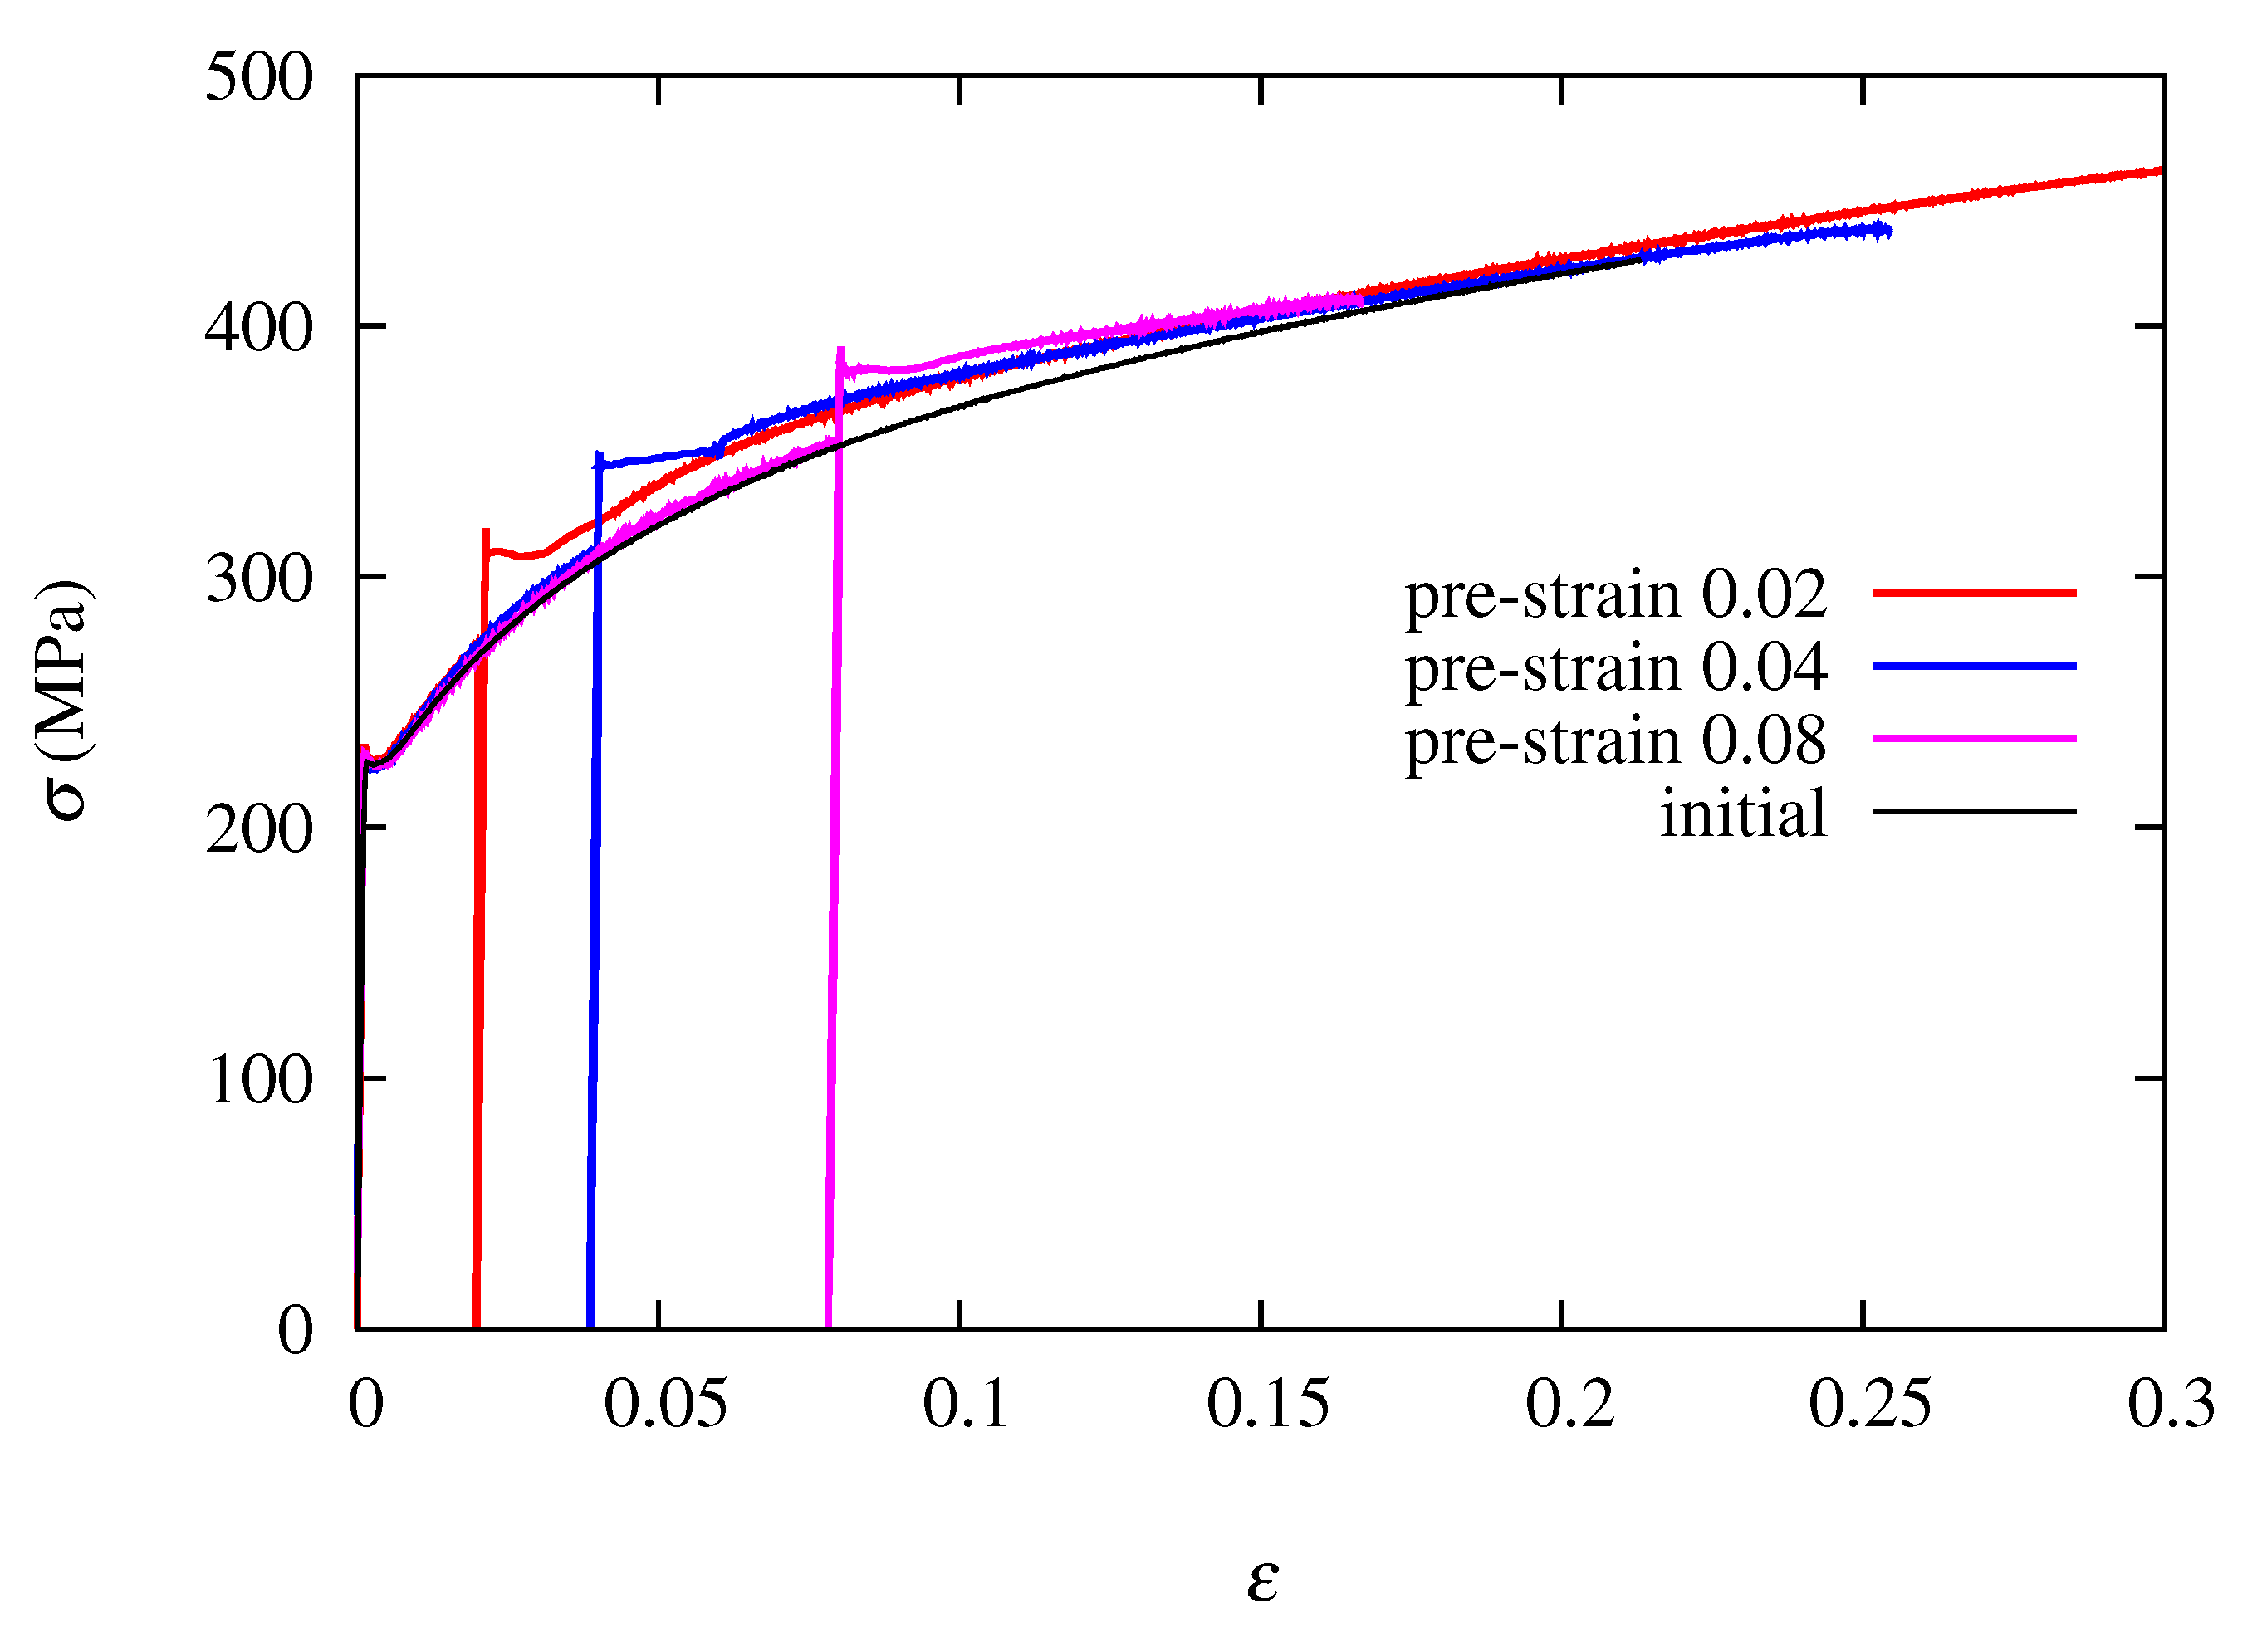
Figure 6 shows the Cauchy stress-logarithmic strain curves, for both the pre-strain and the subsequent tension. For the lowest pre-strain of 0.02, an initial stress increase of 46 MPa is recorded, which represents 17% of the stress reached at the end of the first tension, before the heat-treatment. The stress then sharply decreases and then, increases again and the stress-strain curve tends towards the one of the virgin sample. The magnitude of the BH effect decreases slightly with the pre-strain amount, down to 39 MPa at 0.04 pre-strain (13%) and 38 MPa at 0.08 pre-strain (11%). Similarly to previous results, the BH magnitude tends to decrease when the pre-strain increases, both intrinsically and as the ratio of BH over the yield stress of the virgin sample at the same pre-strain value. A rather similar evolution is noted for the higher pre-strains, though strain needed to reach back the curve of the virgin sample is longer and premature rupture takes place very clearly. The BH magnitude is similar to results obtained for a similar material [7], as well as DP steel [10], but lower than the value reported for E180BH [13]. Such a difference may arise from different concentrations of solute atoms in the materials.
3.2. Dent Resistance of Bulged Specimen
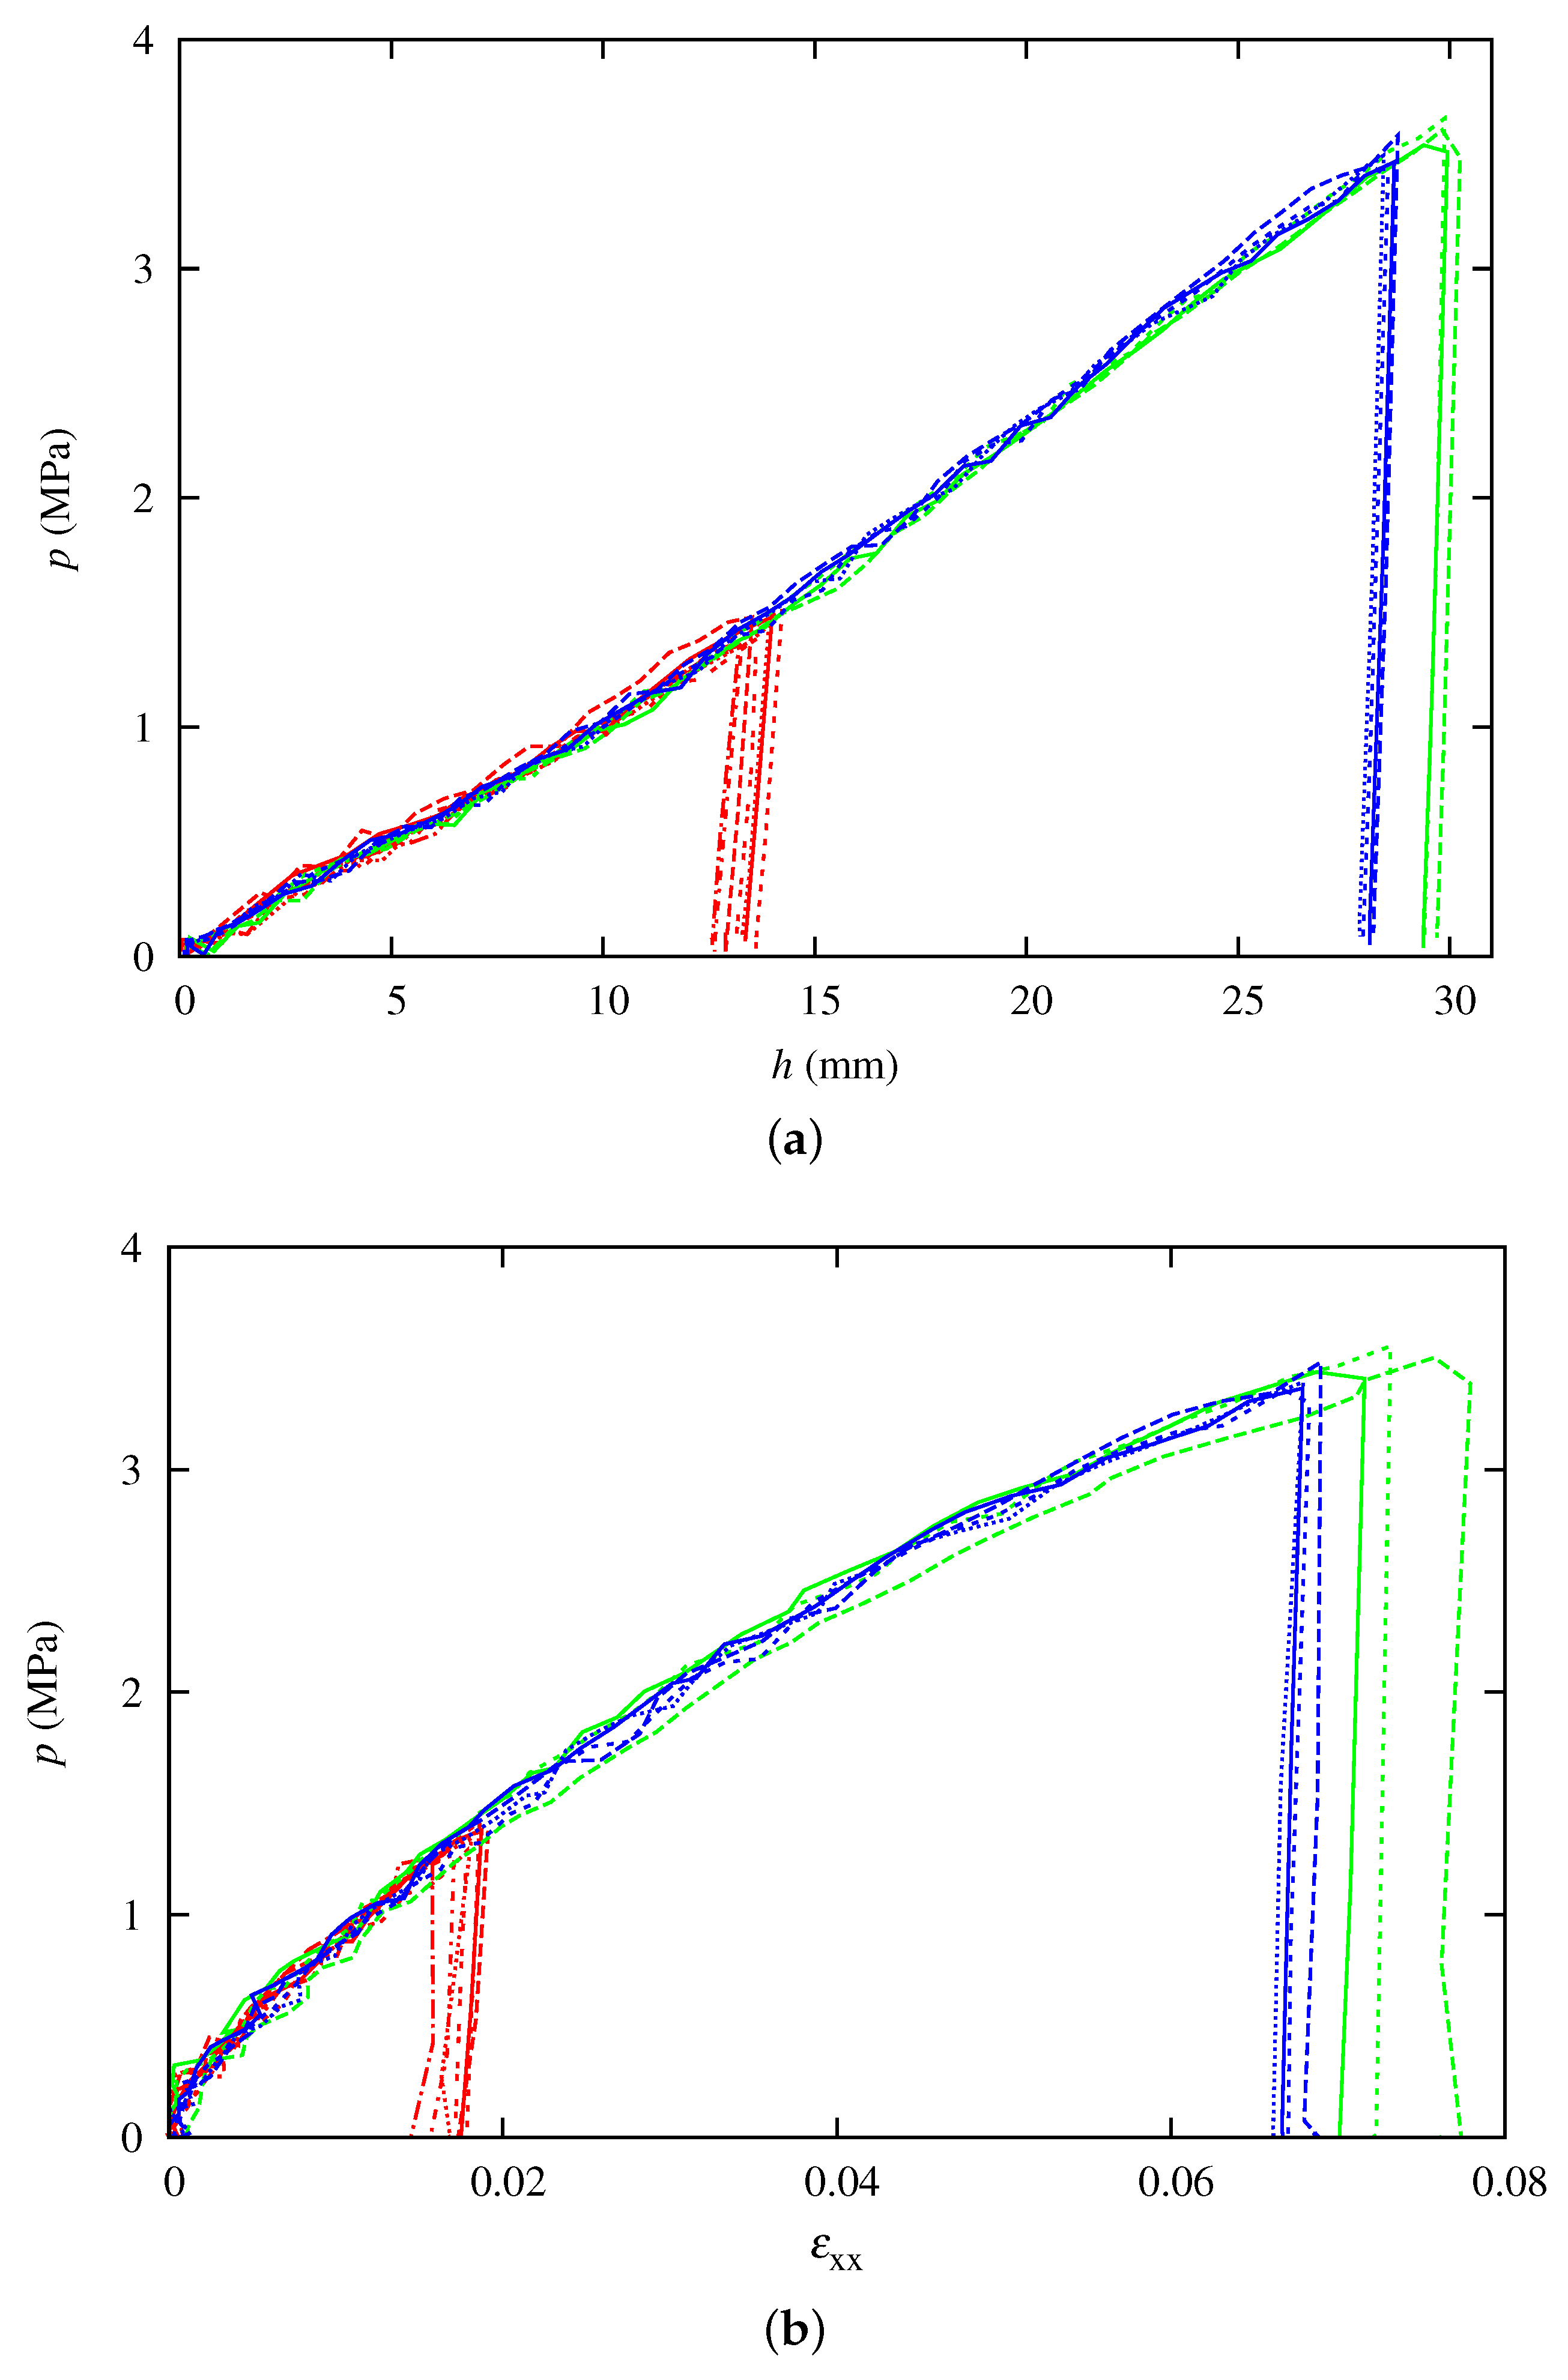
The evolution of the pressure with the pole height h is plotted in Figure 7a. It can be seen that a pressure around 1.5 MPa corresponds to an average height of 13 mm, and respectively 28 mm and 29.5 mm for pressures of 3.5 MPa and 3.6 MPa. The strain at the pole is also calculated with DIC. Figure 7b shows the evolution of the fluid pressure with the strain component at the pole. Two main pre-strain values are achieved, after unloading: around 0.016 and 0.07, though the dispersion is higher for the higher pre-strain, values ranging from 0.065 up to 0.077. A total of 14 samples are deformed, both to check the reproducibility and to have enough samples for the subsequent dent test, without and with a thermal treatment. However, as the pre-strain is not controlled, each test is specific and no average pre-strain is used in the following.
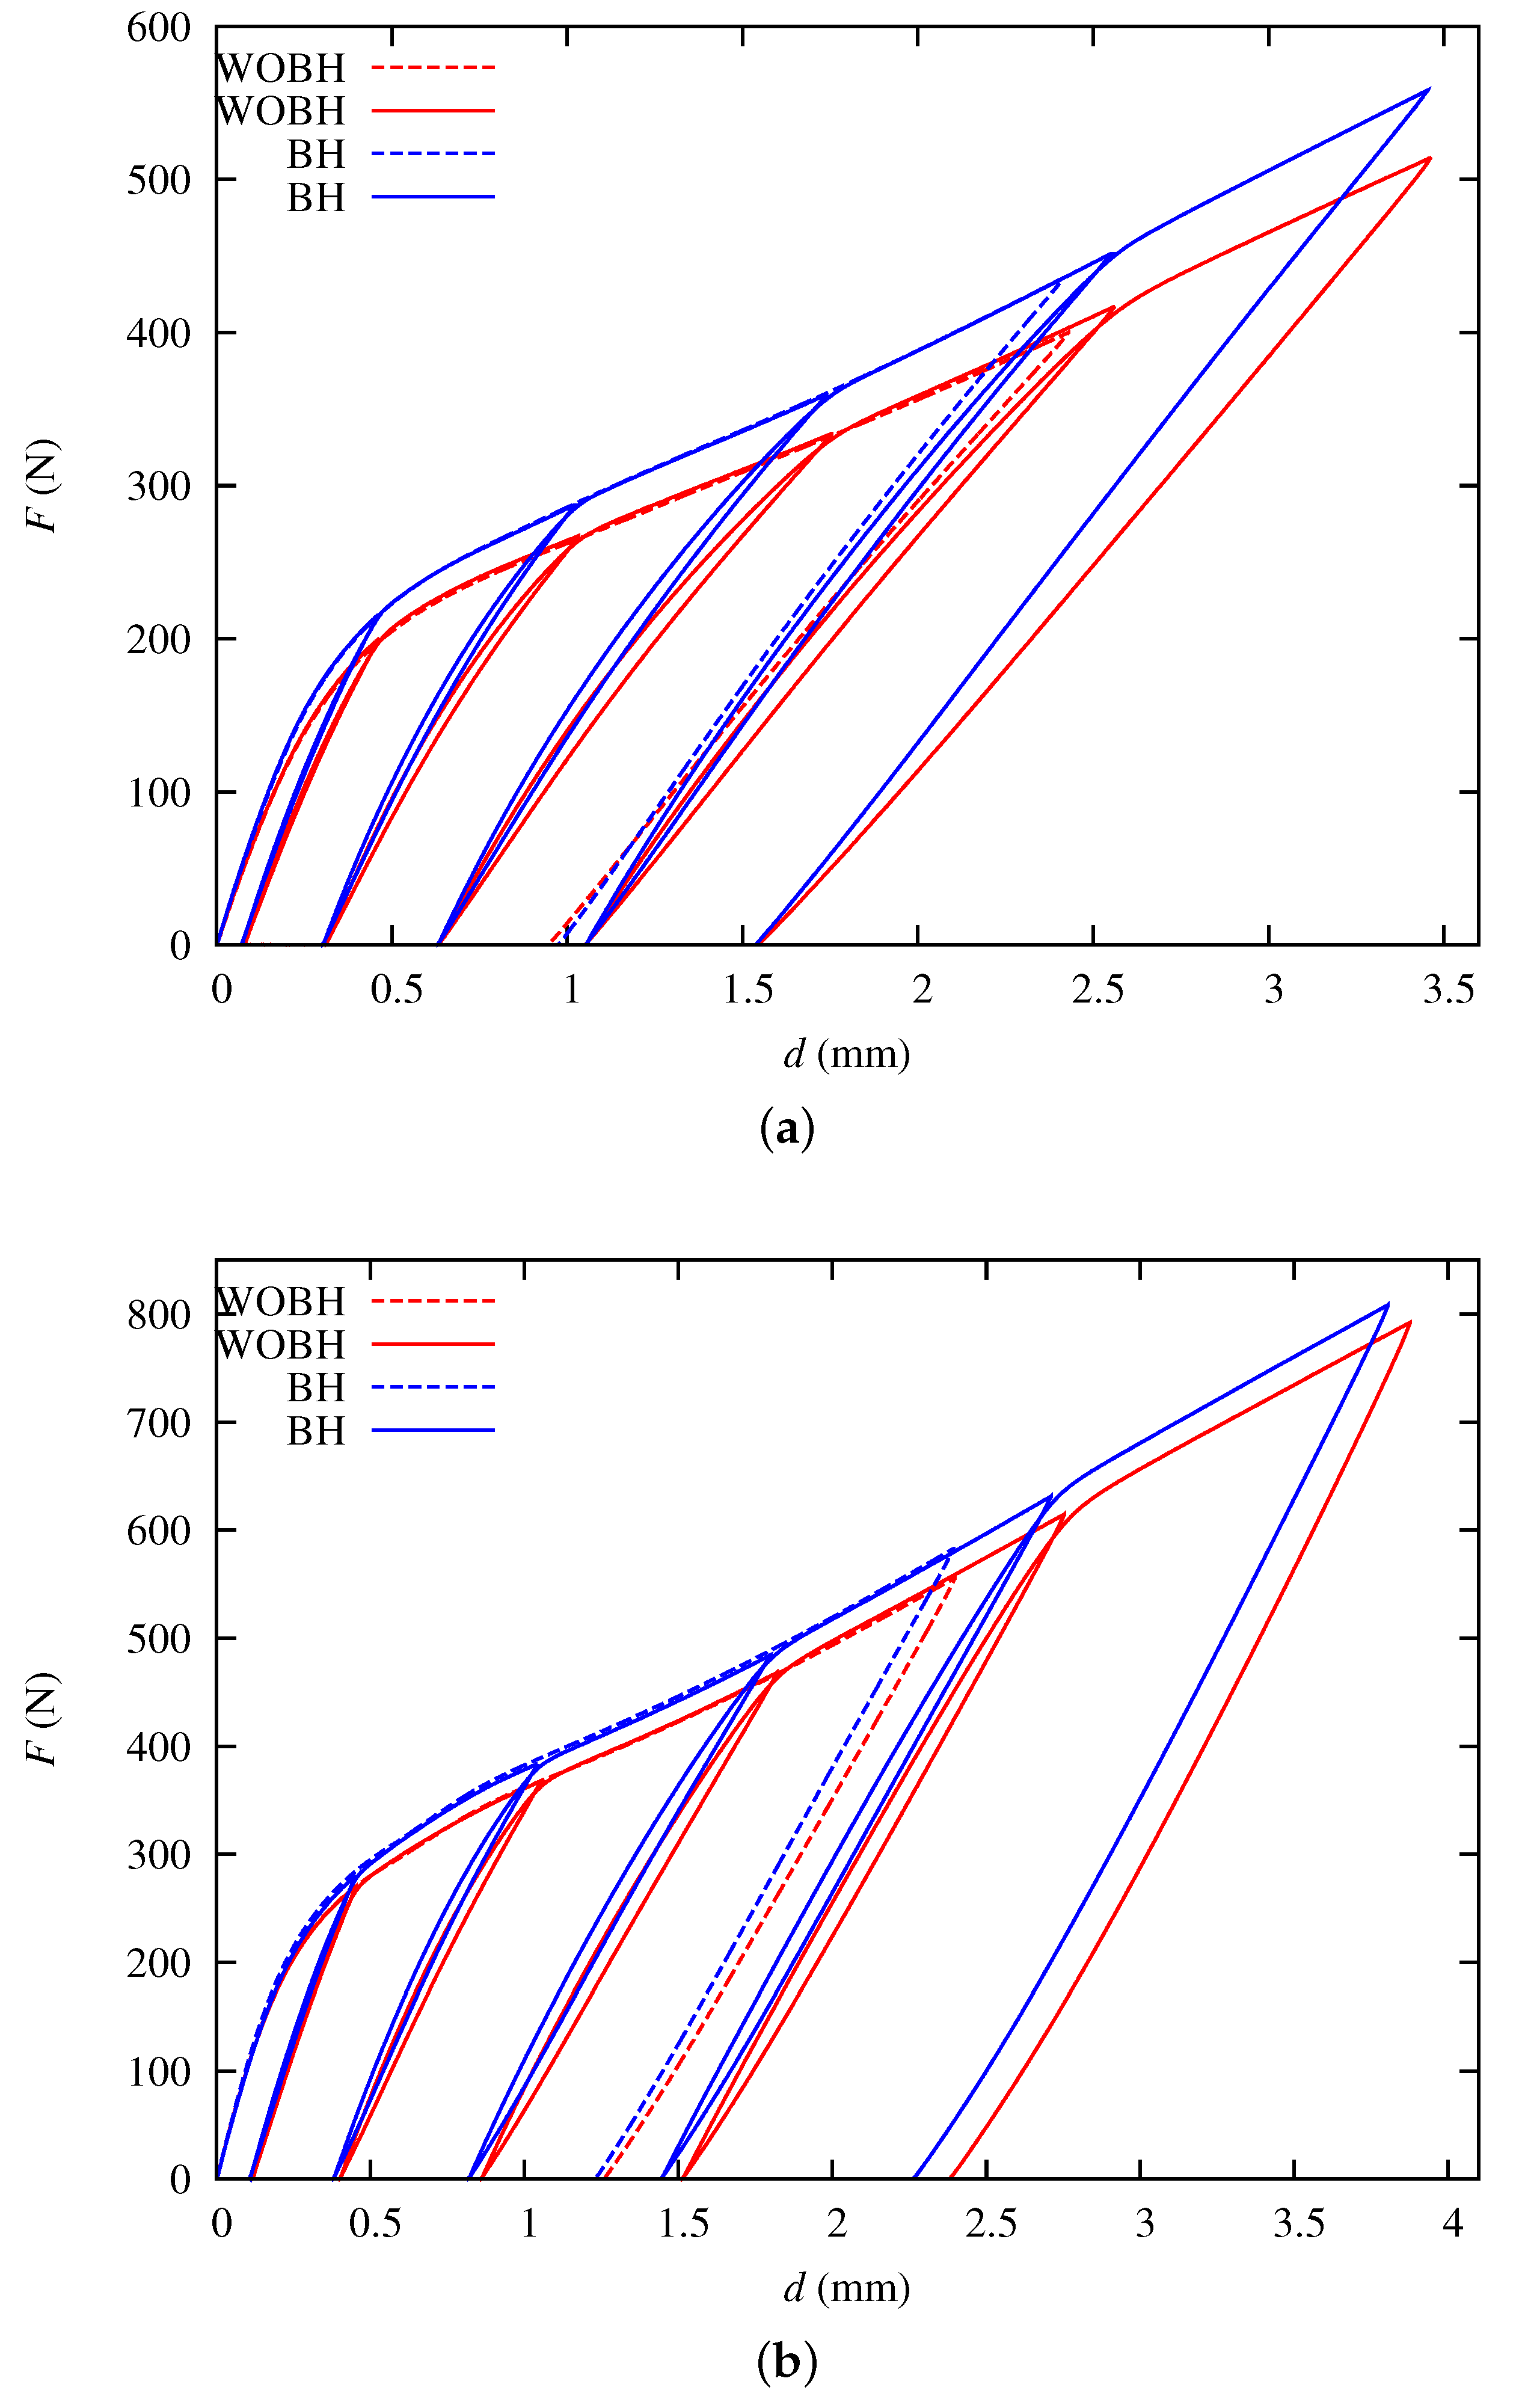
Figure 8a shows the load evolution with the corrected punch displacement, for a pre-strain . The curves exhibit a first rather linear part followed by an elastic-plastic rounded transition; the unloading is linear and the permanent displacement is slightly below 1 mm. The load evolution for two tests is plotted, to highlight the very good reproducibility. Such an evolution is close to results presented in the literature for mild steel [6].
The influence of the thermal treatment is around 40 N at the maximum displacement, representing a contribution of 10% of the maximum load. Though the initial slope is the same as for the non-thermally treated sample, the unloading slope is higher, leading to a residual displacement of the same order of magnitude, around 1 mm. The reproducibility is also very good.
The load evolution is similar for the higher pre-strain (Figure 8b), though the unloading becomes more significantly non-linear. The residual displacement is also the same for both configurations (i.e., without and with a thermal treatment) and is around 1.3 mm.
Concerning the loading-unloading-reloading during the dent tests, the same influence can be shown in Figure 9, i.e., the load level is increased by the bake hardening effect, which implies that the dent resistance is increased. Indeed, for a given applied load, the residual displacement is lower for bake-hardened samples. The hysteresis loop at unloading changes when the displacement increases. Indeed, Figure 9a clearly shows that a concave unloading is recorded up to applied displacements of 2.4 mm and then a convex one is noted for a higher displacement of 3.5 mm, for the pre-strain . The same trend is noticed for the higher pre-strain (Figure 9b).
4. Numerical Simulation of the Multi-Step Process
A numerical model to predict the influence of bake hardening on the dent resistance is proposed, based on a phenomenological description. Constitutive equations, material parameter identification and validation on dent tests of bulged specimen are presented in the following sections.
4.1. BH Modeling and Material Parameter Identification
The main idea of the model proposed in this study is to take into account both the flow stress increase after bake hardening, , and the convergence toward the initial flow stress. Moreover, the stress increase should be dependent on the pre-strain amount, represented by the equivalent plastic strain after the pre-strain . Certainly, the baking temperature and the duration of the baking should also be taken into account but are not considered in a first step in this study, for they kept the same values for all the experiments.
The constitutive model is written within the large transformation framework and isotropic hardening is considered. The yield function is given by Equation (1):
where stands for the equivalent stress according to von Mises yield criterion. The parameter f is set equal to zero for a test without bake hardening whereas it is set equal to 1 in case of bake hardening. The evolution of the yield contour with equivalent plastic strain is described with a Swift equation (Equation (2)):
where K, n and are material parameters. Finally, the overstress related to bake hardening is modelled as given by Equation (3):
where and are material parameters. The overstress has an initial value higher than the stress without bake hardening, that depends on and , at the same strain level and then decreases down to the stress level without heat treatment. Indeed, when considering the reloading after the pre-strain and the heat treatment, with , the yield stress is given by , with:
The first term of the right-hand side of Equation (4) is a constant equal to and the second term is negative and decreases in absolute value when increases. Therefore, it leads to an increasing overstress when the pre-strain increases.
Inverse identification of the material parameters is carried out using the in-house Matlab toolbox SMAT developed at Xi’an Jiaotong University [24]. A cost function is defined and minimized iteratively in the least square sense by Equation (5).
where N is the number of tests in the database, is the set of material parameters. For the variable n, numbers of 1, 2 and 3 correspond to the cases of tensile pre-strains of 0.02, 0.04 and 0.08 before thermal treatment. is the number of experimental points of the n-th test, is the gap between experimental value for the stress and simulated stress at time , and is a weighting coefficient for the n-th test. Material parameters thus identified are given in Table 2.
The constitutive equations presented above are implemented in the finite element code Abaqus via a user subroutine, for plane stress states . The equivalent plastic strain is stored at each integration point during the pre-strain, and in particular at the end of the first step. Then, upon reloading during the subsequent step after bake hardening, the parameter is set equal to the last stored value of the equivalent plastic strain during the first step.
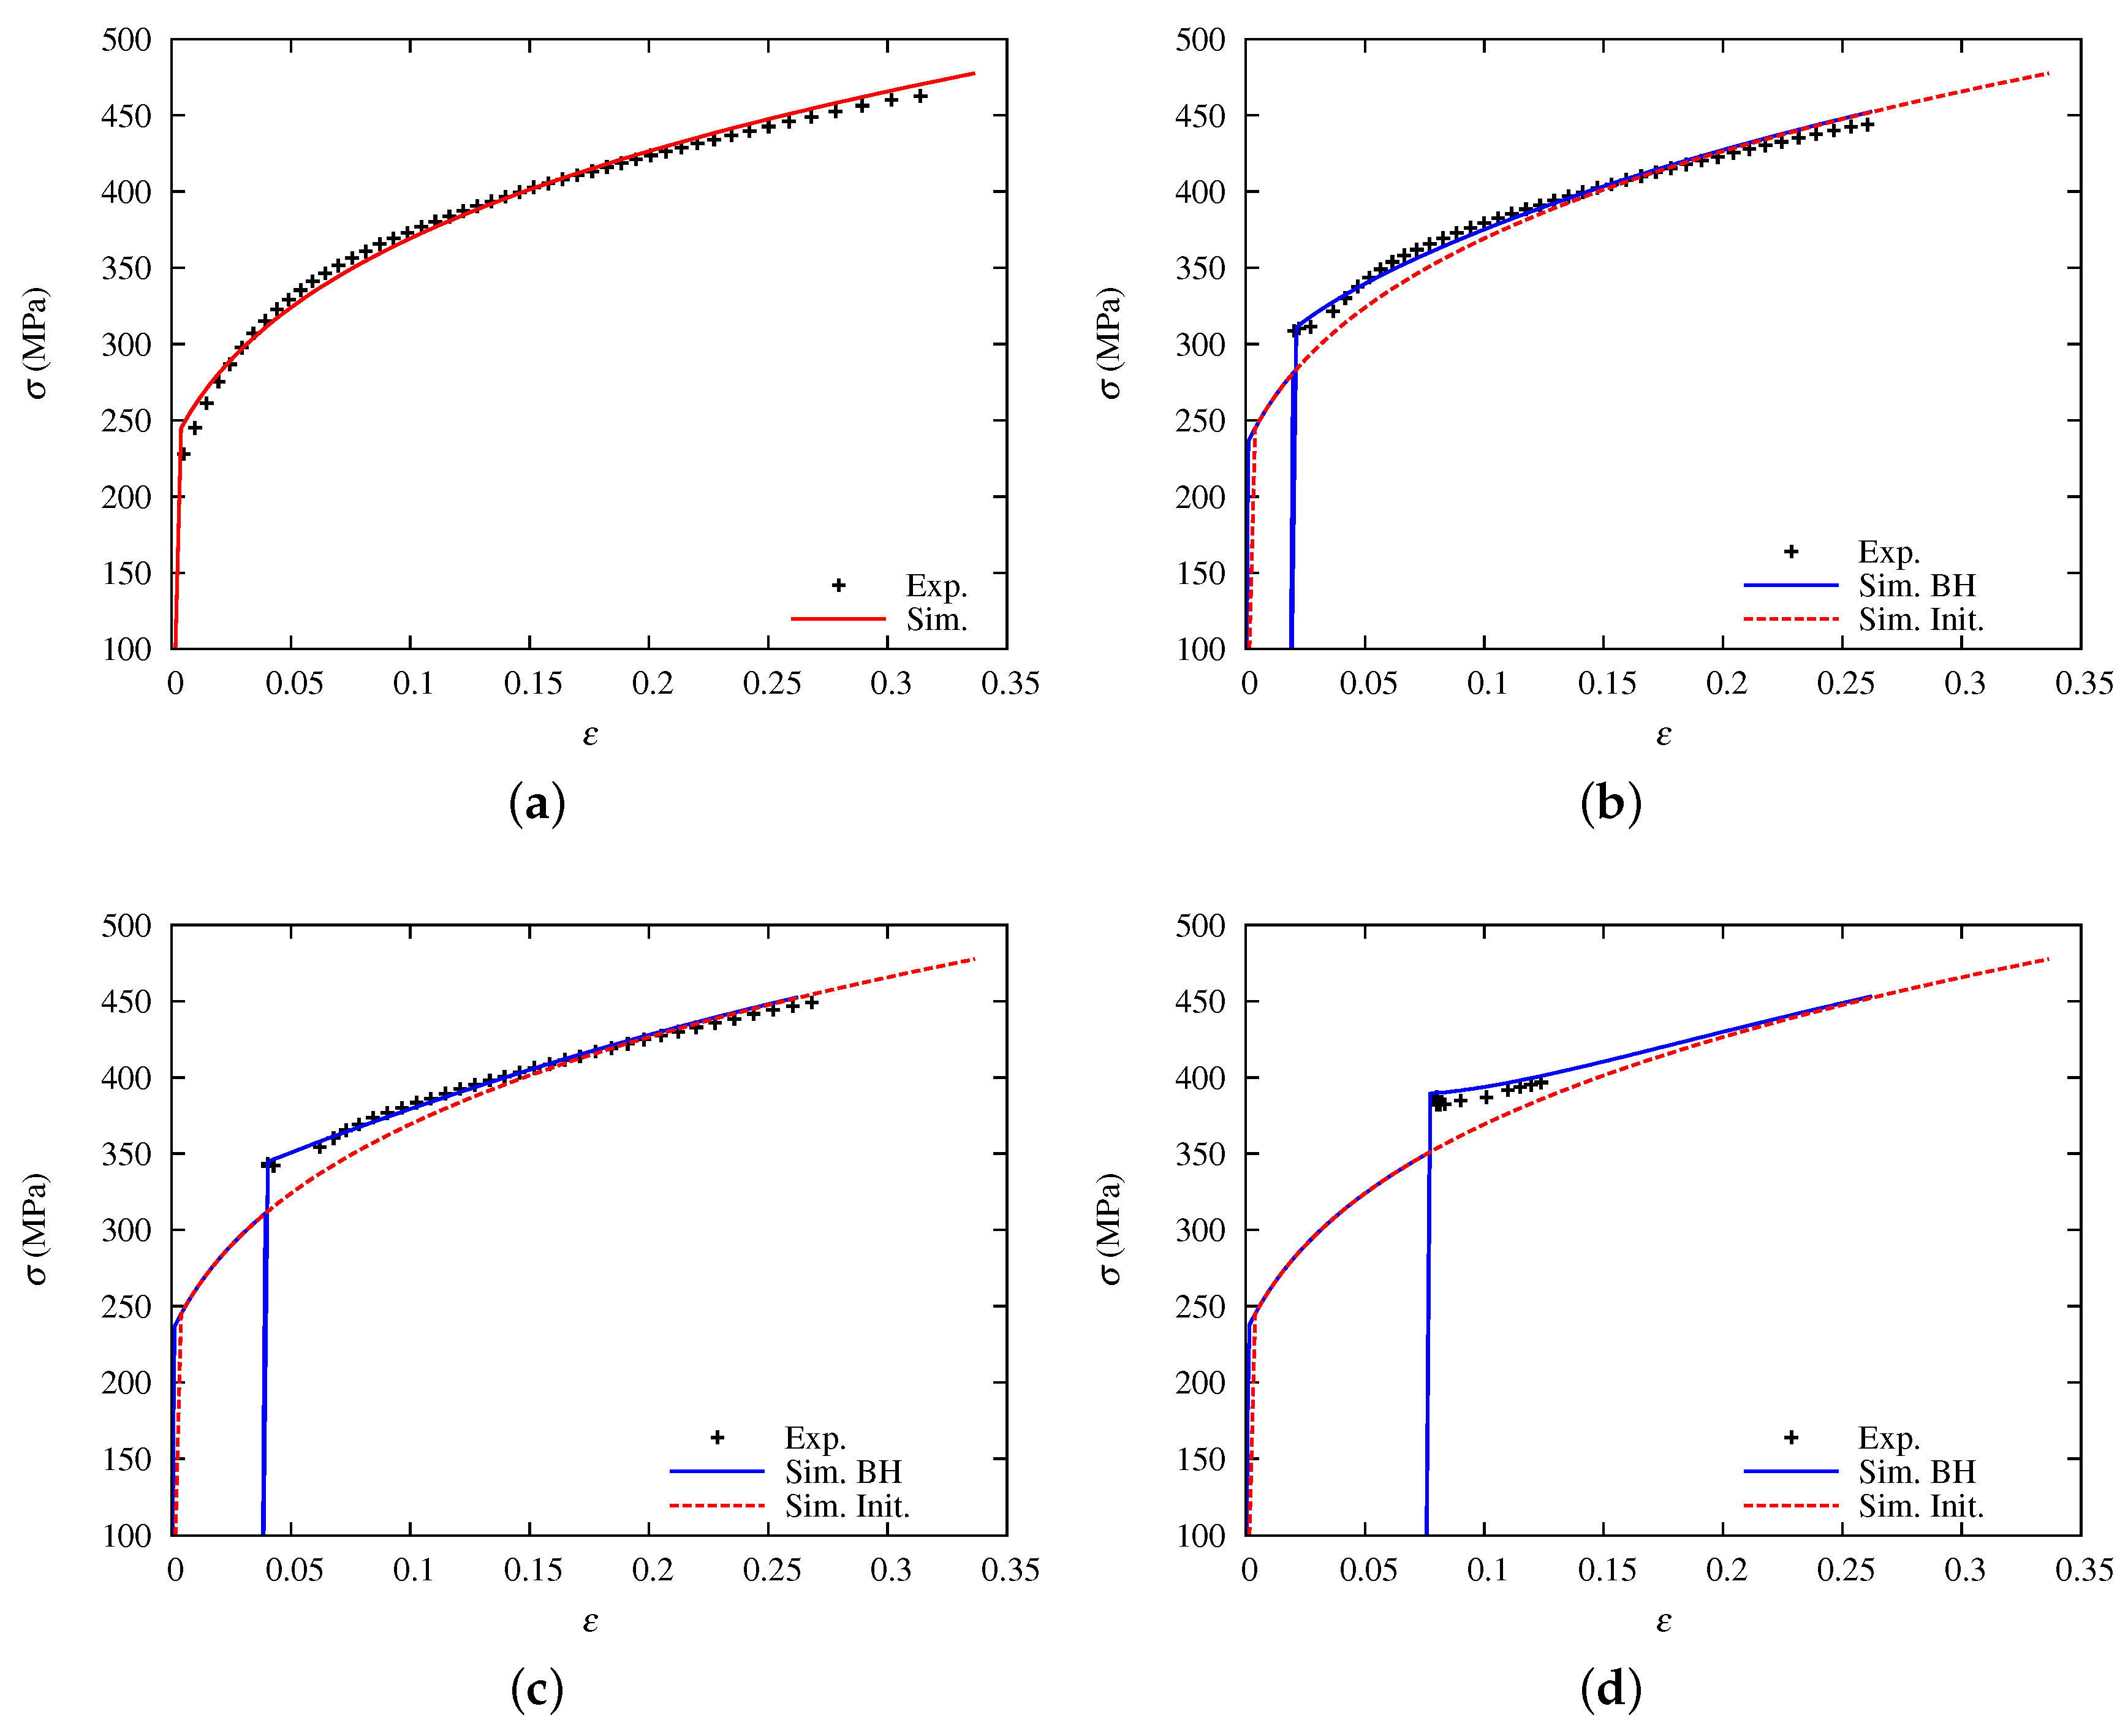
Comparison of experimental and numerical results for the tensile tests are shown in Figure 10. The numerical model uses only one finite element for the tensile sample, assuming a homogeneous strain field. Several steps are performed: firstly, a pre-strain in tension followed by unloading, using the initial mechanical behavior exhibited in Figure 10a (). Then, for the following steps, and the overstress depends on the pre-strain amount. It can be seen that the model captures well the maximum stress after the thermal treatment as well as the convergence towards the initial flow stress. However, no effort was dedicated to the work-hardening stagnation, associated to a flow localisation. Indeed, in this case, the tensile test can no longer be considered as homogeneous. It would be necessary to model the whole structure in order to reproduce also the localisation in bands. Though it is an interesting challenge, this modelling is out of the scope of the present article.
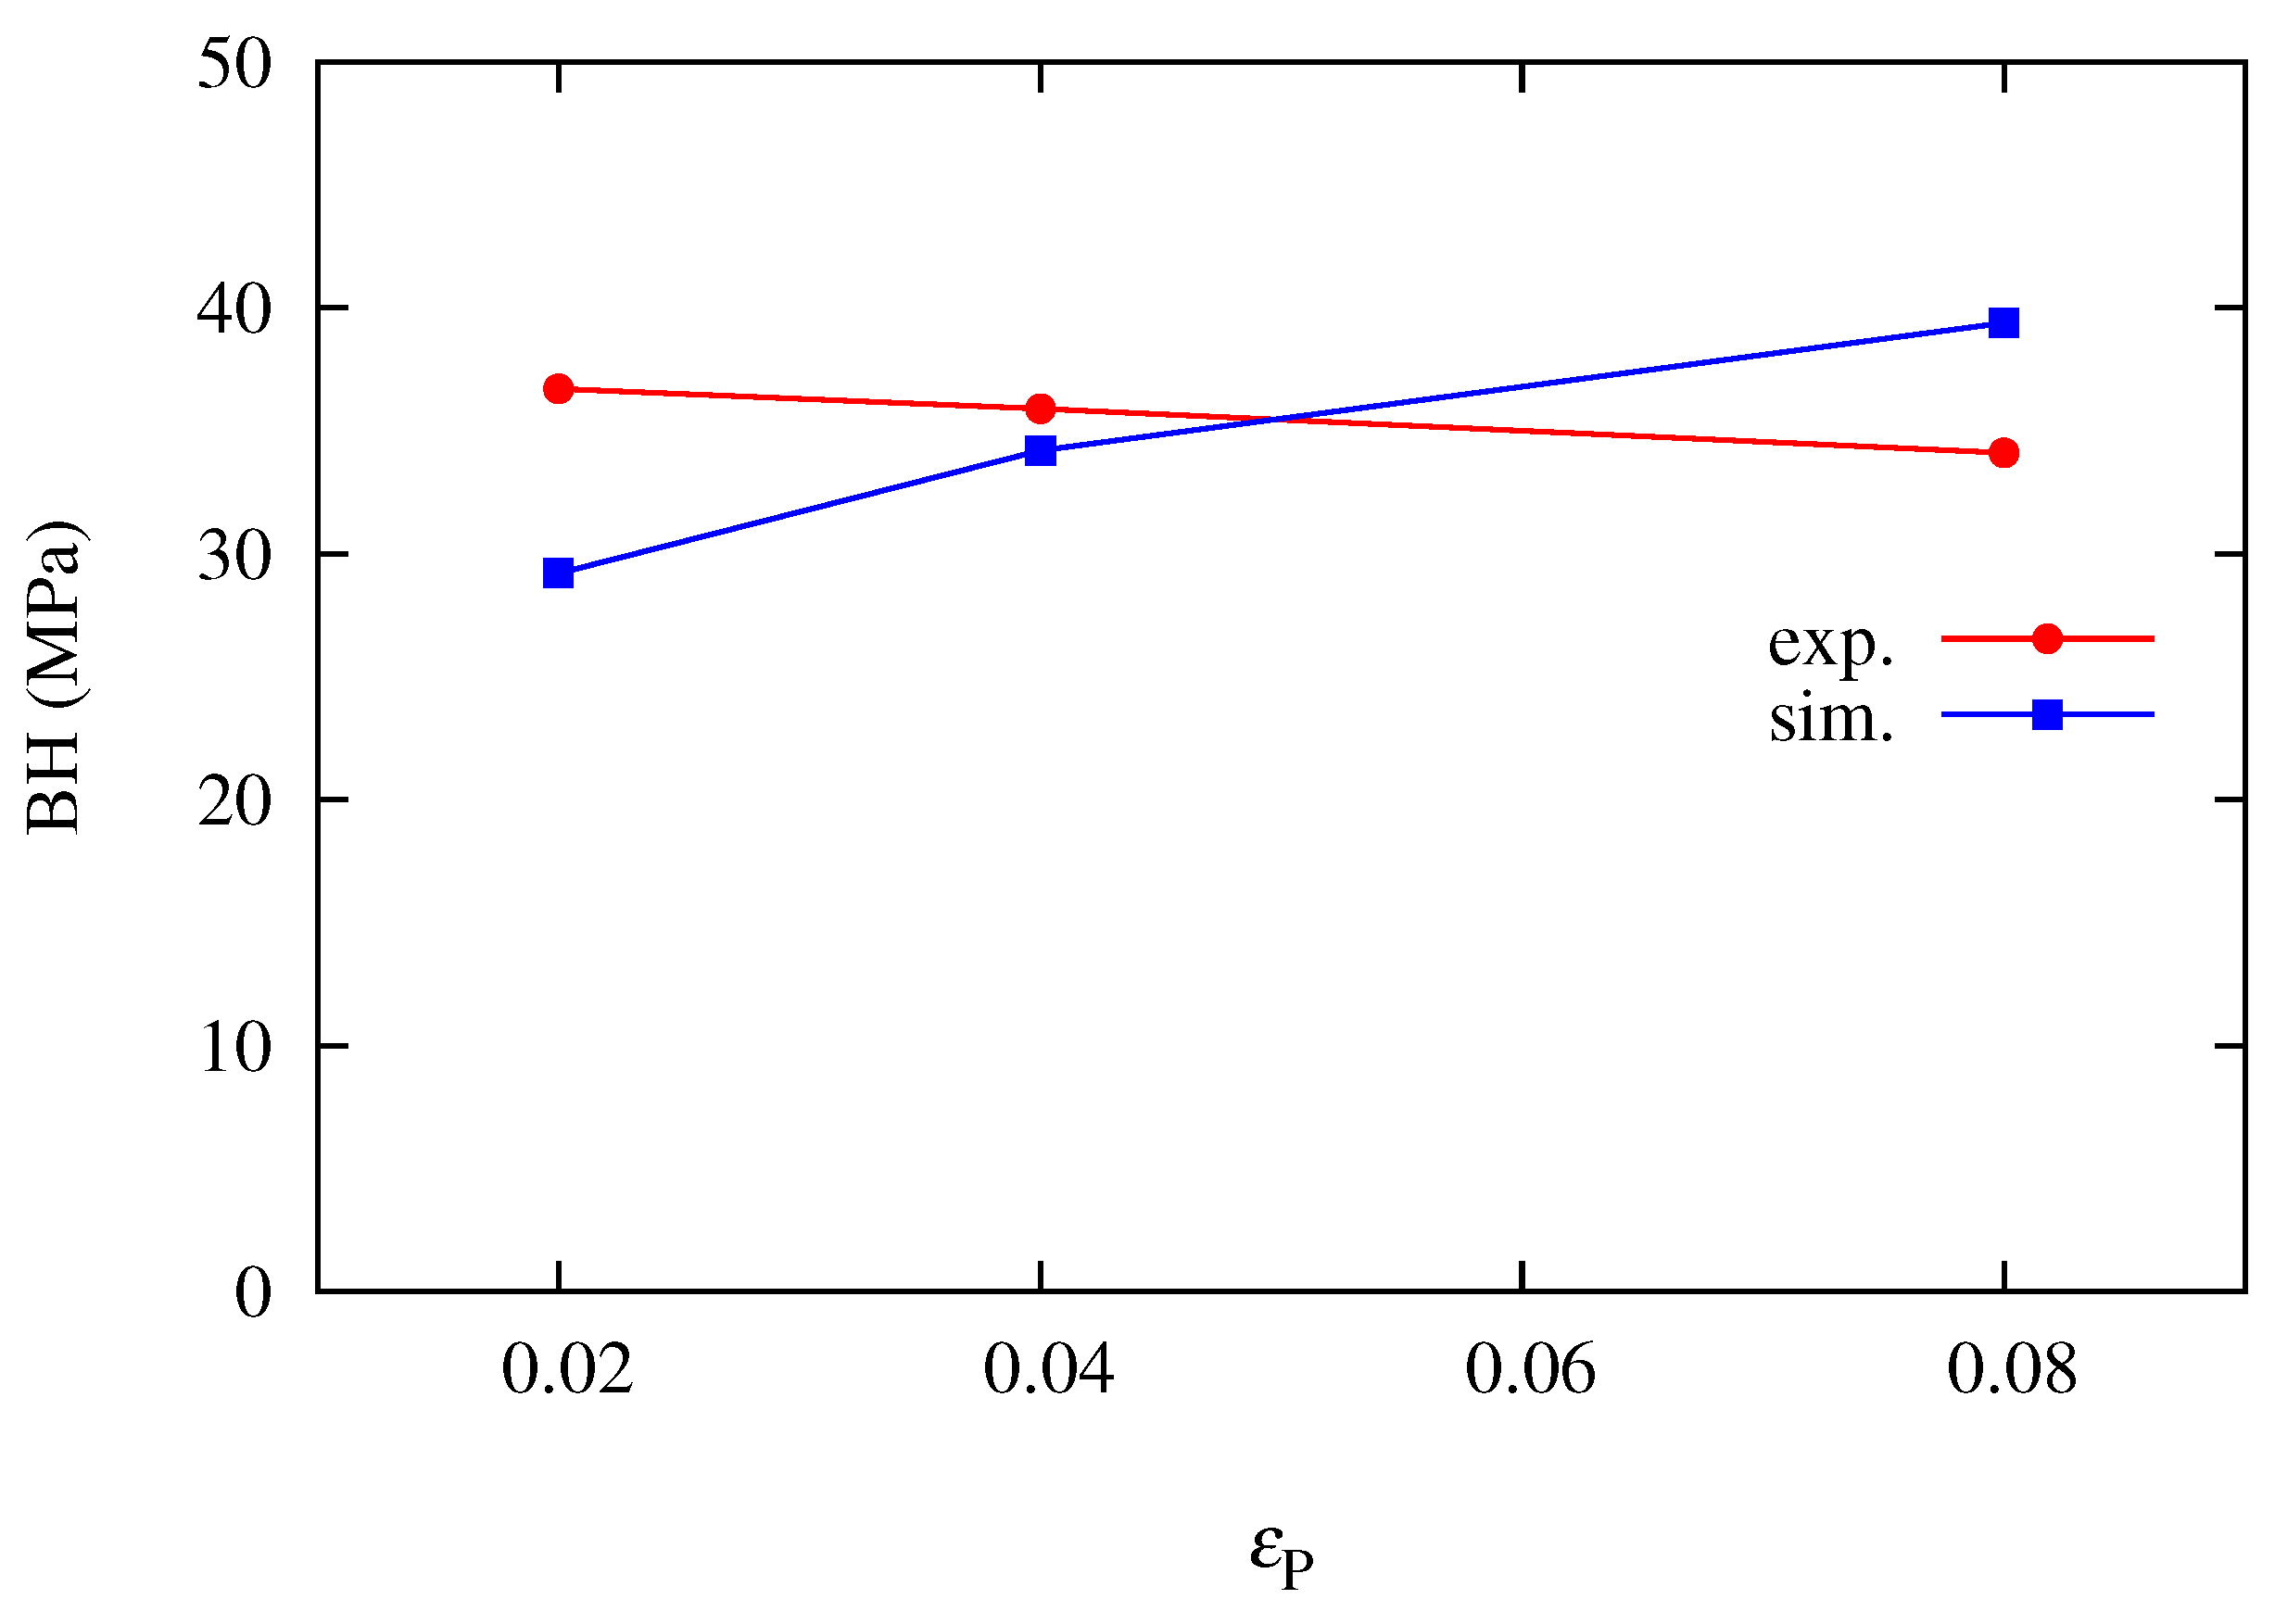
Moreover, although some authors note a decrease of the BH magnitude when the pre-strain increases [13], it seems that predominantly the BH magnitude evolves similarly to the pre-strain, e.g., it increases when the pre-strain increases [7,10,16]. The dependence of the proposed model to the pre-strain magnitude follows this trend, as given by Equation (3). Figure 11 compares the magnitude of the bake hardening effect (BH) calculated from experimental and numerical data. It can be seen that from the experimental data, BH does not evolve significantly over the strain range, though it tends slightly to decrease when the pre-strain increases. This slight discrepancy may come from the fact that material parameters are identified by an inverse procedure over all the tests, and optimisation leads to a compromise, whereas BH magnitude is evaluated only upon the highest stress reached upon reloading.
These steps are used out of identification purposes. Therefore, a next step is the validation of the model, using a different experimental database.
4.2. Numerical Simulation of the Dent Test
The aim is now to develop a numerical model for the multi-step process used in this study with the software Abaqus. Though the material is assumed isotropic, the initial circular blank (radius 135 mm) is modelled with one fourth of the geometry. Symmetry conditions are applied on the two straight edges. The tools are defined as analytical surfaces and are considered rigid. Three-node triangular shell elements are used to mesh the blank (total number of 9271). The mesh size is of the order of 4 mm on the outer diameter and in the area that remains flat under the die. It decreases down to 1.5 mm and is constant in the circular ring for radii in between 40 mm and 100 mm. Then, it further decreases down to 0.6 mm close to the pole. Numerical simulations of both the bulge and the dent tests were performed using axisymmetric elements, 4-node (regular mesh) and 3-node (random mesh) shell elements. The load-displacement curve during dent test was not sensitive to the type of element. Therefore, 3-node shell element, with a random mesh, is chosen in this study. The mesh sensitivity is analysed with regard to both the bulge and the dent tests, to obtain a solution rather independent of the mesh size.
For the hydraulic bulging, as no sliding of the blank between the die and the blank-holder is evidenced experimentally, the blank is clamped on the perimeter located at the outer diameter of the blank; this clamping replaces the blank-holder force applied experimentally and the blank-holder is therefore not modelled. Only the die is introduced in the model, to give the right shape to the blank related to the radius of curvature. The fluid pressure is applied on a gauge area of diameter 100 mm of the blank surface opposite to the die. The die is removed in the dent step whereas the punch is activated in the dent step.
The calculation is subdivided into 4 steps: (i) bulging under the applied pressure, (ii) unloading of the blank by removing the applied pressure and the clamping, (iii) dent at the pole by a vertical movement of the hemispherical punch, of magnitude 2.4 mm as in the experiments, the blank being only pinned along the vertical direction on the intermediate radius and finally (iv) removal of the punch and final springback of the blank.
Concerning the mechanical model, the parameter f is set equal to zero for the 2 first steps. Then, it remains equal to zero when no thermal treatment is performed or is switched to 1, in case of occurrence of a thermal treatment.
4.3. Sensitivity of Dent Resistance to BH Effect
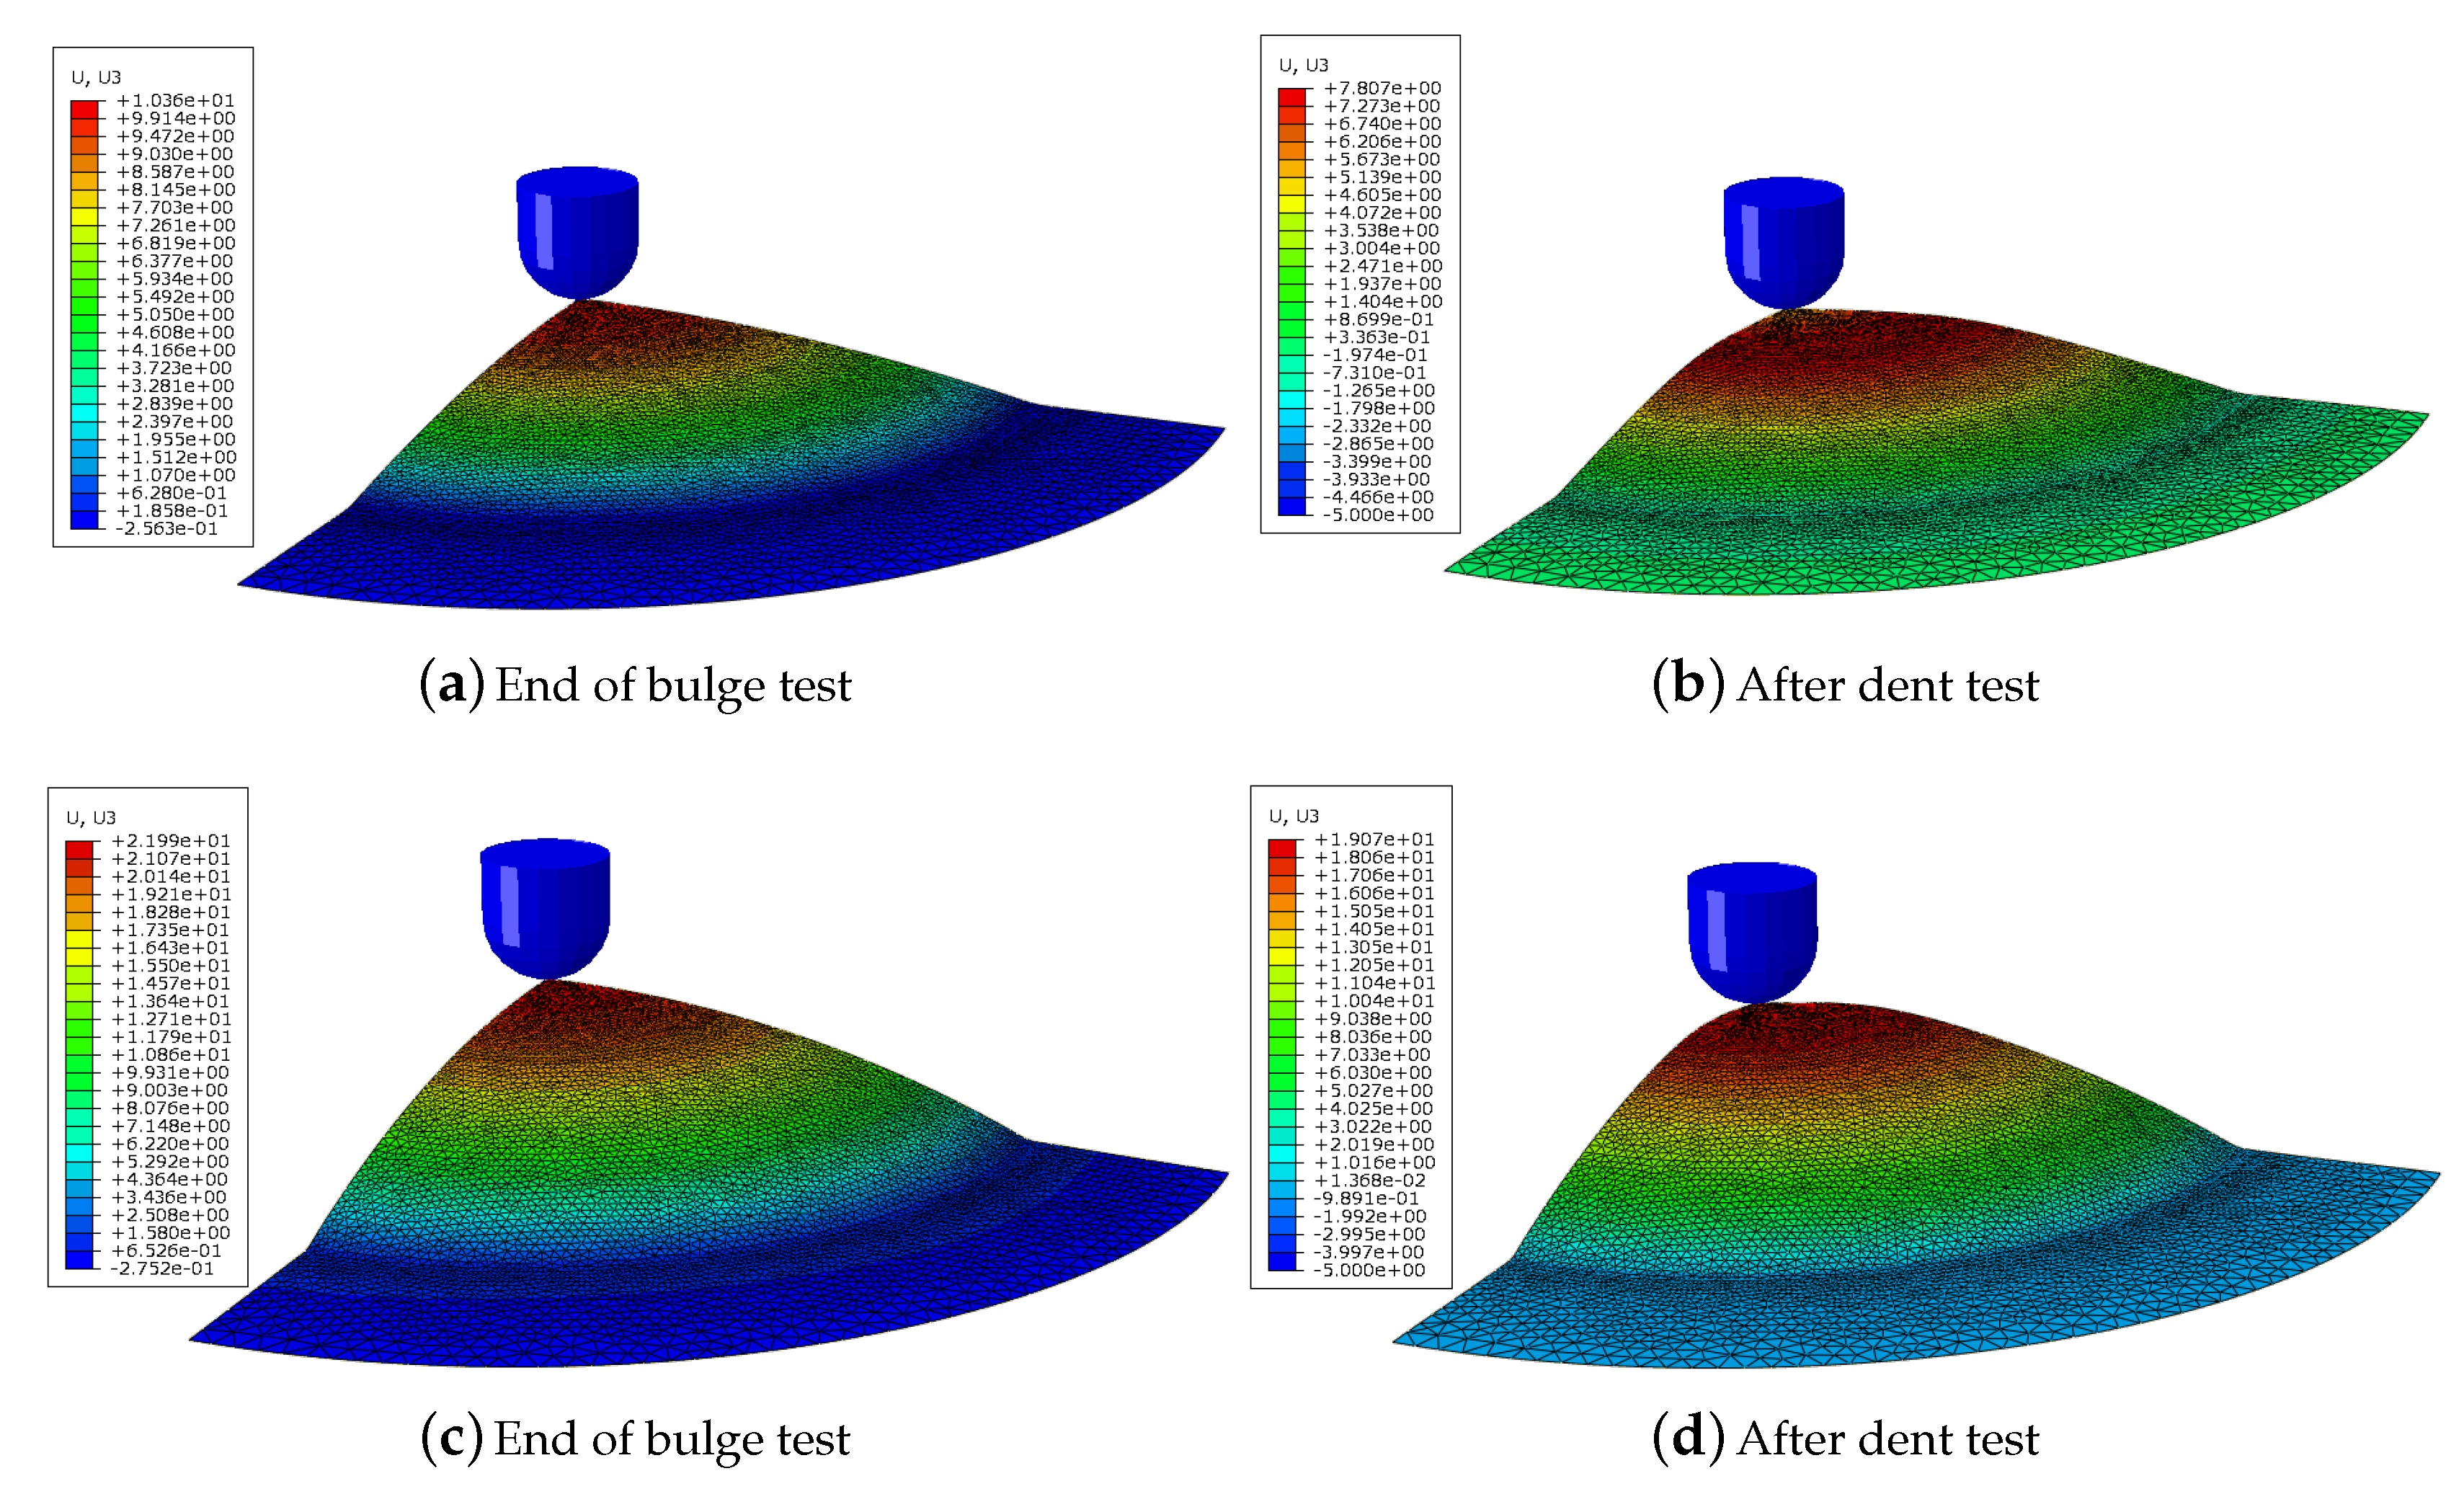
Concerning the numerical simulation, Figure 12 shows the numerical shape for the two pre-strain after bulging and after the dent test. Isovalues of the vertical displacement, i.e., normal to the sheet plane, are displayed. For a pre-strain , the maximum height after removing the internal pressure, corresponding to the shape at the end of the bulge test, a value of 10.4 mm is calculated (respectively 22 mm for a pre-strain of ). At the end of the dent test, when the punch is removed, the maximum height decreases, by 2.6 mm (respectively, 2.9 mm).
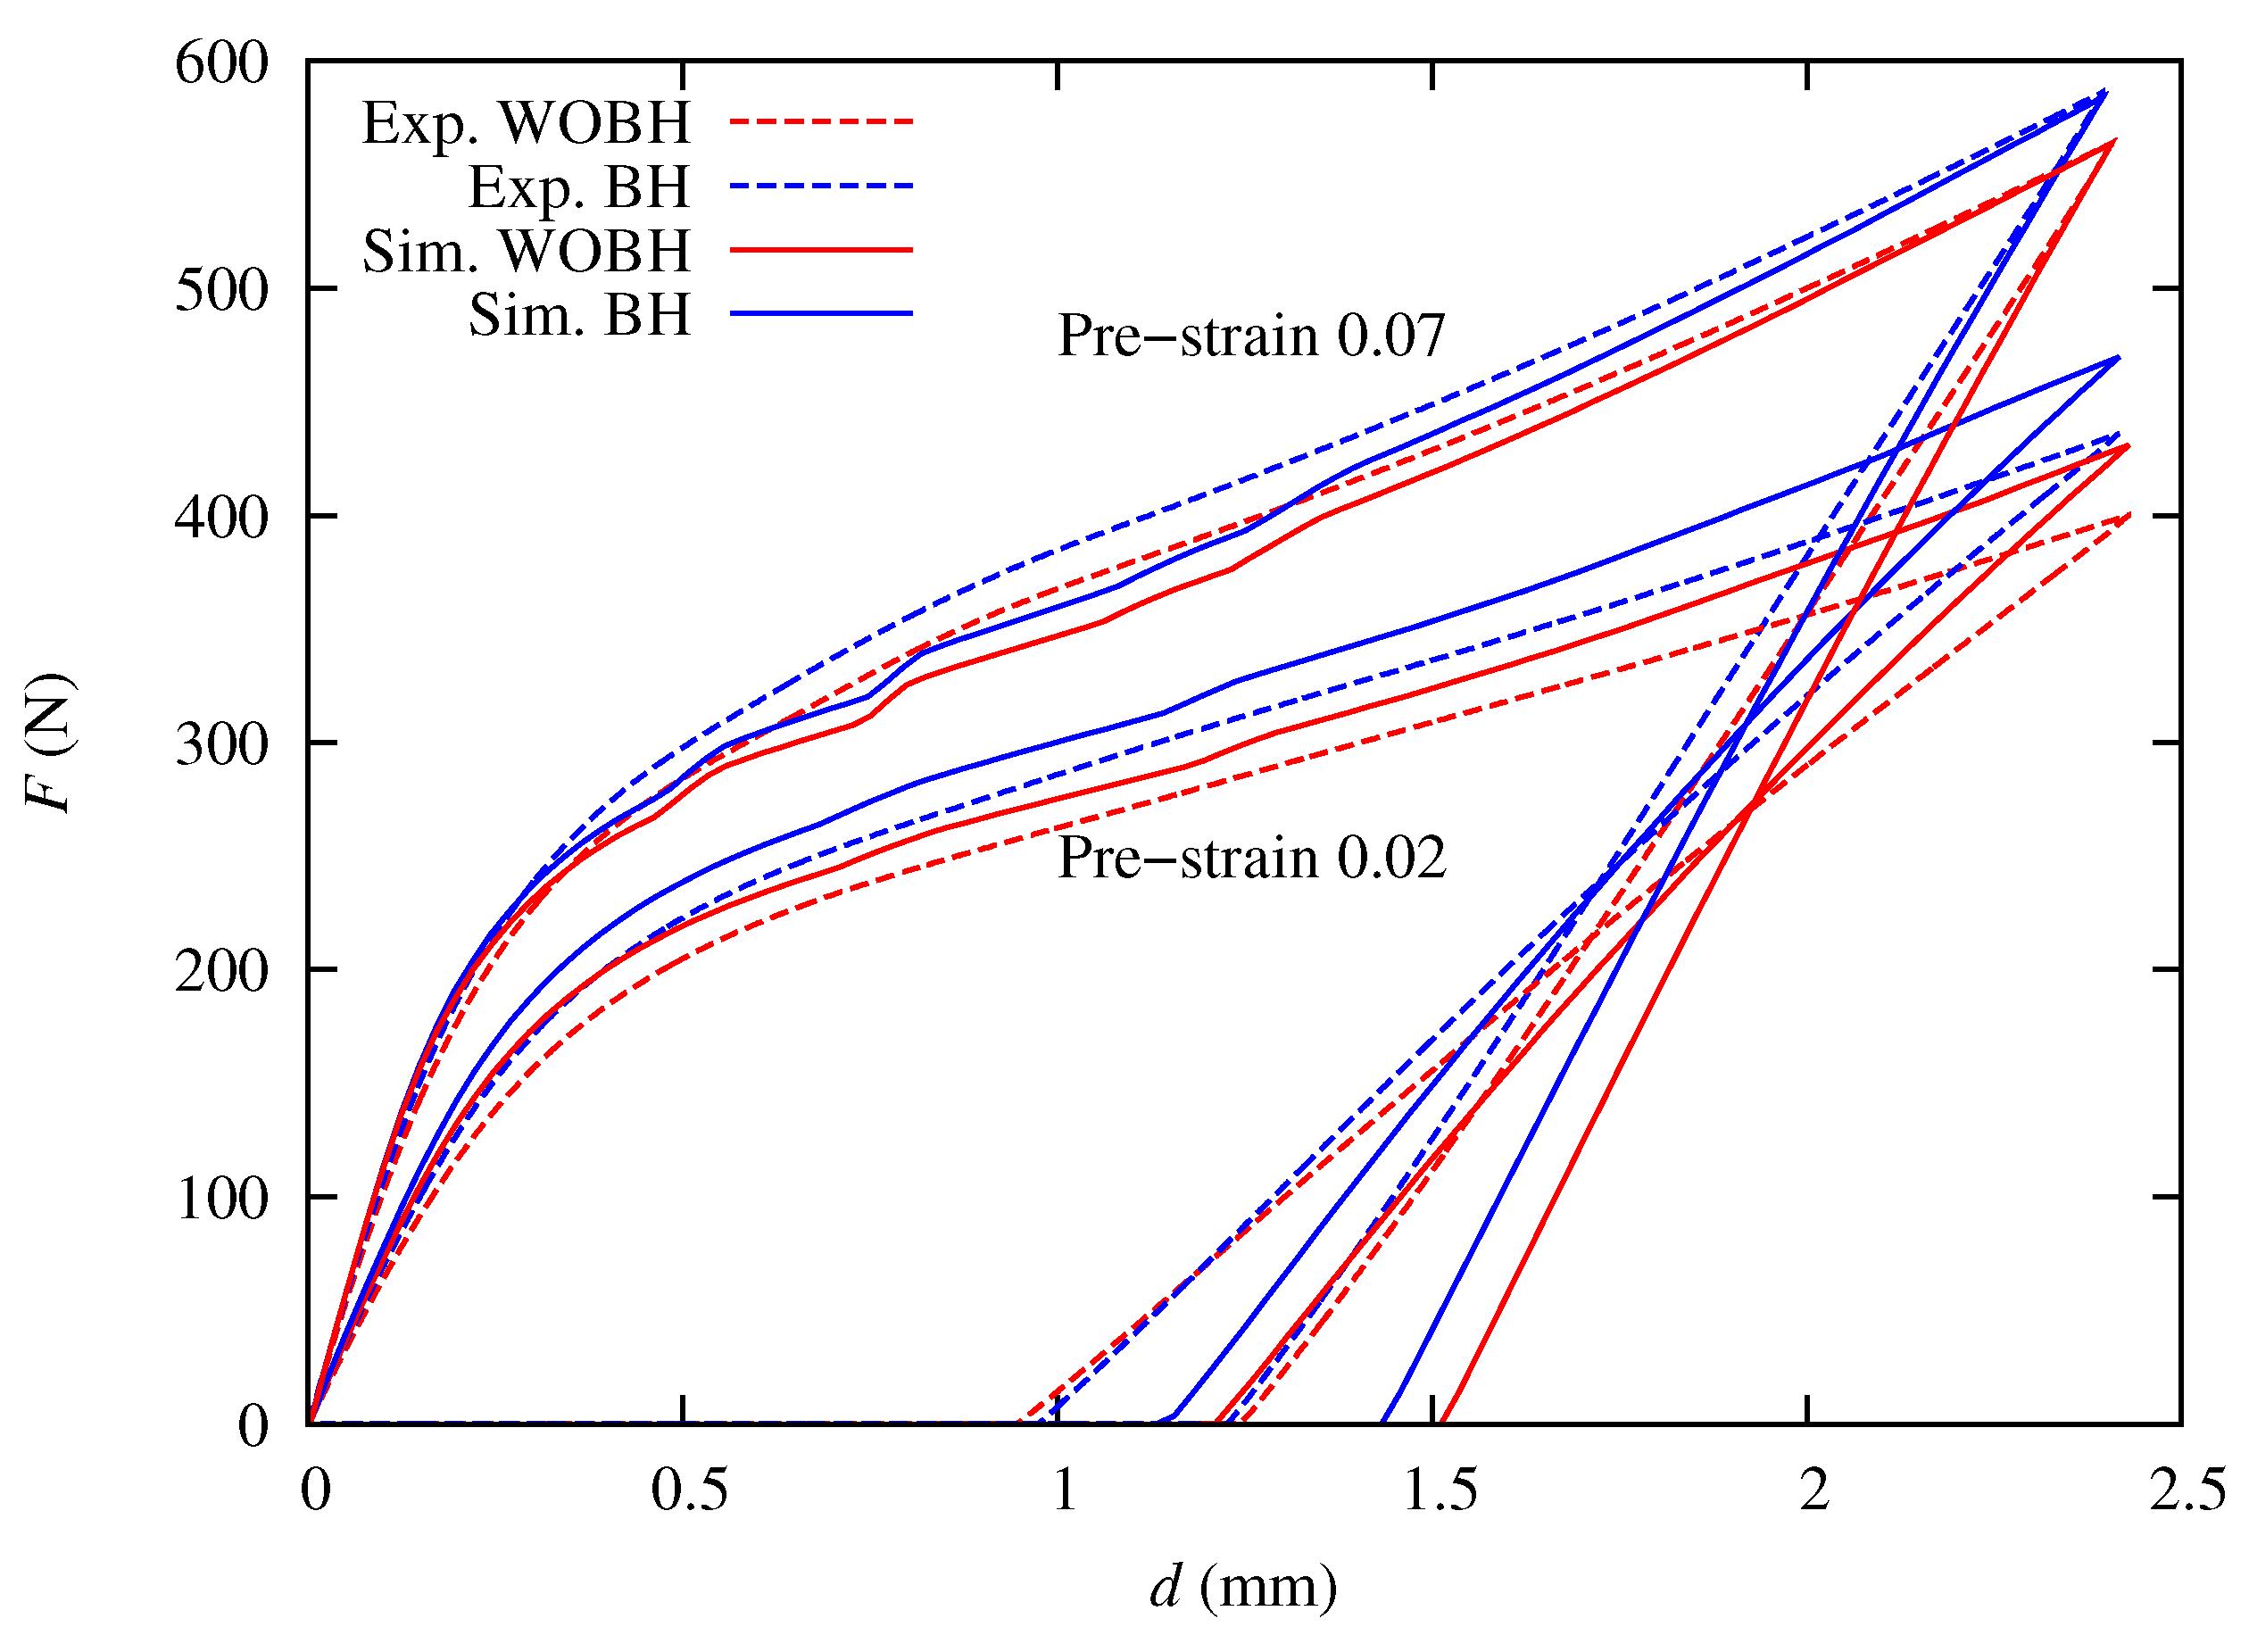
Figure 13 shows a comparison, for the two pre-strain values, of the load evolution during the dent test. The oscillations on the numerical load, clearly visible for the highest pre-strain, seems to come from a local structural instability. For the lowest pre-strain value, it can be seen that the predictions overestimate the loading part, whatever the state of the material, i.e., without or with bake hardening. The gap at the maximum displacement, with or without BH, is around 6.5%. However, the trend is different for the highest pre-strain, and the predicted values lie below the experimental ones, though they converge to exactly the same value at the maximum displacement. The maximum gap, calculated at the displacement of 1 mm, is around 6.2%. However, the unloading numerical slope is higher than the experimental value. This effect is also observed during loading-unloading tensile tests and a decrease of the unloading slope in the constitutive equations, via a dependency of the Young’s modulus with the equivalent plastic strain, should be taken into account to represent this effect [25,26,27]. Globally, the model takes account of the bake hardening effect and further efforts should be given to the numerical simulation of the whole process.
As a whole, the numerical simulation of the dent test with bake hardening gives a close representation to the experimental data. As it is a two-step process, the quality of the end results depend on the prediction of the two stages, i.e., the bulge test and the dent test. The bake hardening magnitude is identified in tension, as the hardening characteristics and used in the numerical simulation of 3D tests, like bulge test, using von Mises yield criterion. Neglecting the anisotropy at this stage could lead to some difficulties to represent correctly the behaviour of the material under a biaxial stress state. Then, the stress state during the dent test is also fully 3D. However, Figure 13 highlights that the proposed approach captures rather well the influence of bake hardening on the dent resistance, all the more that the pre-strain is higher.
5. Conclusions
This study deals with the influence of bake hardening on the experimental and numerical prediction of dent resistance. In the first part, the bake hardening effect for E220BH steel, for a given time and temperature of the thermal treatment, is studied in uniaxial tension. In a second step, specimen of the same material are pre-strained in hydraulic bulging, to shape them into a curved geometry. Then, the static dent resistance is characterised with a dedicated device designed for this purpose. An original phenomenological model is proposed, which takes into account the influence of the pre-strain of the overstress upon reloading. The material parameters are then identified from tensile data using an inverse methodology and three pre-strain magnitudes are considered. A numerical model is developed, which uses as input the new constitutive equations implemented in a user subroutine. The bulge and dent tests are predicted numerically. Results for the dent test show that the bake hardening influences the load reached for an imposed displacement but that the residual displacement in nearly the same for virgin and bake-hardened specimen. The numerical model gives a good prediction of the loading part but tends to overestimate the residual displacement.
Author Contributions
Conceptualization, S.T. and P.Y.M.; Investigation, J.T. and A.J.; Methodology, S.T. and S.L.Z.; Supervision, S.T. and P.Y.M.; Validation, S.T., S.L.Z., J.T. and A.J.; Writing—original draft, S.T.; Writing—review and editing, S.T. and S.L.Z.
Funding
This research was funded by the French “Fond unique interministériel” as part of the collaborative project EMOA (2007–2011).
Acknowledgments
S. Zang would like to thank University of South Brittany for the financial support received for his stay in IRDL in 2014.
Conflicts of Interest
The authors declare no conflict of interest. The founding sponsors had no role in the design of the study; in the collection, analyses, or interpretation of data; in the writing of the manuscript, and in the decision to publish the results.
References
- Asnafi, N. On strength, stiffness and dent resistance of car body panels. J. Mater. Process. Technol. 1995, 49, 13–31. [Google Scholar] [CrossRef]
- Ekstrand, G.; Asnafi, N. On testing of the stiffness and the dent resistance of autobody panels. Mater. Des. 1998, 19, 145–156. [Google Scholar] [CrossRef]
- Holmberg, S.; Thilderkvist, P. Influence of material properties and stamping conditions on the stiffness and static dent resistance of automotive panels. Mater. Des. 2002, 23, 681–691. [Google Scholar] [CrossRef]
- Holmberg, S.; Nejabat, B. Numerical assessment of stiffness and dent properties of automotive exterior panels. Mater. Des. 2004, 25, 361–368. [Google Scholar] [CrossRef]
- Shen, H.; Li, S.; Chen, Q. Numerical analysis of panels’ dent resistance considering the Bauschinger effect. Mater. Des. 2010, 31, 870–876. [Google Scholar] [CrossRef]
- Lee, J.Y.; Lee, M.G.; Barlat, F.; Chung, K.H.; Kim, D.J. Effect of nonlinear multi-axial elasticity and anisotropic plasticity on quasi-static dent properties of automotive steel sheets. Int. J. Solids Struct. 2016, 87, 254–266. [Google Scholar]
- Kvackaj, T.; Mamuzic, I. Development of bake hardening effect by plastic deformation and annealing conditions. Metallurgija 2006, 45, 51–55. [Google Scholar]
- De, A.K.; Vandeputte, S.; De Cooman, B.C. Static strain aging behavior of ultra low carbon bake hardening steel. Metall. Mater. Trans. A 1999, 41, 831–837. [Google Scholar] [CrossRef]
- Kuang, C.F.; Li, J.; Zhang, S.G.; Wang, J.; Liu, H.F.; Volinsky, A.A. Effects of quenching and tempering on the microstructure and bake hardening behavior of ferrite and dual phase steels. Mater. Sci. Eng. A 2014, 613, 178–183. [Google Scholar] [CrossRef]
- Ormsuptave, N.; Uthaisangsuk, V. Modeling of bake-hardening effect for fine grain bainite-aided dual phase steel. Mater. Des. 2017, 118, 314–329. [Google Scholar] [CrossRef]
- Ramazani, A.; Bruehl, S.; Gerber, T.; Bleck, W.; Prahl, U. Quantification of bake hardening effect in DP600 and TRIP700 steels. Mater. Des. 2014, 57, 479–486. [Google Scholar] [CrossRef]
- Sha, M.H.; Shi, G.D.; Wang, Y.; Qiao, J. Paint-bake response of AZ80 and AZ31 Mg alloys. Trans. Nonferrous Met. Soc. China 2010, 20, 571–575. [Google Scholar] [CrossRef]
- Berbenni, S.; Favier, V.; Lemoine, X.; Berveiller, M. A micromechanical approach to model the bake hardening effect for low carbon steels. Scr. Mater. 2004, 51, 303–308. [Google Scholar] [CrossRef]
- Vasilyev, A.A.; Lee, H.C.; Kuzmin, N.L. Nature of strain aging stages in bake hardening steel for automotive application. Mater. Sci. Eng. A 2008, 485, 282–289. [Google Scholar] [CrossRef]
- Woo, C.J. Effect of Prestrain on Aging and Bake Hardening of Cold-Rolled, Continuously Annealed Steel Sheets. Metall. Mater. Trans. A 1998, 29, 463–467. [Google Scholar]
- Kilic, S.; Ozturk, F.; Sigirtmac, T.; Tekin, G. Effects of Pre-strain and Temperature on Bake Hardening of TWIP900cr Steel. Int. J. Iron Steel Res. 2015, 22, 361–365. [Google Scholar] [CrossRef]
- Ballarin, V.; Soler, M.; Perlade, A.; Lemoine, X.; Forest, S. Mechanisms and Modeling of Bake-Hardening Steels: Part I. Metall. Mater. Trans. A 2009, 40, 1367–1374. [Google Scholar] [CrossRef]
- Ballarin, V.; Perlade, A.; Lemoine, X.; Bouaziz, O.; Forest, S. Mechanisms and Modeling of Bake-Hardening Steels: Part II. Complex Loading Paths. Metall. Mater. Trans. A 2009, 40, 1375–1382. [Google Scholar] [CrossRef]
- Dehghani, K.; Shafiei, A. Predicting the bake hardenability of steels using neural network modeling. Mater. Lett. 2008, 62, 173–178. [Google Scholar]
- Dehghani, K.; Nekahi, A. Artificial neural network to predict the effect of thermomechanical treatments on bake hardenability of low carbon steels. Mater. Des. 2010, 31, 2224–2229. [Google Scholar]
- Nekahi, A.; Dehghani, K. Modeling the thermomechanical effects on baking behavior of low carbon steels using response surface methodology. Mater. Des. 2010, 31, 3845–3851. [Google Scholar] [CrossRef]
- Thuillier, S.; Manach, P.Y. Comparison of the work-hardening of metallic sheets using tensile and shear strain paths. Int. J. Plast. 2009, 25, 733–751. [Google Scholar] [CrossRef]
- Zang, S.L.; Thuillier, S.; Le Port, A.; Manach, P.Y. Prediction of anisotropy and hardening for metallic sheets in tension, simple shear and biaxial tension. Int. J. Mech. Sci. 2011, 53, 338–347. [Google Scholar] [CrossRef]
- Zang, S.; Lee, M.G.; Sun, L.; Kim, J.H. Measurement of the bauschinger behavior of sheet metals by three-point bending springback test with pre-strained strips. Int. J. Plast. 2014, 59, 84–107. [Google Scholar] [CrossRef]
- Morestin, F.; Boivin, M. On the necessity of taking into account the variation in the Young modulus with plastic strain in elastic-plastic software. Nucl. Eng. Des. 1996, 162, 107–116. [Google Scholar] [CrossRef]
- Jung, J.; Jun, S.; Lee, H.S.; Kim, B.M.; Lee, M.G.; Kim, J.K. Anisotropic Hardening Behaviour and Springback of Advanced High-Strength Steels. Metals 2017, 7, 480. [Google Scholar] [CrossRef]
- Seo, K.Y.; Kim, J.H.; Lee, H.S.; Kim, J.H.; Kim, B.M. Effect of Constitutive Equations on Springback Prediction Accuracy in the TRIP1180 Cold Stamping. Metals 2018, 8, 18. [Google Scholar] [CrossRef]
Figure 1.
Impact of a hard projectile on a metallic panel, illustrating the importance of an improved dent resistance, in terms of the aesthetics of the product. The impact if highly localised compared to the size of the outer panel.
Figure 1.
Impact of a hard projectile on a metallic panel, illustrating the importance of an improved dent resistance, in terms of the aesthetics of the product. The impact if highly localised compared to the size of the outer panel.

Figure 2.
Temperature evolution during heating (15 min at an average temperature of 165 °C) and then slow cooling down to room temperature. Each colour corresponds to a batch of samples and three curves of the same colour represent the signals of the three thermocouples.
Figure 2.
Temperature evolution during heating (15 min at an average temperature of 165 °C) and then slow cooling down to room temperature. Each colour corresponds to a batch of samples and three curves of the same colour represent the signals of the three thermocouples.
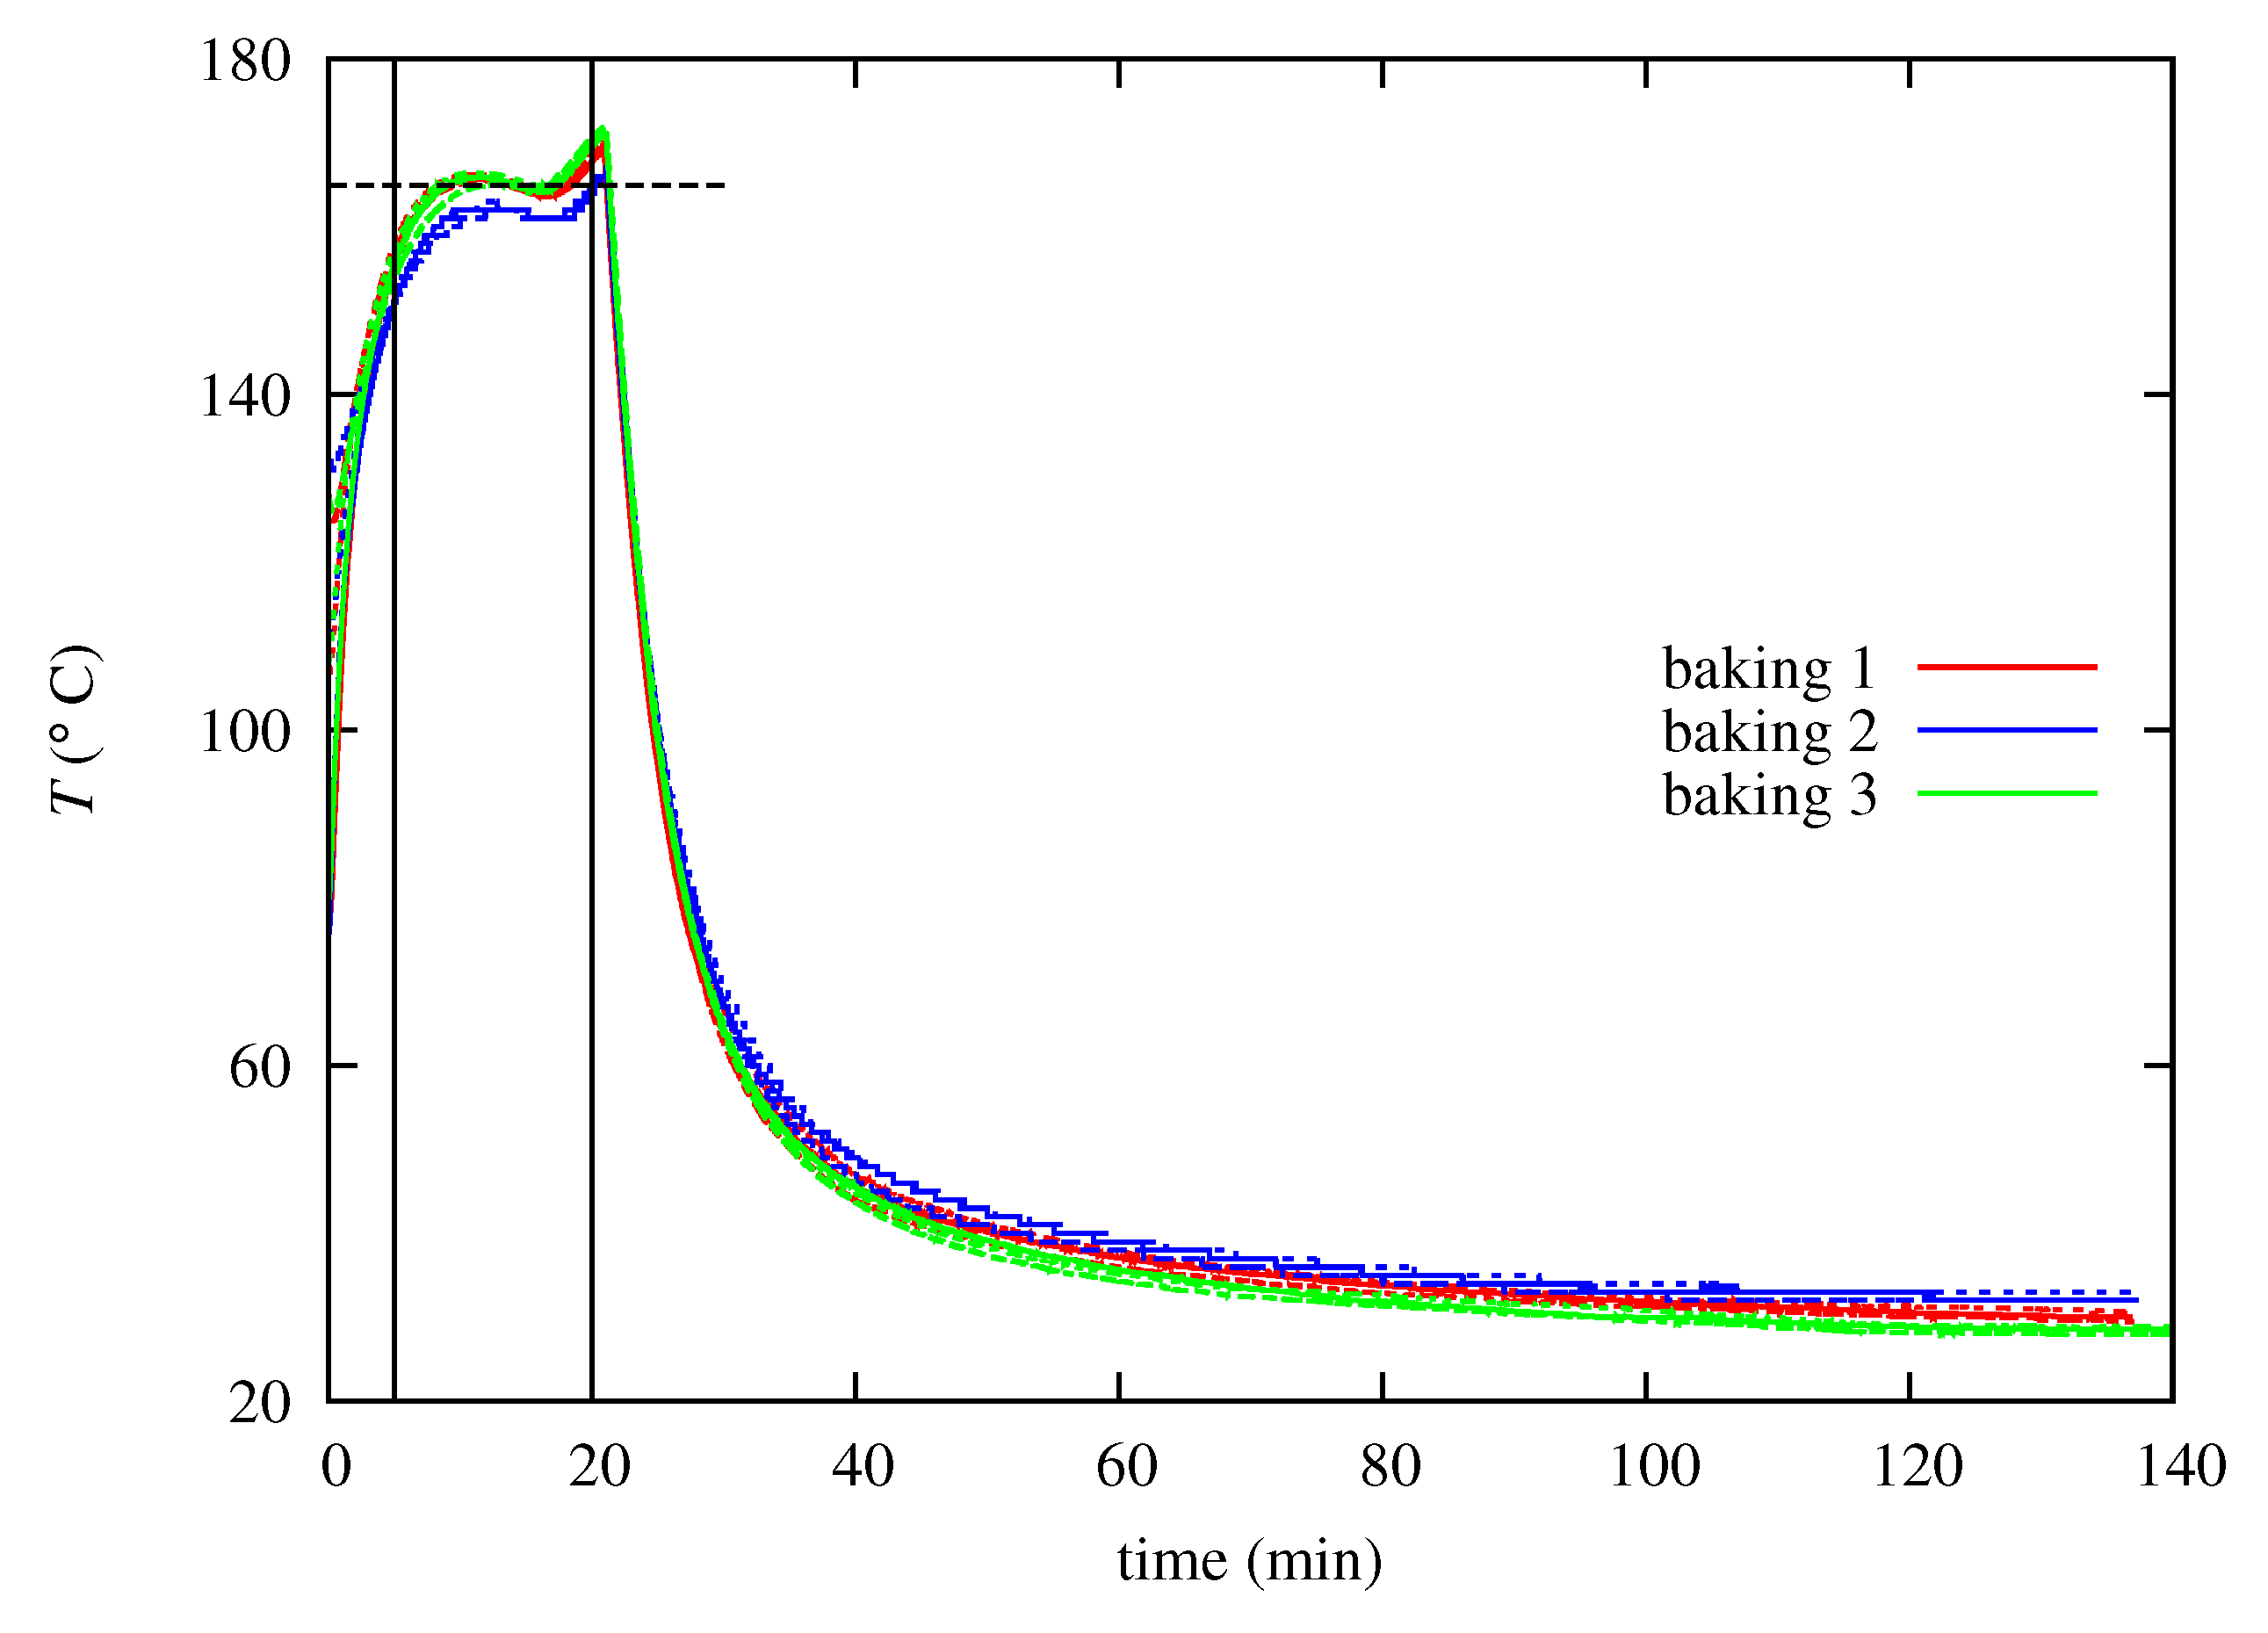
Figure 3.
Thermal treatment of bulged specimen.

Figure 4.
Device designed to characterise the dent resistance. (a) Schematic representation of dent test; (b) Experimental setup and sample.
Figure 4.
Device designed to characterise the dent resistance. (a) Schematic representation of dent test; (b) Experimental setup and sample.

Figure 5.
Visualisation of the dent depth with digital image correlation (DIC): pole geometry after bulging (a) and visualisation of the dent depth (b). This images correspond to the smallest pre-strain, with the permanent dent depth around 1 mm.
Figure 5.
Visualisation of the dent depth with digital image correlation (DIC): pole geometry after bulging (a) and visualisation of the dent depth (b). This images correspond to the smallest pre-strain, with the permanent dent depth around 1 mm.

Figure 6.
Tensile pre-strain followed by heat treatment and tensile deformation. Bake hardening (BH) effect is evidenced by the stress jump after the second loading in tension. The curves of the subsequent tension, after baking, are shifted horizontally by the amplitude of the pre-strain.
Figure 6.
Tensile pre-strain followed by heat treatment and tensile deformation. Bake hardening (BH) effect is evidenced by the stress jump after the second loading in tension. The curves of the subsequent tension, after baking, are shifted horizontally by the amplitude of the pre-strain.

Figure 7.
Bulge test. Each colour and line type stands for a single test. The tests can be gathered around the maximum pole height: 13 mm in red, 28 mm in blue and 29.5 mm in green. (a) Evolution of the fluid pressure as a function of the maximum height, as measured on the outer surface; (b) evolution of the fluid pressure as a function of the strain component

Figure 8.
Load versus corrected displacement (d) during dent test with (BH) or without bake hardening (WOBH), after a pre-strain in hydraulic bulging. Continuous and dashed lines represent two tests having the same pre-strain magnitude. (a) Pre-strain ; (b) Pre-strain .
Figure 8.
Load versus corrected displacement (d) during dent test with (BH) or without bake hardening (WOBH), after a pre-strain in hydraulic bulging. Continuous and dashed lines represent two tests having the same pre-strain magnitude. (a) Pre-strain ; (b) Pre-strain .
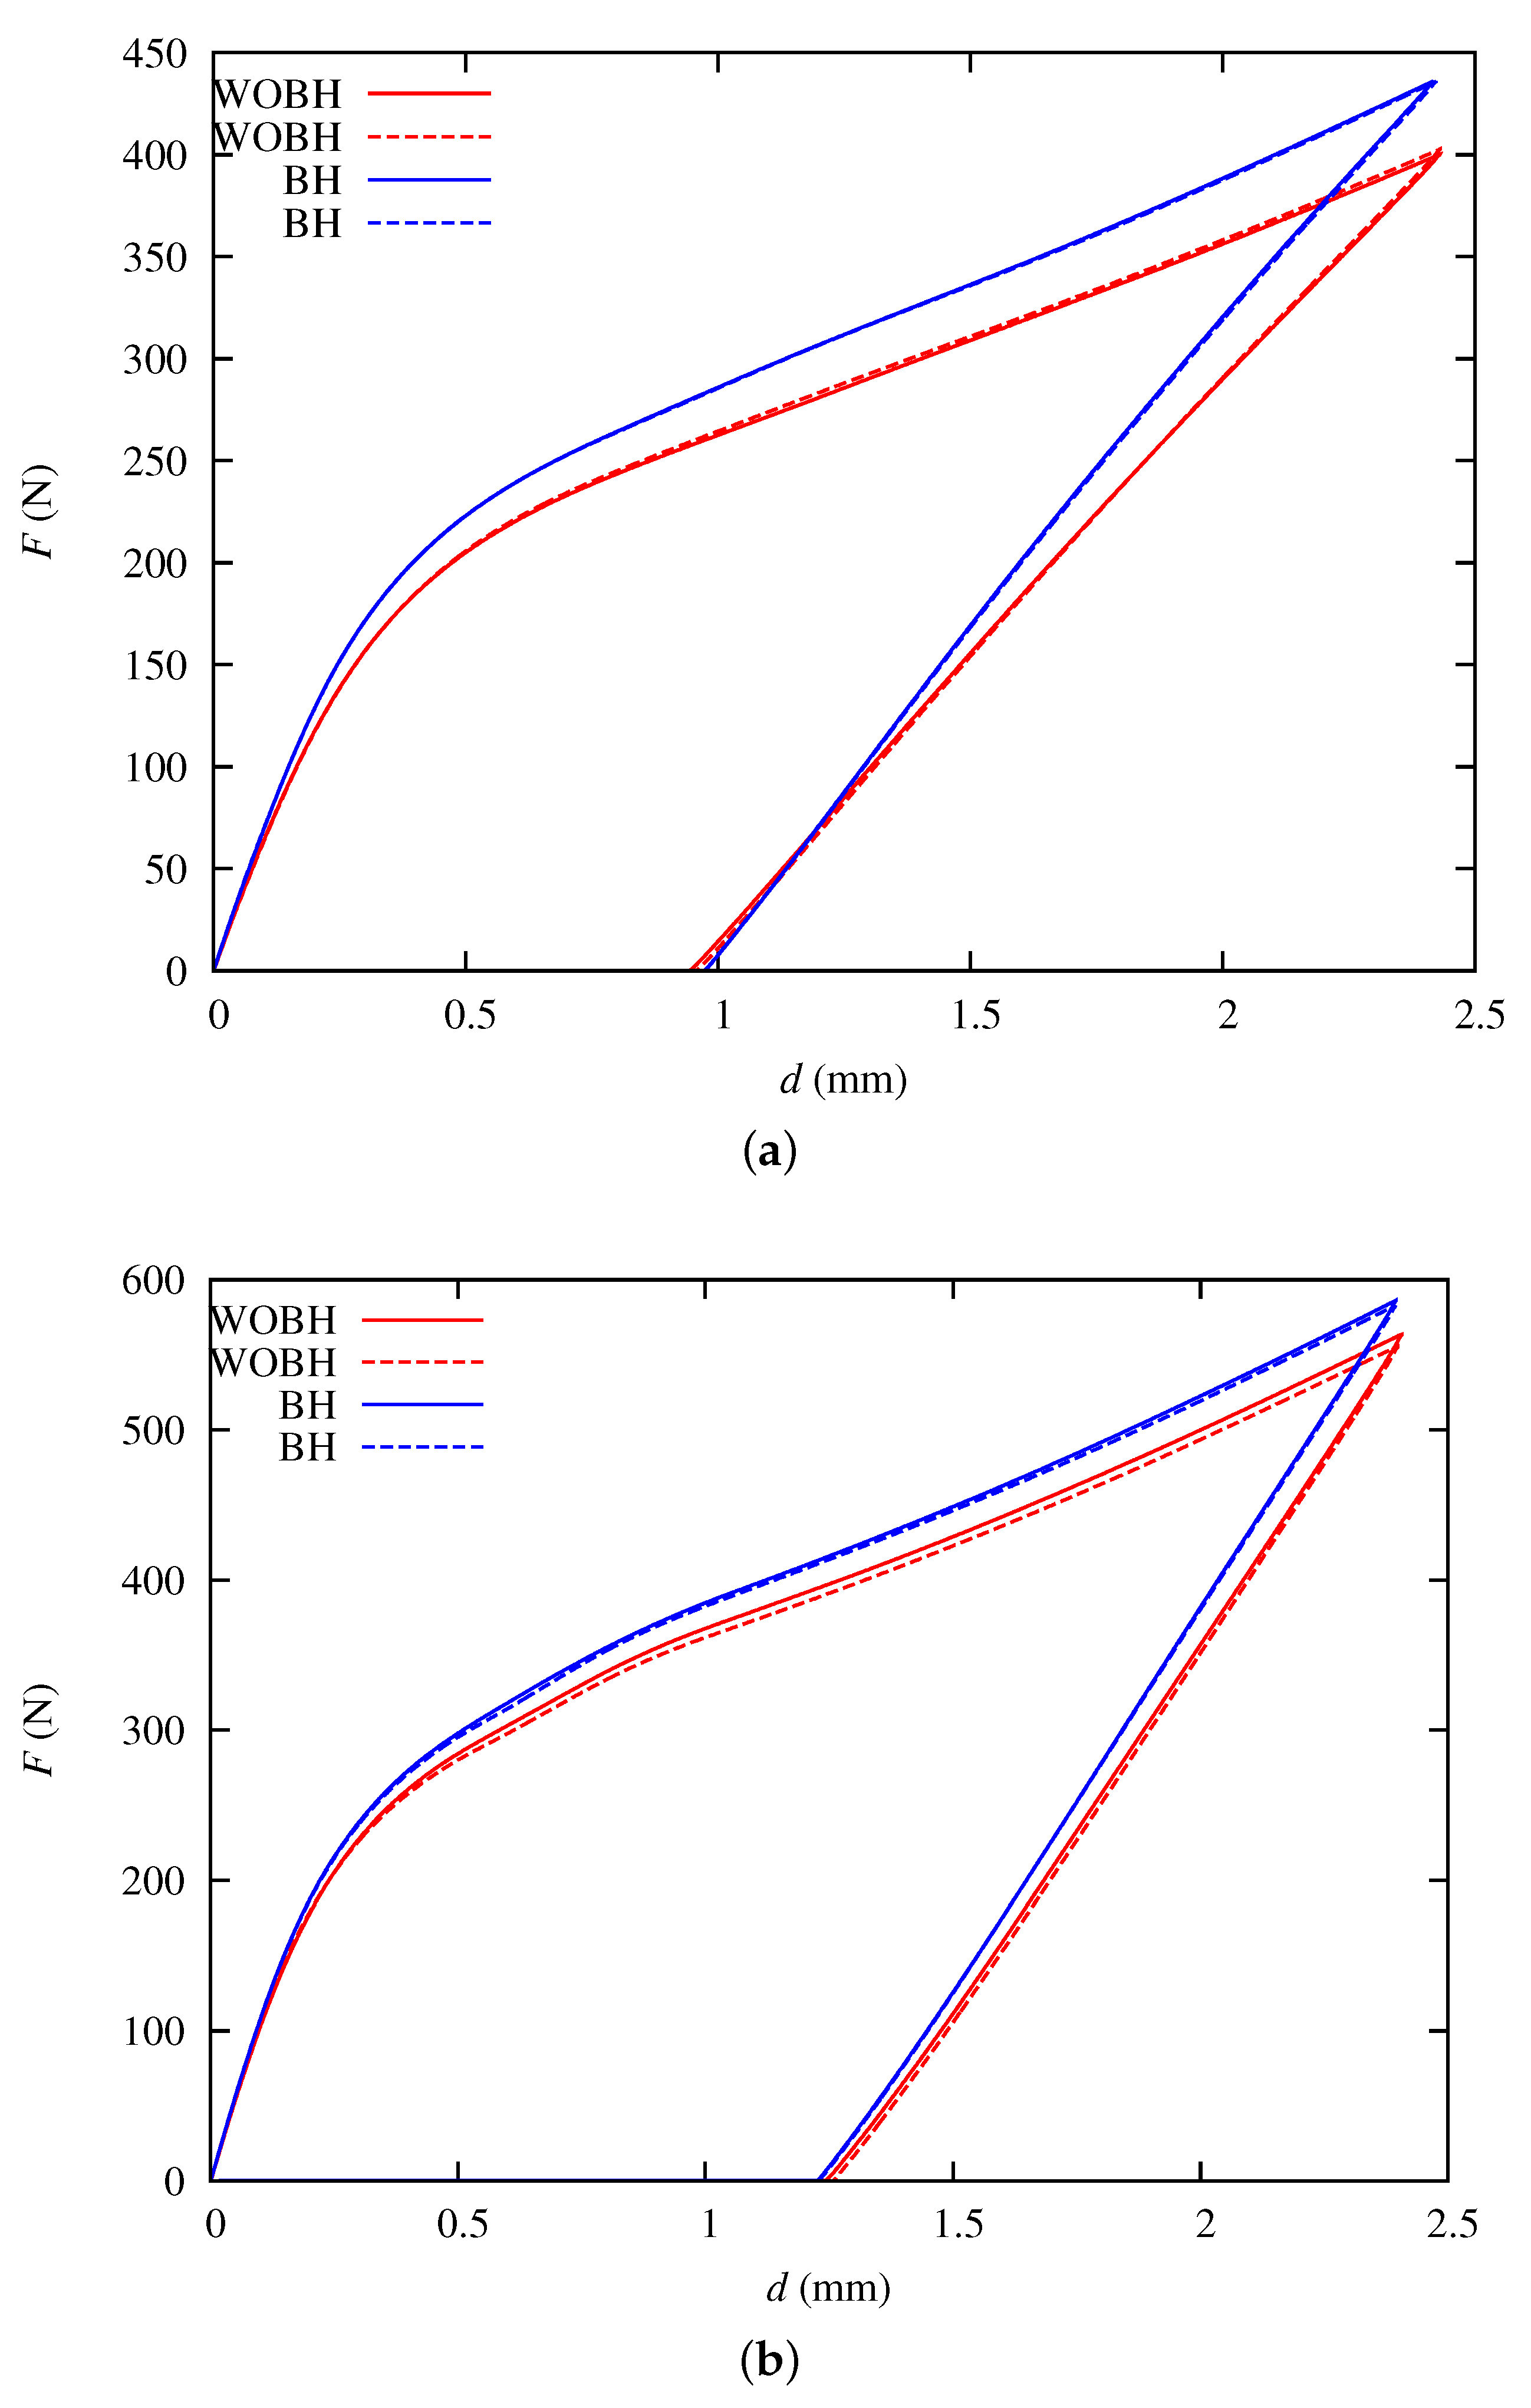
Figure 9.
Dent test with (BH) or without bake hardening (WOBH), after a pre-strain in hydraulic bulging. Several loading-unloading-reloading sequences are applied during the tests. Continuous and dashed lines represent two tests having the same pre-strain magnitude. (a) Pre-strain ; (b) Pre-strain .

Figure 10.
Modeling of the mechanical behavior. (a) Initial; (b) Pre-strain 0.02; (c) Pre-strain 0.04; (d) Pre-strain 0.08.
Figure 10.
Modeling of the mechanical behavior. (a) Initial; (b) Pre-strain 0.02; (c) Pre-strain 0.04; (d) Pre-strain 0.08.

Figure 11.
Comparison of the BH magnitude calculated from experimental and numerical data.

Figure 12.
Numerical deformed geometries. Pre-strain intensity = 0.02 for (a,b), and = 0.07 for (c,d) respectively.
Figure 12.
Numerical deformed geometries. Pre-strain intensity = 0.02 for (a,b), and = 0.07 for (c,d) respectively.

Figure 13.
Evolution of load versus displacement during dent test: experiments (dashed lines) and numerical predictions (solid lines).
Figure 13.
Evolution of load versus displacement during dent test: experiments (dashed lines) and numerical predictions (solid lines).


Table 1.
Measured mechanical properties of E220BH steel. is the conventional elastic limit and is the tensile strength.
Table 1.
Measured mechanical properties of E220BH steel. is the conventional elastic limit and is the tensile strength.
| (MPa) | (MPa) | ||
|---|---|---|---|
| 220 | 350 | 1.75 | 0.66 |
Table 2.
Material parameters identified from tensile tests for E220BH steel.
| E (MPa) | (MPa) | K (MPa) | n | (MPa) | ||
|---|---|---|---|---|---|---|
| 219,700 | 0.29 | 235.9 | 607.7 | 0.23 | 21.5 | 22.2 |
© 2018 by the authors. Licensee MDPI, Basel, Switzerland. This article is an open access article distributed under the terms and conditions of the Creative Commons Attribution (CC BY) license (http://creativecommons.org/licenses/by/4.0/).
Share and Cite
MDPI and ACS Style
Thuillier, S.; Zang, S.-L.; Troufflard, J.; Manach, P.-Y.; Jegat, A. Modeling Bake Hardening Effects in Steel Sheets—Application to Dent Resistance. Metals 2018, 8, 594. https://doi.org/10.3390/met8080594
AMA Style
Thuillier S, Zang S-L, Troufflard J, Manach P-Y, Jegat A. Modeling Bake Hardening Effects in Steel Sheets—Application to Dent Resistance. Metals. 2018; 8(8):594. https://doi.org/10.3390/met8080594
Chicago/Turabian StyleThuillier, Sandrine, Shun-Lai Zang, Julien Troufflard, Pierre-Yves Manach, and Anthony Jegat. 2018. "Modeling Bake Hardening Effects in Steel Sheets—Application to Dent Resistance" Metals 8, no. 8: 594. https://doi.org/10.3390/met8080594
Note that from the first issue of 2016, this journal uses article numbers instead of page numbers. See further details here.