Thermodynamic Reassessment of the Na-Cu and Na-K Binary Systems

1
Department of Materials Science and Physical Chemistry of Materials, South Ural State University, Lenin prospect 76, Chelyabinsk 454080, Russia
2
Research & Innovation Services, South Ural State University, Lenin prospect 76, Chelyabinsk 454080, Russia
3
Department of Industrial and Civil Engineering, South Ural State University, Zlatoust Branch, Turgenev str. 16, Zlatoust 456209, Russia
4
ICD-LASMIS, Université de Technologie de Troyes, 12 rue Marie Curie, CS 42060, 10004 Troyes CEDEX, France
*
Author to whom correspondence should be addressed.
Metals 2018, 8(8), 629; https://doi.org/10.3390/met8080629
Submission received: 5 July 2018
/
Revised: 30 July 2018
/
Accepted: 1 August 2018
/
Published: 10 August 2018
Abstract
:The Na-Cu and Na-K systems are of significant interest due to the use of liquid sodium and melt of sodium and potassium in the nuclear industry as a cooling agent in nuclear reactors. In the present work, thermodynamic modeling of phase equilibria in the Na-Cu and Na-K systems is carried out, based on the available published experimental data. This modeling was done using the “FactSage” software package (version 7.0). The set of Redlich-Kister equation parameters was obtained, which allows one to describe the dependence of Gibbs energy from composition and temperature for solutions that can be formed in the studied systems. Phase diagrams (T-x diagrams) of the investigated systems were calculated.
1. Introduction
Liquid sodium is widely used as a cooling agent in nuclear reactors [1]. In some cases, it is considered as appropriate to use an alloy of Na-K. Because of the properties of such alloys, they can be used as cooling agents for other technical devices.
Active alkaline metals, which are used as cooling agents, should circulate in a closed system. Some important parts of this closed system are made of copper (a cheap material with a high thermal conductivity). This is why the study of the Cu-Na-K system is of interest.
Presently, phase equilibrium in the Cu-Na-K system has never been the subject of full thermodynamic modeling. This kind of simulation requires a preliminary thermodynamic description of phase equilibria in binary systems containing Cu, Na, and K. Experimental data about the Cu-K system are uncommon in the literature. It is just noted that this system does not form any intermetallic compounds [2]. At the same time, there is a large amount of experimental data about the Na-Cu and Na-K systems. The aim of this work is to model the phase equilibria in the Na-Cu and Na-K systems based on the available experimental data by means of a widely used thermodynamic model common to both systems.
2. Thermodynamic Modeling
Software package “FactSage” (version 7.0, “Thermfact/CRCT”, Montreal, QC, Canada and “GTT-Technologies”, Aachen, Germany) [3,4,5] is used in the simulations. Calculation of phase diagrams is carried out using the "Phase Diagram" module. The “Compound” module is used to creating the individual substances base. The “Solution” module (model #1) is used to calculate the thermodynamic parameters of the solutions. The possibility of miscibility gaps formation is taken into account during the phase diagrams calculation. All calculations are performed for a fixed total system pressure of 1 bar.
The temperature dependences of Gibbs energy for solid (BCC and FCC phases separately) and liquid simple substances (sodium, copper, and potassium) are taken (with minor necessary corrections) from work [6]. For calculation of Na2K Gibbs energy, the Equation (1) is used:
This Equation (1) is obtained according to FTlite (FACT Light Metal Alloy) Database for FactSage 7.0.
For the simulation of the solutions (Na-Cu melt and Na-K melt, as well as the solid solutions with crystal lattices BCC and FCC), the Redlich-Kister polynomials [7] are used (Equations (2) and (3)):
in which L is the interaction parameter, which is expressed as the following form:
3. Results and Discussion
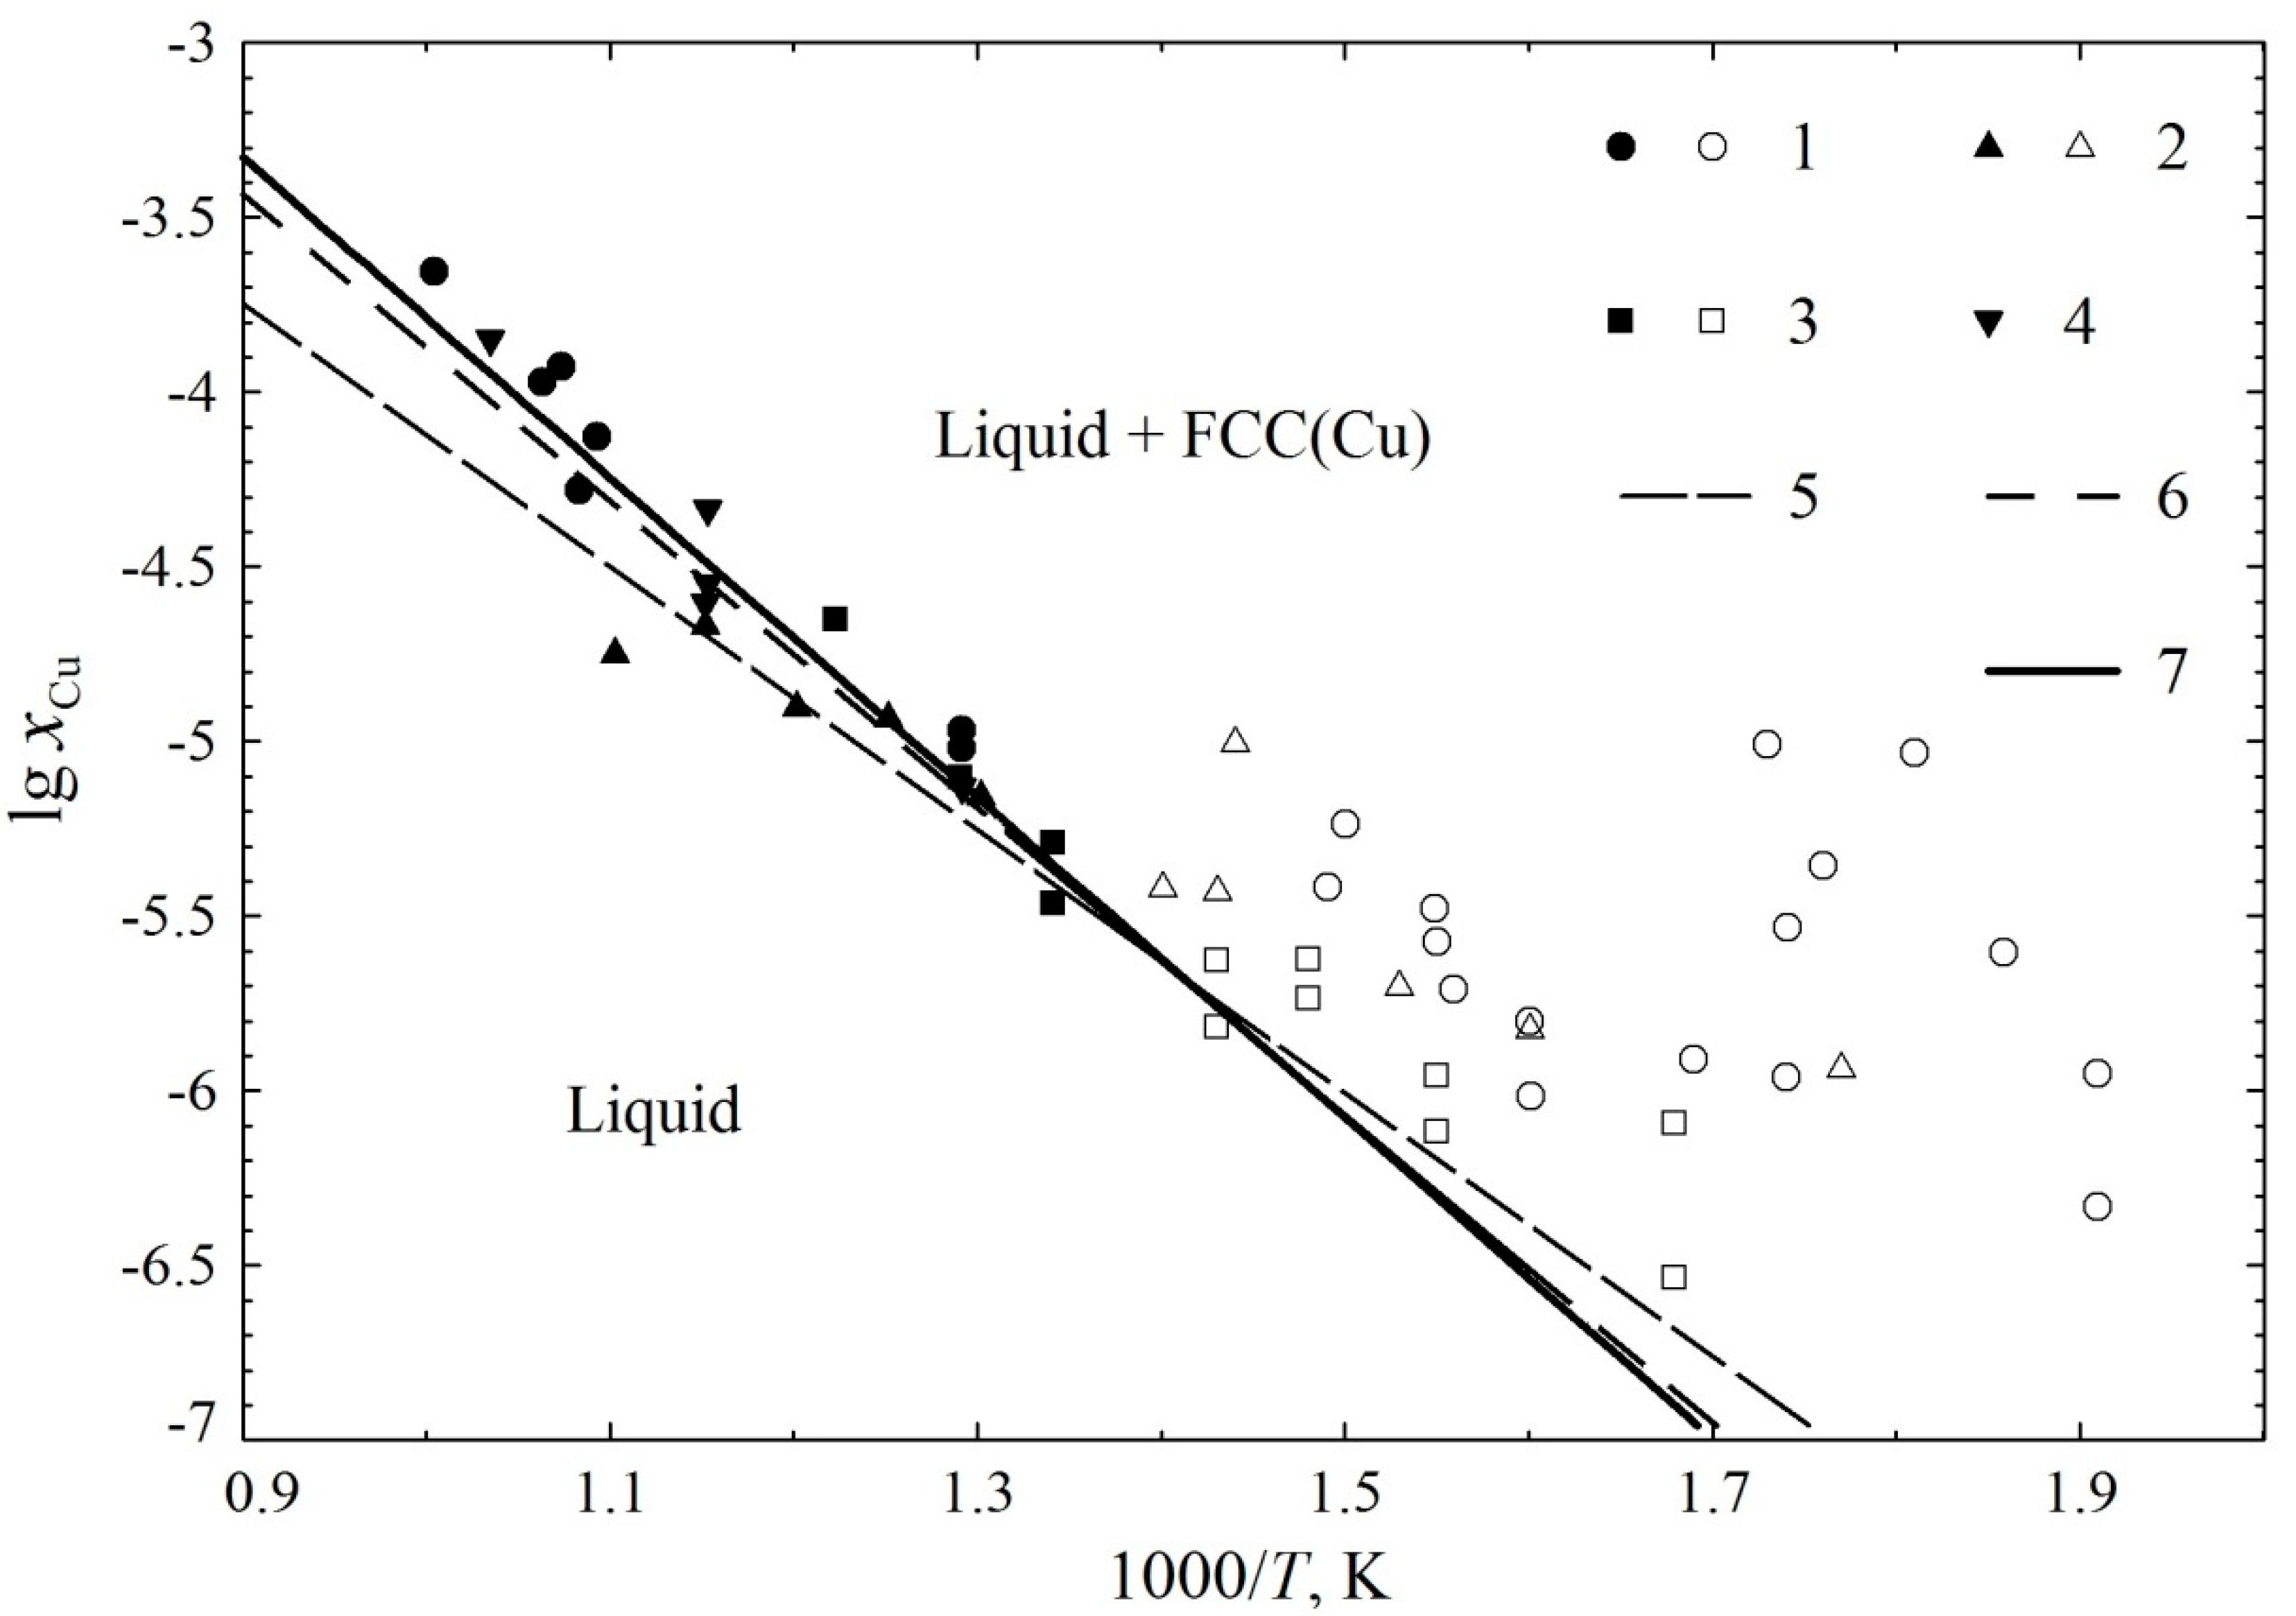
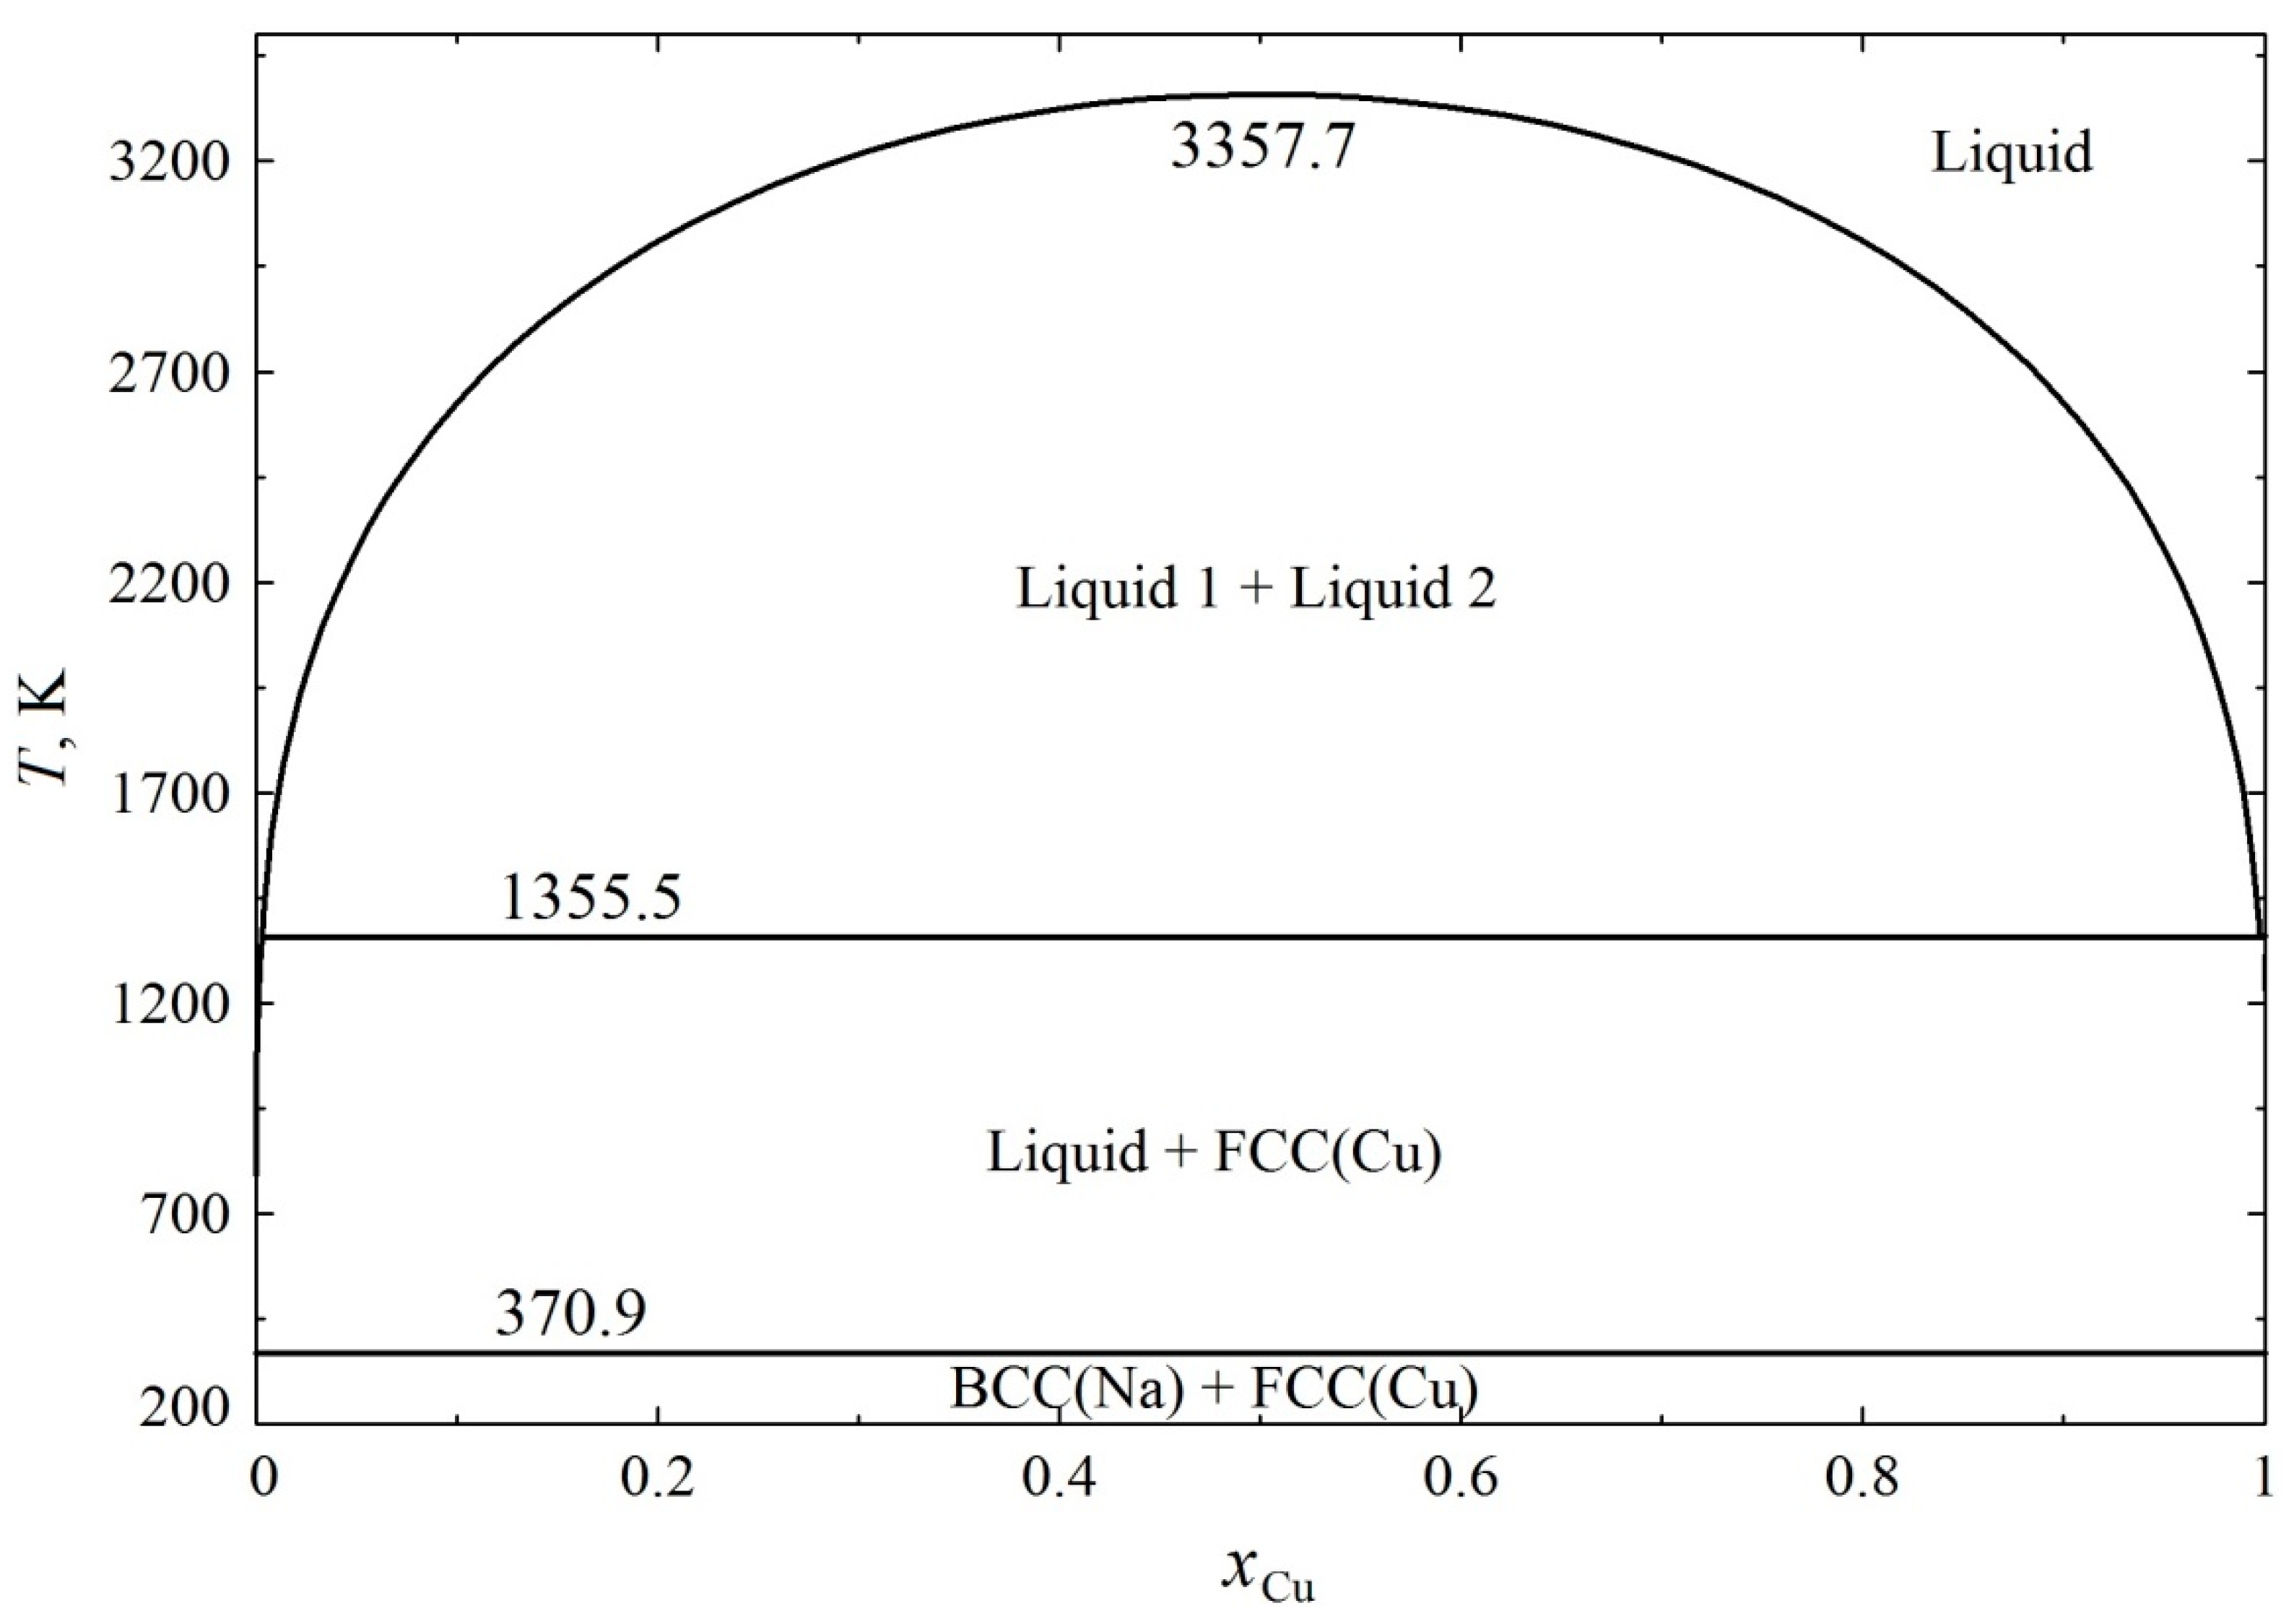
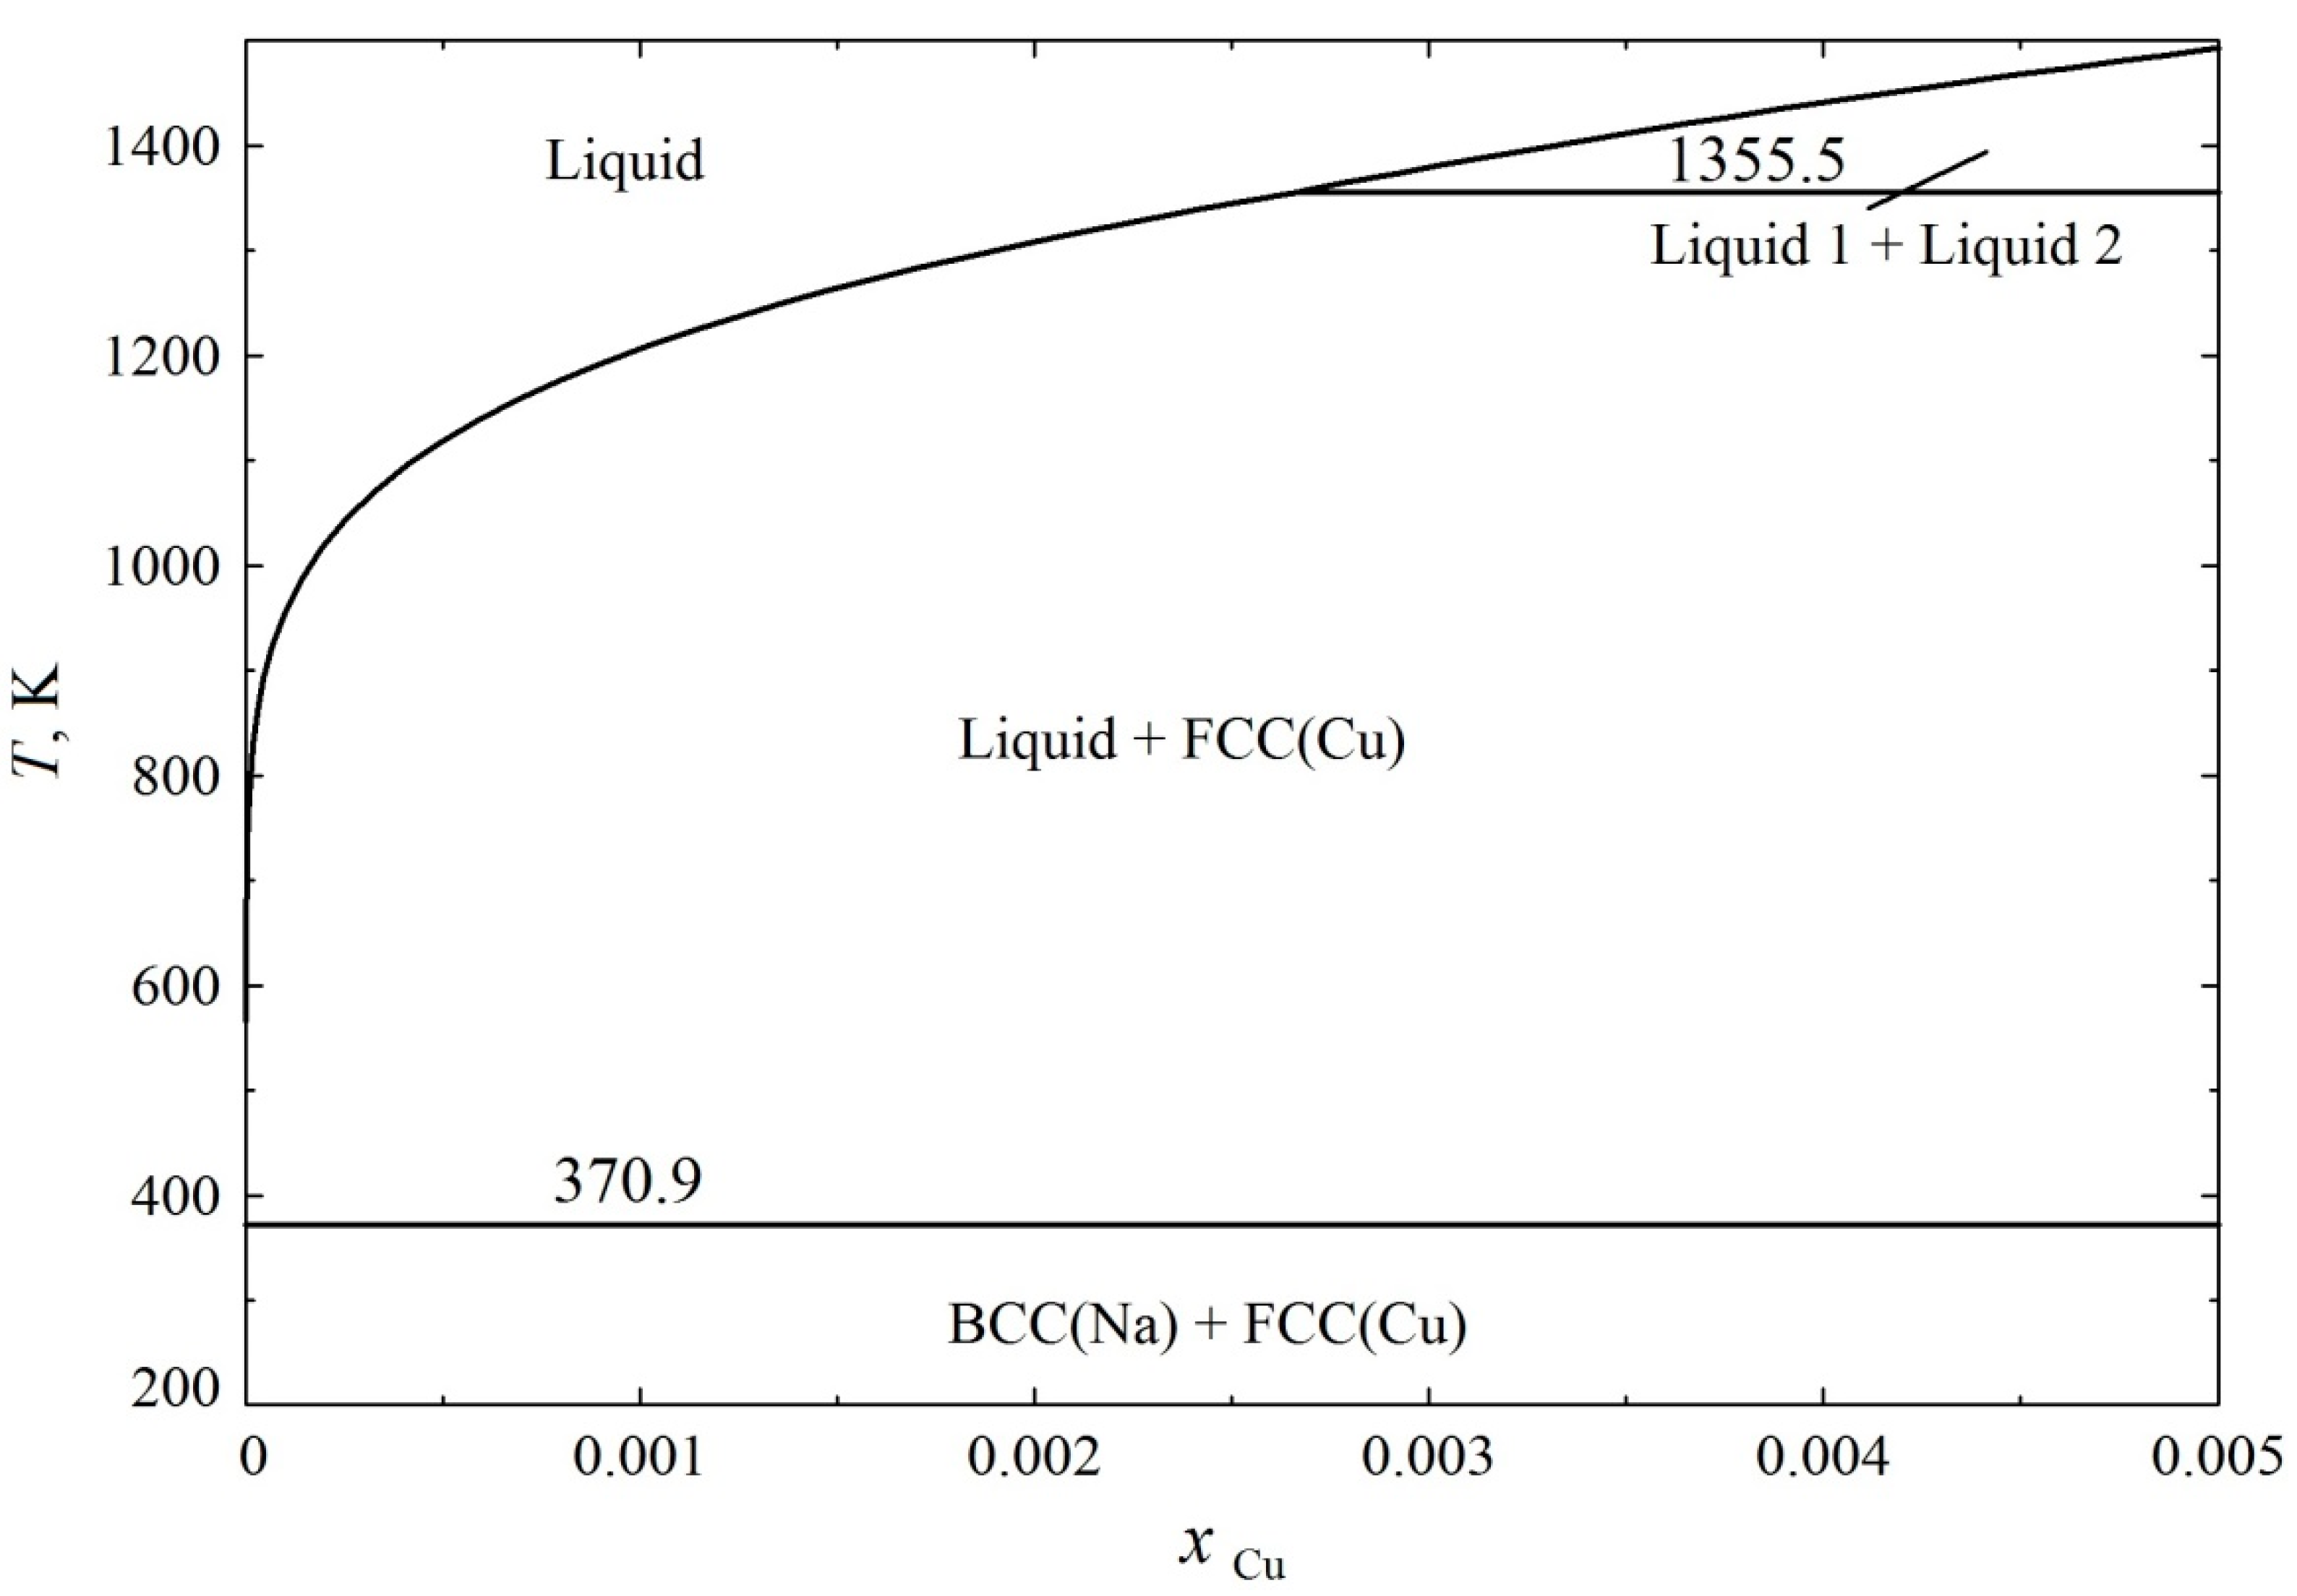
In Figure 1, some results of experimental study on the solubility of copper in liquid sodium are presented, according to the data given in [9]. In Figure 2, Figure 3 and Figure 4, a general view of the calculated phase diagram of the Na-Cu system and a zoom of its fragments are shown.
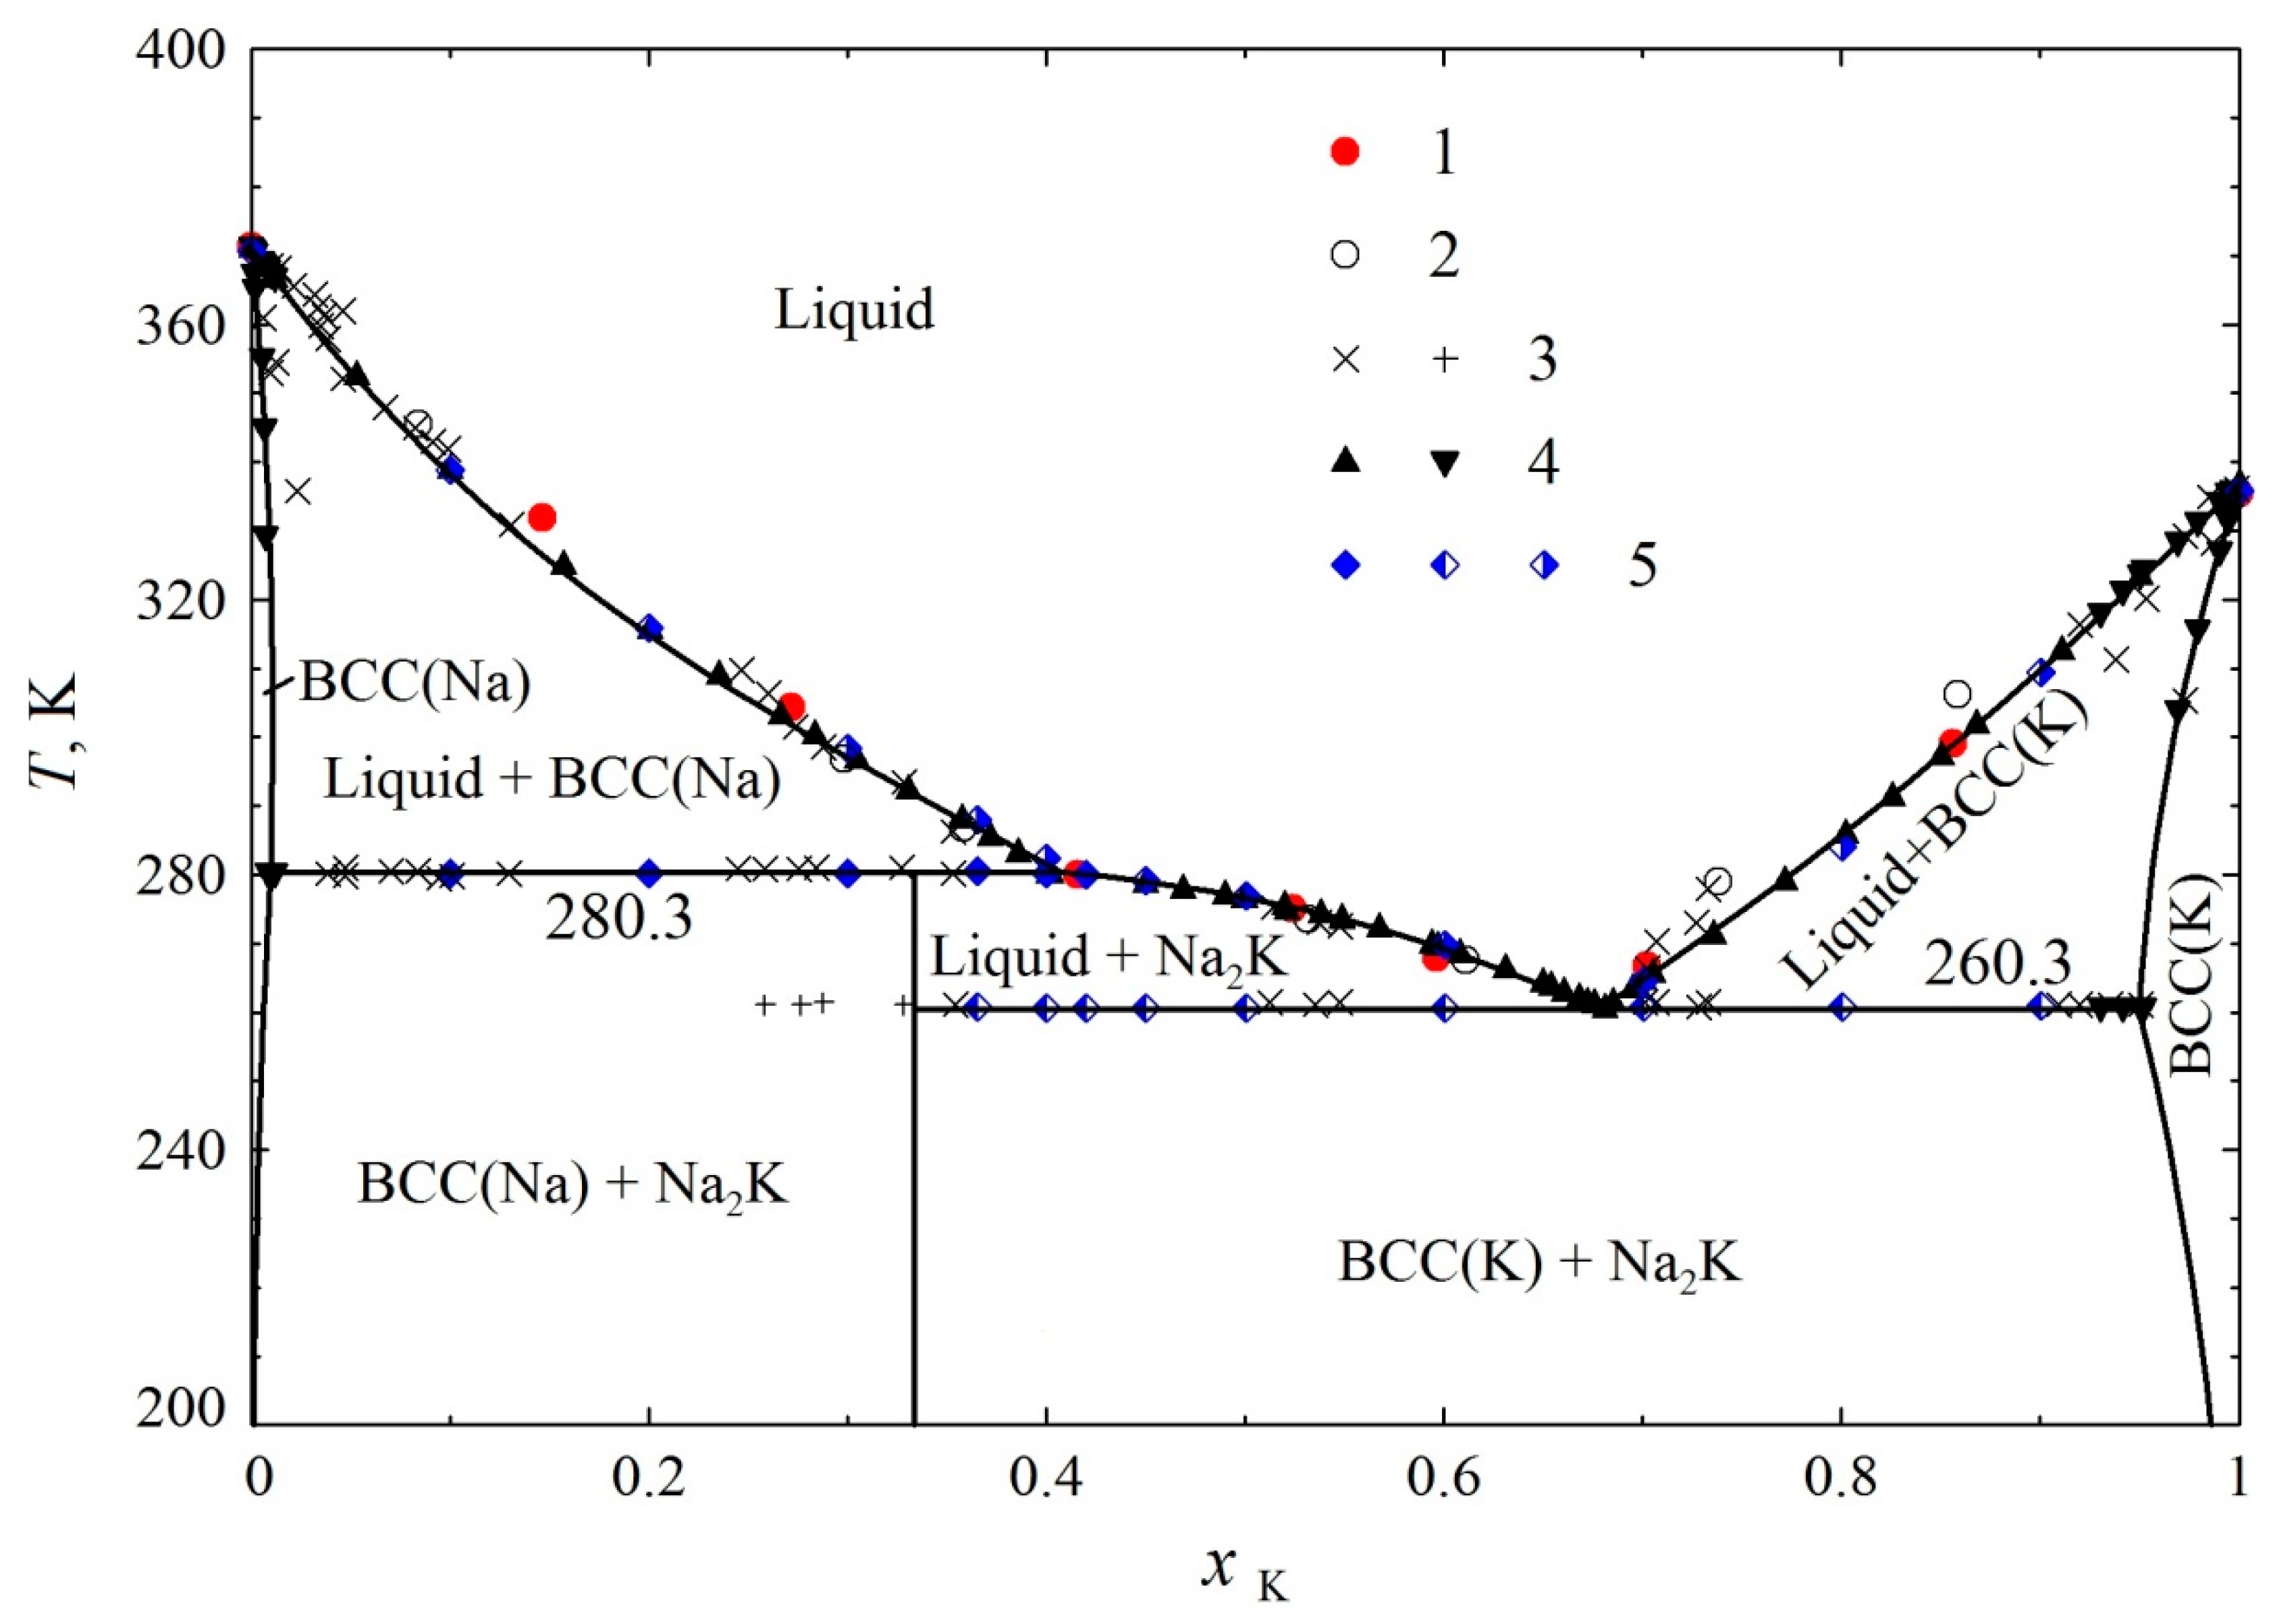
In Figure 5, results of the phase diagram calculation for the Na-K system are shown. The experimental data, used for the selection of model parameters, are also presented here. It allows one to confirm the accuracy of the present modeling.
The Na-Cu system has been studied experimentally in several works [10,11,12,13,14]. However, the attention of researchers has been focused mainly on the study of copper solubility in liquid sodium. A critical review of all works performed by 1986 was presented by A. Pelton [9]. In this review, the author plots the phase diagram for the Na-Cu system, in which most of it is made schematically, without relying on experimental data.
In [8], thermodynamic modeling and calculation of phase diagrams for the Na-Cu system are performed, and they were included in the review of H. Okamoto [15]. The authors of [8] used Redlich-Kister polynomials to build the model. Unfortunately, the authors of [8] did not justify their choice of model parameters for solid solutions (experimental data [10,11,12,13,14], to which they refer, do not contain the necessary information). However, any additional information of this kind of data is absent in the literature. Hence, for our calculation we used the values presented in [8].
A. Pelton [9] correctly pointed out that at low temperatures and at low concentrations of copper in sodium, the values are too scattered. For this reason, it is incorrect to take these data for the equation development, which one can be used for extrapolation at much higher temperatures. Therefore, in the present work only data obtained for relatively high temperatures (above 723 K) were used for the solubility approximation. In Figure 1, used experimental points are shown as black and unused as white. The result of approximation (with R2 = 0.8995) is presented by the Equation (4):
in which xCu is the mole fraction of copper in the sodium-based melt.
The continuous line, shown in Figure 1, is the result of our calculation for the liquidus line in the Na-Cu system at the temperatures 500–1111 K. It includes the compositions, in which sodium-based melt is in equilibrium with a copper-based solid solution. The parameters used for this calculation (presented in the Table 1) are selected in such a way that the liquidus line overlaps the line, calculated by the equation, obtained in approximation. The liquidus lines calculated by using a set of parameters from [8] and from FTlite Database are shown on the same figure. Comparison of the calculation results with the experimental data justified the proposed set of parameters.
During the modeling of the Na-K system, experimental data of works [16,17,18,19,20] are used. The results of these works are in a good agreement. In particular, all researchers confirm that the system produces compound Na2K, which is incongruent decomposed at a temperature of about 280 K. Earlier, the thermodynamic description of the Na-K system was performed in [21] within the modeling of the Na-K-S system, and the phase diagram of this system was calculated. A modified quasi-chemical model [22] was used to describe the melt. It prevents us from using the obtained parameters of the Na-K description for the study of more complex systems by more common approaches. In this work, the model parameters allowing one to describe phase equilibria in this system by means of Redlich-Kister polynomials were obtained.
It is well known [2] that Cu does not form intermetallic phases with K (as with Na). It is also known that liquid K (which is similar to Na) poorly dissolves Cu. Thus, the diagram for the Cu-K system probably will have similar representation to the Na-Cu system, and it can be predicted by simulations. In Figure S1, the phase diagram of the Cu-K system is presented, which was calculated using the L parameters from Na-Cu system (see Table 1) and the data for pure K from [6]. This approach allows us to calculate the phase equilibria in the Cu-Na-K system. The Figures S2–S4 present the isothermal sections of the phase diagram of the Cu-Na-K system at T = 270 K and 300 K, as well as the liquidus projection of the system. In addition to the data presented above, the value of LNa,K = 100,000 J/mol was used for the calculation of the FCC phase.
The obtained results (in particular, the set of Redlich-Kister equation parameters) allow us to simulate more accurately the phase equilibria in the Na-Cu system, as well as to use them for modeling of more complex systems, such as the Cu-Na-K system.
4. Conclusions
Based on the available published experimental data, thermodynamic modeling of phase equilibria for the Na-Cu and Na-K systems is carried out. The set of Redlich-Kister equation parameters was obtained, which allows one to describe Gibbs energy dependence from composition and temperature for solutions, which are formed in the studied systems. Phase diagrams (T-x diagram) of the investigated systems were calculated.
Supplementary Materials
The following are available online at https://www.mdpi.com/2075-4701/8/8/629/s1. Figure S1: General view of the calculated phase diagram of the Cu-K system. Figure S2: Isothermal section at 270 K of the calculated phase diagram of the Cu-Na-K ternary system. Figure S3: Isothermal section at 300 K of the calculated phase diagram of the Cu-Na-K ternary system. Figure S4: Calculated liquidus surface projection of the Cu-Na-K ternary system.
Author Contributions
Conceptualization, E.T. and O.S.; Methodology, E.T. and O.S.; Validation, O.S. and O.Z.; Investigation, E.T., O.S., O.Z., and E.V.; Writing—Review and Editing, O.S., O.Z., and E.V.; Project Administration, O.S.
Funding
This research was funded by RFBR, according to the research project No. 16-38-60144 mol_а_dk.
Conflicts of Interest
The authors declare no conflict of interest. The funders had no role in the design of the study; in the collection, analyses, or interpretation of data; in the writing of the manuscript; or in the decision to publish the results.
References
- Baldev, R.; Chellapandi, P.; Vasudeva Rao, P.R. Sodium Fast Reactors with Closed Fuel Cycle; CRC Press: Boca Raton, FL, USA, 2015; pp. 1–901. ISBN 9781466587694. [Google Scholar]
- Pelton, A.D. The Cu-K (copper-potassium) system. Bull. Alloy Phase Diagrams 1986, 7, 231. [Google Scholar] [CrossRef]
- Bale, C.W.; Chartrand, P.; Degterov, S.A.; Eriksson, G.; Hack, K.; Ben Mahfoud, R.; Melançon, J.; Pelton, A.D.; Petersen, S. FactSage Thermochemical Software and Databases. Calphad 2002, 26, 189–228. [Google Scholar] [CrossRef]
- Bale, C.W.; Bélisle, E.; Chartrand, P.; Decterov, S.A.; Eriksson, G.; Hack, K.; Jung, I.-H.; Kang, Y.-B.; Melançon, J.; Pelton, A.D.; et al. FactSage thermochemical software and databases—recent developments. Calphad 2009, 33, 295–311. [Google Scholar] [CrossRef]
- Bale, C.W.; Bélisle, E.; Chartrand, P.; Decterov, S.A.; Eriksson, G.; Gheribi, A.E.; Hack, K.; Jung, I.-H.; Kang, Y.-B.; Melançon, J.; Pelton, A.D.; et al. FactSage thermochemical software and databases, 2010–2016. Calphad 2016, 54, 35–53. [Google Scholar] [CrossRef]
- Dinsdale, A.T. SGTE data for pure elements. Calphad 1991, 15, 317–425. [Google Scholar] [CrossRef]
- Hillert, M. Partial Gibbs energies from Redlich-Kister polynomials. Thermochim. Acta 1988, 129, 71–75. [Google Scholar] [CrossRef]
- Hao, D.; Bu, M.; Wang, Y.; Tang, Y.; Gao, Q.; Wang, M.; Hu, B.; Du, Y. Thermodynamic modeling of the Na–X (X = Si, Ag, Cu, Cr) systems. J. Min. Metall. Sect. B 2012, 48, 273–282. [Google Scholar] [CrossRef]
- Pelton, A.D. The Cu-Na (copper-sodium) system. Bull. Alloy Phase Diagrams 1986, 7, 25–27. [Google Scholar] [CrossRef]
- Eichelberger, R.L.; McKisson, R.L. Solubility of Cu in Na; North American Rockwell Corporation: Springfield, VA, USA, 31 May 1968; AI-AEC-12671. [Google Scholar]
- Walker, R.A.; Pratt, J.N. The solubility of copper in liquid sodium. J. Nucl. Mater. 1969, 32, 340–345. [Google Scholar] [CrossRef]
- Singer, R.M.; Becker, W.; Weeks, J.R. Quarterly Progress Report of Work Sponsored by the Fuel and Materials Branch, April to June 1967; Brookhaven National Lab: Upton, NY, USA, 1967; BNL-50065. [Google Scholar]
- Singer, R.M.; Weeks, J.R. On the Solubilities of Cu, Ni, and Fe in Liquid Sodium. In Proceedings of the International Conference on Sodium Technology and Large Fast Reactor Design, 7–9 November 1968, Part I, Sessions of Sodium Technology, Argonne National Laboratories, ANL-7520; Clearinghouse for Federal Scientific and Technical Information: Springfield, VA, USA, 1969. [Google Scholar]
- Humphreys, J.R., Jr. Interdivision Document K-3-774; Los Alamos Scientific Laboratory: Los Alamos, NM, USA, 1958. [Google Scholar]
- Okamoto, H. Supplemental literature review of binary phase diagrams: B-La, B-Zn, Bi-La, Bi-Ti, Cd-Pr, Ce-Ga, Cu-Na, Ge-Ta, Ge-Y, H-Zr, Na-Si, and Pb-S. J. Phase Equilib. Diffus. 2015, 36, 644–655. [Google Scholar] [CrossRef]
- Kean, C.H. The pressure-temperature phase diagram of Na-K alloys and the effect of pressure on the resistance of the liquid phase. Phys. Rev. 1939, 55, 750–754. [Google Scholar] [CrossRef]
- Rinck, M.E. Diagrammes de solidification des alliages formés par deux métaux alcalins. Alliages sodium-potassium. C. R. Hebd. Séances Acad. sci. 1933, 197, 49–51. [Google Scholar]
- MacDonald, D.K.C.; Pearson, W.B.; Towle, L.T. An investigation of the sodium-potassium equilibrium diagram. Can. J. Phys. 1956, 34, 389–394. [Google Scholar] [CrossRef]
- Ott, J.B.; Goates, J.R.; Anderson, D.R.; Hall, H.T. Solid-liquid phase equilibria in the sodium + potassium system. Trans. Faraday Soc. 1969, 65, 2870–2878. [Google Scholar] [CrossRef]
- Van Rossen, G.L.C.M.; van Bleiswijk, H.Z. Über das zustandsdiagramm der kalium-natriumlegierungen. Anorg. Chem. 1912, 74, 152–156. [Google Scholar] [CrossRef]
- Lindberg, D.; Backman, R.; Hupa, M.; Chartrand, P. Thermodynamic Evaluation and Optimization of the (Na+K+S) System. J. Chem. Thermodyn. 2006, 38, 900–915. [Google Scholar] [CrossRef]
- Pelton, A.D.; Chartrand, P.; Eriksson, G. The modified quasi-chemical model: Part IV. Two-sublattice quadruplet approximation. Metall. Mater. Trans. A 2001, 32, 1409–1416. [Google Scholar] [CrossRef]
Figure 1.
Approximation of experimental data on copper solubility in sodium. Experimental data according to [9]: 1—data from [10], 2—data from [11], 3—data from [12,13], and 4—data from [14]. 5—Calculation results using the data from [8], 6—calculation results using the data from FTlite Database for FactSage 7.0, and 7—calculation results using the data from this work.

Figure 2.
General view of the calculated phase diagram of the Na-Cu system.

Figure 3.
Calculated phase diagram of the Na-Cu system. Zoom for the area with low copper concentration.
Figure 3.
Calculated phase diagram of the Na-Cu system. Zoom for the area with low copper concentration.

Figure 4.
Calculated phase diagram of the Na-Cu system. Zoom for the area with low sodium concentration.
Figure 4.
Calculated phase diagram of the Na-Cu system. Zoom for the area with low sodium concentration.


© 2018 by the authors. Licensee MDPI, Basel, Switzerland. This article is an open access article distributed under the terms and conditions of the Creative Commons Attribution (CC BY) license (http://creativecommons.org/licenses/by/4.0/).
Share and Cite
MDPI and ACS Style
Trofimov, E.; Samoilova, O.; Zaitseva, O.; Vakhitova, E. Thermodynamic Reassessment of the Na-Cu and Na-K Binary Systems. Metals 2018, 8, 629. https://doi.org/10.3390/met8080629
AMA Style
Trofimov E, Samoilova O, Zaitseva O, Vakhitova E. Thermodynamic Reassessment of the Na-Cu and Na-K Binary Systems. Metals. 2018; 8(8):629. https://doi.org/10.3390/met8080629
Chicago/Turabian StyleTrofimov, Evgeny, Olga Samoilova, Olga Zaitseva, and Elena Vakhitova. 2018. "Thermodynamic Reassessment of the Na-Cu and Na-K Binary Systems" Metals 8, no. 8: 629. https://doi.org/10.3390/met8080629
Note that from the first issue of 2016, this journal uses article numbers instead of page numbers. See further details here.