Removal of Pb2+ in Wastewater via Adsorption onto an Activated Carbon Produced from Winemaking Waste


Abstract
:1. Introduction
2. Materials and Methods
2.1. Synthesis of HTC and AC
2.2. Characterization of the Activated Carbon
2.3. Batch Adsorption Experiments
3. Results and Discussion
3.1. Characterization of the Activated Carbon
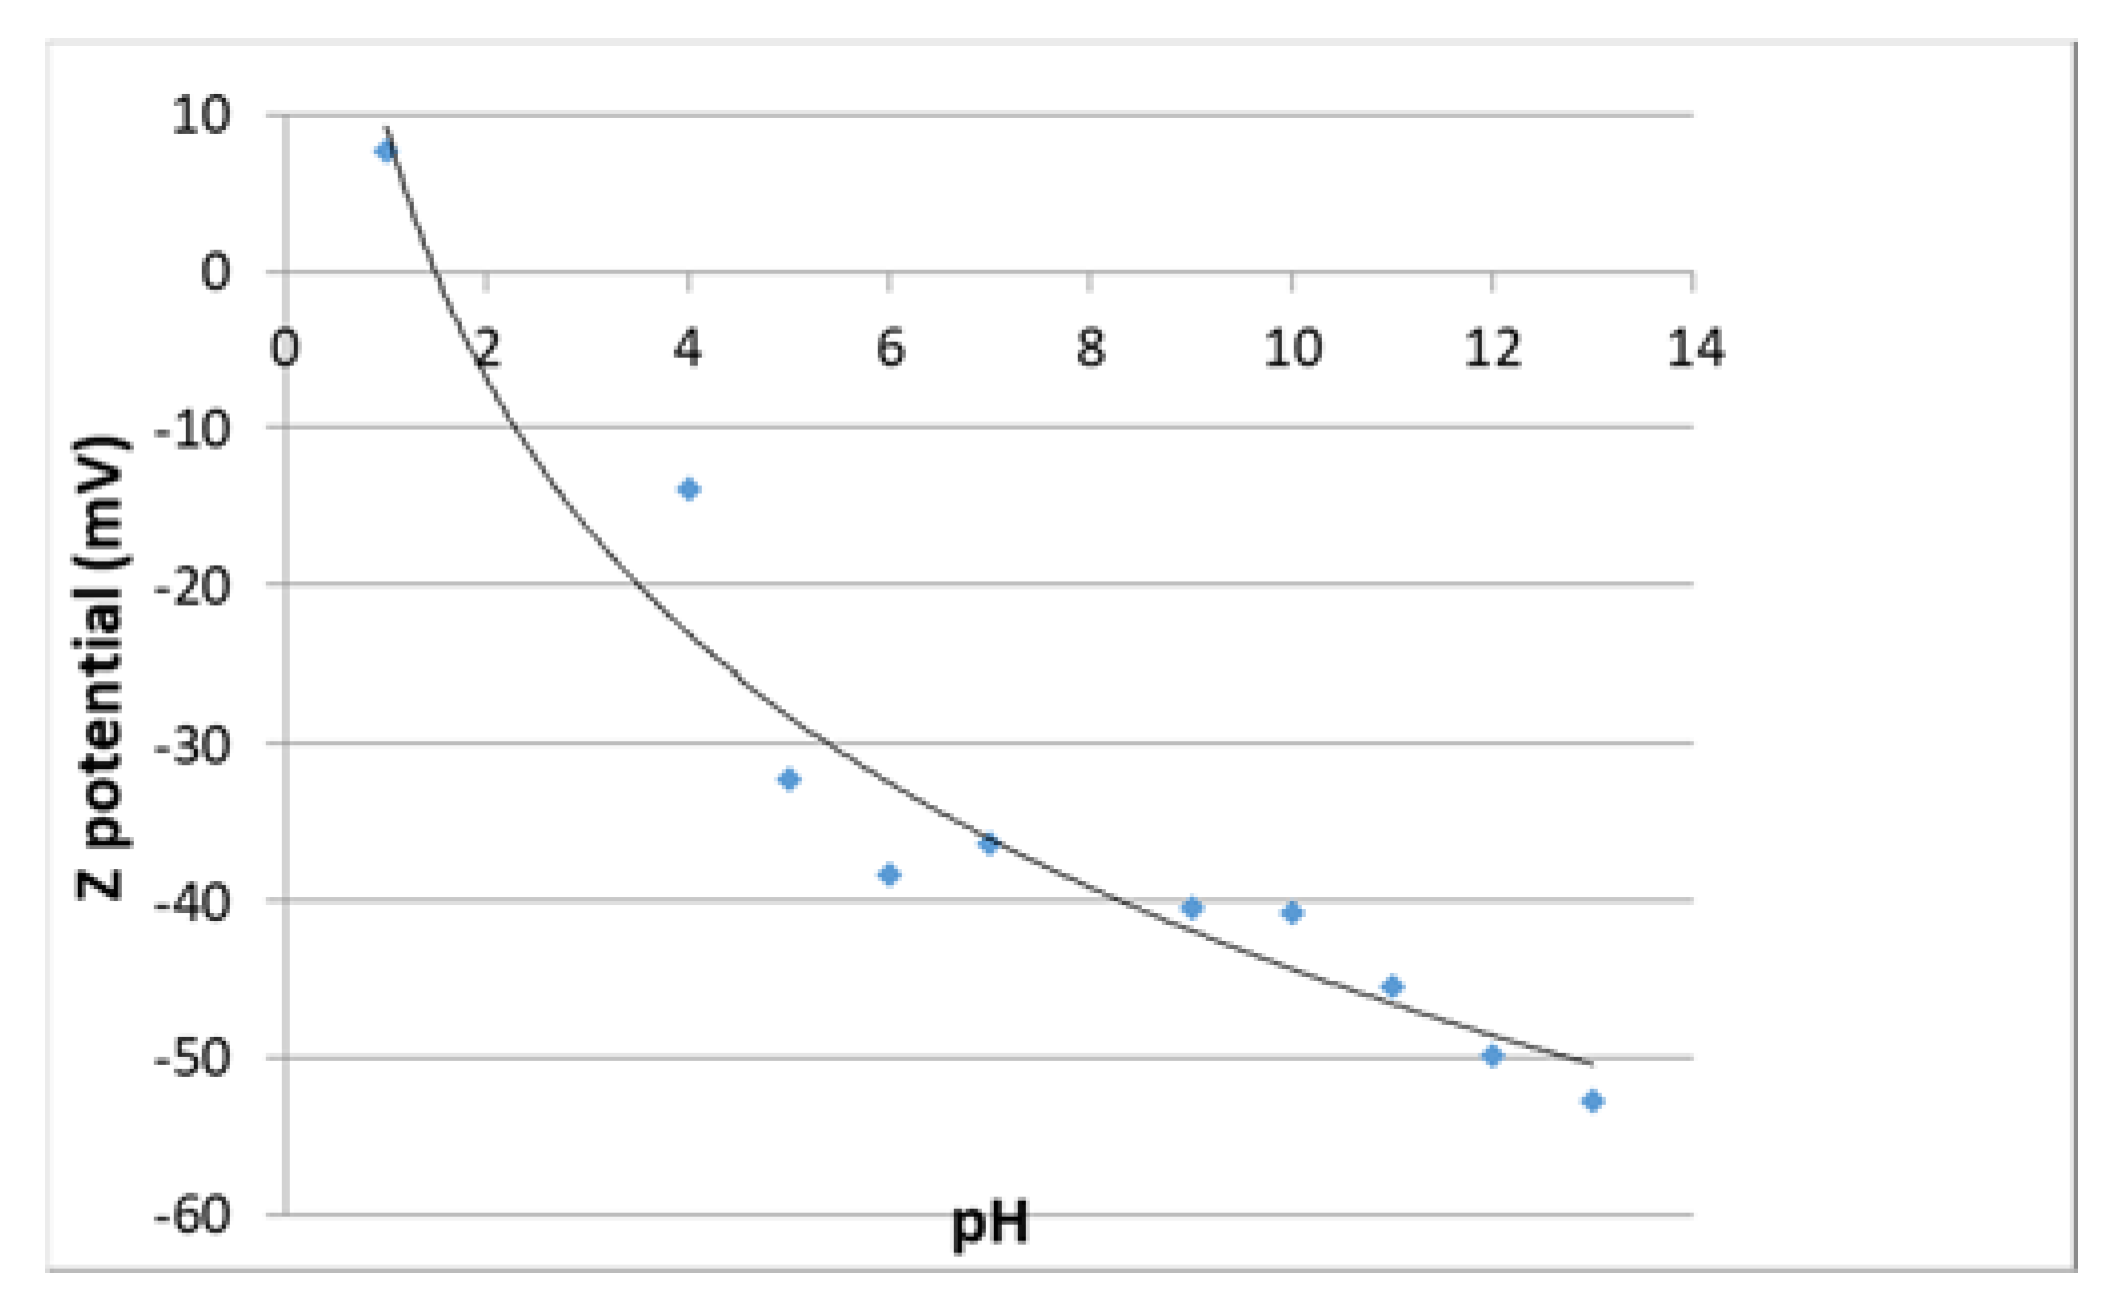
3.1.1. Chemical Composition and Z Potential
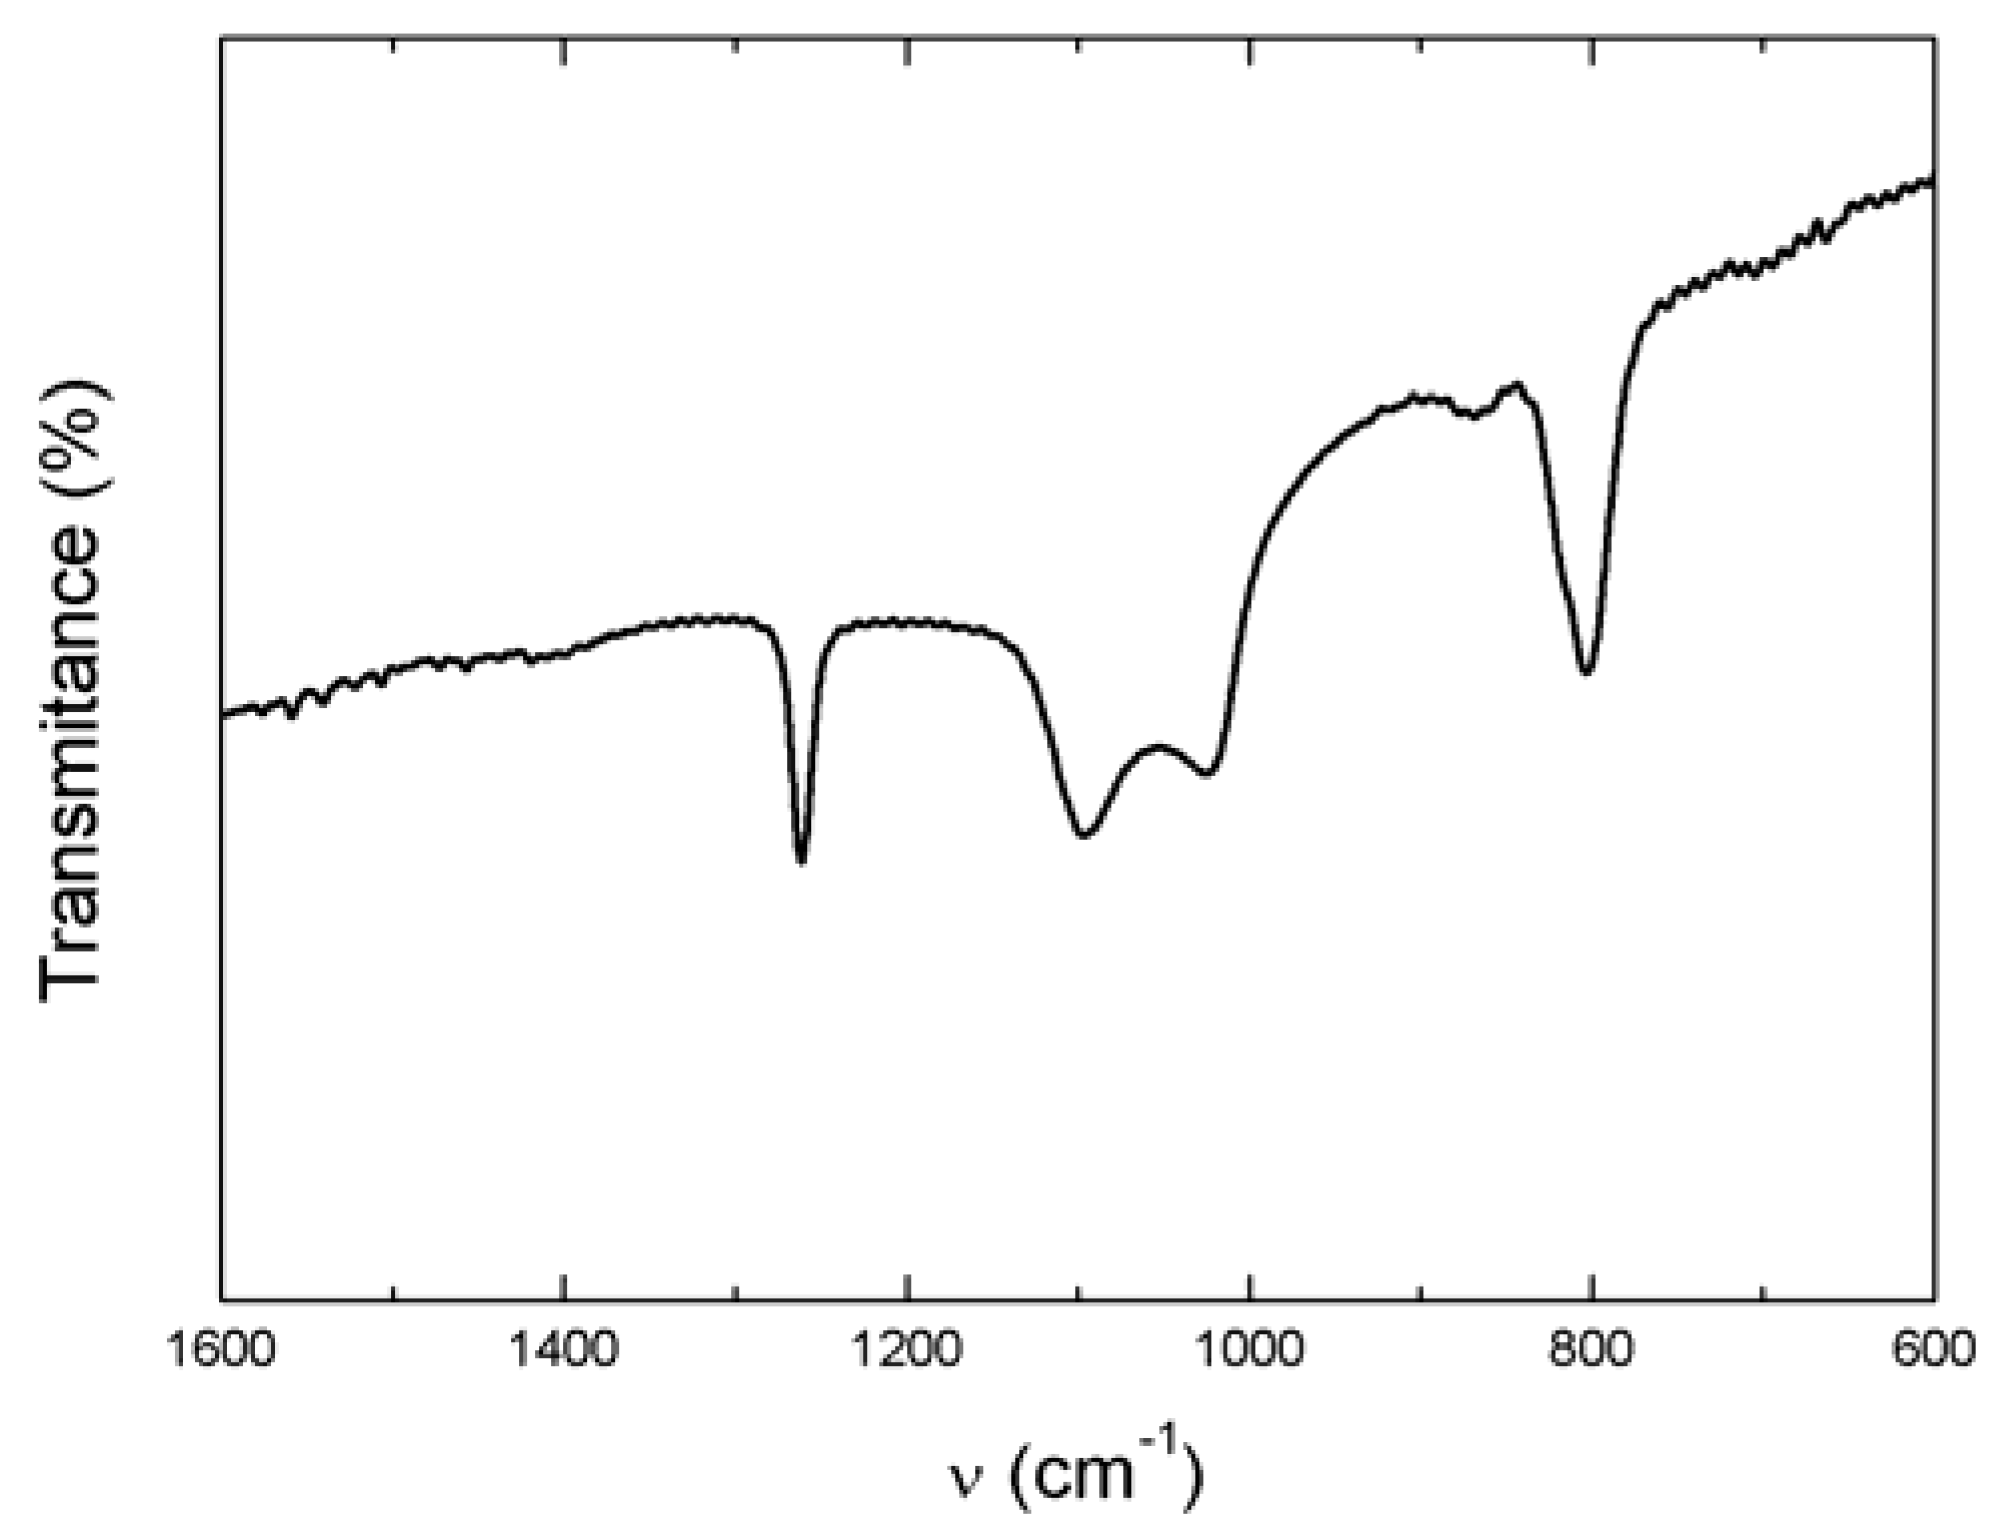
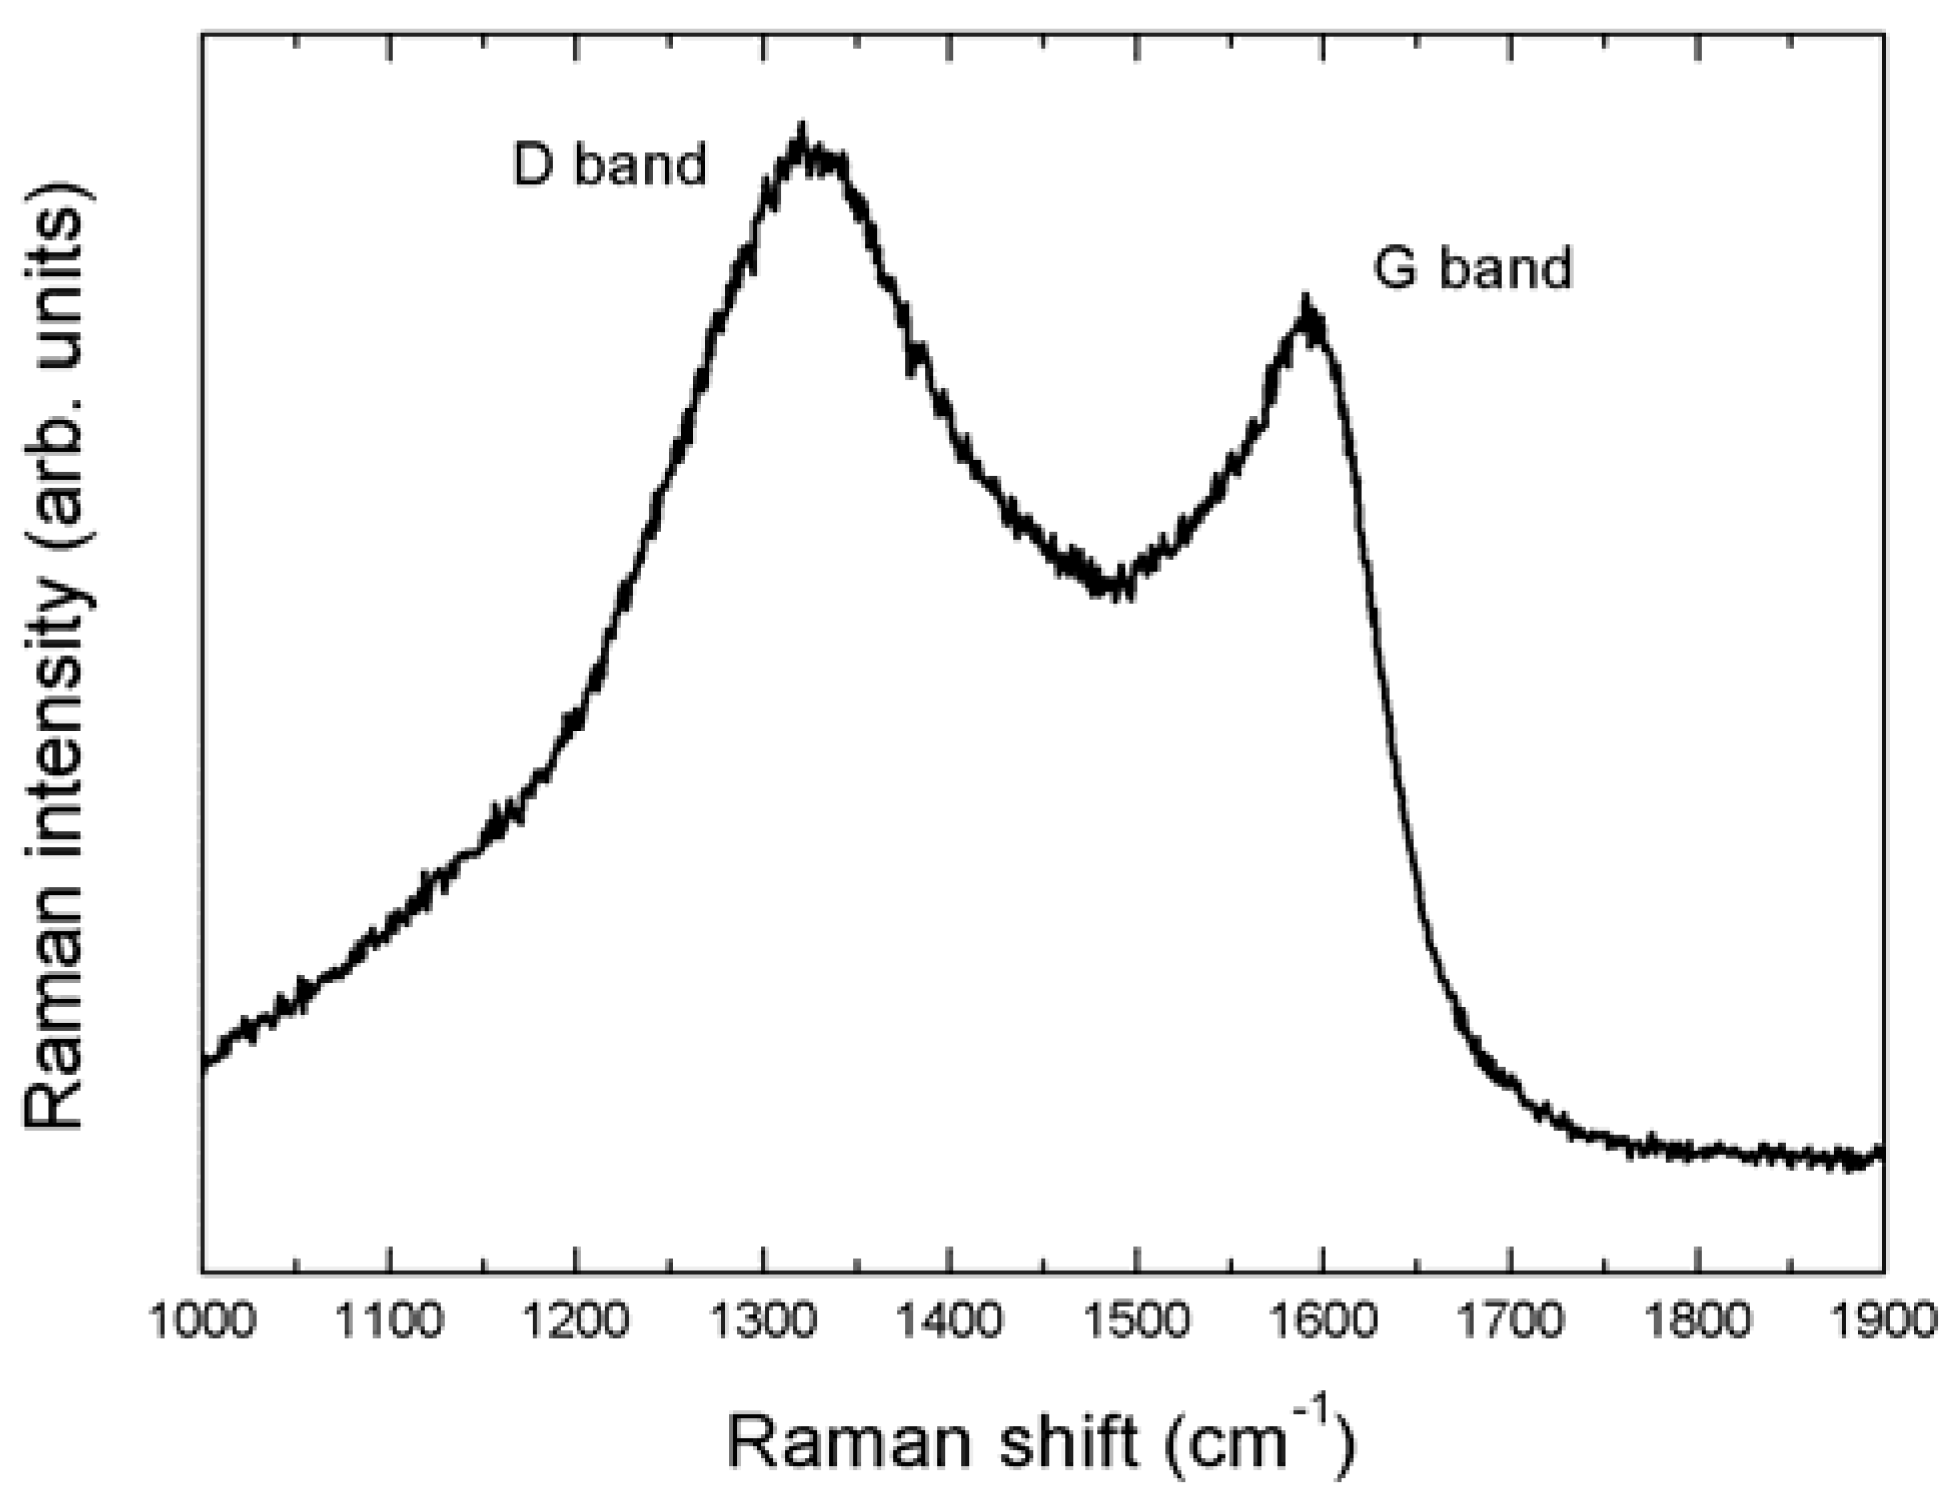
3.1.2. Fourier Transform Infrared and Raman Spectroscopy
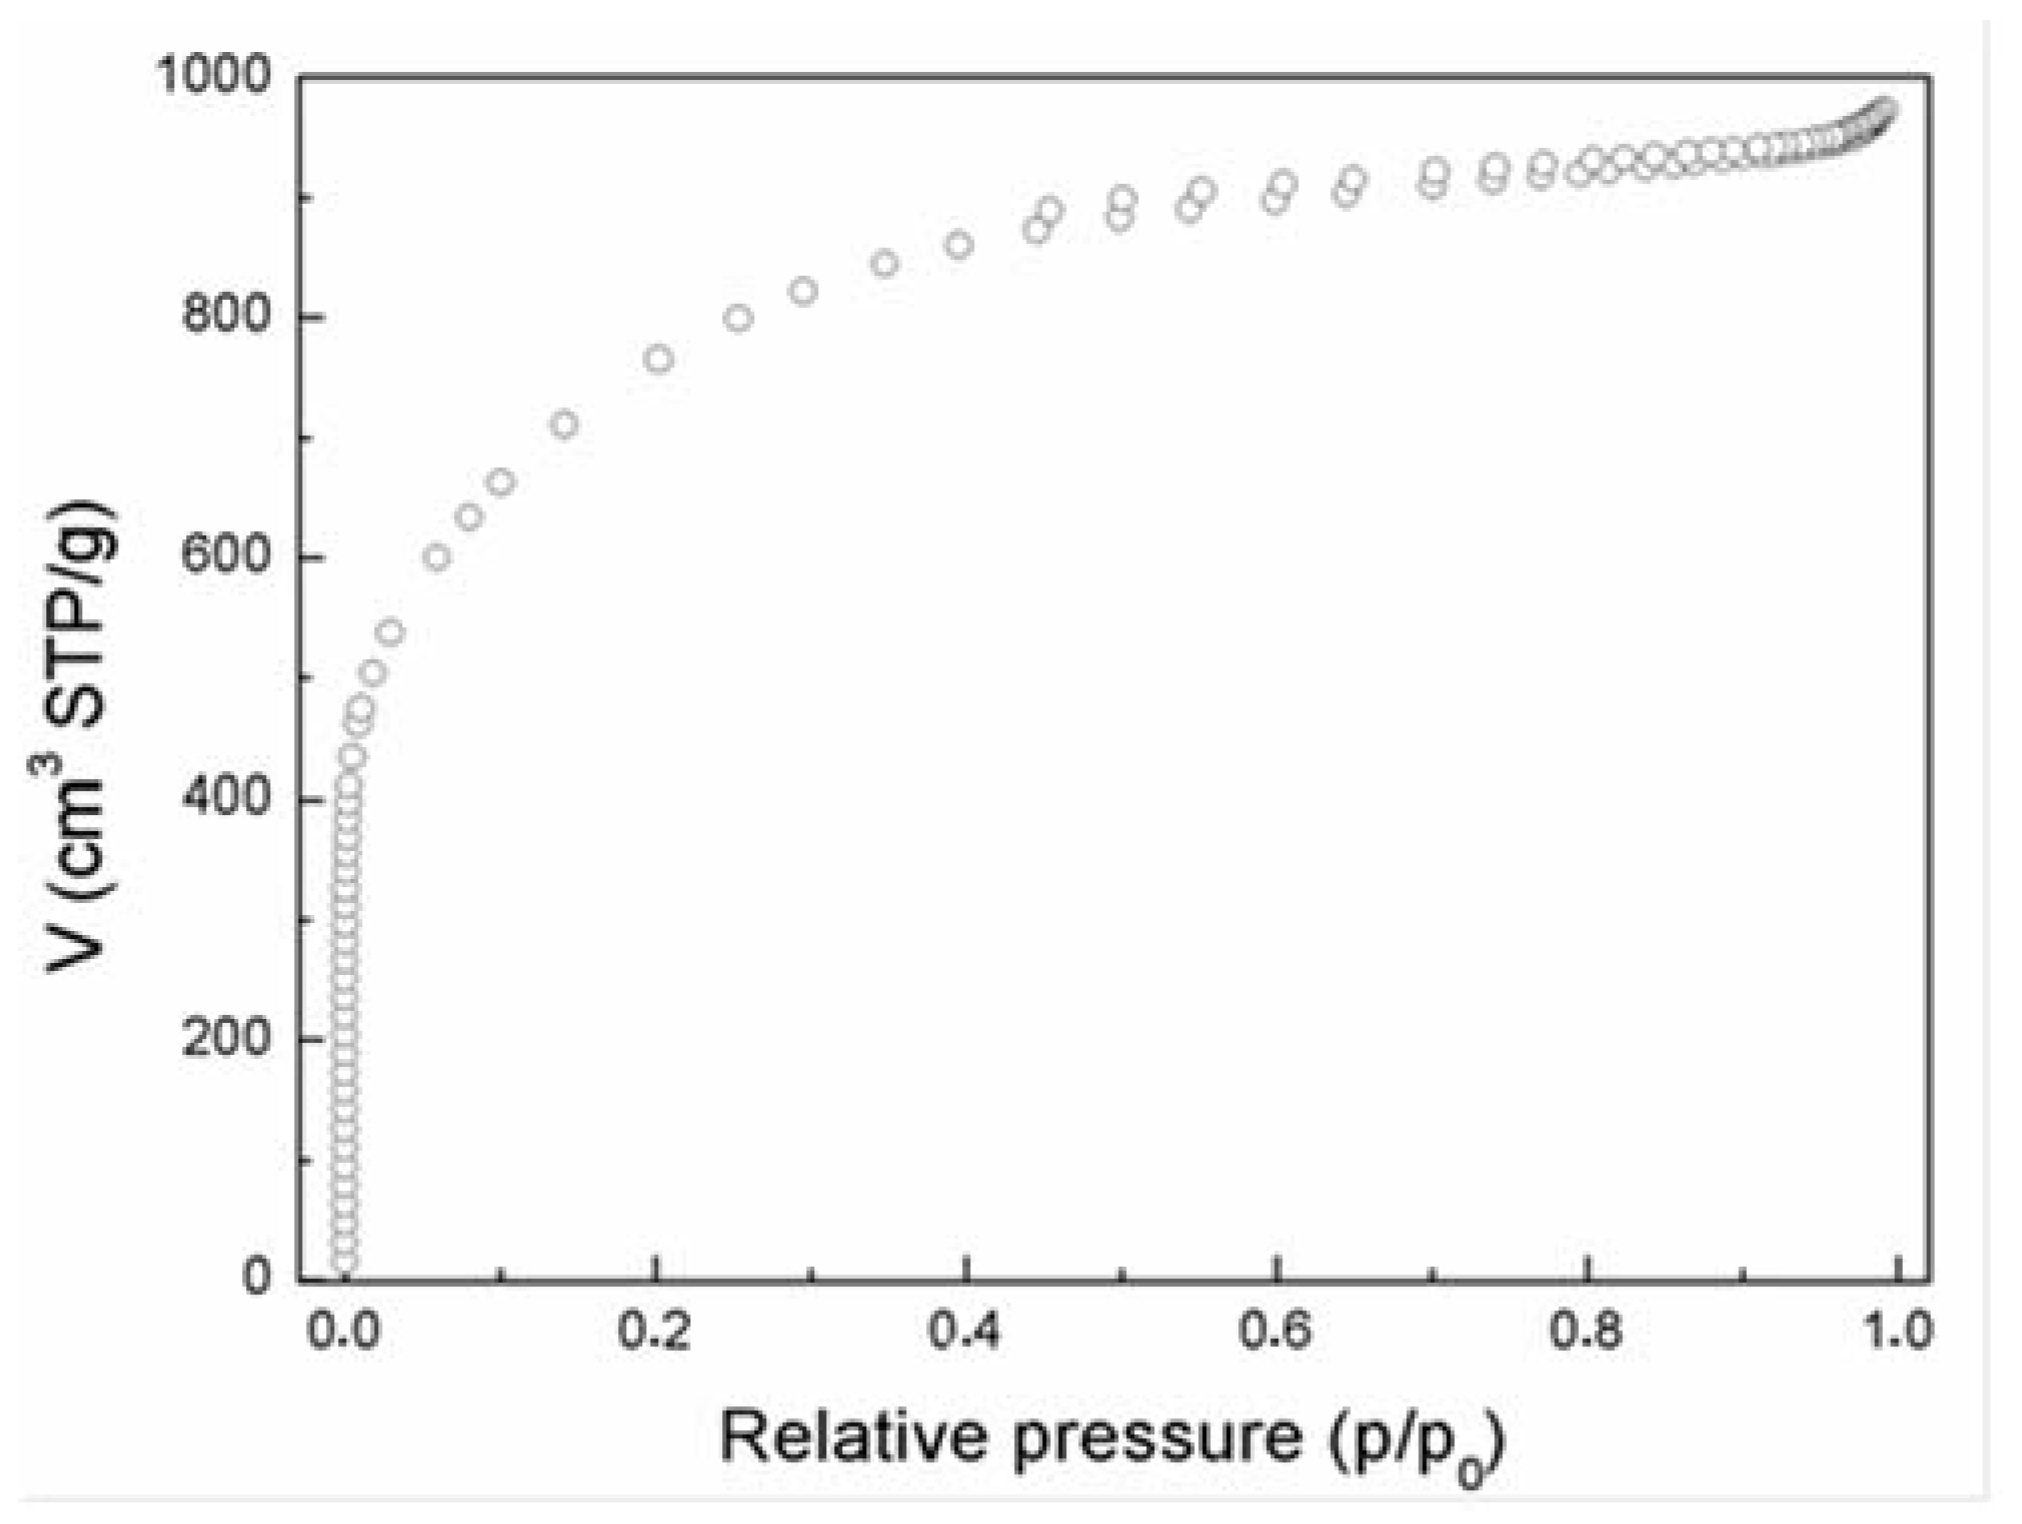
3.1.3. N2 adsorption-Desorption Isotherms
3.2. Batch Adsorption Studies
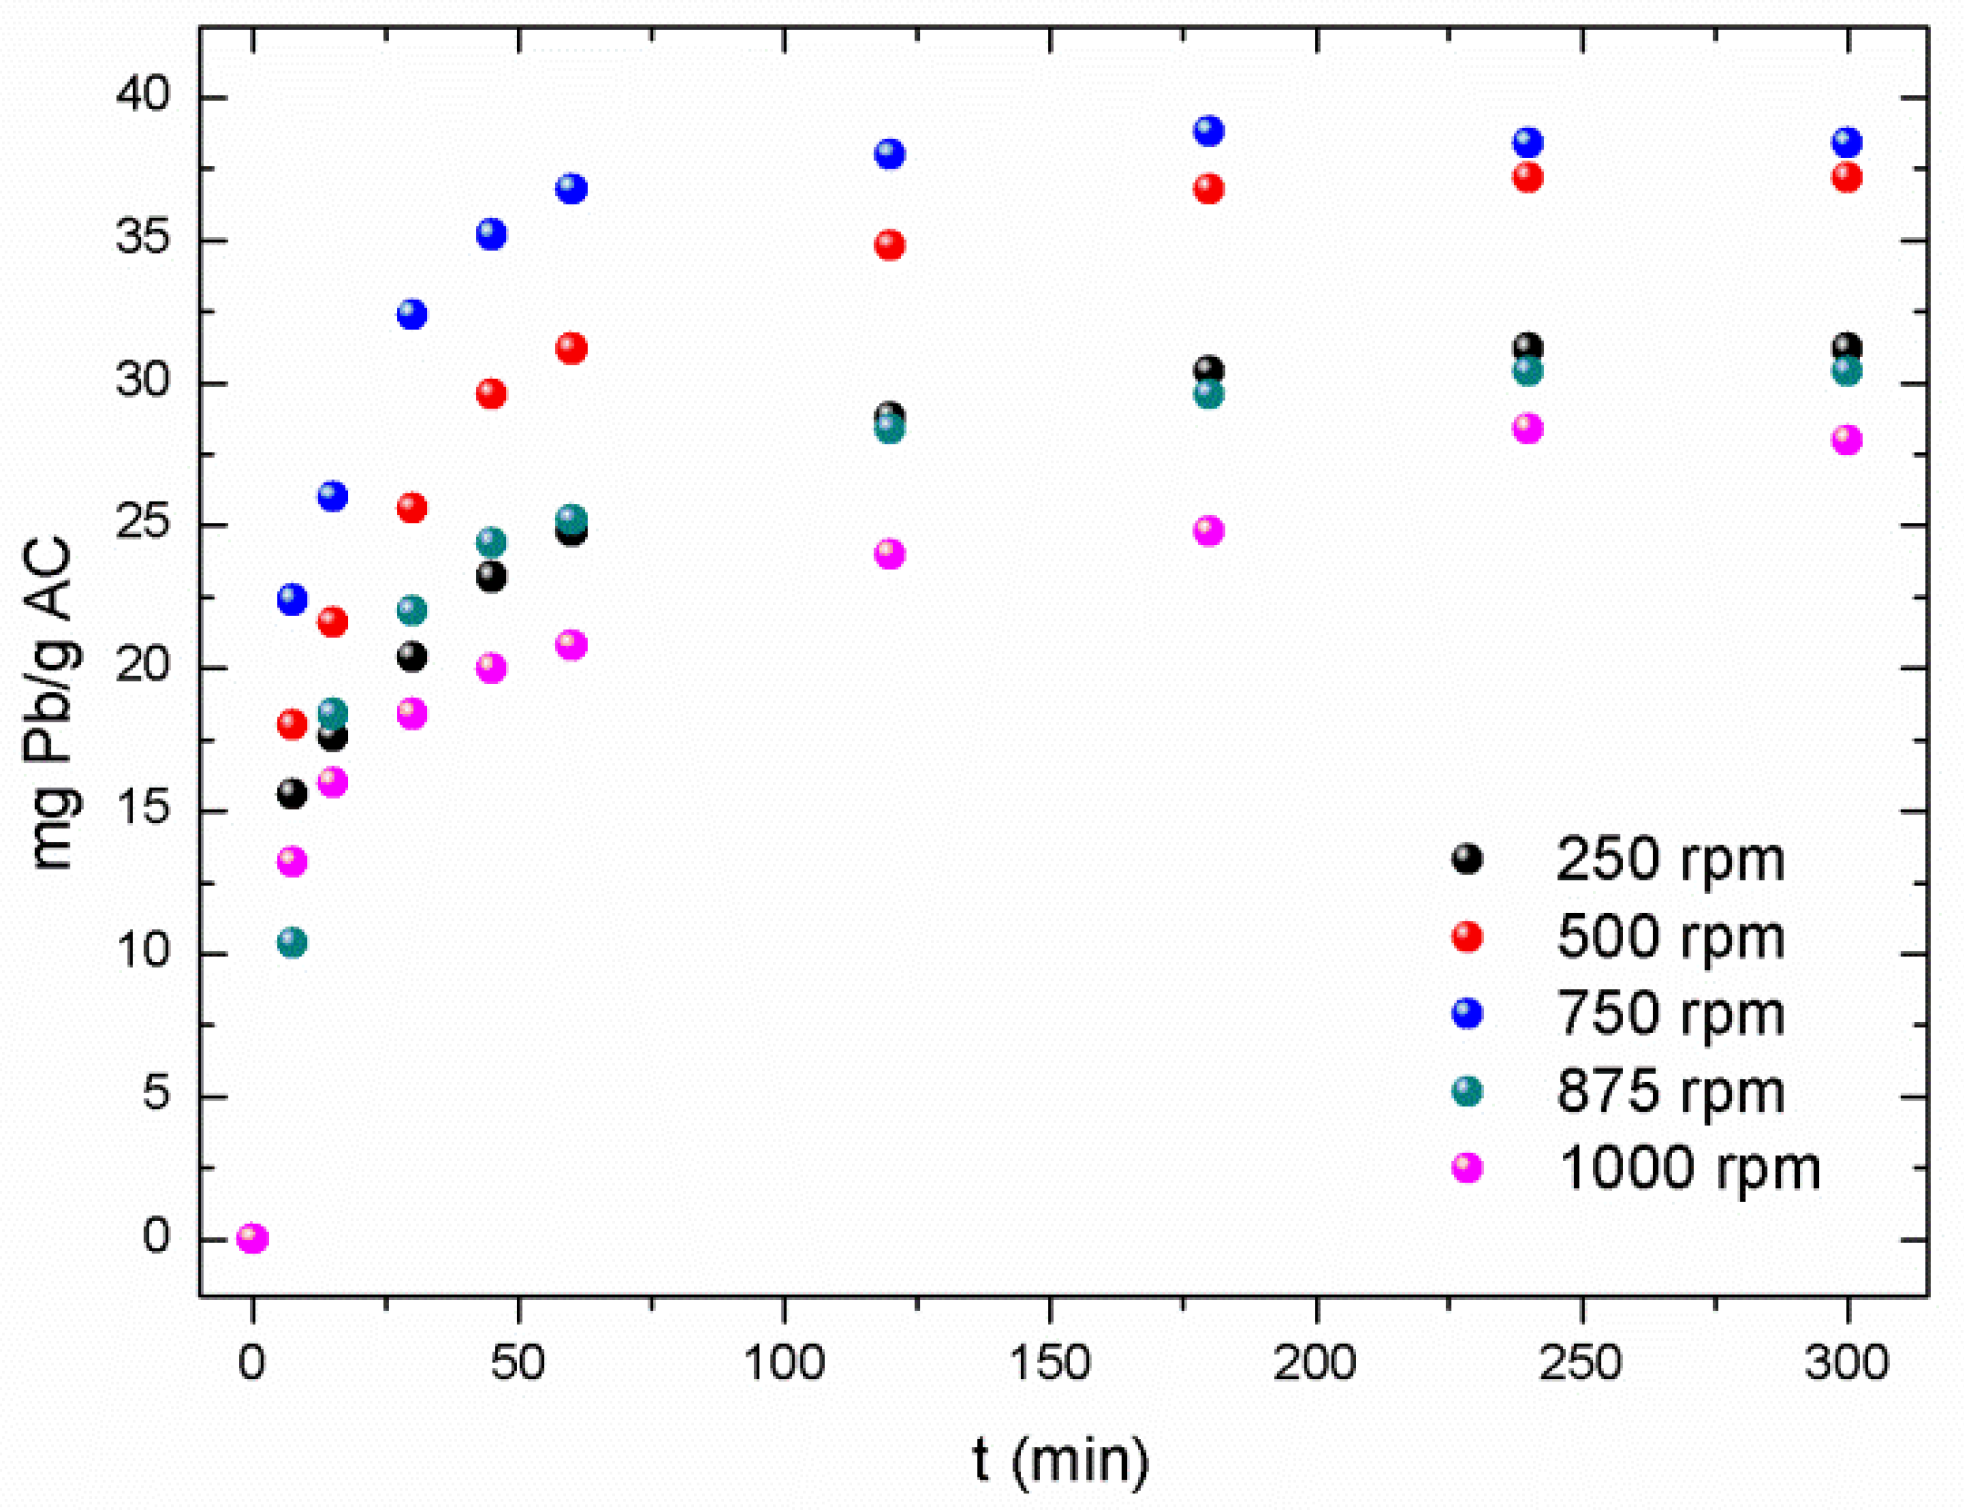
3.2.1. Effect of the Stirring Rate
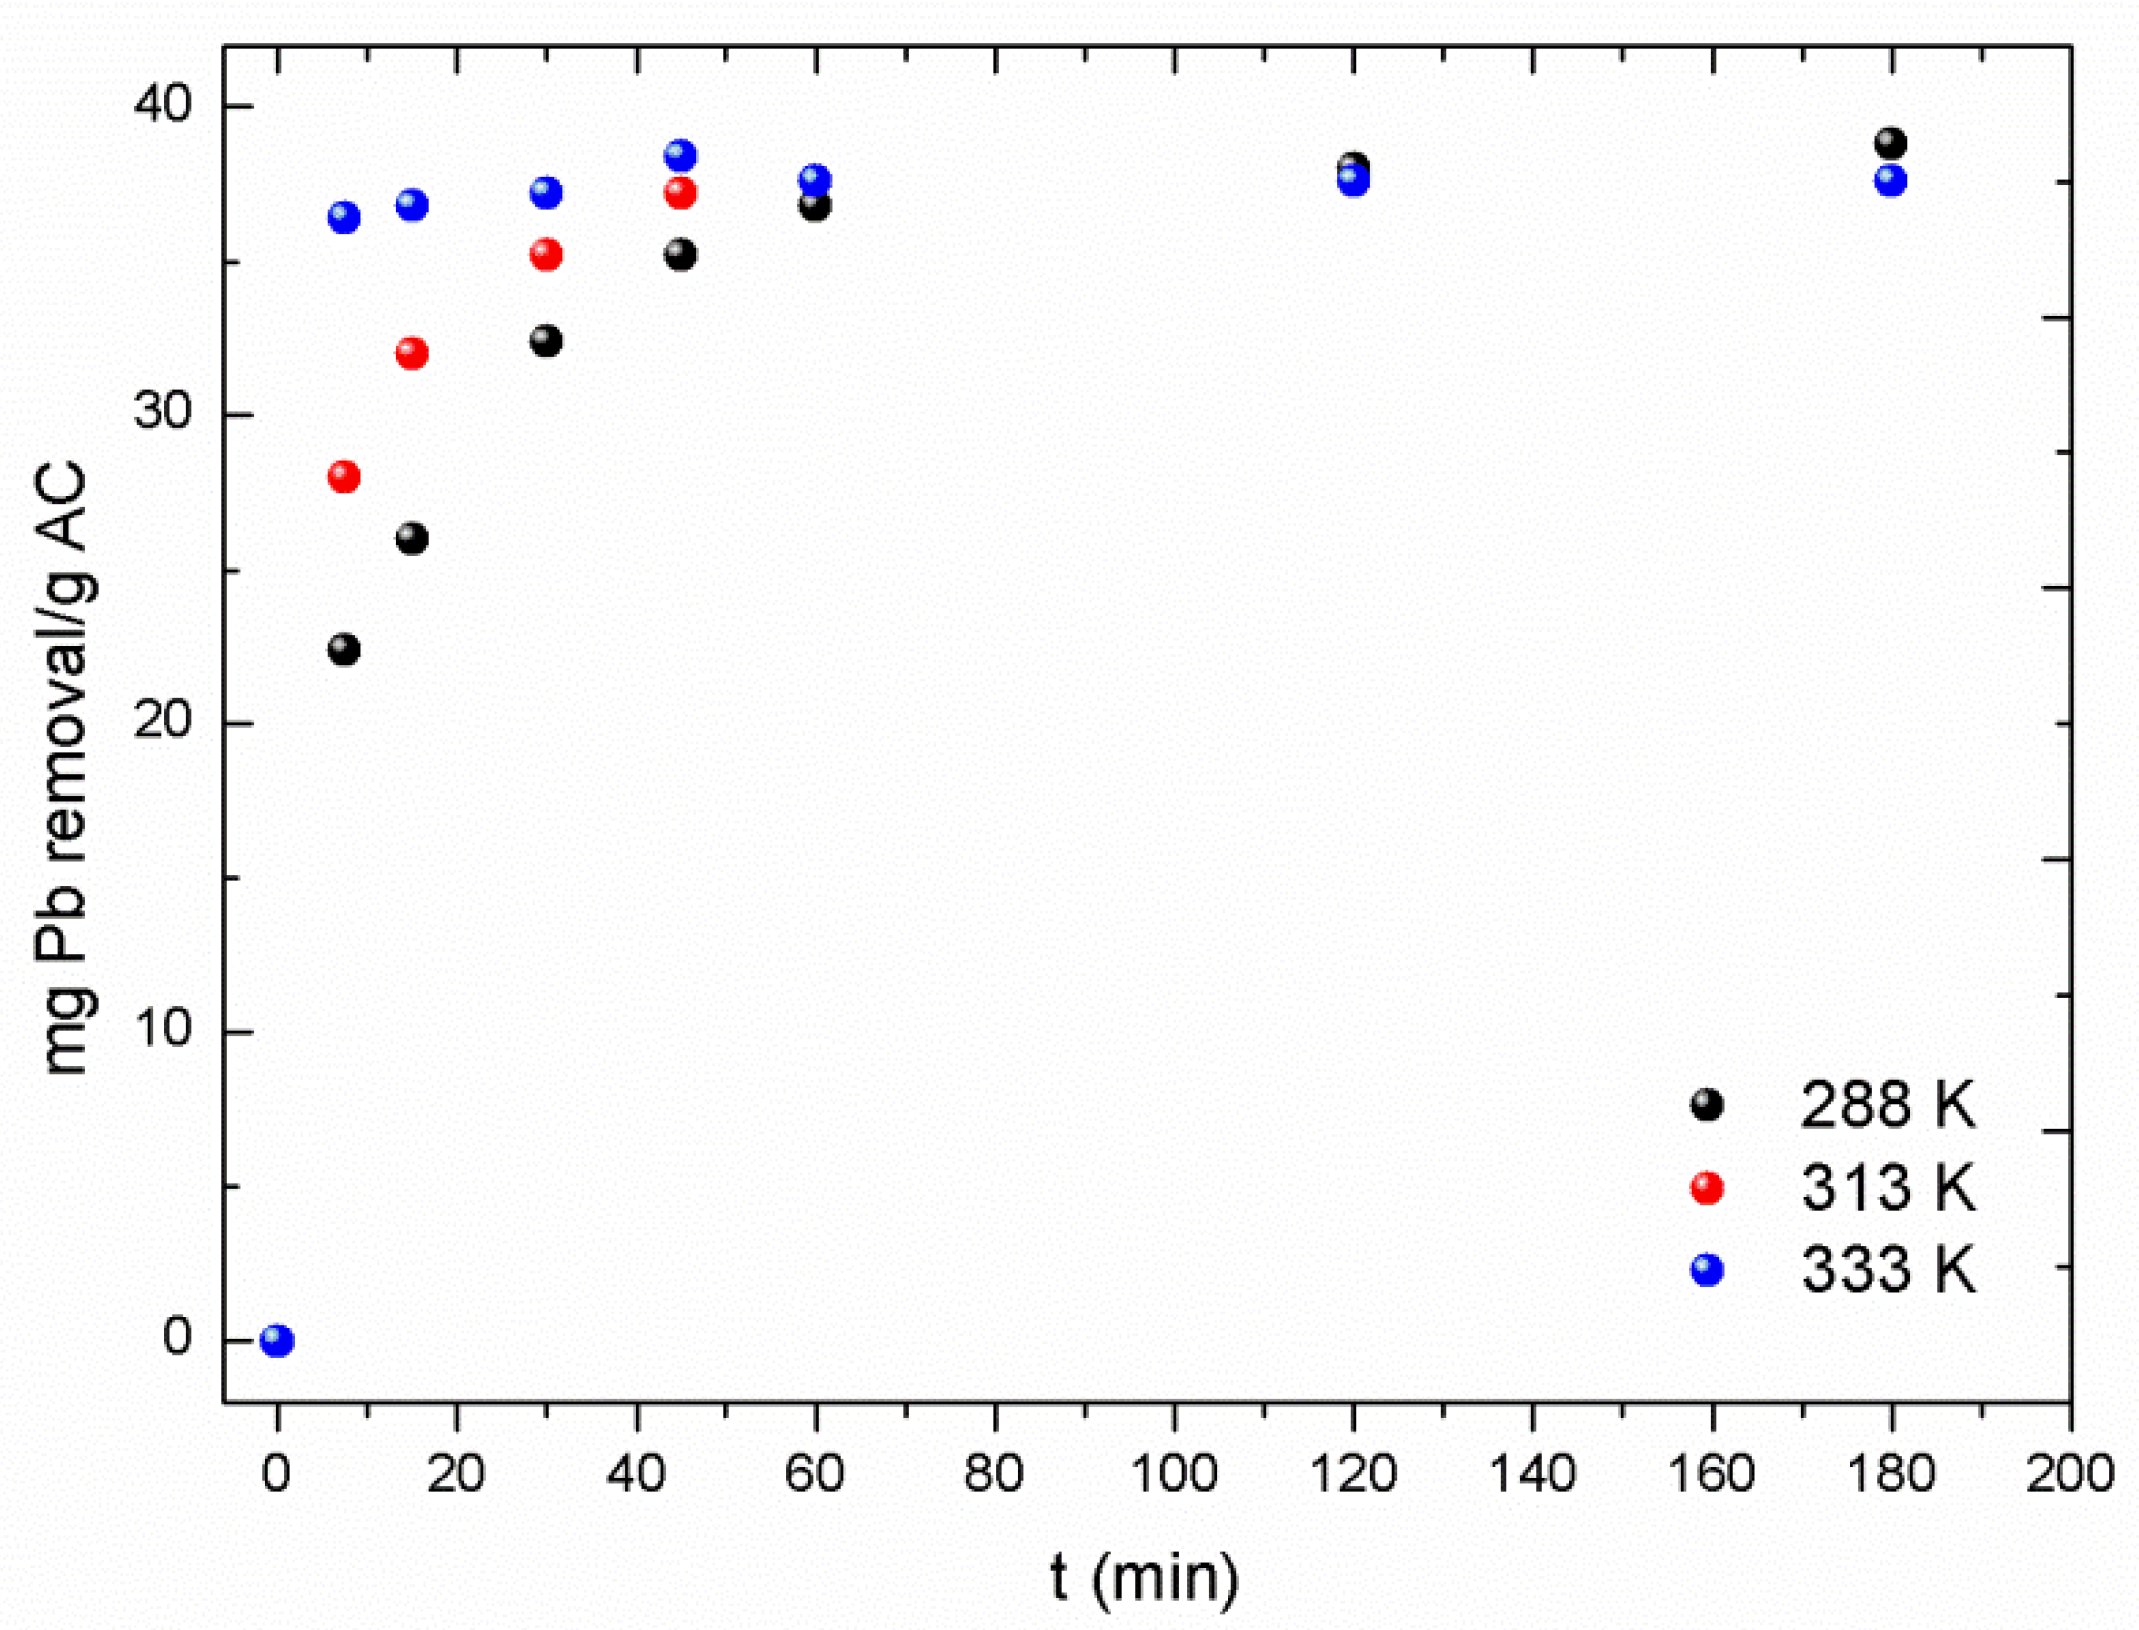
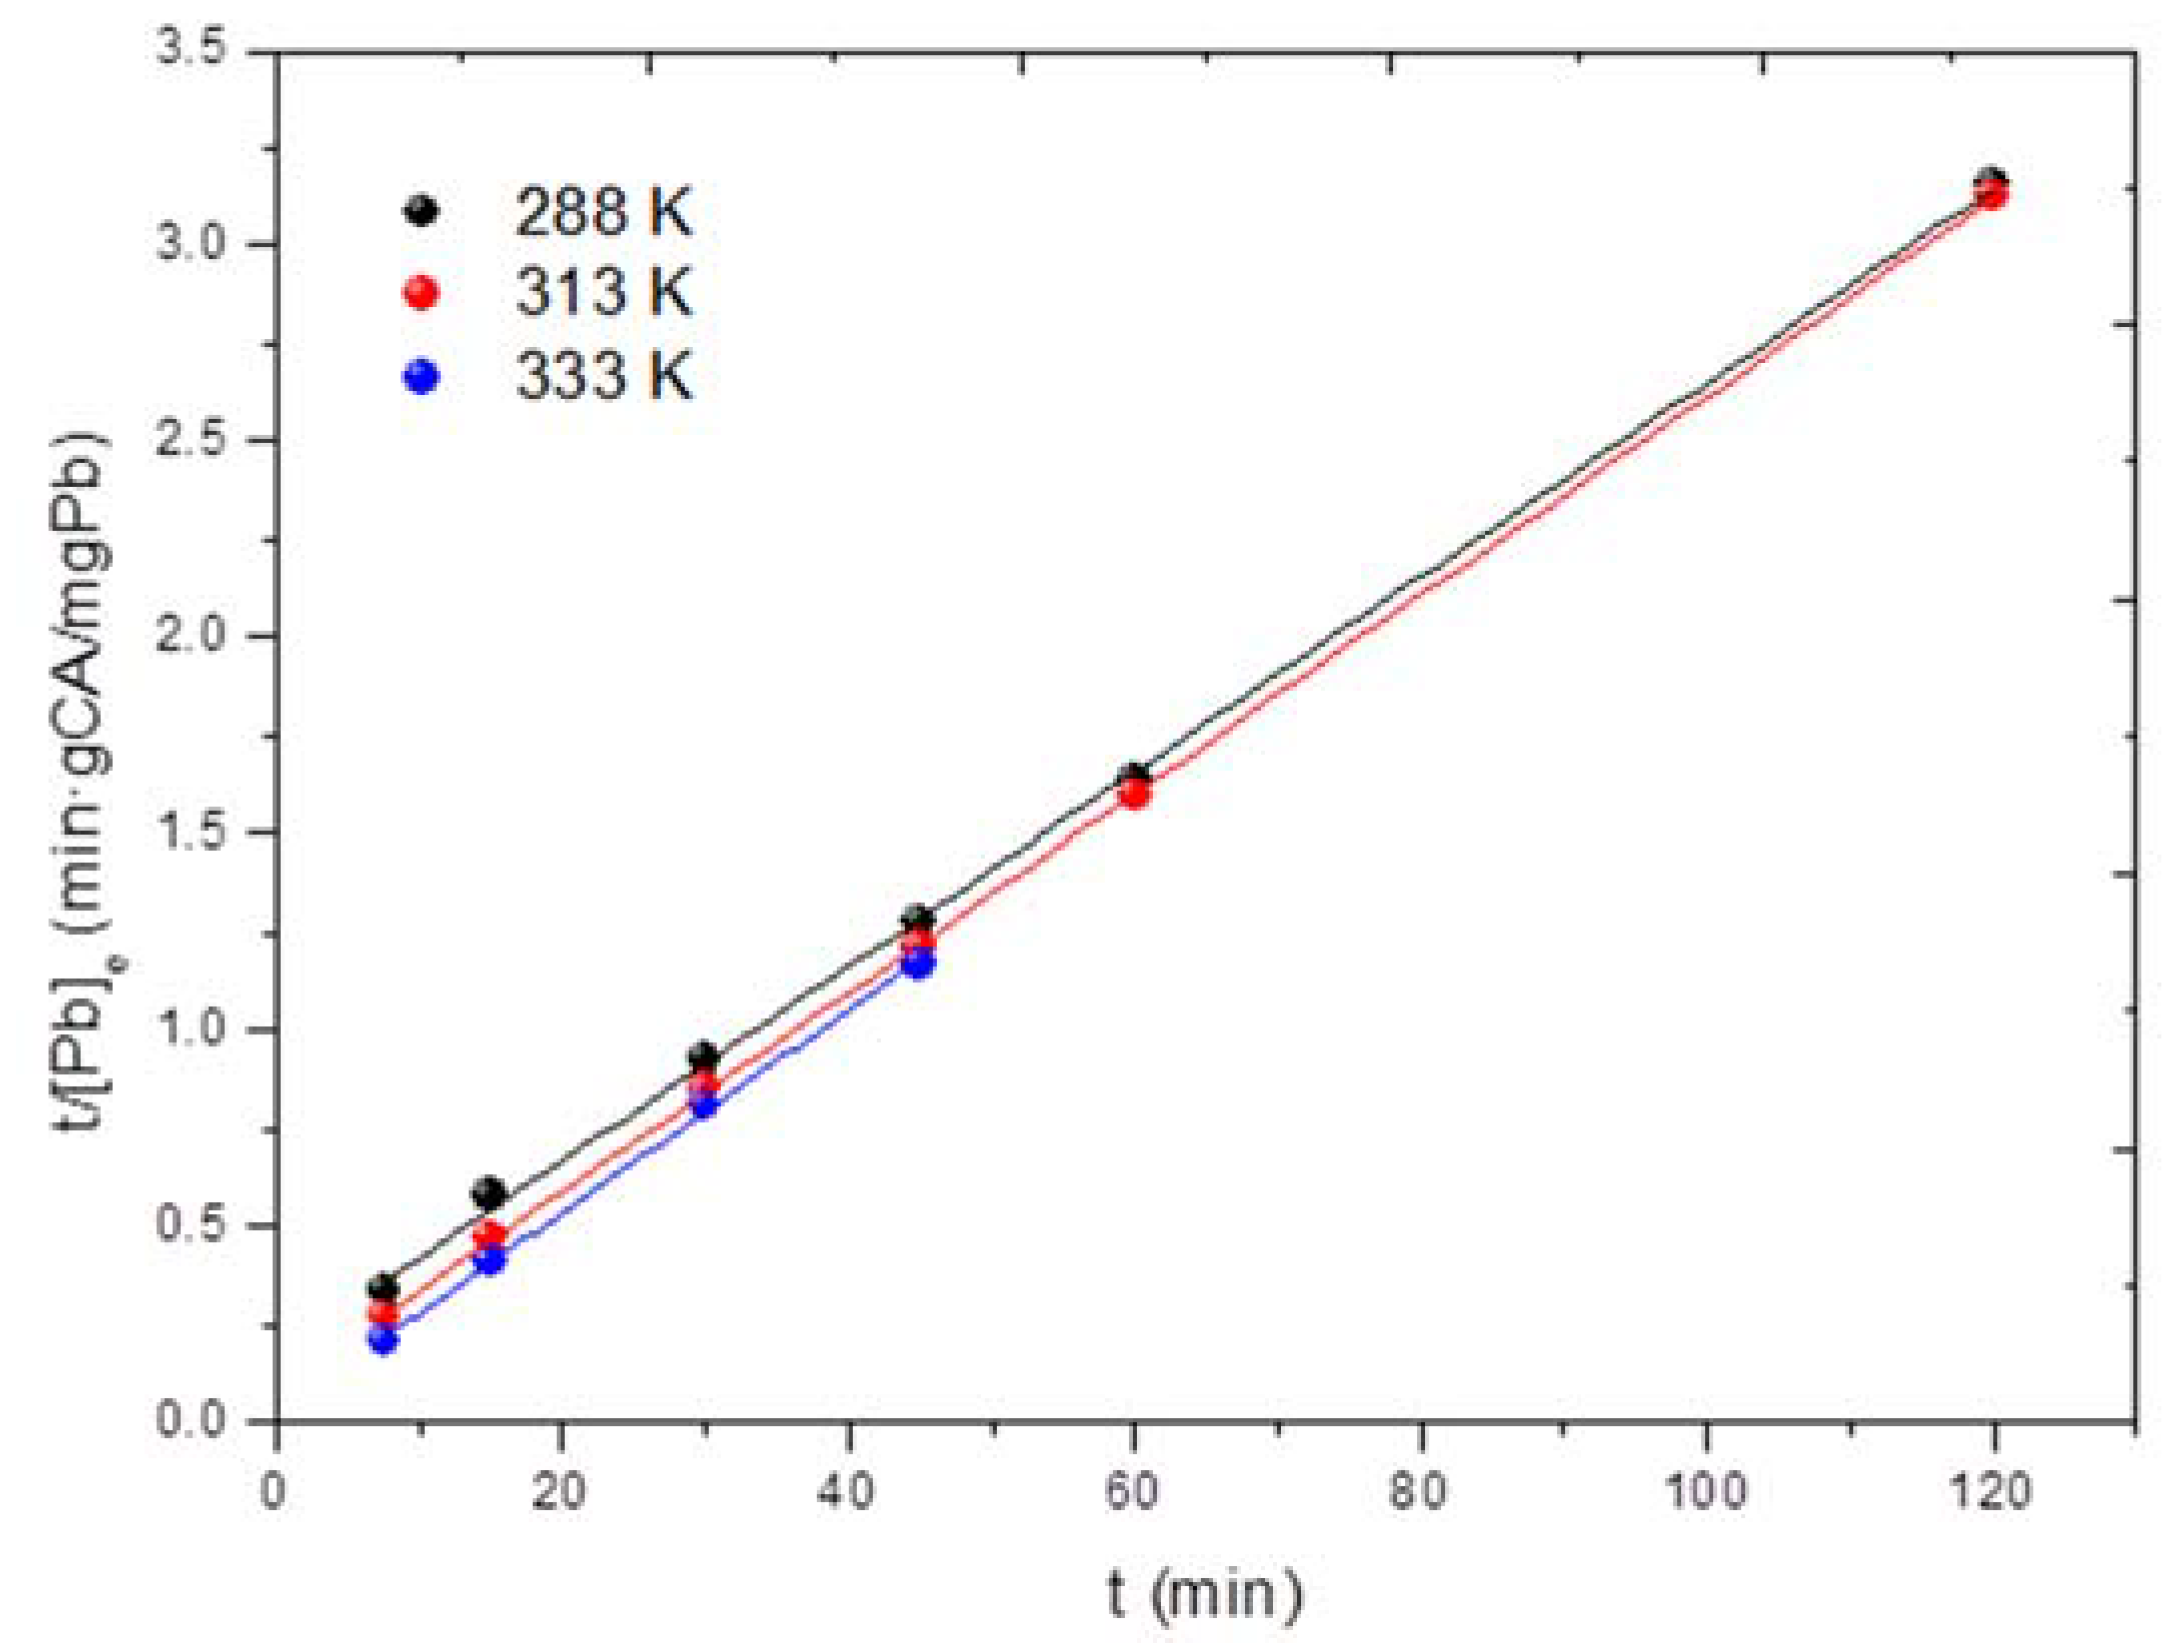
3.2.2. Effect of Temperature
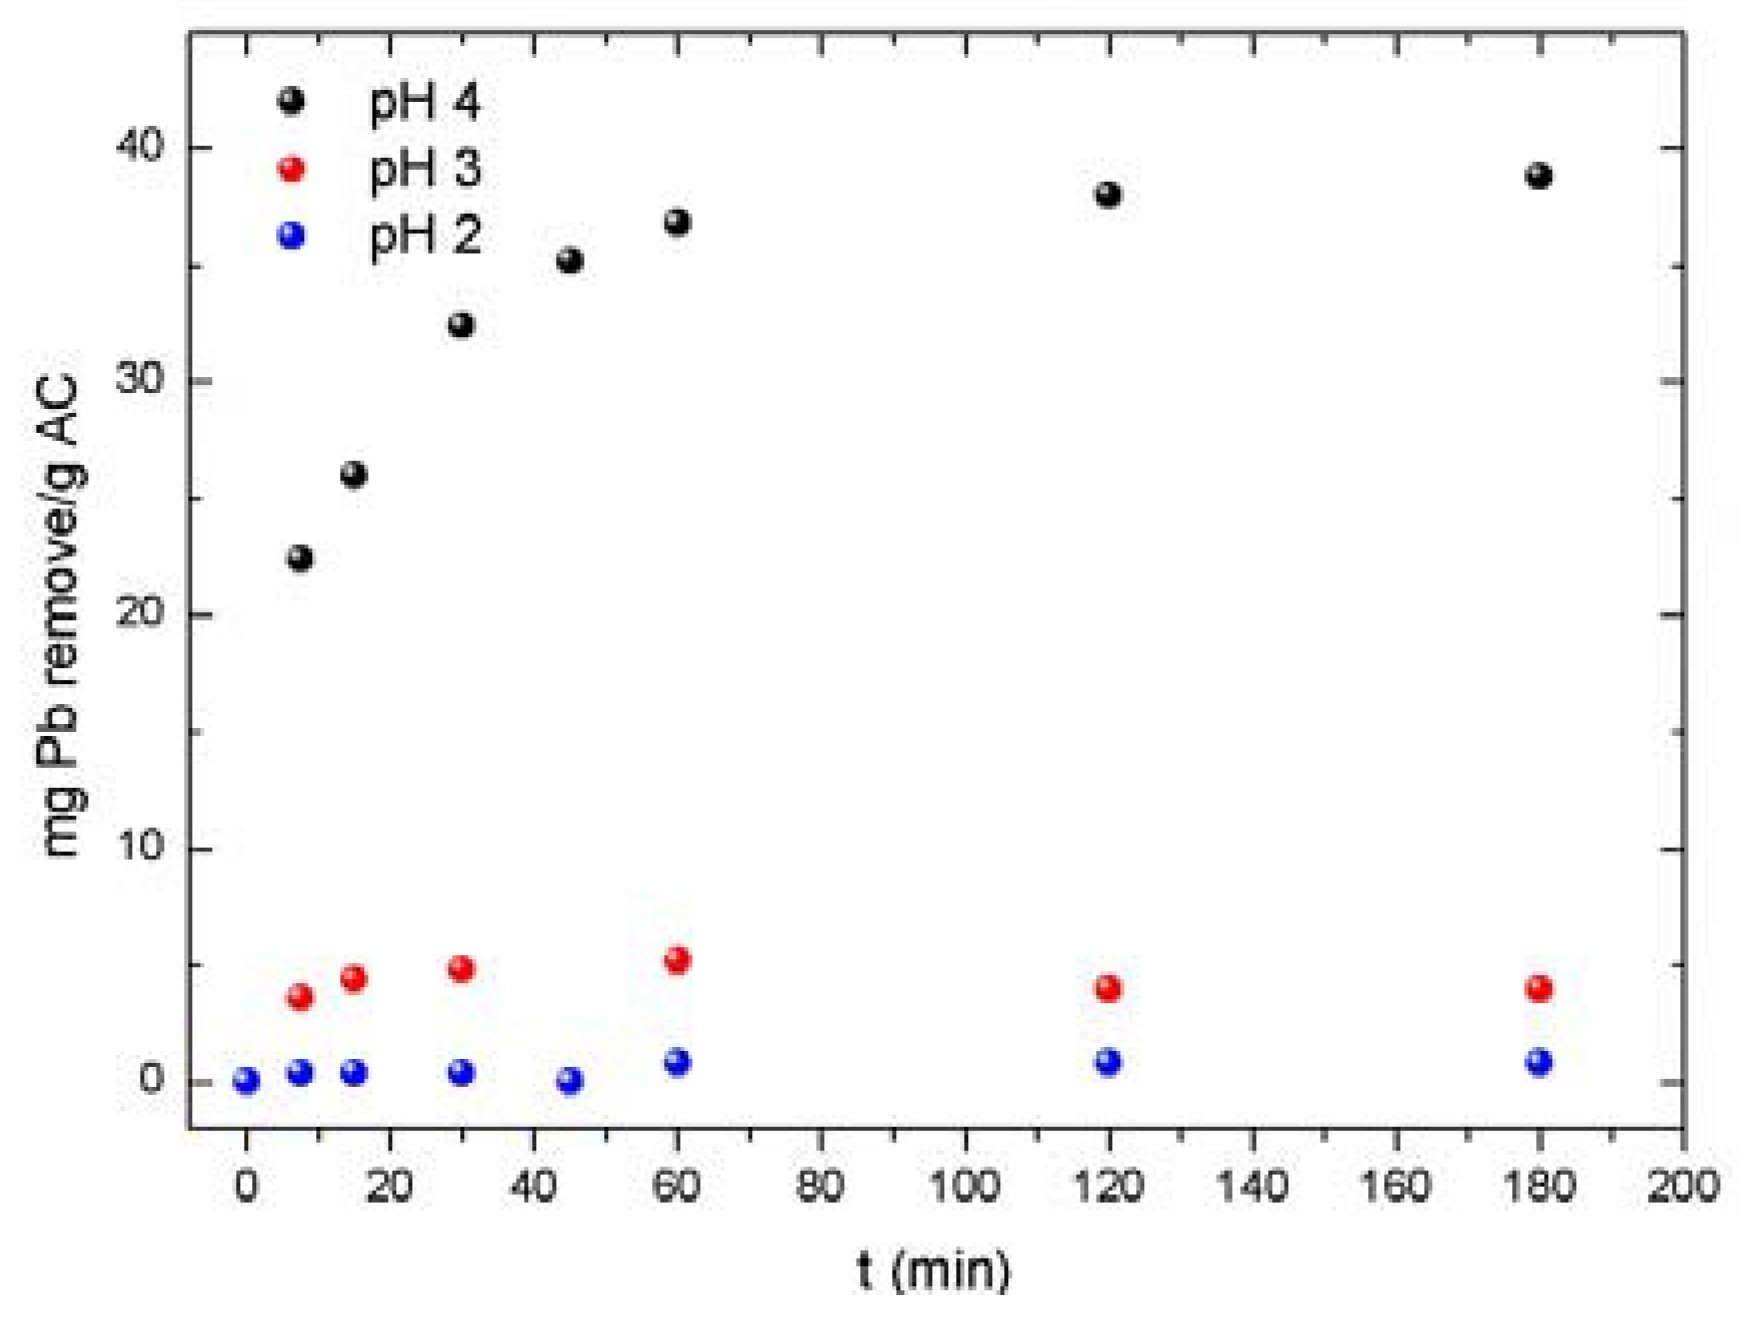
3.2.3. Influence of pH
3.2.4. Influence of AC Concentration
3.2.5. Influence of Ionic Strength
3.2.6. Performance of the AC Compared to Other Adsorbents/Ion Exchangers
3.2.7. Comparative Adsorption of Pb2+ and Others Metals in Solution
3.2.8. Pb2+ Elution
4. Conclusions
Author Contributions
Funding
Acknowledgments
Conflicts of Interest
References
- Yu, X.L.; He, Y. Optimal ranges of variables for an effective adsorption of lead(II) by the agricultural waste pomelo (Citrus grandis) peels using Doehlert designs. Sci. Rep. 2018, 8, 729. [Google Scholar] [CrossRef] [PubMed]
- De Agreda, D.; Garcia-Diaz, I.; López, F.A.; Alguacil, F.J. Supported liquid membranes technologies in metals removal from liquid effluents. Rev. Metal. 2011, 47, 146–168. [Google Scholar] [Green Version]
- Has-Schön, E.; Bogut, I.; Strelec, I. Heavy Metal Profile in Five Fish Species Included in Human Diet, Domiciled in the End Flow of River Neretva (Croatia). Arch. Environ. Contam. Toxicol. 2006, 50, 545–551. [Google Scholar] [CrossRef] [PubMed]
- Edathil, A.A.; Shittu, I.; Hisham Zain, J.; Banat, F.; Haija, M.A. Novel magnetic coffee waste nanocomposite as effective bioadsorbent for Pb(II) removal from aqueous solutions. J. Environ. Chem. Eng. 2018, 6, 2390–2400. [Google Scholar] [CrossRef]
- Wongrod, S.; Simon, S.; Guibaud, G.; Lens, P.N.L.; Pechaud, Y.; Huguenot, D.; van Hullebusch, E.D. Lead sorption by biochar produced from digestates: Consequences of chemical modification and washing. J. Environ. Manag. 2018, 219, 277–284. [Google Scholar] [CrossRef] [PubMed]
- Seema, K.M.; Mamba, B.B.; Njuguna, J.; Bakhtizin, R.Z.; Mishra, A.K. Removal of lead (II) from aqeouos waste using (CD-PCL-TiO2) bio-nanocomposites. Int. J. Biol. Macromol. 2018, 109, 136–142. [Google Scholar] [CrossRef] [PubMed]
- Beltrame, K.K.; Cazetta, A.L.; de Souza, P.S.C.; Spessato, L.; Silva, T.L.; Almeida, V.C. Adsorption of caffeine on mesoporous activated carbon fibers prepared from pineapple plant leaves. Ecotoxicol. Environ. Saf. 2018, 147, 64–71. [Google Scholar] [CrossRef] [PubMed]
- Sone, H.; Fugetsu, B.; Tanaka, S. Selective elimination of lead(II) ions by alginate/polyurethane composite foams. J. Hazard. Mater. 2009, 162, 423–429. [Google Scholar] [CrossRef] [PubMed]
- World Health Organisation. Guidelines for Drinking-Water Quality, 3rd ed.; WHO Library Cataloguing-in-Publication Data; World Health Organisation: Geneva, Switzerland, 2004; Volume 1, pp. 10–330. [Google Scholar]
- Kavak, D. Removal of lead from aqueous solutions by precipitation: Statistical analysis and modeling. Desalin. Water Treat. 2013, 51, 1720–1726. [Google Scholar] [CrossRef]
- Murray, A.; Örmeci, B. Use of polymeric sub-micron ion-exchange resins for removal of lead, copper, zinc, and nickel from natural waters. J. Environ. Sci. 2018. [Google Scholar] [CrossRef]
- Mlayah, A.; Jellali, S. Study of continuous lead removal from aqueous solutions by marble wastes: Efficiencies and mechanisms. Int. J. Environ. Sci. Technol. 2015, 12, 2965–2978. [Google Scholar] [CrossRef]
- Pang, F.M.; Kumar, P.; Teng, T.T.; Mohd Omar, A.K.; Wasewar, K.L. Removal of lead, zinc and iron by coagulation–flocculation. J. Taiwan Inst. Chem. Eng. 2011, 42, 809–815. [Google Scholar] [CrossRef]
- Gherasim, C.-V.; Křivčík, J.; Mikulášek, P. Investigation of batch electrodialysis process for removal of lead ions from aqueous solutions. Chem. Eng. J. 2014, 256, 324–334. [Google Scholar] [CrossRef]
- Jana, D.K.; Roy, K.; Dey, S. Comparative assessment on lead removal using micellar-enhanced ultrafiltration (MEUF) based on a type-2 fuzzy logic and response surface methodology. Sep. Purif. Technol. 2018, 207, 28–41. [Google Scholar] [CrossRef]
- Fu, F.; Wang, Q. Removal of heavy metal ions from wastewaters: A review. J. Environ. Manag. 2011, 92, 407–418. [Google Scholar] [CrossRef] [PubMed]
- Eccles, H. Treatment of metal-contaminated wastes: Why select a biological process? Trends Biotechnol. 1999, 17, 462–465. [Google Scholar] [CrossRef]
- Xu, J.; Cao, Z.; Zhang, Y.; Yuan, Z.; Lou, Z.; Xu, X.; Wang, X. A review of functionalized carbon nanotubes and graphene for heavy metal adsorption from water: Preparation, application, and mechanism. Chemosphere 2018, 195, 351–364. [Google Scholar] [CrossRef] [PubMed]
- Taraba, B.; Bulavová, P. Adsorption enthalpy of lead(II) and phenol on coals and activated carbon in the view of thermodynamic analysis and calorimetric measurements. J. Chem. Thermodyn. 2018, 116, 97–106. [Google Scholar] [CrossRef]
- Kaya, I.G.B.; Duranoglu, D.; Beker, U.; Senkal, B.F. Development of Polymeric and Polymer-Based Hybrid Adsorbents for Chromium Removal from Aqueous Solution. CLEAN-Soil Air Water 2011, 39, 980–988. [Google Scholar] [CrossRef]
- Walcarius, A.; Mercier, L. Mesoporous organosilica adsorbents: Nanoengineered materials for removal of organic and inorganic pollutants. J. Mater. Chem. 2010, 20, 4478. [Google Scholar] [CrossRef]
- Efome, J.E.; Rana, D.; Matsuura, T.; Lan, C.Q. Metal-organic frameworks supported on nanofibers to remove heavy metals. J. Mater. Chem. A 2018, 6, 4550–4555. [Google Scholar] [CrossRef]
- Ravulapalli, S.; Kunta, R. Removal of lead (II) from wastewater using active carbon of Caryota urens seeds and its embedded calcium alginate beads as adsorbents. J. Environ. Chem. Eng. 2018, 6, 4298–4309. [Google Scholar] [CrossRef]
- Renu, M.A.; Singh, K.; Upadhyaya, S.; Dohare, R.K. Removal of heavy metals from wastewater using modified agricultural adsorbents. Mater. Today Proc. 2017, 4, 10534–10538. [Google Scholar] [CrossRef]
- Pawar, R.R.; Kim, M.; Kim, J.-G.; Hong, S.-M.; Sawant, S.Y.; Lee, S.M. Efficient removal of hazardous lead, cadmium, and arsenic from aqueous environment by iron oxide modified clay-activated carbon composite beads. Appl. Clay Sci. 2018, 162, 339–350. [Google Scholar] [CrossRef]
- Jain, A.; Balasubramanian, R.; Srinivasan, M.P. Hydrothermal conversion of biomass waste to activated carbon with high porosity: A review. Chem. Eng. J. 2016, 283, 789–805. [Google Scholar] [CrossRef]
- Sevilla, M.; Fuertes, A.B. The production of carbon materials by hydrothermal carbonization of cellulose. Carbon 2009, 47, 2281–2289. [Google Scholar] [CrossRef] [Green Version]
- Hassan, A.F.; Elhadidy, H. Production of activated carbons from waste carpets and its application in methylene blue adsorption: Kinetic and thermodynamic studies. J. Environ. Chem. Eng. 2017, 5, 955–963. [Google Scholar] [CrossRef]
- Tsoncheva, T.; Mileva, A.; Tsyntsarski, B.; Paneva, D.; Spassova, I.; Kovacheva, D.; Velinov, N.; Karashanova, D.; Georgieva, B.; Petrov, N. Activated carbon from Bulgarian peach stones as a support of catalysts for methanol decomposition. Biomass Bioenergy 2018, 109, 135–146. [Google Scholar] [CrossRef]
- Enniya, I.; Rghioui, L.; Jourani, A. Adsorption of hexavalent chromium in aqueous solution on activated carbon prepared from apple peels. Sustain. Chem. Pharm. 2018, 7, 9–16. [Google Scholar] [CrossRef]
- Jimenez-Cordero, D.; Heras, F.; Alonso-Morales, N.; Gilarranz, M.A.; Rodriguez, J.J. Porous structure and morphology of granular chars from flash and conventional pyrolysis of grape seeds. Biomass Bioenergy 2013, 54, 123–132. [Google Scholar] [CrossRef]
- Alcaraz, L.; López Fernández, A.; García-Díaz, I.; López, F.A. Preparation and characterization of activated carbons from winemaking wastes and their adsorption of methylene blue. Adsorpt. Sci. Technol. 2018, 36, 1331–1351. [Google Scholar] [CrossRef] [Green Version]
- Unur, E. Functional nanoporous carbons from hydrothermally treated biomass for environmental purification. Microporous Mesoporous Mater. 2013, 168, 92–101. [Google Scholar] [CrossRef]
- Li, M.; Li, W.; Liu, S. Hydrothermal synthesis, characterization, and KOH activation of carbon spheres from glucose. Carbohydr. Res. 2011, 346, 999–1004. [Google Scholar] [CrossRef] [PubMed]
- Altintig, E.; Kirkil, S. Preparation and properties of Ag-coated activated carbon nanocomposites produced from wild chestnut shell by ZnCl2 activation. J. Taiwan Inst. Chem. Eng. 2016, 63, 180–188. [Google Scholar] [CrossRef]
- Liu, S.; Sun, J.; Huang, Z. Carbon spheres/activated carbon composite materials with high Cr(VI) adsorption capacity prepared by a hydrothermal method. J. Hazard. Mater. 2010, 173, 377–383. [Google Scholar] [CrossRef] [PubMed]
- Salman, J.M.; Njoku, V.O.; Hameed, B.H. Adsorption of pesticides from aqueous solution onto banana stalk activated carbon. Chem. Eng. J. 2011, 174, 41–48. [Google Scholar] [CrossRef]
- Foo, K.Y.; Hameed, B.H. Factors affecting the carbon yield and adsorption capability of the mangosteen peel activated carbon prepared by microwave assisted K2CO3 activation. Chem. Eng. J. 2012, 180, 66–74. [Google Scholar] [CrossRef]
- Glonek, K.; Wróblewska, A.; Makuch, E.; Ulejczyk, B.; Krawczyk, K.; Wróbel, R.J.; Koren, Z.C.; Michalkiewicz, B. Oxidation of limonene using activated carbon modified in dielectric barrier discharge plasma. Appl. Surf. Sci. 2017, 420, 873–881. [Google Scholar] [CrossRef]
- Chen, W.F.; Pan, L.; Chen, L.F.; Yu, Z.; Wang, Q.; Yan, C.C. Comparison of EDTA and SDS as potential surface impregnation agents for lead adsorption by activated carbon. Appl. Surf. Sci. 2014, 309, 38–45. [Google Scholar] [CrossRef]
- Pereira, L.; Pereira, E.; Cremades, A.; Piqueras, J.; Jiménez, J.; Bielza, J. Characterisation of different habits in torch-flame-grown diamond and diamond-like films. Diam. Relat. Mater. 1999, 8, 1333–1341. [Google Scholar] [CrossRef]
- Basu, M.; Guha, A.K.; Ray, L. Adsorption of Lead on Cucumber Peel. J. Clean. Prod. 2017, 151, 603–615. [Google Scholar] [CrossRef]
- Kobya, M.; Demirbas, E.; Senturk, E.; Ince, M. Adsorption of heavy metal ions from aqueous solutions by activated carbon prepared from apricot stone. Bioresour. Technol. 2005, 96, 1518–1521. [Google Scholar] [CrossRef] [PubMed]
- Ho, Y.S.; Wase, D.A.J.; Forster, C.F. Removal of Lead Ions From Aqueous Solution Using Sphagnum Moss Peat as Adsorbent. Water SA 1996, 22, 219–224. [Google Scholar]
- Largitte, L.; Gervelas, S.; Tant, T.; Couespel Dumesnil, P.; Lodewyckx, P. Influence of the surface properties of the Bois Carré seeds activated carbon on the removal of lead from aqueous solutions. Eurasian Chem. J. 2013, 14, 201–210. [Google Scholar] [CrossRef]
- Machida, M.; Aikawa, M.; Tatsumoto, H. Prediction of simultaneous adsorption of Cu(II) and Pb(II) onto activated carbon by conventional Langmuir type equations. J. Hazard. Mater. 2005, 120, 271–275. [Google Scholar] [CrossRef] [PubMed]
- Kikuchi, Y.; Qian, Q.; Machida, M.; Tatsumoto, H. Effect of ZnO loading to activated carbon on Pb(II) adsorption from aqueous solution. Carbon 2006, 44, 195–202. [Google Scholar] [CrossRef]
- Ricordel, S. Heavy metals removal by adsorption onto peanut husks carbon: Characterization, kinetic study and modeling. Sep. Purif. Technol. 2001, 24, 389–401. [Google Scholar] [CrossRef]
- Al-Degs, Y.S.; El-Barghouthi, M.I.; El-Sheikh, A.H.; Walker, G.M. Effect of solution pH, ionic strength, and temperature on adsorption behavior of reactive dyes on activated carbon. Dyes Pigments 2008, 77, 16–23. [Google Scholar] [CrossRef]


| Parameter | Value |
|---|---|
| Proximate analysis a | |
| Moisture | 4.50 |
| Ash | 11.50 |
| Volatile matter | 15.00 |
| Fixed Carbon | 69.00 |
| Ultimate analysis a | |
| C | 82.00 |
| H | 2.70 |
| N | 0.99 |
| O b | 14.5 |
| S | 0.10 |
| Total Pore Volume (Vp) (cm3·g−1) | 1.40 |
| Micropore Volume (W0) (cm3·g−1) | 0.95 |
| Average Micropore Size (L0) (nm) | 1.71 |
| Microporous Surface Area (Smi) (m2·g−1) | 1111 |
| Non-Microporous Surface Area (Se) (m2·g−1) | 19 |
| Total Surface Area (Stotal) (m2·g−1) | 1194 |
| SBET (m2·g−1) | 2662 |
| Stirring Rate (rpm) | Lead Loading (mg·g−1) |
|---|---|
| 250 | 31 |
| 500 | 37 |
| 750 | 38 |
| 875 | 30 |
| 1000 | 28 |
| pH of Aqueous Solution | Pb2+ Load a (mg·g−1) | Pb2+ Load b (mg·g−1) |
|---|---|---|
| 4 | 38 | 20 |
| 3 | 4 | 5 |
| 2 | 0.8 | <0.5 |
| AC Concentration (g·L−1) | Pb2+ Removed (%) |
|---|---|
| 0.05 | 28 |
| 0.09 | 50 |
| 0.13 | 71 |
| 0.25 | 96 |
| 0.50 | 99 |
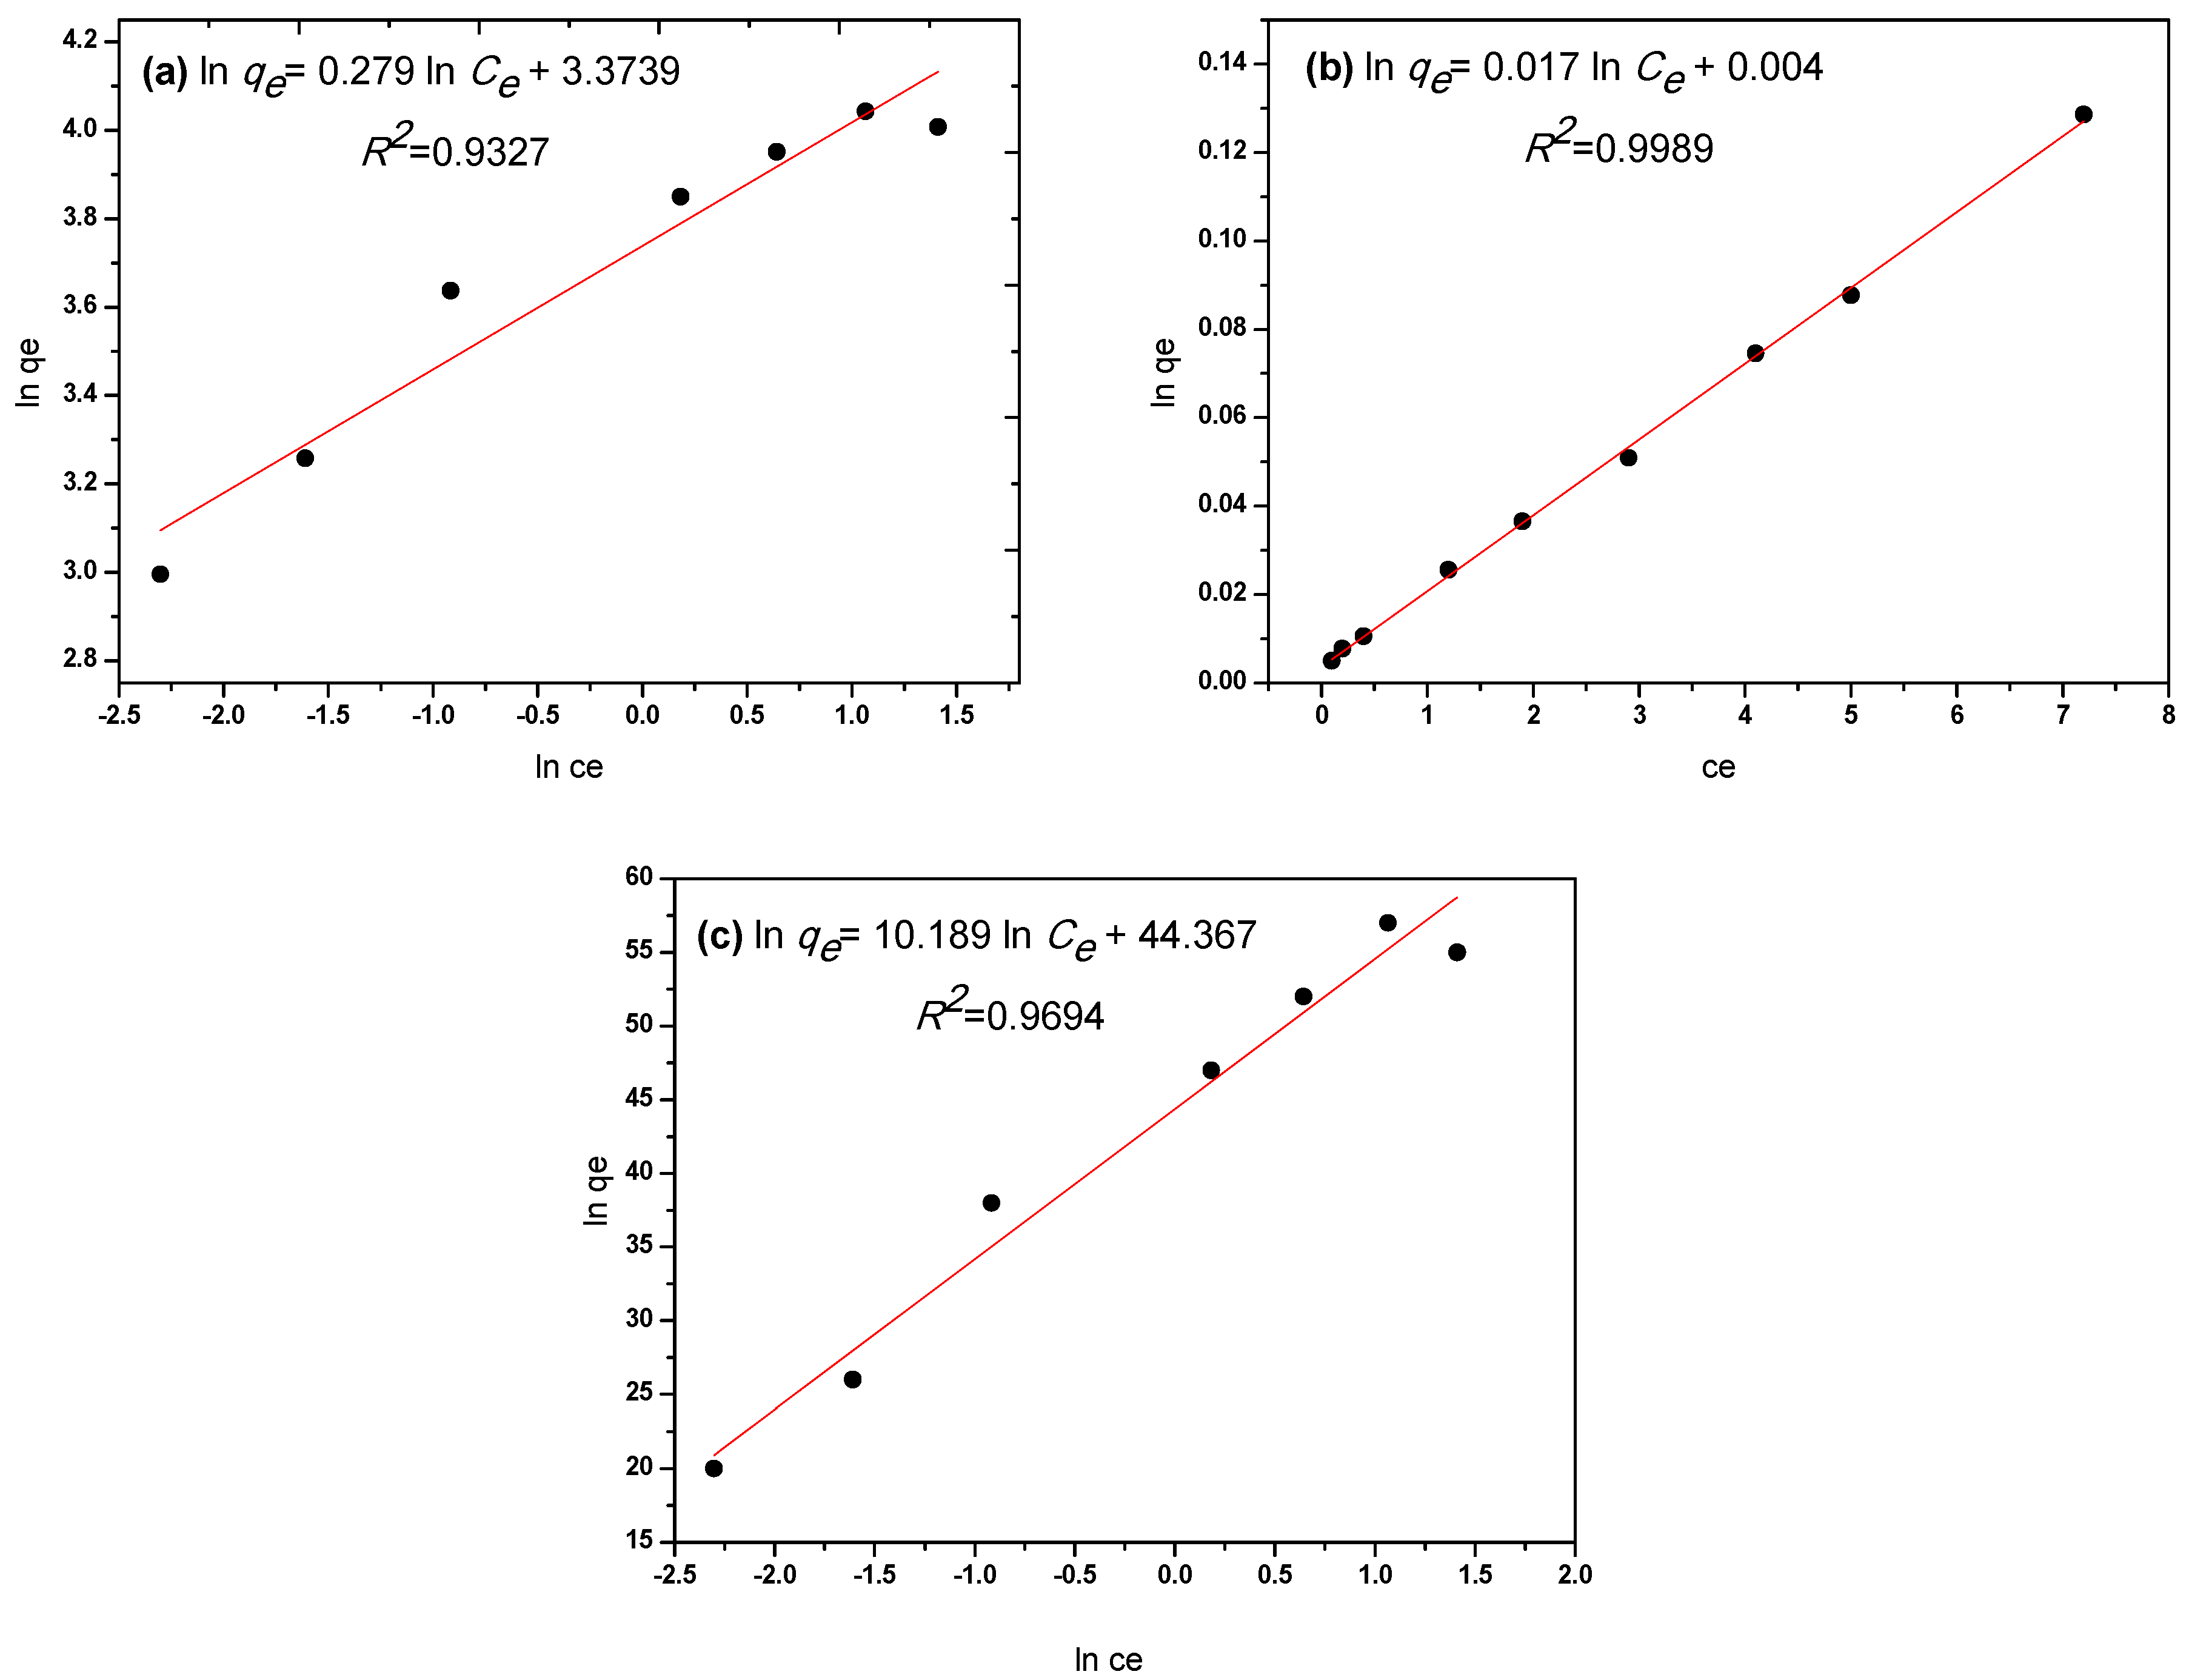
| Freundlich | Langmuir | Temkin | ||||
|---|---|---|---|---|---|---|
| KF (L·g−1) | 1/n | qm (mg·g−1) | b (L·mg−1) | RL | AT | bT |
| 42.04 | 0.28 | 58.31 | 4.75 | 0.02 | 77.84 | 235.01 |
| qm, exp (mol/g) | T (K) | pH Value | Material Type | Reference |
|---|---|---|---|---|
| 22.8 | 298 | 5 | AC from apricot stone | [43] |
| 25 | 313 | 5 | Sphagnum moss peat | [44] |
| 37.9 | 303 | 5 | AC from Bois carre seeds | [45] |
| 47.2 | 303 | 5 | Commercial activated carbon | [46] |
| 76.4 | 298 | 5.5 | AC from Coconut shell | [47] |
| 31 | 293 | 6 | Peanuts husks carbon | [48] |
| Ionic Strength (M) | Pb2+ Uptake (mg·g−1) |
|---|---|
| <0.01 | 38 |
| 0.1 | 37 |
| 0.25 | 31 |
| 0.50 | 23 |
| Adsorbent-Exchanger | Active Group | Lead Load (mg·g−1) |
|---|---|---|
| Activated carbon | - | 38 |
| Lewatit EP-63 | - | <2 |
| MWCNT | - | <1 |
| Lewatit TP208 | weakly acidic, Na+ form | 34 |
| Lewatit K-2621 | strongly acidic, H+ form | 36 |
| Metal | Metal Uptake (mg·g−1) |
|---|---|
| Pb(II) | 38 |
| Ni(II) | 12 |
| Mn(II) | 8 |
| Co(II) | 9 |
| Cu(II) | 12 |
| Cr(III) | 11 |
| Cd(II) | 10 |
| Volume Eluent/AC Concentration (mL·g−1) | Pb2+ in the Solution (mg·L−1) |
|---|---|
| 200 | 130 |
| 500 | 52 |
| 1000 | 26 |
| 2000 | 13 |
| 4000 | 6.5 |
© 2018 by the authors. Licensee MDPI, Basel, Switzerland. This article is an open access article distributed under the terms and conditions of the Creative Commons Attribution (CC BY) license (http://creativecommons.org/licenses/by/4.0/).
Share and Cite
Alguacil, F.J.; Alcaraz, L.; García-Díaz, I.; López, F.A. Removal of Pb2+ in Wastewater via Adsorption onto an Activated Carbon Produced from Winemaking Waste. Metals 2018, 8, 697. https://doi.org/10.3390/met8090697
Alguacil FJ, Alcaraz L, García-Díaz I, López FA. Removal of Pb2+ in Wastewater via Adsorption onto an Activated Carbon Produced from Winemaking Waste. Metals. 2018; 8(9):697. https://doi.org/10.3390/met8090697
Chicago/Turabian StyleAlguacil, Francisco José, Lorena Alcaraz, Irene García-Díaz, and Félix Antonio López. 2018. "Removal of Pb2+ in Wastewater via Adsorption onto an Activated Carbon Produced from Winemaking Waste" Metals 8, no. 9: 697. https://doi.org/10.3390/met8090697
APA StyleAlguacil, F. J., Alcaraz, L., García-Díaz, I., & López, F. A. (2018). Removal of Pb2+ in Wastewater via Adsorption onto an Activated Carbon Produced from Winemaking Waste. Metals, 8(9), 697. https://doi.org/10.3390/met8090697