Effect of Vibration Stress Relief on the Shape Stability of Aluminum Alloy 7075 Thin-Walled Parts
by
 ,
,
Hai Gong
1,2,3,* ,
,
Yanjie Sun
1,3,
Yaoqiong Liu
1,2,4,
Yunxin Wu
1,2,3,
Yipeng He
1,2,
Xiaoliang Sun
1,3 and
Minghai Zhang
1,2 1
State Key Laboratory of High Performance Complex Manufacturing, Central South University, Changsha 410083, China
2
School of Mechanical and Electrical Engineering, Central South University, Changsha 410083, China
3
Nonferrous Metal Oriented Advanced Structural Materials and Manufacturing Cooperative Innovation Center, Central South University, Changsha 410083, China
4
Institute of Standard Materials Technology, Avic The First Aircraft Institute, Xi’an 710000, China
*
Author to whom correspondence should be addressed.
Metals 2019, 9(1), 27; https://doi.org/10.3390/met9010027
Submission received: 29 October 2018
/
Revised: 21 December 2018
/
Accepted: 22 December 2018
/
Published: 29 December 2018
Abstract
:Aluminum alloy 7075 is one of the materials widely used in the manufacture of structural components used by aviation industries. High precision is required in producing the shapes of such components due to shape stability and dimensional accuracy being difficult to maintain throughout the different stages of manufacturing. In this work, an experimental study of the effect of VSR (Vibratory Stress Relief) on the deformation and residual stresses of aluminum alloy 7075 thin-walled components is presented. It was concluded that VSR improved the shape and size stability of the material to a significant level by relieving induced residual stresses in the thin-walled parts. Finally, more uniform residual stress distribution was obtained after the VSR treatment, compared to before the VSR treatment. This proved that VSR has a significant influence on improving the shape stability of the thin-walled aluminum alloy 7075 components.
1. Introduction
Aluminum alloy materials are widely used in the manufacture of aerospace components such as frameworks, wings, etc. These parts are usually manufactured from heat treated, thick aluminum alloy plates which are processed through milling and other manufacturing procedures. The influence of heat treatment temperature fields, clamping method, heat generated during machining and the stresses developed during the milling process, result in the inevitable development of residual stress in the manufactured parts, which may accelerate fatigue failure, cause stress corrosion and deformation of construction.
On the one hand, with the development of high-speed milling technology, proper attention has been given to the study of induced stresses and processing parameters of aeronautical aluminum alloy thin-walled parts instead of their dimensional deformation. Martín [1] proposes that a higher feed rate leads to greater brittleness of the material, so processing parameters must be adjusted reasonably. Rodriguez-Alabanda’s study [2] shows that the selected cutting strategy and cutting parameters have a great impact on surface roughness, and then on subsequent measurement. Dong [3,4] studied the effect of clamping position and clamping method on the developed stresses in thin-walled parts during machining; the clamping method of the workpiece was optimized by using simulation method. Denkena [5] separated the influence of thermal deviation on the deflection caused due to processing force by finite element simulation, and developed a model that can predict shape deviation on the premise of considering the influence of thermal and mechanical parameters on the surface generation. Shirase and Altinta [6] introduced the generation mechanism of cutting force and dimension error of variable pitch helical end milling cutter, and established the mathematical model for predicting the force and surface parameters considering the chip regeneration mechanism under the deflection of static end mill, and then verified that variable pitch cutters can reduce the dimension error caused by static deflection of slender end milling cutters through experiments. Necmettin [7] optimized the fixture layout by genetic algorithm and controlled deformation in the process of machining. Sebastian [8] established a model for predicting machining deformation, which is only affected by initial residual stress. It was concluded that the deformation due to the processing of components was closely related to the position and shape of parts. At the same time, it was concluded that the processing-induced deformation was related to the initial residual stress. Tsai [9] proposed a novel real-time control strategy for milling cutters, which estimates cutting moment by adjusting the feedback of the spindle’s motor current and feed speed, significantly reduces the time consumption of milling cycles and maintains the required cutting accuracy. Gao et al. [10] studied the effect of amplitude on fatigue life and fatigue properties of aluminum alloy 7075, and concluded that low amplitude has a positive effect on 7075-T651. Wang [11] studied the texture and crystalline orientation of AA6061 aluminum alloy after VSR by means of electron backscattering, and explored the mechanism of stress reduction.
However, due to its low cost and good effect, the process is widely used in foundry, welding and other industries, but little research has been done on thin-walled aeronautical aluminum alloy parts. Rao et al. [12] studied the variation of stress and strain in stainless steel weldments under cyclic loading by fatigue testing machine, and expressed its mechanism. Mayer et al. [13] reported that aluminum alloy 319-T7 showing durability limits at about 107 cycles, and predicted material life by stress values. Wang et al. [14] studied the residual stress relaxation and texture evolution of cold rolled AZ31 magnesium alloy through the vibration stress of a simple cantilever beam vibration system, emphasizing the influence of vibration time. Saurav Mohanty et al. [15] successfully reduced the welding residual stresses of AISI 316 welded plate by using electromagnetic wave VSR. Rao [16] examined the cyclic stress and strain of type 304L stainless steel welded specimens and presents the cyclic creep mechanism during VSR of 304L.
The work presented in this paper is proposed to improve the shape and dimensional stability of aircraft components. It has been shown that VSR can redistribute induced residual stresses and reduce the deformation of workpieces [17]. Based on this idea, an experimental validation was performed: By exploring the effect of VSR on the shape and dimensional stability of thin-walled single-frame aluminum alloy parts, this provides a means for exploring VSR to improve the shape stability of aircraft components.
Therefore, the experimental investigation of the effect of VSR on the shape stability of thin-walled aluminum alloy parts is presented. The series of experiments carried out were quenching, machining, vibration stress relief, and natural aging. Finally, stress and deformation induced on the processed parts were measured and analyzed at all of these stages.
2. Experimental Processes
The chemical composition (wt %) of the alloy is given in Table 1.
Five samples of dimension 400 mm × 110 mm × 40 mm were cut from an aluminum alloy 7075 plate. Then, the surfaces of the five samples were flattened by milling operation.
2.1. Quenching Experiment
Firstly, all of the samples were heated to 475 °C, held for 7 h and then quenched in 20 °C water. Figure 1 shows the quenching process.
The contours of the surface (length and width, as shown in Figure 2) of sample A, B, C, D and E were measured using an MQ8106 coordinate measuring machine (CMM, Xi’an High-Tech Aeh Industrial Metrology Co., Ltd., Xi’an, China) with a nominal accuracy of approximately 0.0028 mm/300 mm. The measurement paths were four straight lines parallel to X direction at the bottom surface, and the distance between the four paths was approximately 25 mm, where the distance between the measurement points on each path was 5 mm. At the different stages of all the processes (the machining, vibration stress relief and natural aging) of the same sample, the measured points were approximately the same.
Surface residual stresses of samples A, B, C, D and E were measured by XRD. As shown in Figure 3, three test points on the surface marked as N1, N2 and N3 were measured using an X-ray stress analyzer (X-Stress 3000, Stresstech, Jyväskylä, Finland) with measurement error within ±10 MPa. Reference [18] shows that the influence of machining on the surface stress of components is about 0.1 mm. Thus, the test points were polished 0.1 mm by the electrolytic polishing machine [19] in order to eliminate the influence of machining stress.
2.2. Single Frame Machining
2.3. Vibration Stress Relief
The vibration stress relief experiments were carried out on thin-walled parts A, B, C and D for 10 min, 15 min, 20 min and 30 min respectively, while thin-walled part E was not vibration aged.
A numerical simulation was performed to determine the resonance frequency, and the response of the system to the applied dynamic loads was determined by the vibration characteristics. Therefore, in general, it is necessary to carry out other dynamic analyses of the system after modal analysis. Firstly, the full model of aluminum plate was established, and the material density, Young’s modulus, Poisson’s ratio and other material properties were defined. Secondly, for load and boundary conditions, the aluminum plate was constrained as it vibrated. Therefore, a total of four points on the upper and lower surfaces, that were two sets of symmetrical positions, were defined by four nodes, and the position of the nodes was similar to the length and width edges of the aluminum plate in the experimental process. Finally, modal analysis was carried out and the appropriate resonance frequency was obtained.
Going forward, the thin-walled parts assembled with vibration exciter were fixed on a long aluminum alloy plate sized 2500 mm × 220 mm × 50 mm. It was observed that resonance occurred at natural frequency. At the resonance state, the maximum vibration stress was obtained by using the lowest vibration energy, which is the most obvious effect for shape stability. Generally, the effect of vibration stress relief under low-resonance vibration frequency is not as good as that under high-resonance. The treatment effect under high vibration frequency is uniform, however. In theory, vibration at the third or higher natural frequencies can yield more uniform residual stress. There, a third order natural frequency of 40.167 Hz was selected for the vibration stress relief experiment and applied to the thin-walled parts.
The long aluminum alloy plate was supported by rubber pads at three positions corresponding to 1/4, 1/2 and 3/4 length of the plate, and the vibration excitation was fixed on one end of the plate, as show in Figure 6. Strain gauges were attached to the long aluminum plate corresponding with the locations close to 1/4, 1/2 and 3/4 lengths of the plate. A dynamic strain indicator was used to monitor the strain of the long plate during the vibration and the magnitude of the exciting force was calculated. After vibration stress relief, deformation and residual stress of the four thin-walled parts were measured.
2.4. Natural Aging
After vibration stress relief, the five thin-walled parts were treated through natural aging, and deformation of the parts was measured at 3 days, 6 days, 10 days, 15 days and 30 days after natural aging. The ambient temperature approximated 25 °C during the day, and approximately 15 °C at night. The humidity was approximately 70%.
3. Results
3.1. Deformation Evolution
In different process stages, the surface contour of the specimen change. Figure 7 shows the change of the surface contour of the samples after quenching and after machining. It can be observed that the surface contour of the sample is quite different before and after machining, and the deformation increases greatly after machining.
The deformation of the sample surfaces were determined according to the measured contour results using the enveloping surface method. A series of two parallel envelopes were used to envelop all the measuring points, and the minimum distance between the two envelopes was taken as the deformation result. The procedure for determining the enveloping surface is as follows: The normal vector of a set of parallel planes can be defined as N (a, b, c). The distance from the point (xi, yi, zi) to the plane is as follows [20]:
The distance d between the two parallel envelope planes is the overall deformation:
The deformation results of the samples corresponding to quenching, machining, vibration stress relief and natural aging respectively are shown in Figure 8, Figure 9, Figure 10 and Figure 11.
The deformation of the five samples measured after quenching were observed to be very small. However, due to the release of internal residual stress, the deformation was very large after the remaining processes. Next, the four plates A, B, C and D were treated with 10 min, 15 min, 20 min and 30 min intervals of VSR respectively, while E was not VSR treated. As shown in Figure 11, the change was not too significant, so the difference and the change rate are discussed below.
3.2. Residual Stress Evolution
Surface residual stresses on the samples under different conditions were measured, and the average results of residual stress at test points N1, N2 and N3 are shown in Figure 12. It can be observed in the results that, after machining, the high quenching residual stresses were significantly reduced as the material was removed, causing the stresses to be released. There was little change in stress before and after vibration stress relief.
4. Discussion
Research on the shape and size of thin-walled parts lays a foundation for the exploration of large aircraft components, which provides a mean for exploring vibration stress relief method to improve the shape stability of aircraft components.
To verify the effect of vibration stress relief on the shape stability of thin-walled parts, deformations of the samples at different stages are compared and analyzed.
The deformations of the samples at different stages are defined as follows. : deformation after machining, : deformation after vibration stress relief, : Deformation after natural aging days, unit: mm.
4.1. Comparison of Deformations after Vibration Stress Relief and Machining Respectively
Deformation amounts of the samples after vibration stress relief and machining were respectively compared, as shown in Figure 13. The relative deformation rate caused by vibration stress relief was calculated by the formula according to the results in Figure 9 and Figure 10.
From Figure 13a,b, we can see that the deformation of specimens decreased after a period of 10–30 min of VSR. For samples A, B, C and D, the changes of deformation before and after VSR achieved 0.011 mm, 0.031 mm, 0.033 mm and 0.041 mm respectively. As shown in Figure 13c, it can be seen that a period of 15–20 min of VSR had a better effect on reducing the deformation by comparing the change in the rate of deformation of the samples before and after VSR.
4.2. Comparison of Deformations after Natural Aging and Vibration Stress Relief Respectively
Deformation amounts of the samples after natural aging and vibration stress relief respectively are compared, as shown in Figure 14.
is defined as the difference between the deformation of the samples after natural aging n days and after vibration stress relief, which can be expressed as , unit: mm. is defined as the relative difference between the deformation of the samples after natural aging n days and after vibration stress relief, which can be expressed as , unit: ‰. As sample E was not vibration aged, in the calculation formula was replaced by .
It can be seen in Figure 14, the shape stability of the thin-walled parts was significantly improved after vibration stress relief. We can see that with the increase of natural aging time, the deformation difference of the specimen was also increased, so the deformation of the pattern was likewise increased. The E-line (i.e., non-vibration stress relief) is the highest, which indicates that the deformation difference of the specimen is the largest, while the other four lines had a tendency of implicit mitigation, thus reflecting the promotion effect of vibration stress relief. B and C lines are at the bottom, and the changes are also the smallest. It also reflects that VSR exhibits the best effect in the period of 15 min to 20 min.
For thin-walled part A, i.e., vibration stress relief of 10 min, the relative deformation after 30 days of natural aging was 22.78‰. For thin-walled parts B, C and D, the relative deformation after 30 days of natural aging was only 5‰. Thin-walled part E was not vibration aged; the relative deformation reached 28.14‰ after 30 days of natural aging, further proving the above conclusions.
4.3. Comparison of Deformations after Natural Aging and Machining Respectively
Deformation amounts of the samples after natural aging and after machining were compared, as shown in Figure 15.
is defined as the difference between the deformation of the samples after natural aging n days and after machining, respectively. It is expressed as: , unit: mm. ηn is defined as the relative difference between the deformation of the samples after natural aging n days and after machining, and it is expressed as , unit: %.
In Figure 15, as a whole, with the increase in natural aging time, the deformation difference of the parts increased gradually, but the changes of deformation became smaller. The change of deformation of samples B and C were small over different days of natural aging especially for 15 days and 30 days, which also shows that a period of 15 to 20 min of vibration stress relief has a better effect on the sample. It can be concluded that vibration stress relief accelerated the deformation of the thin-walled parts to a certain extent, especially after 15 min to 20 min of vibration stress relief, which has the greatest impact on the sample and results in a more stable shape.
4.4. Effect of Stress Evolution on Shape Stability
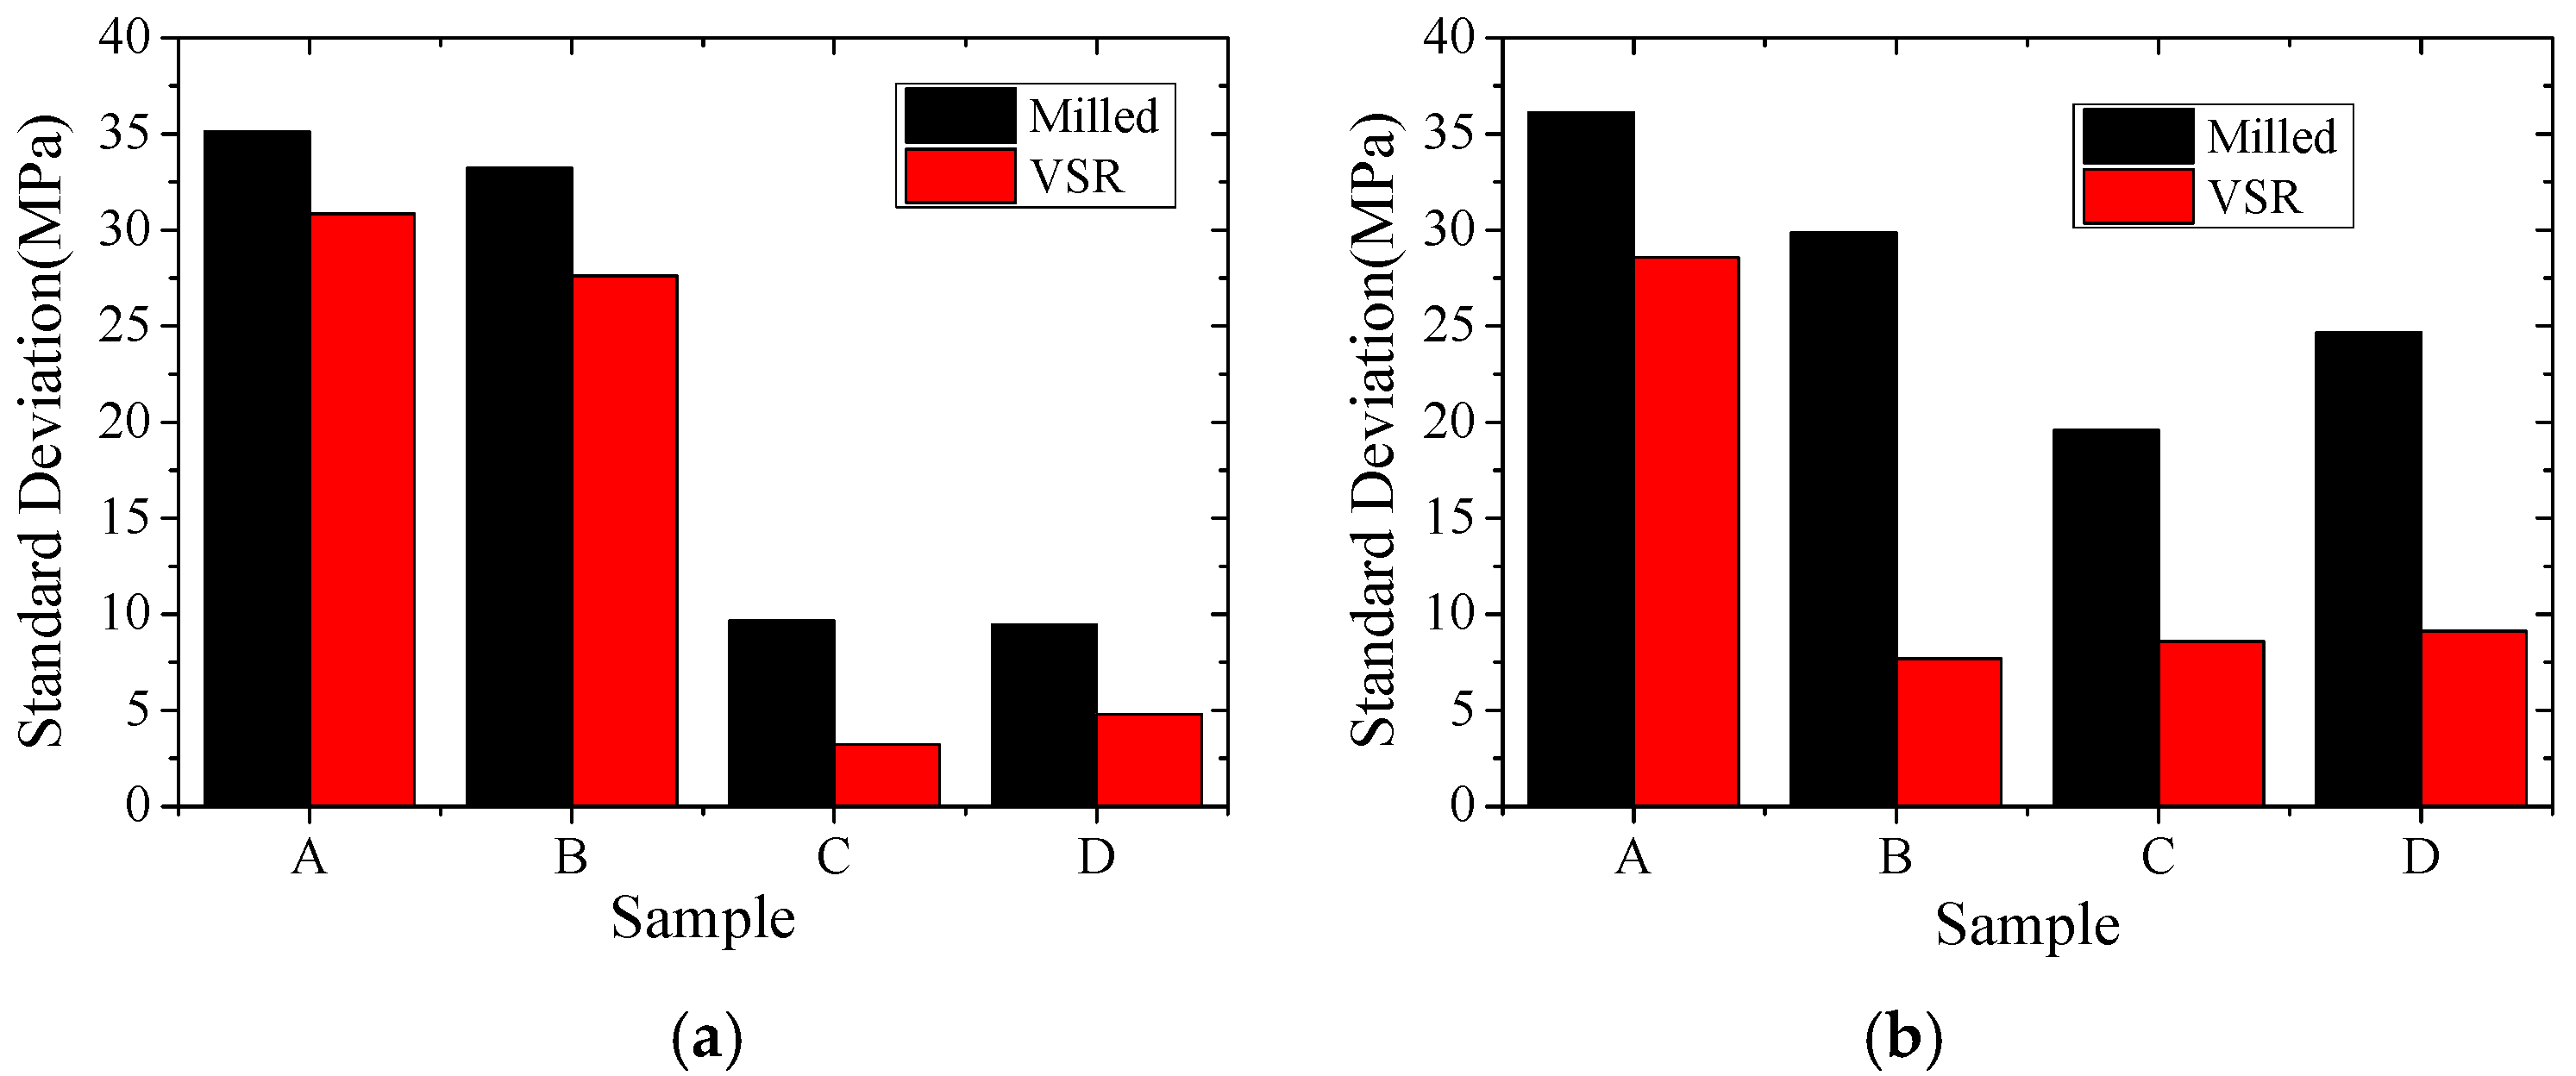
Although there was a slight change in the surface residual stresses after vibration stress relief treatment, both X stress and Y stress have different degrees of decrease after vibration stress relief as shown in Figure 16. With the extension of vibration time, the distribution of surface residual stresses after vibration stress relief tends to be more uniform. The results show that vibration stress relief treatment is beneficial to the reduction and homogenization of residual stresses in thin-walled parts.
From the microscopic point of view, the plastic deformation refers to the slip of the dislocation on the slip planes. Ideally, there will be no residual stress to be generated if such slippage can be accomplished on the slip surface. However, the internal structure of metal is complex with various defects, grain boundaries and many dislocation interactions. As the slip cannot be completed totally, the lattice distortion will be generated. Under the action of alternating stress produced by VSR, dislocations will continue to occur, resulting in the accumulation and start-up of dislocations. On the one hand, local stress concentration is released to reduce the residual stress of the parts, just as shown in Figure 16. On the other hand, dislocation movement is hindered. The result reflected is that the exciting force and residual stress is balanced in the stress concentration area, so then the overall residual stress is reduced and the structure is stabilized.
5. Conclusions
The vibration stress relieving treatment followed by the subsequent natural aging process has a significant influence on decreasing the residual stress induced deformation in Al 7075 thin-walled components. According to the results obtained, vibration stress relief accelerates the redistribution of residual stresses which changed the deformation behavior of the components, thus effectively relieving the residual stresses and improving shape stability. Additionally, in this experiment, 10-minute and 30-minute vibrations had almost the same effect, while 15–20-min vibration was significantly more effective in relieving the stresses. Therefore, within a certain range, the longer the vibration stress relief period, the more significant the vibration effect is obtained, and the better the shape stability of the parts. Finally, the residual stress distribution of the workpiece after VSR tends to be uniform, which indicates that VSR is beneficial to the homogenization of the residual stress of thin-walled workpieces.
Author Contributions
Conceptualization: H.G., Y.S., Y.L., Y.W.; Validation: H.G., Y.S., Y.L., Y.W., Y.H., X.S., M.Z.; Formal analysis: H.G., Y.S., X.S., M.Z.; Investigation: H.G., Y.S., Y.L., Y.H., X.S., M.Z.; Writing-Review and Editing: H.G., Y.S., Y.H. Supervision: Y.W.
Funding
This research was funded by the National Natural Science Foundation of China (Grant Number 51405520 and 51327902).
Conflicts of Interest
The authors declare no conflict of interest.
References
- Martín, M.J.; Cano, M.J.; Castillo, G.; Herrera, M.J.; Martín, F. Influence of Milling Parameters on Mechanical Properties of AA7075 Aluminum under Corrosion Conditions. Materials 2018, 11, 1751. [Google Scholar] [CrossRef] [PubMed]
- Rodriguez-Alabanda, O.; Bonilla, M.T.; Guerrero-Vaca, G.; Romero, P.E. Selection of Parameters and Strategies to Reduce Energy Consumption and Improve Surface Quality in EN-AW 7075 Molds Machining. Metals 2018, 8, 688. [Google Scholar] [CrossRef]
- Dong, H.Y. Machining Process Simulation of Aerospace Monolithic Component. Ph.D. Thesis, Zhejiang University, Zhejiang, China, 2004. [Google Scholar]
- Dong, H.Y.; Ke, Y.L.; Wu, Q.; Xu, D. Finite element model for optimal clamping scheme of frame shape workpiece based on residual stress distribution. Acta Aeronaut. Astronaut. Sin. 2003, 24, 382–384. [Google Scholar]
- Denkena, B.; Schmidt, C.; Krüger, M. Experimental investigation and modeling of thermal and mechanical influences on shape deviations in machining structural parts. Int. J. Mach. Tools Manuf. 2010, 50, 1015–1021. [Google Scholar] [CrossRef]
- Shirase, K.; Altinta, Y. Cutting force and dimensional surface error generation in peripheral milling with variable pitch helical end mills. Int. J. Mach. Tools Manuf. 1996, 36, 567–584. [Google Scholar] [CrossRef]
- Necmettin, K. Machining fixture locating and clamping position optimization using genetic algorithms. Comput. Ind. 2006, 57, 112–120. [Google Scholar]
- Sebastian, N.; Barna, A.S. On the estimation of residual stresses by the crack compliance method. Comput. Methods Appl. Mech. Eng. 2007, 196, 3577–3584. [Google Scholar]
- Tsai, M.P.; Tsai, N.C.; Yeh, C.W. On milling of thin-wall conical and tubular workpieces. Mech. Syst. Signal Process. 2016, 72–73, 395–408. [Google Scholar] [CrossRef]
- Gao, H.J.; Zhang, Y.D.; Wu, Q.; Song, J.; Wen, K. Fatigue life of 7075-T651 aluminium alloy treated with vibratory stress Relief. Int. J. Fatigue 2018, 108, 62–67. [Google Scholar] [CrossRef]
- Wang, J.S.; Hsieh, C.C.; Lin, C.M.; Chen, E.C.; Kuo, C.W.; Wu, W. The effect of residual stress relaxation by the vibratory stress relief technique on the textures of grains in AA 6061 aluminum alloy. Mater. Sci. Eng. A 2014, 605, 98–107. [Google Scholar] [CrossRef]
- Rao, D.L.; Chen, L.G.; Ni, C.Z.; Zhu, Z.Q. The mechanism for vibratory stress relief of stainless steel. Trans. China Weld. Inst. 2005, 26, 58–60. [Google Scholar]
- Mayer, H.; Ede, C.; Allison, J.E. Influence of cyclic loads below endurance limit or threshold stress intensity on fatigue damage in cast aluminium alloy 319-T7. Int. J. Fatigue 2005, 27, 129–141. [Google Scholar] [CrossRef]
- Wang, J.S.; Hsieh, C.C.; Lai, H.H.; Kuo, C.W.; Wu, T.Y.; Wu, W. The relationships between residual stress relaxation and texture development in AZ31 Mg alloys via the vibratory stress relief technique. Mater. Charact. 2015, 99, 248–253. [Google Scholar] [CrossRef]
- Saurav, M.; Arivarasub, M.; Arivazhagana, N.; Phani Prabhakarc, K.V. The residual stress distribution of CO2 laser beam welded AISI 316 austenitic stainless steel and the effect of vibratory stress relief. Mater. Sci. Eng. A 2017, 703, 227–235. [Google Scholar]
- Rao, D.; Wang, D.; Chen, L.; Ni, C. The effectiveness evaluation of 314L stainless steel vibratory stress relief by dynamic stress. Int. J. Fatigue 2007, 29, 192–196. [Google Scholar] [CrossRef]
- Guo, J.K. Study on Micro Yield Mechanism of Aluminum Alloy Thick Plate Subjected to Vibratory Stress Relief and Experimental Study. Master’s Thesis, Central South University, Changsha, China, 2010. [Google Scholar]
- Huang, X.M. Deformation Mechanism and Prediction of Aluminum Alloy Monolitfic Component in the Milling. Ph.D. Thesis, Shandong University, Shandong, China, 2015. [Google Scholar]
- Aldazabal, J.; Martín-Meizoso, A.; Klimpel, A.; Bannister, A.; Cicero, S. Mechanical and Microstructural Features of Plasma Cut Edges in a 15 mm Thick S460M Steel Plate. Metals 2018, 8, 447. [Google Scholar] [CrossRef]
- Liu, G.Z. Calculating the distance from point to plane in solid geometry by formula method. Sci. Technol. Consult. Her. 2007, 21, 125–126. [Google Scholar] [CrossRef]
Figure 1.
Quenching experiment.
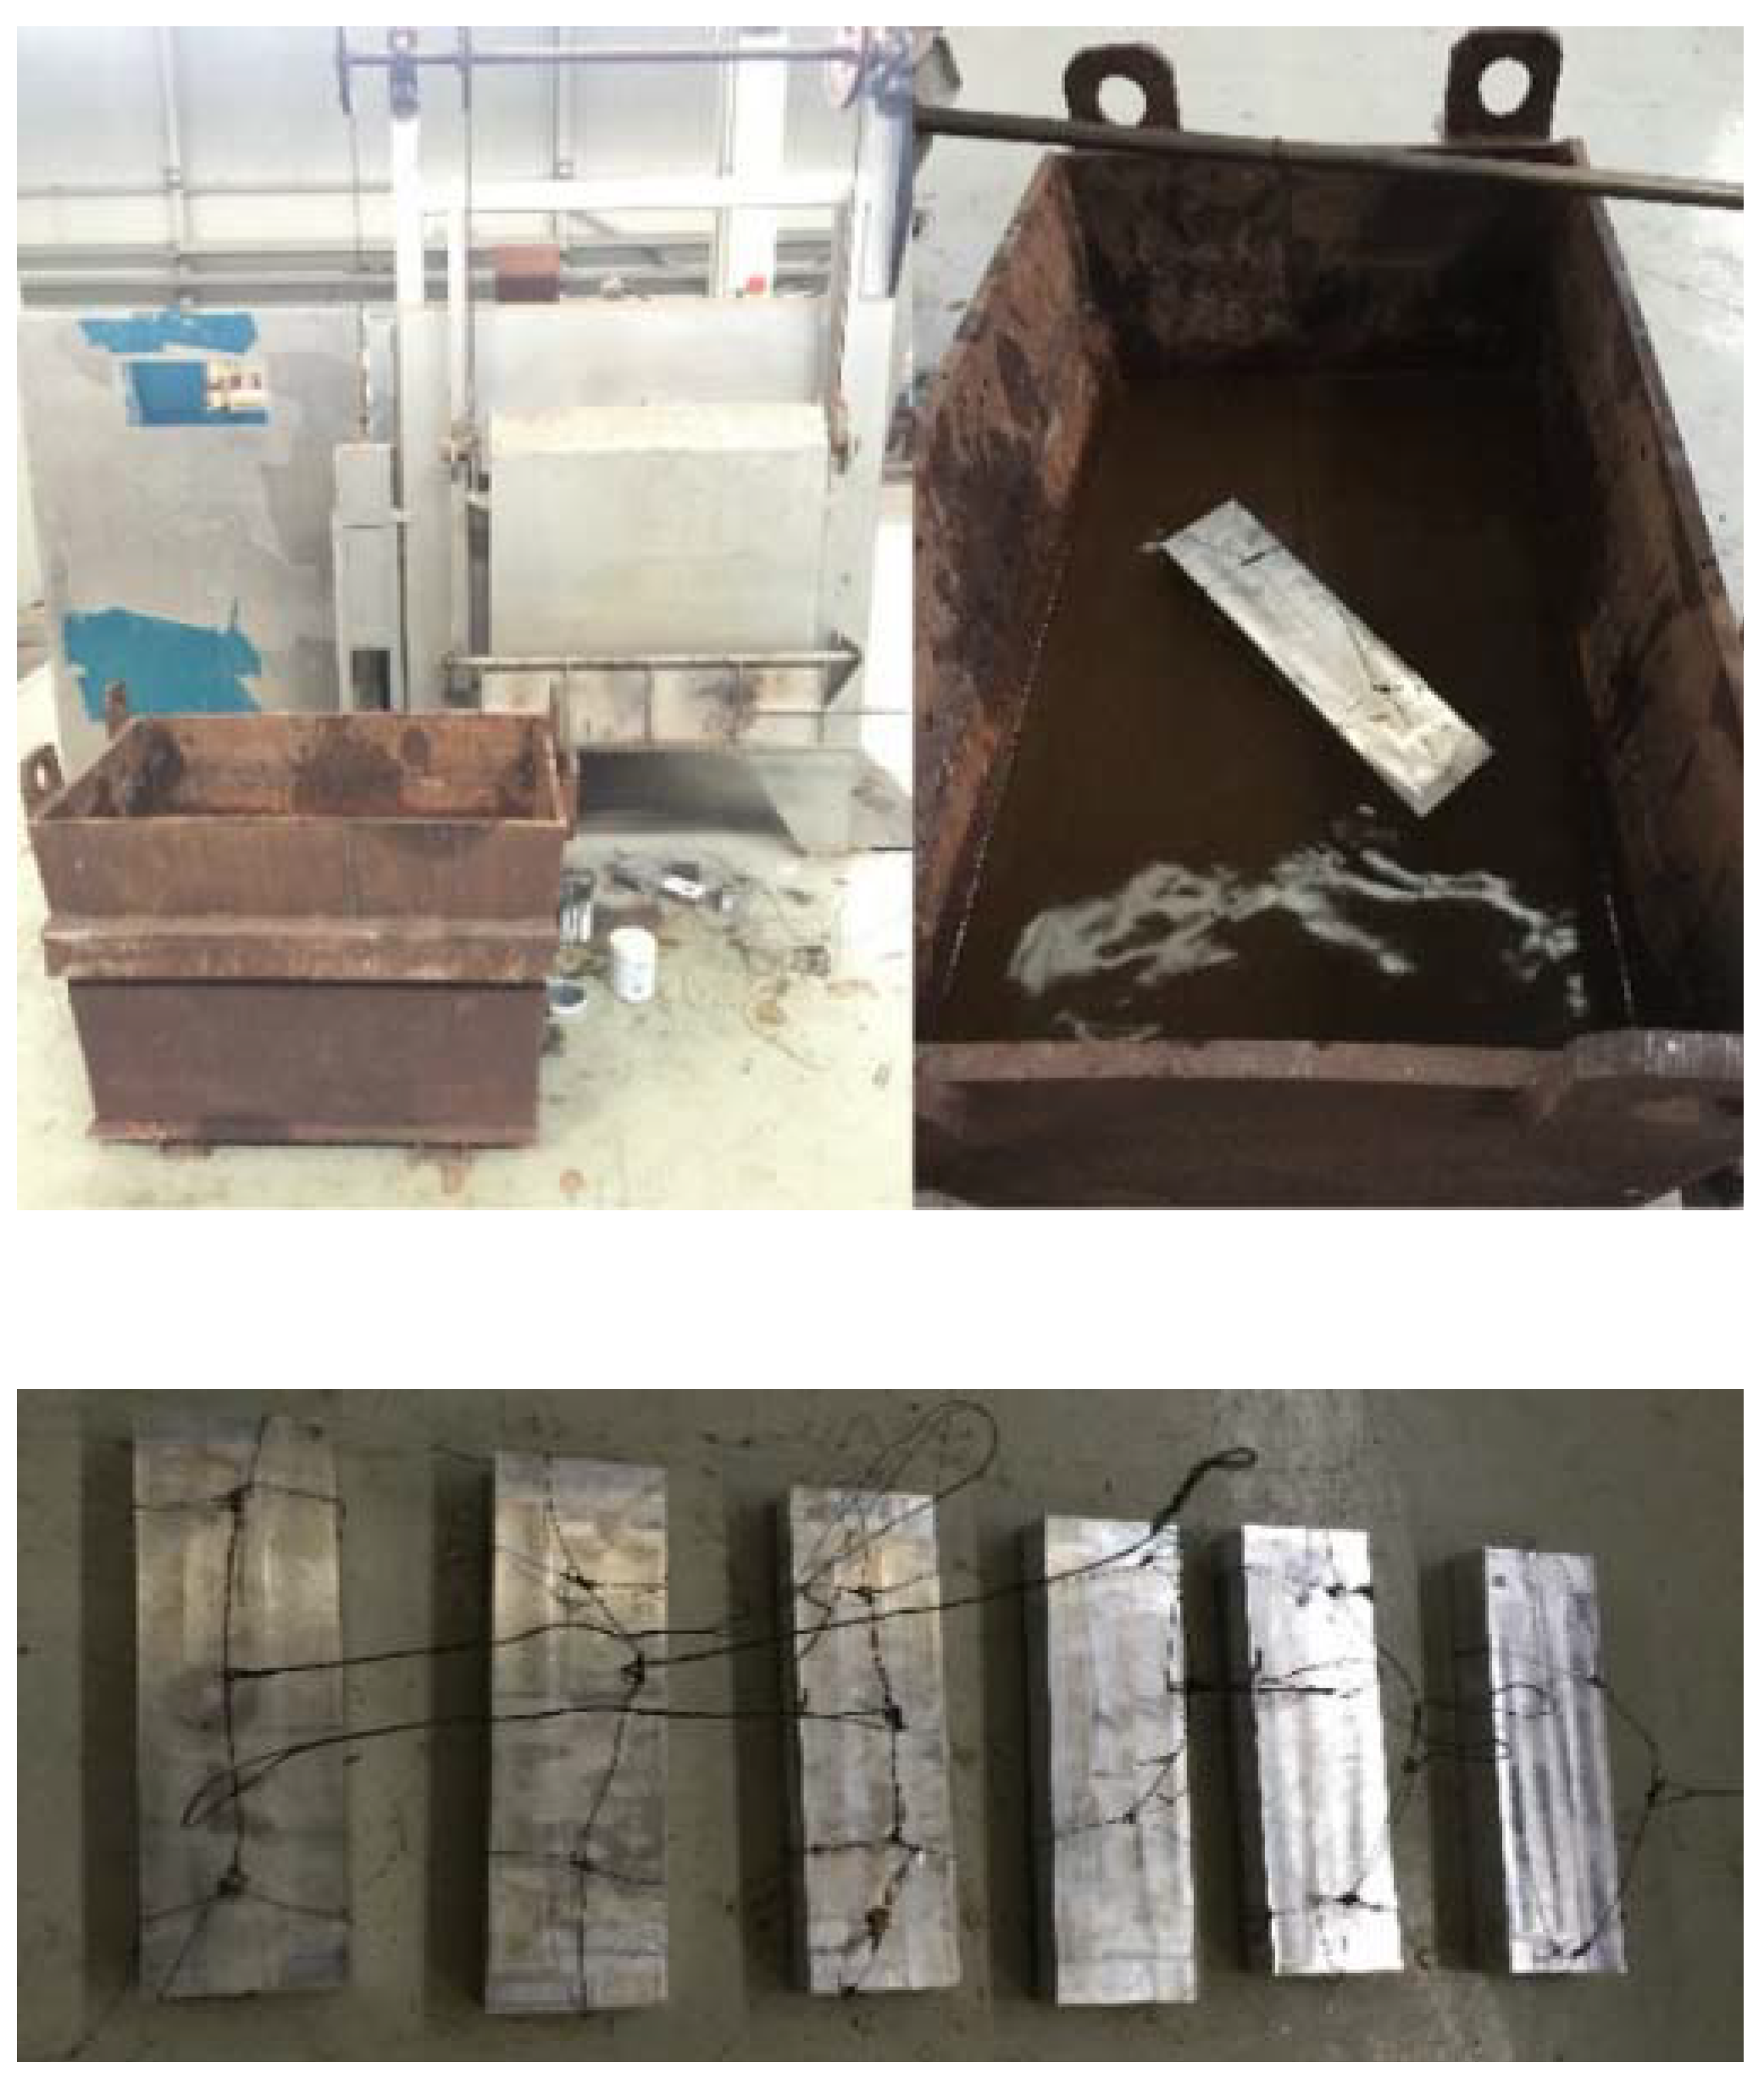
Figure 2.
The sample surface indicating the coordinate system.
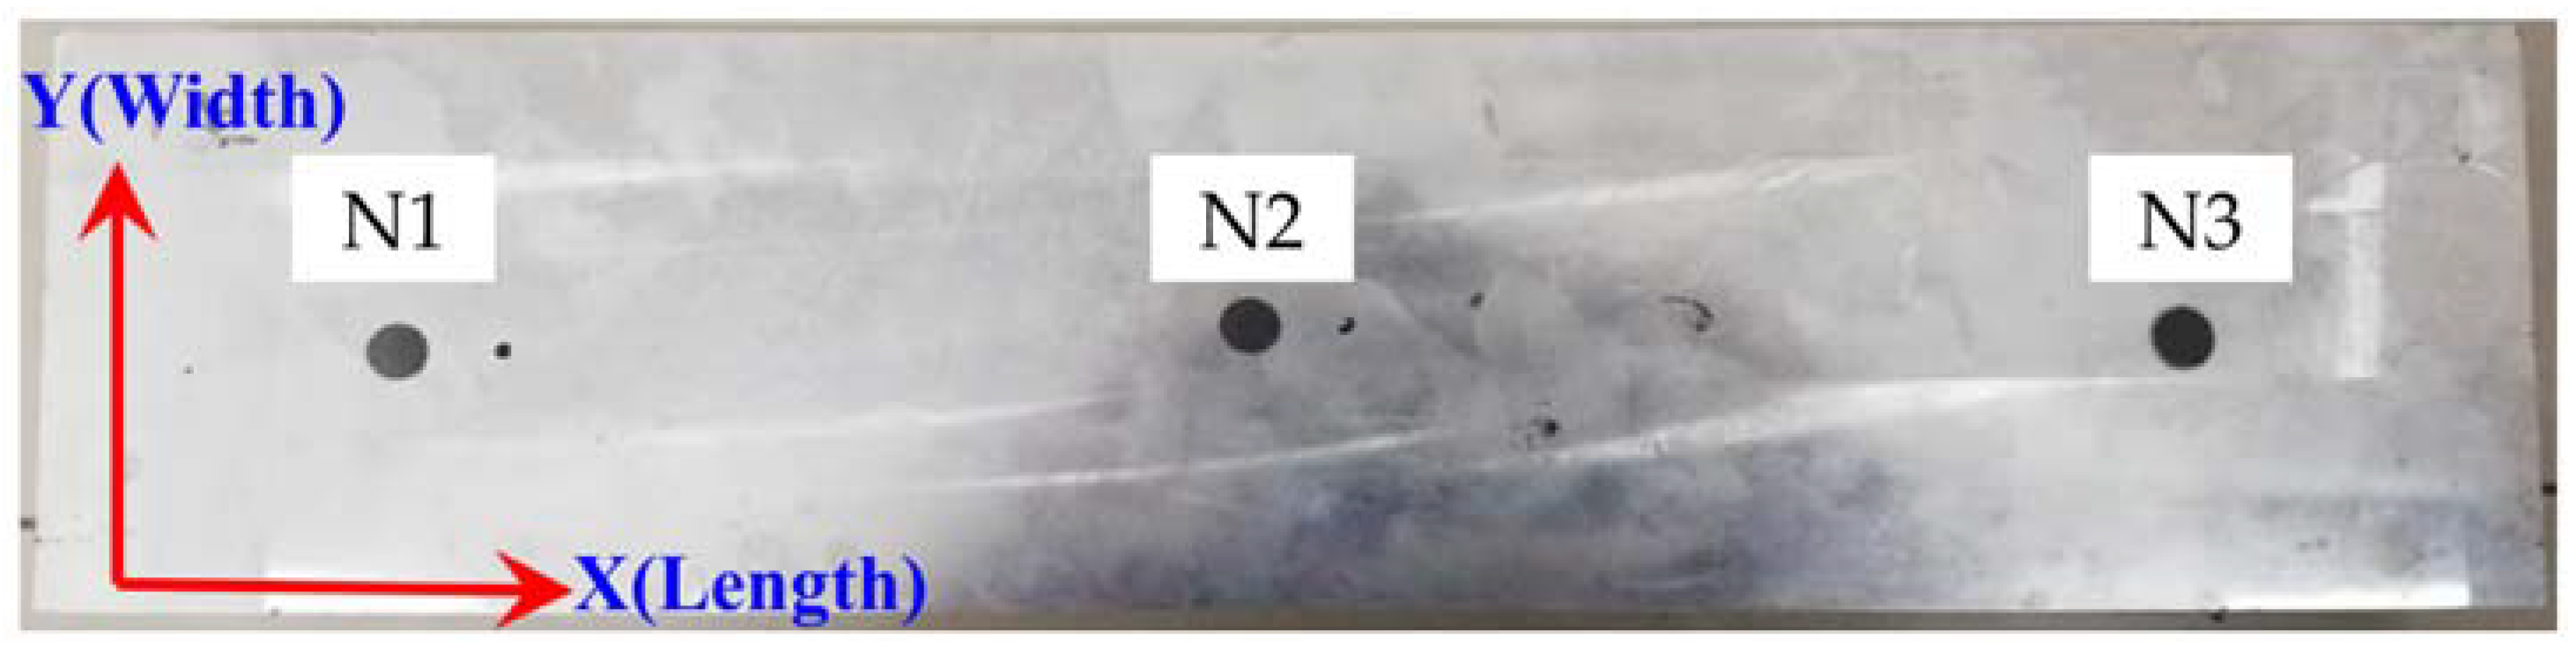
Figure 3.
Surface residual stress measurement.
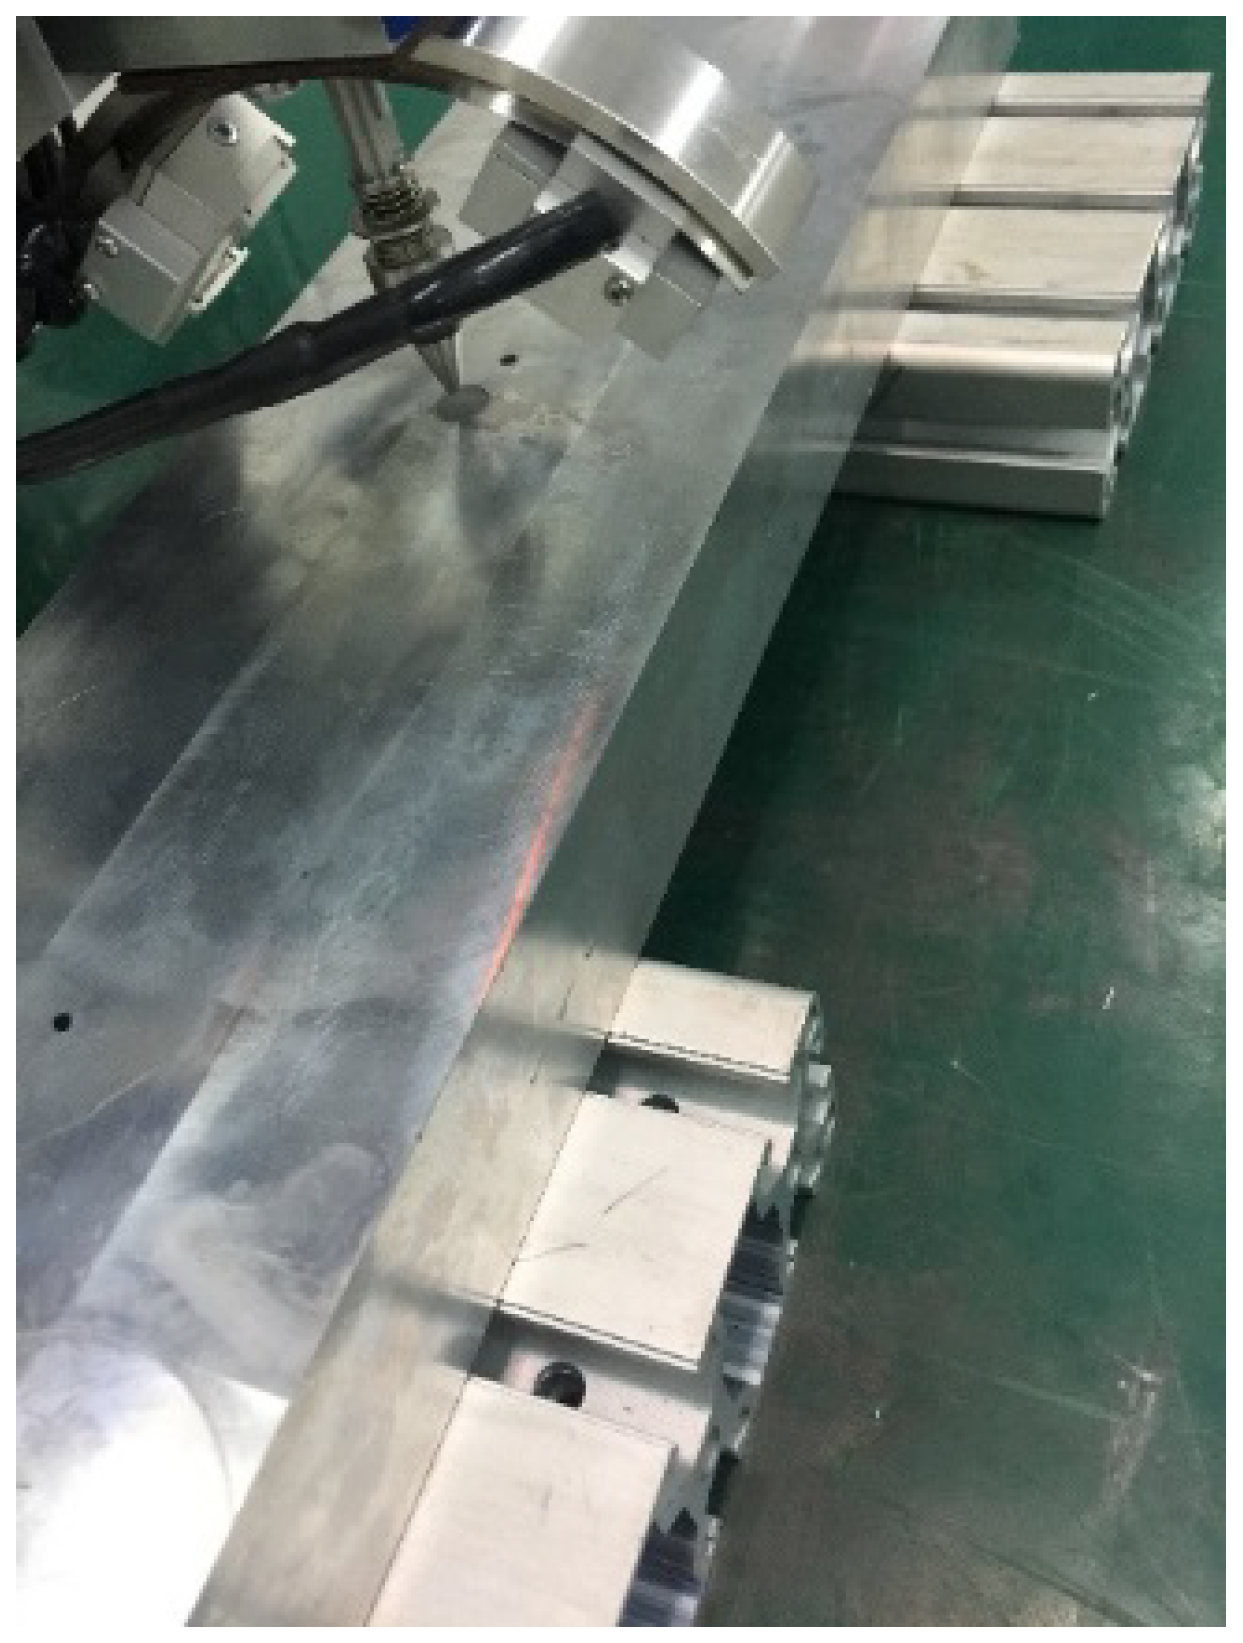
Figure 4.
Machined thin-walled part.
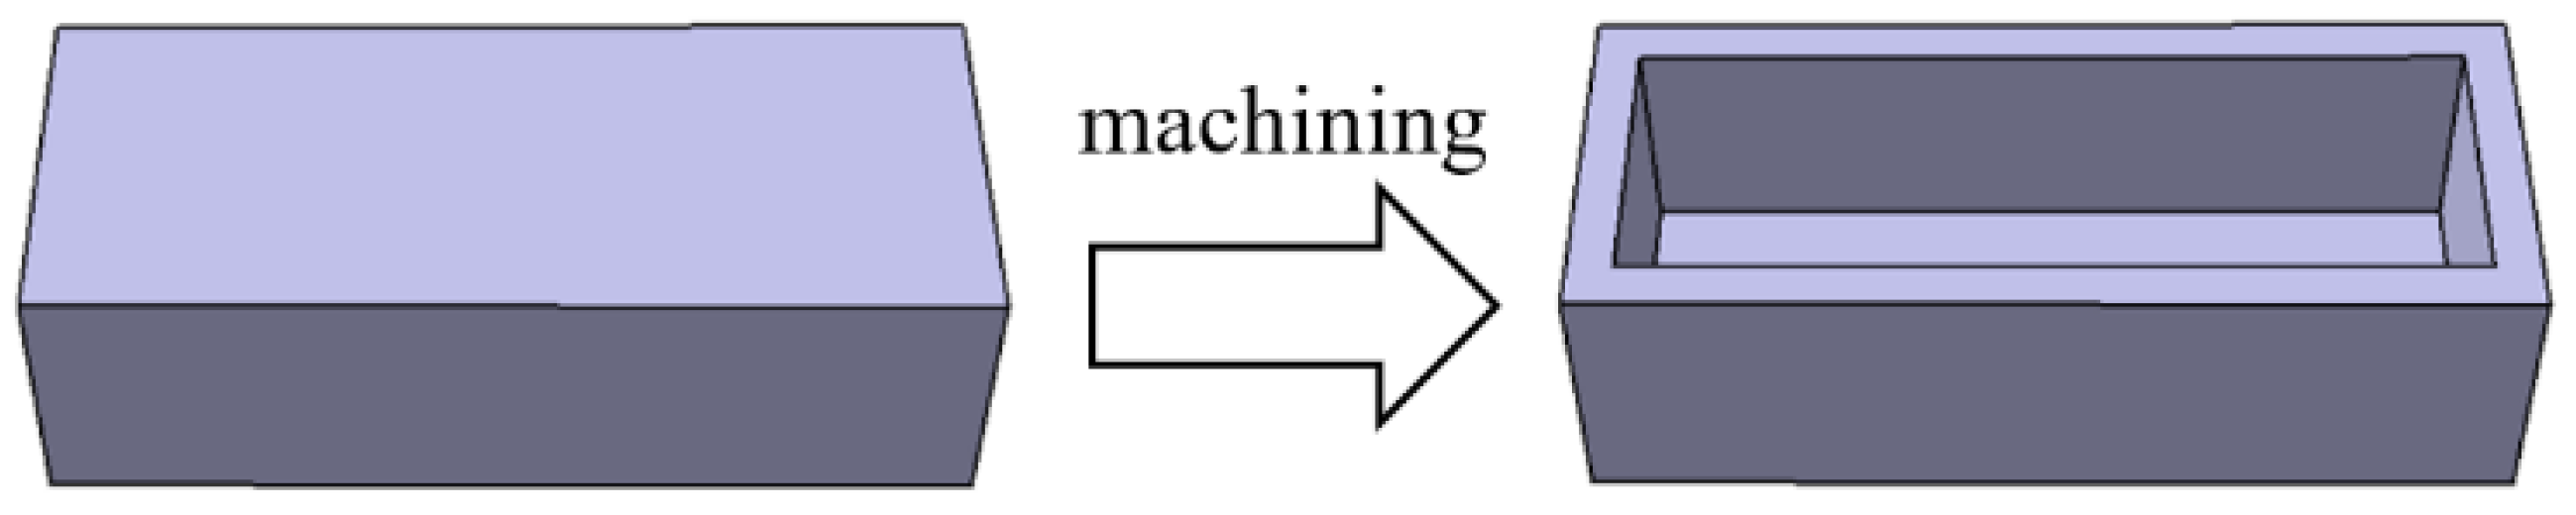
Figure 5.
Deformation measurement of thin-walled part.
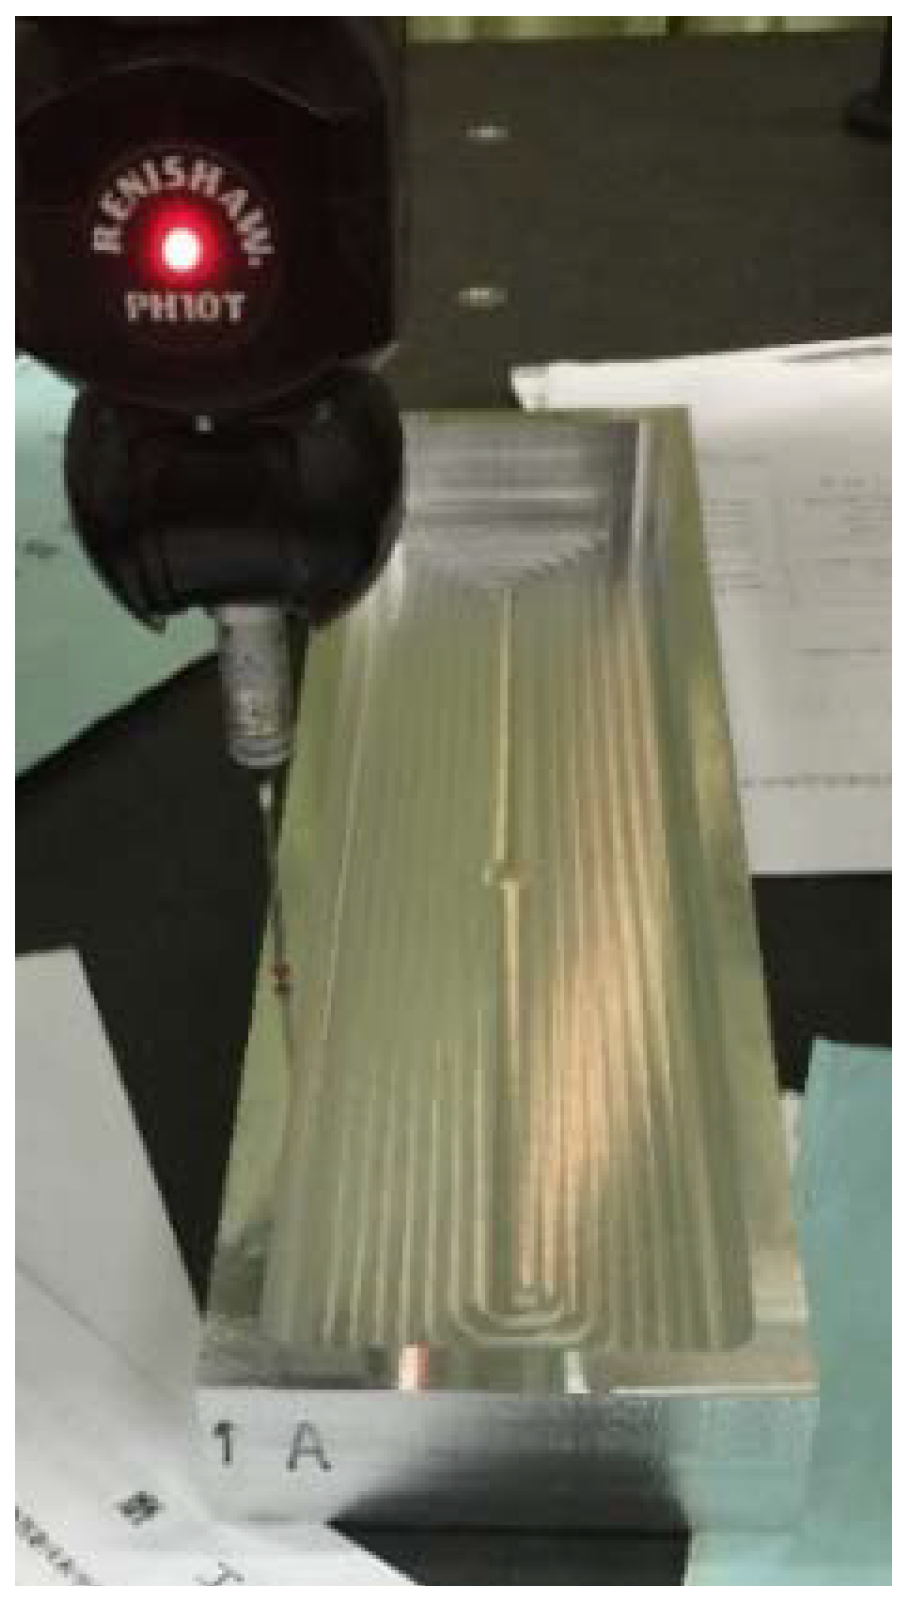
Figure 6.
Vibration stress relief experiment.
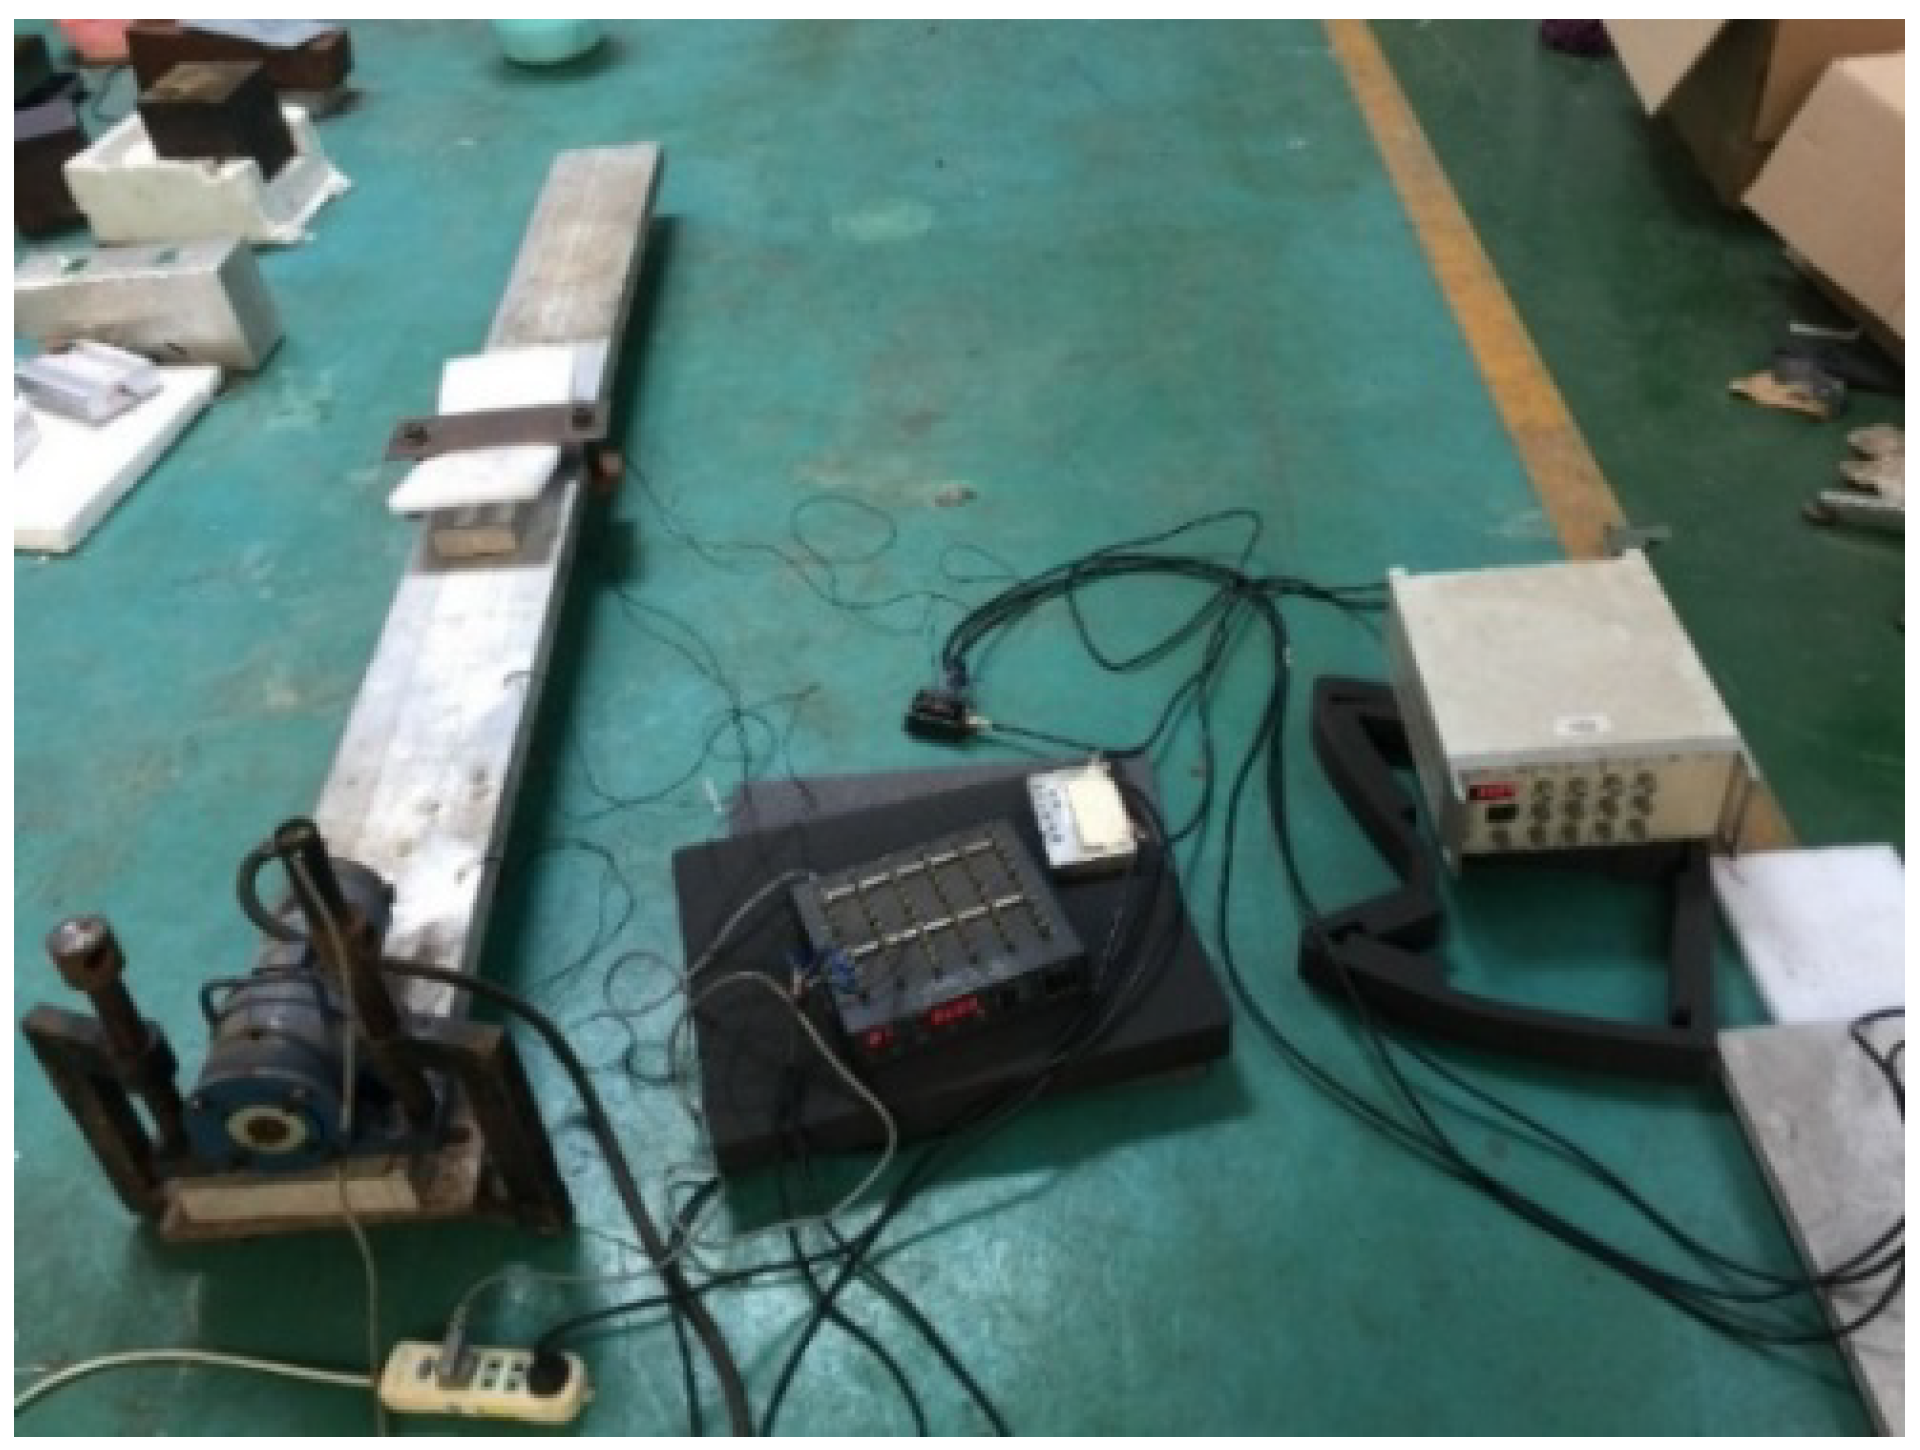
Figure 7.
Surface contour maps of the sample surface. (a) After quenching; (b) After machining.

Figure 8.
Deformation after quenching.

Figure 9.
Deformation after machining.
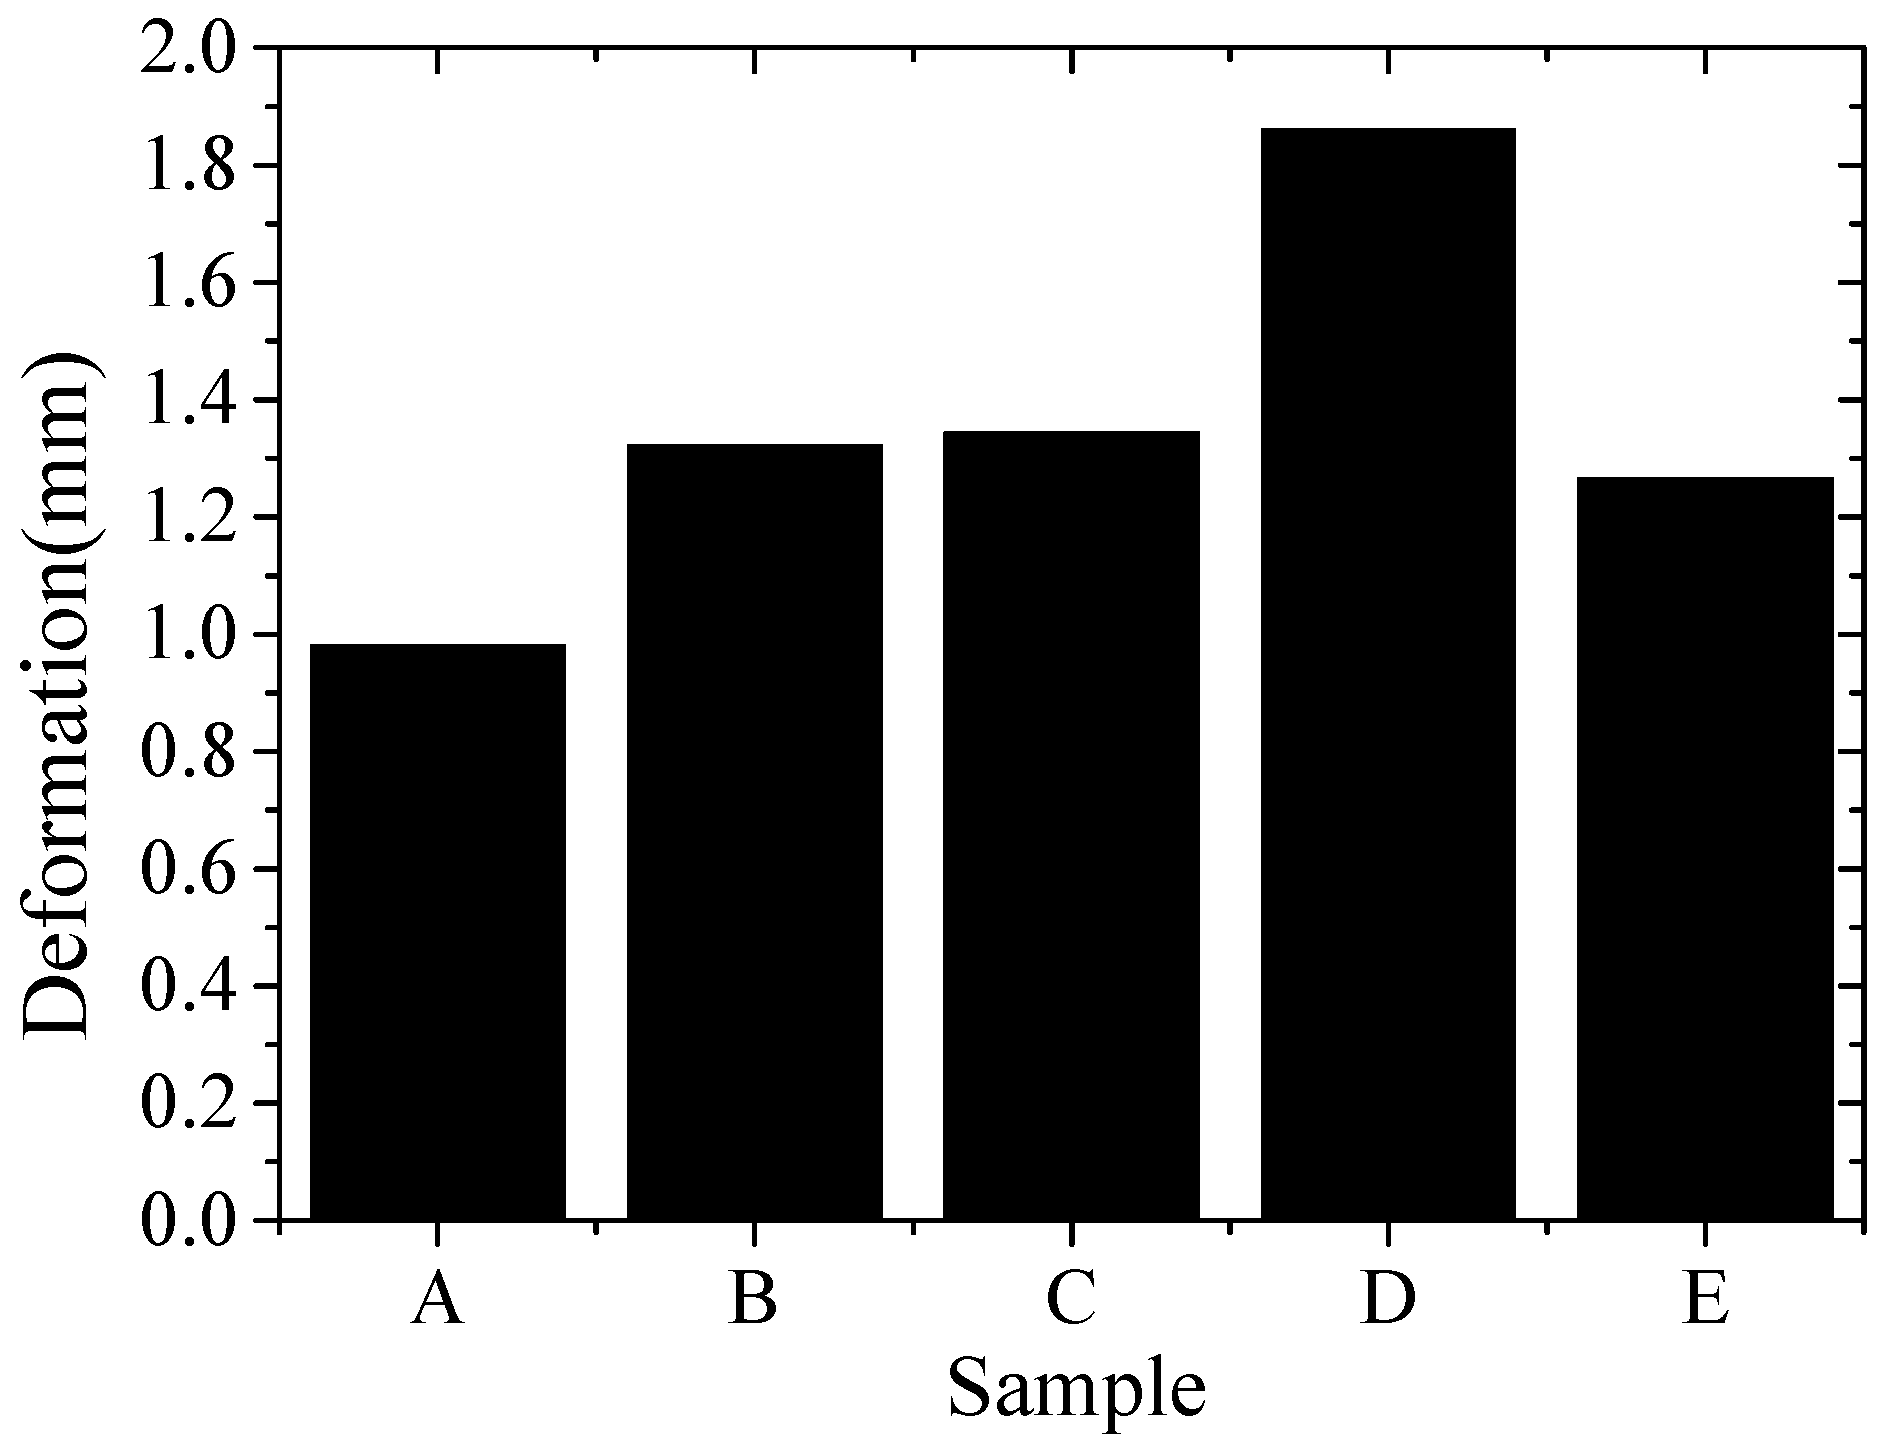
Figure 10.
Deformation after VSR.
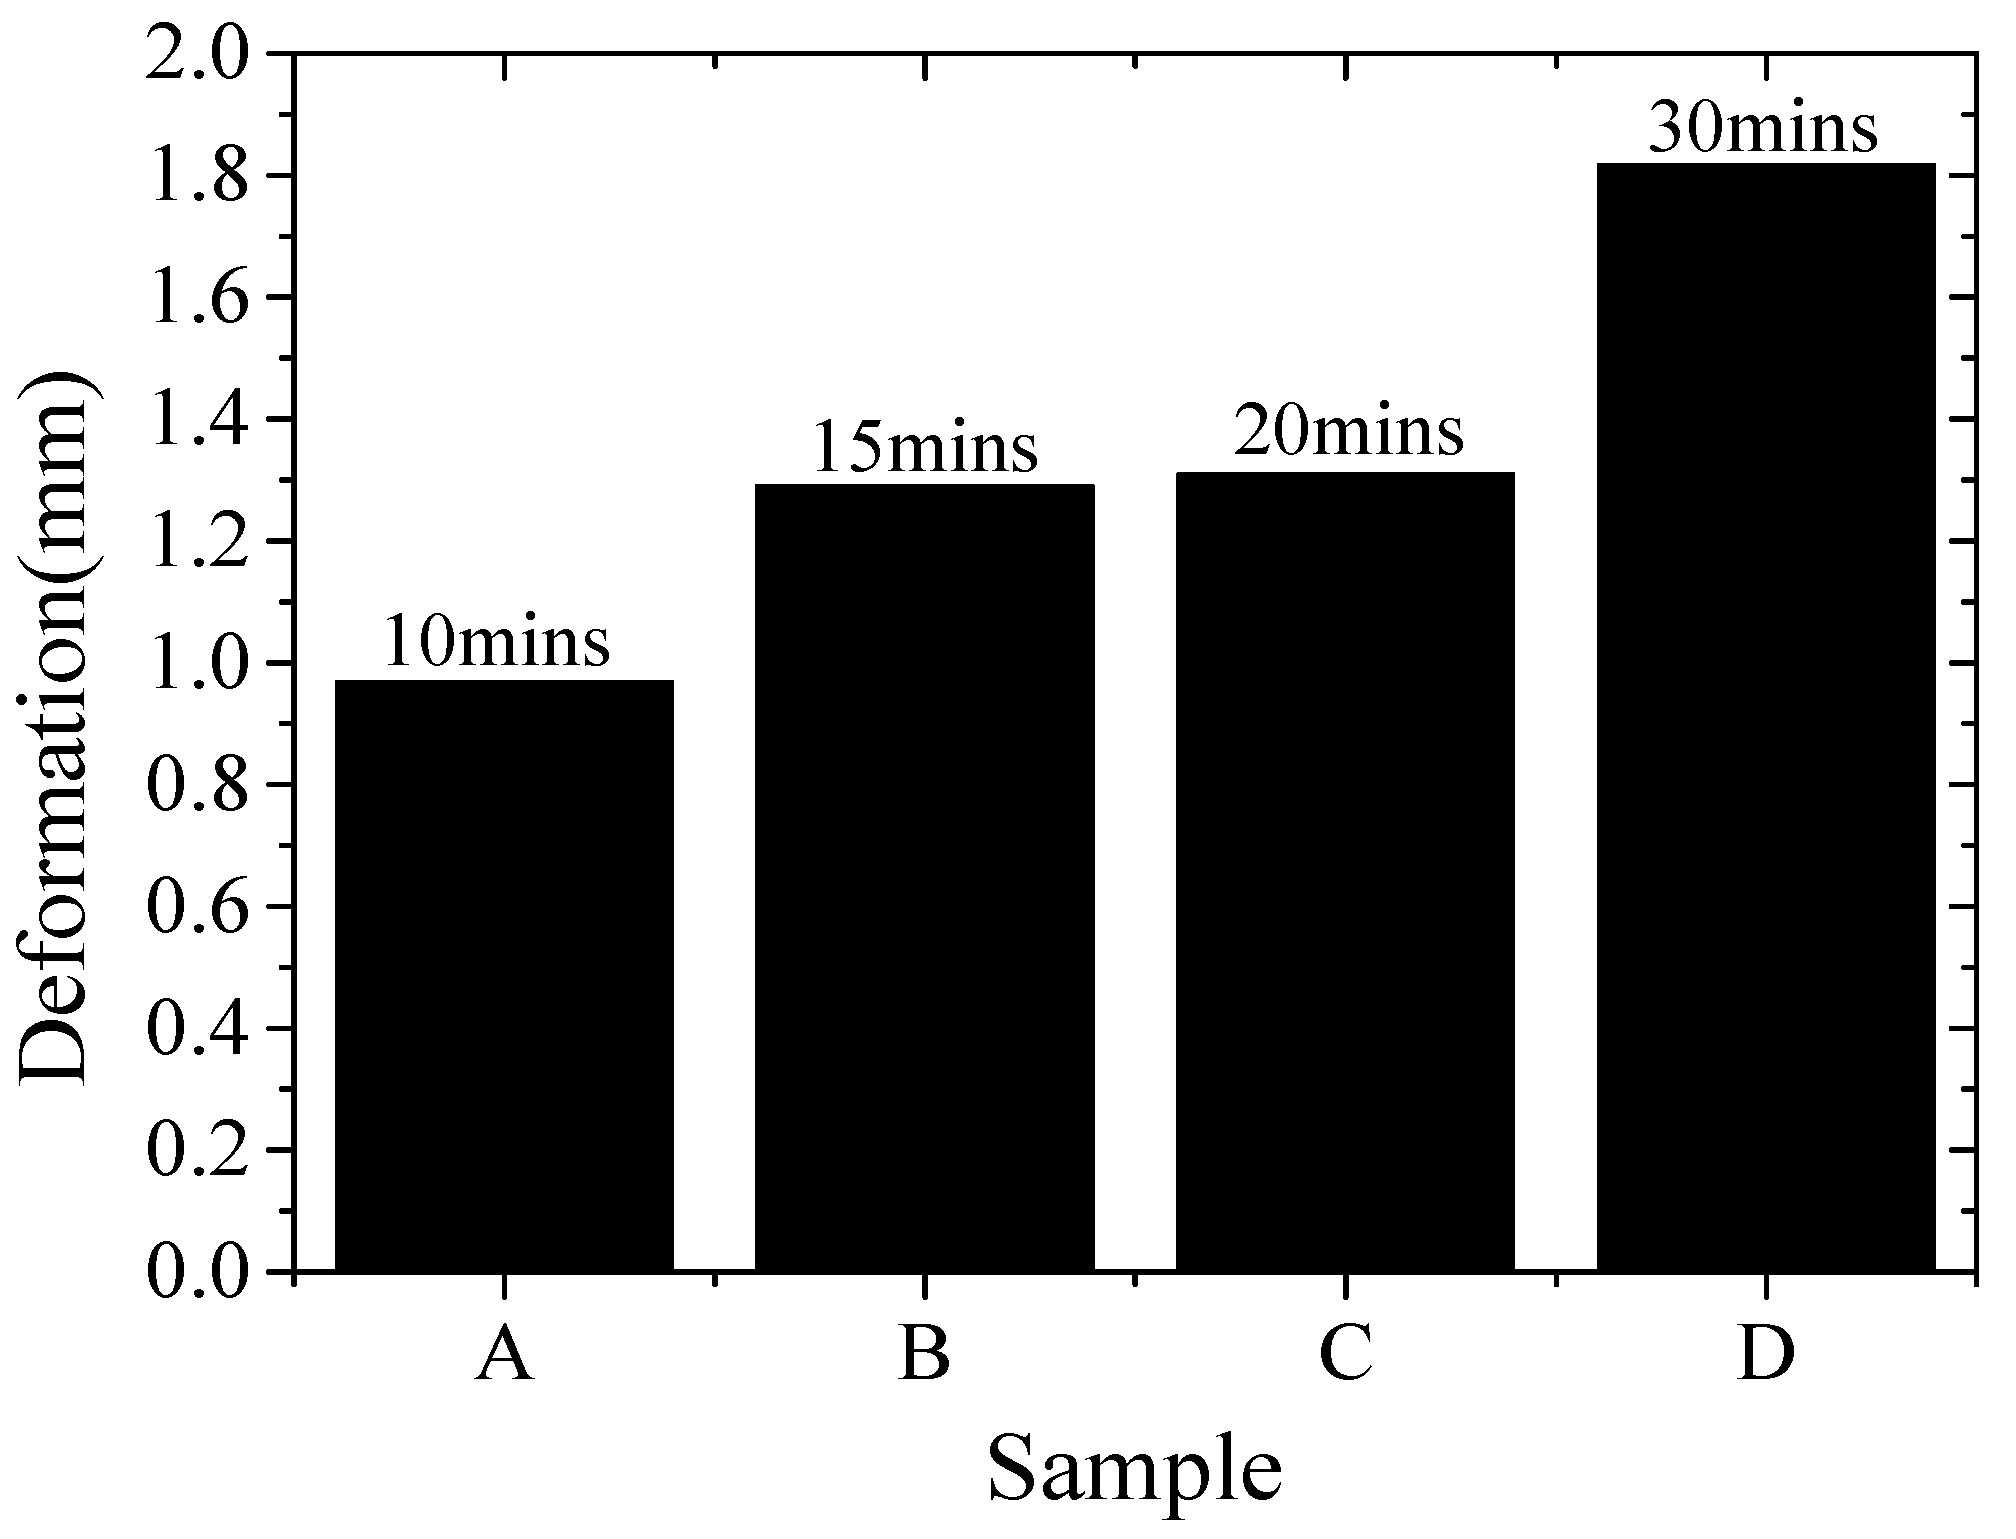
Figure 11.
Deformation of A–E after natural aging.

Figure 12.
Surface residual stress evolution of sample (a) A, (b) B, (c) C and (d) D.
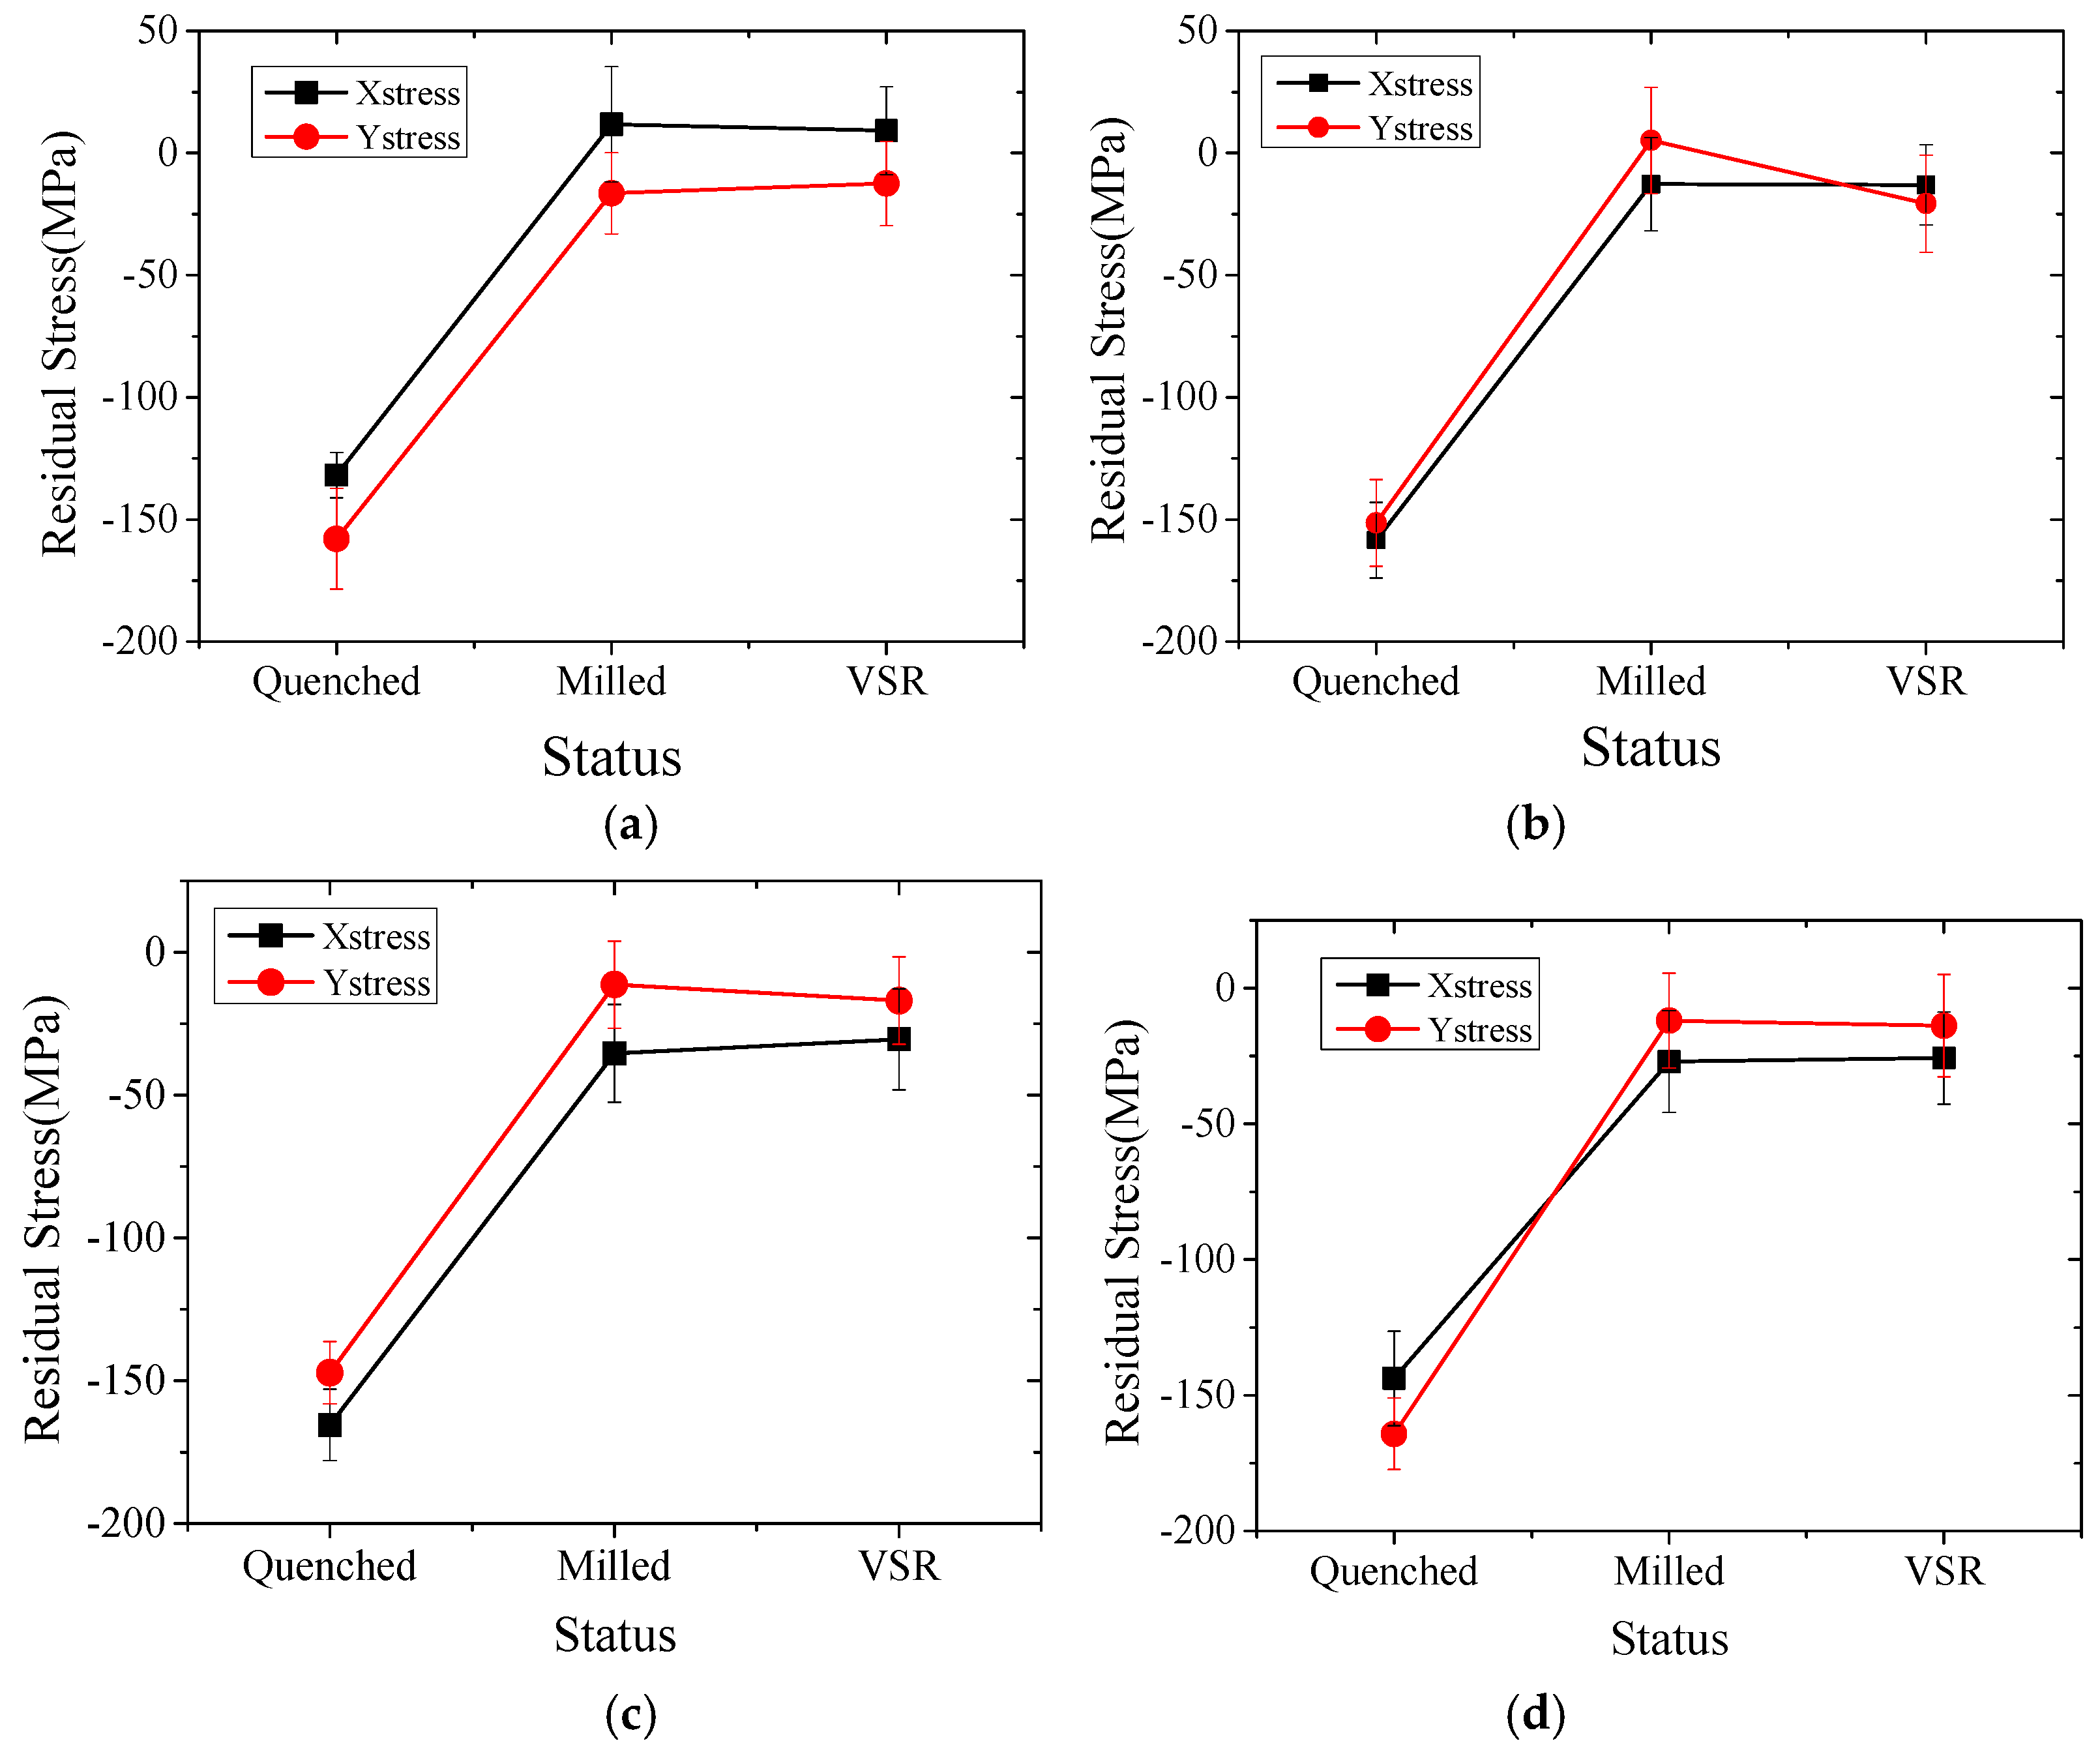
Figure 13.
Deformation comparison after vibration stress relief and machining. (a) Deformation; (b) change of deformation induced by VSR; (c) change in the rate of deformation.
Figure 13.
Deformation comparison after vibration stress relief and machining. (a) Deformation; (b) change of deformation induced by VSR; (c) change in the rate of deformation.
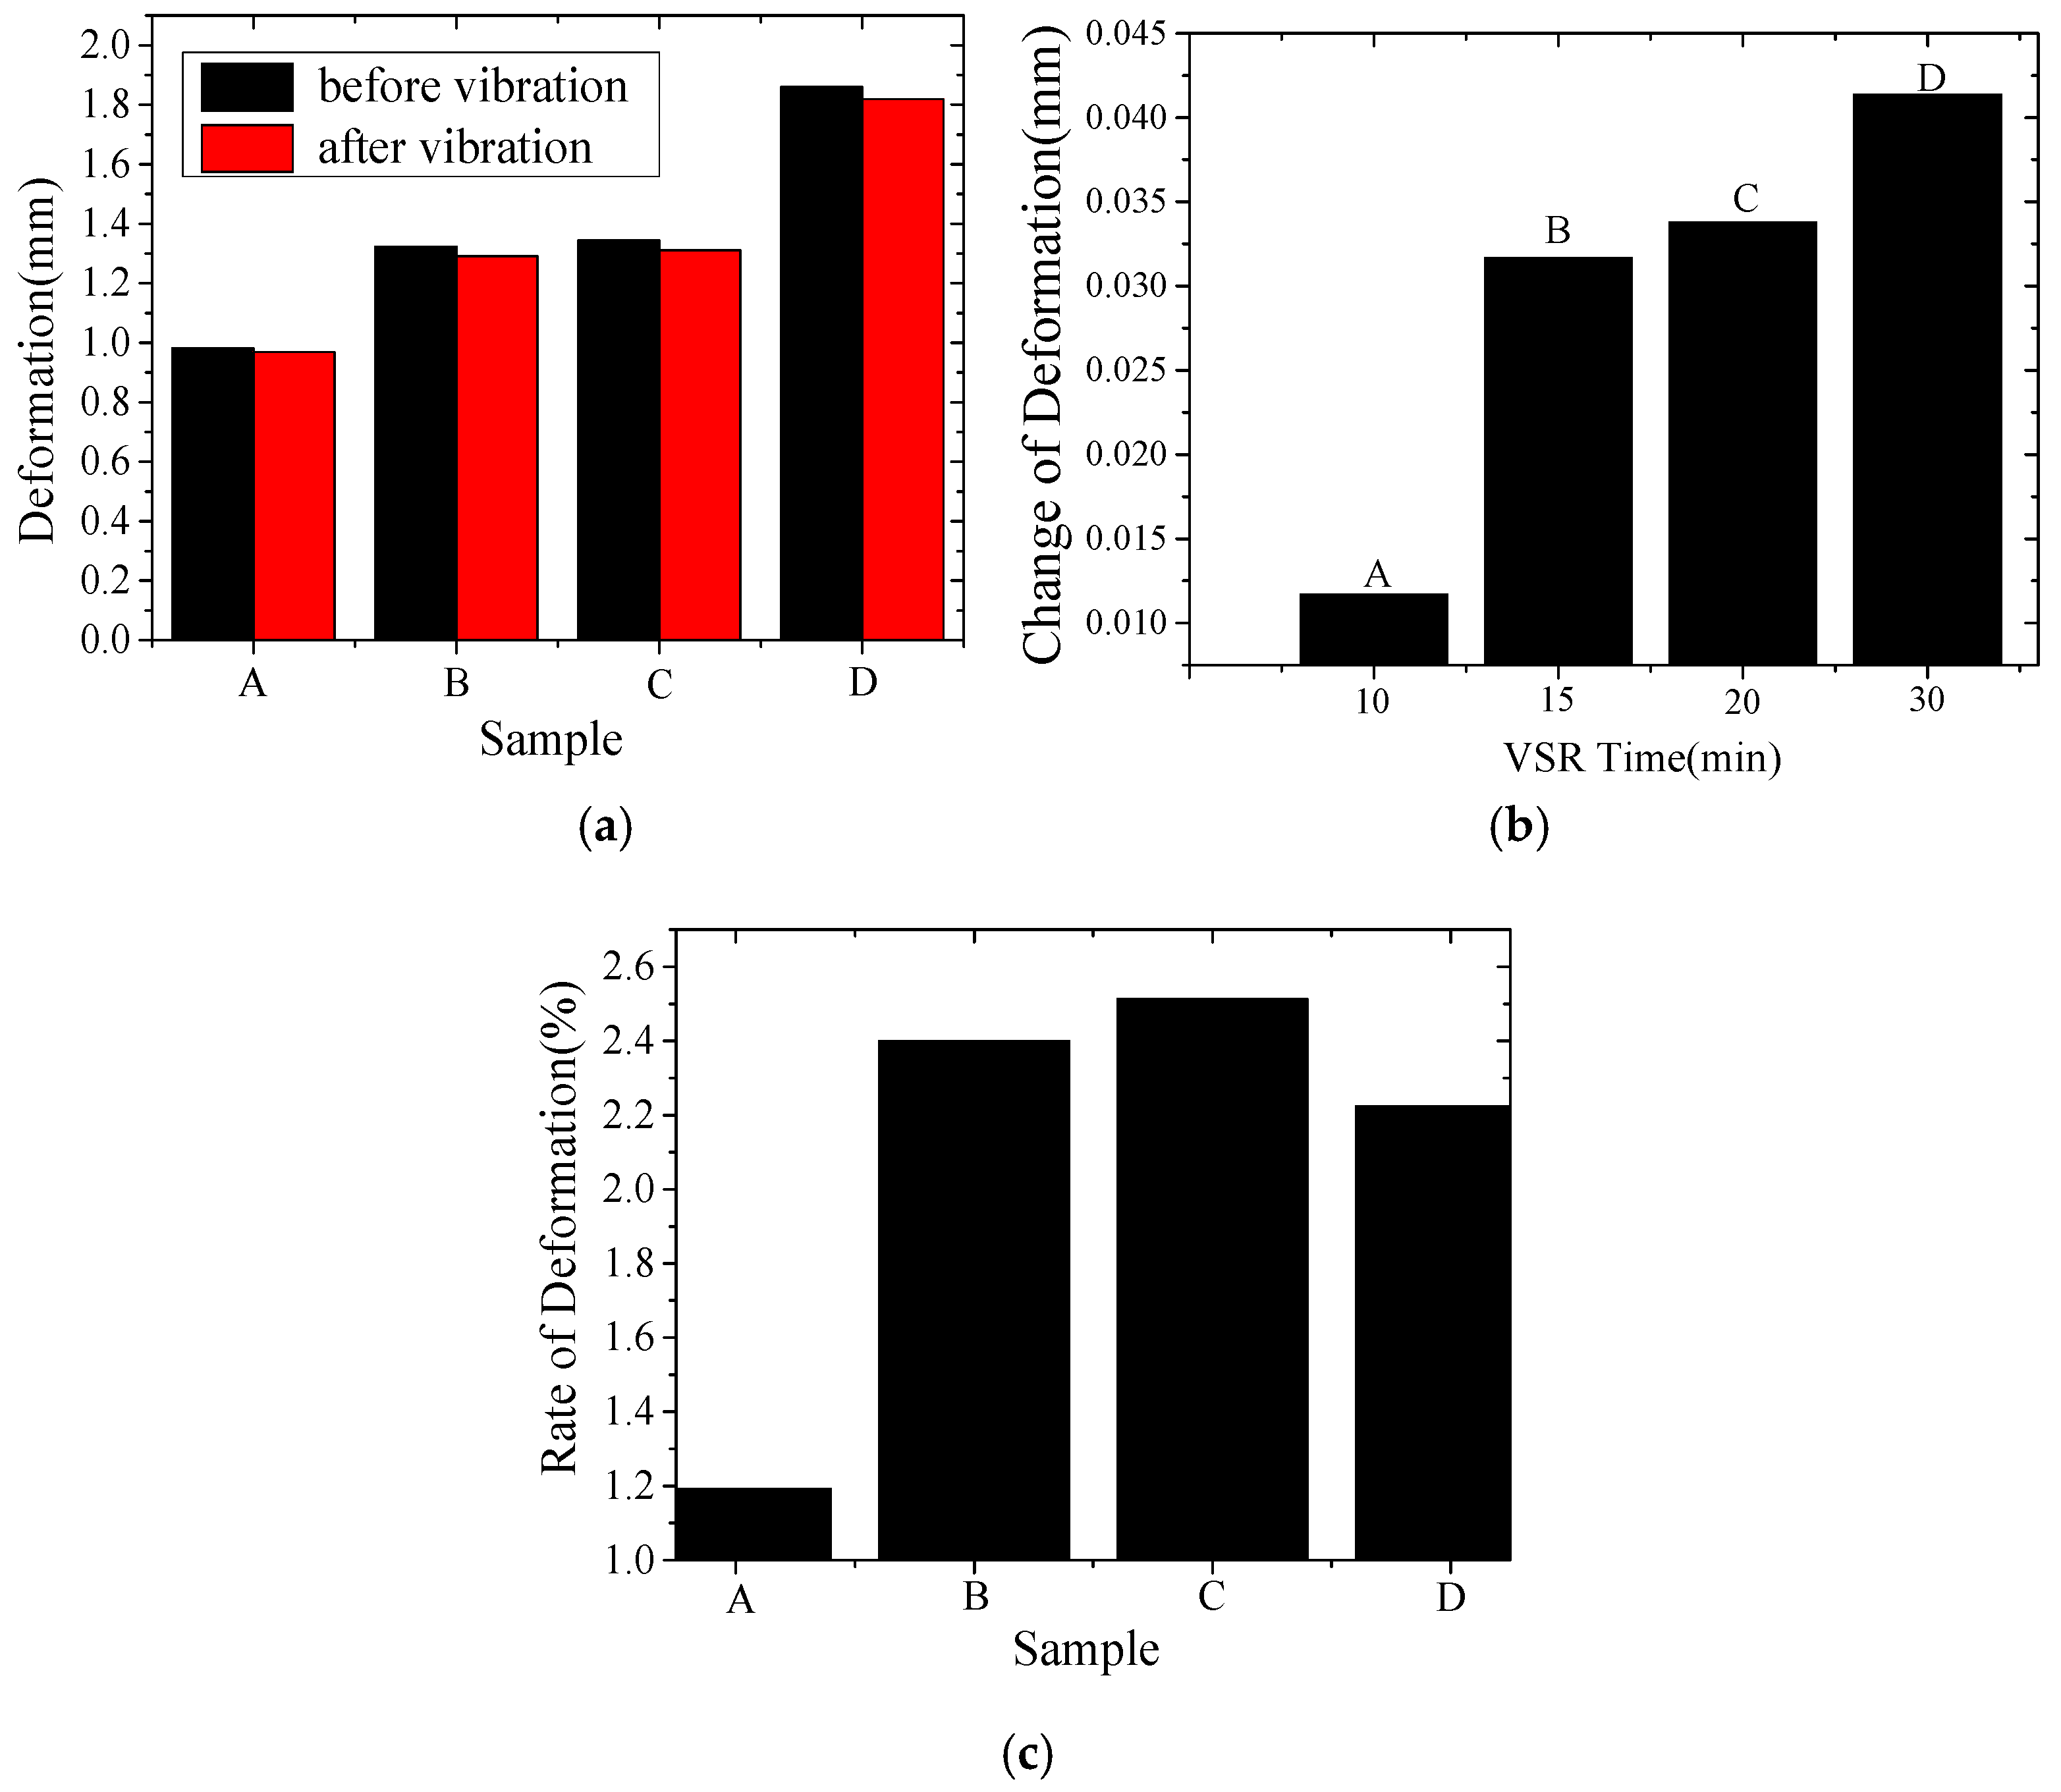
Figure 14.
Deformation comparison after vibration stress relief and after machining. (a) Deformation difference; (b) change in the rate of deformation.
Figure 14.
Deformation comparison after vibration stress relief and after machining. (a) Deformation difference; (b) change in the rate of deformation.
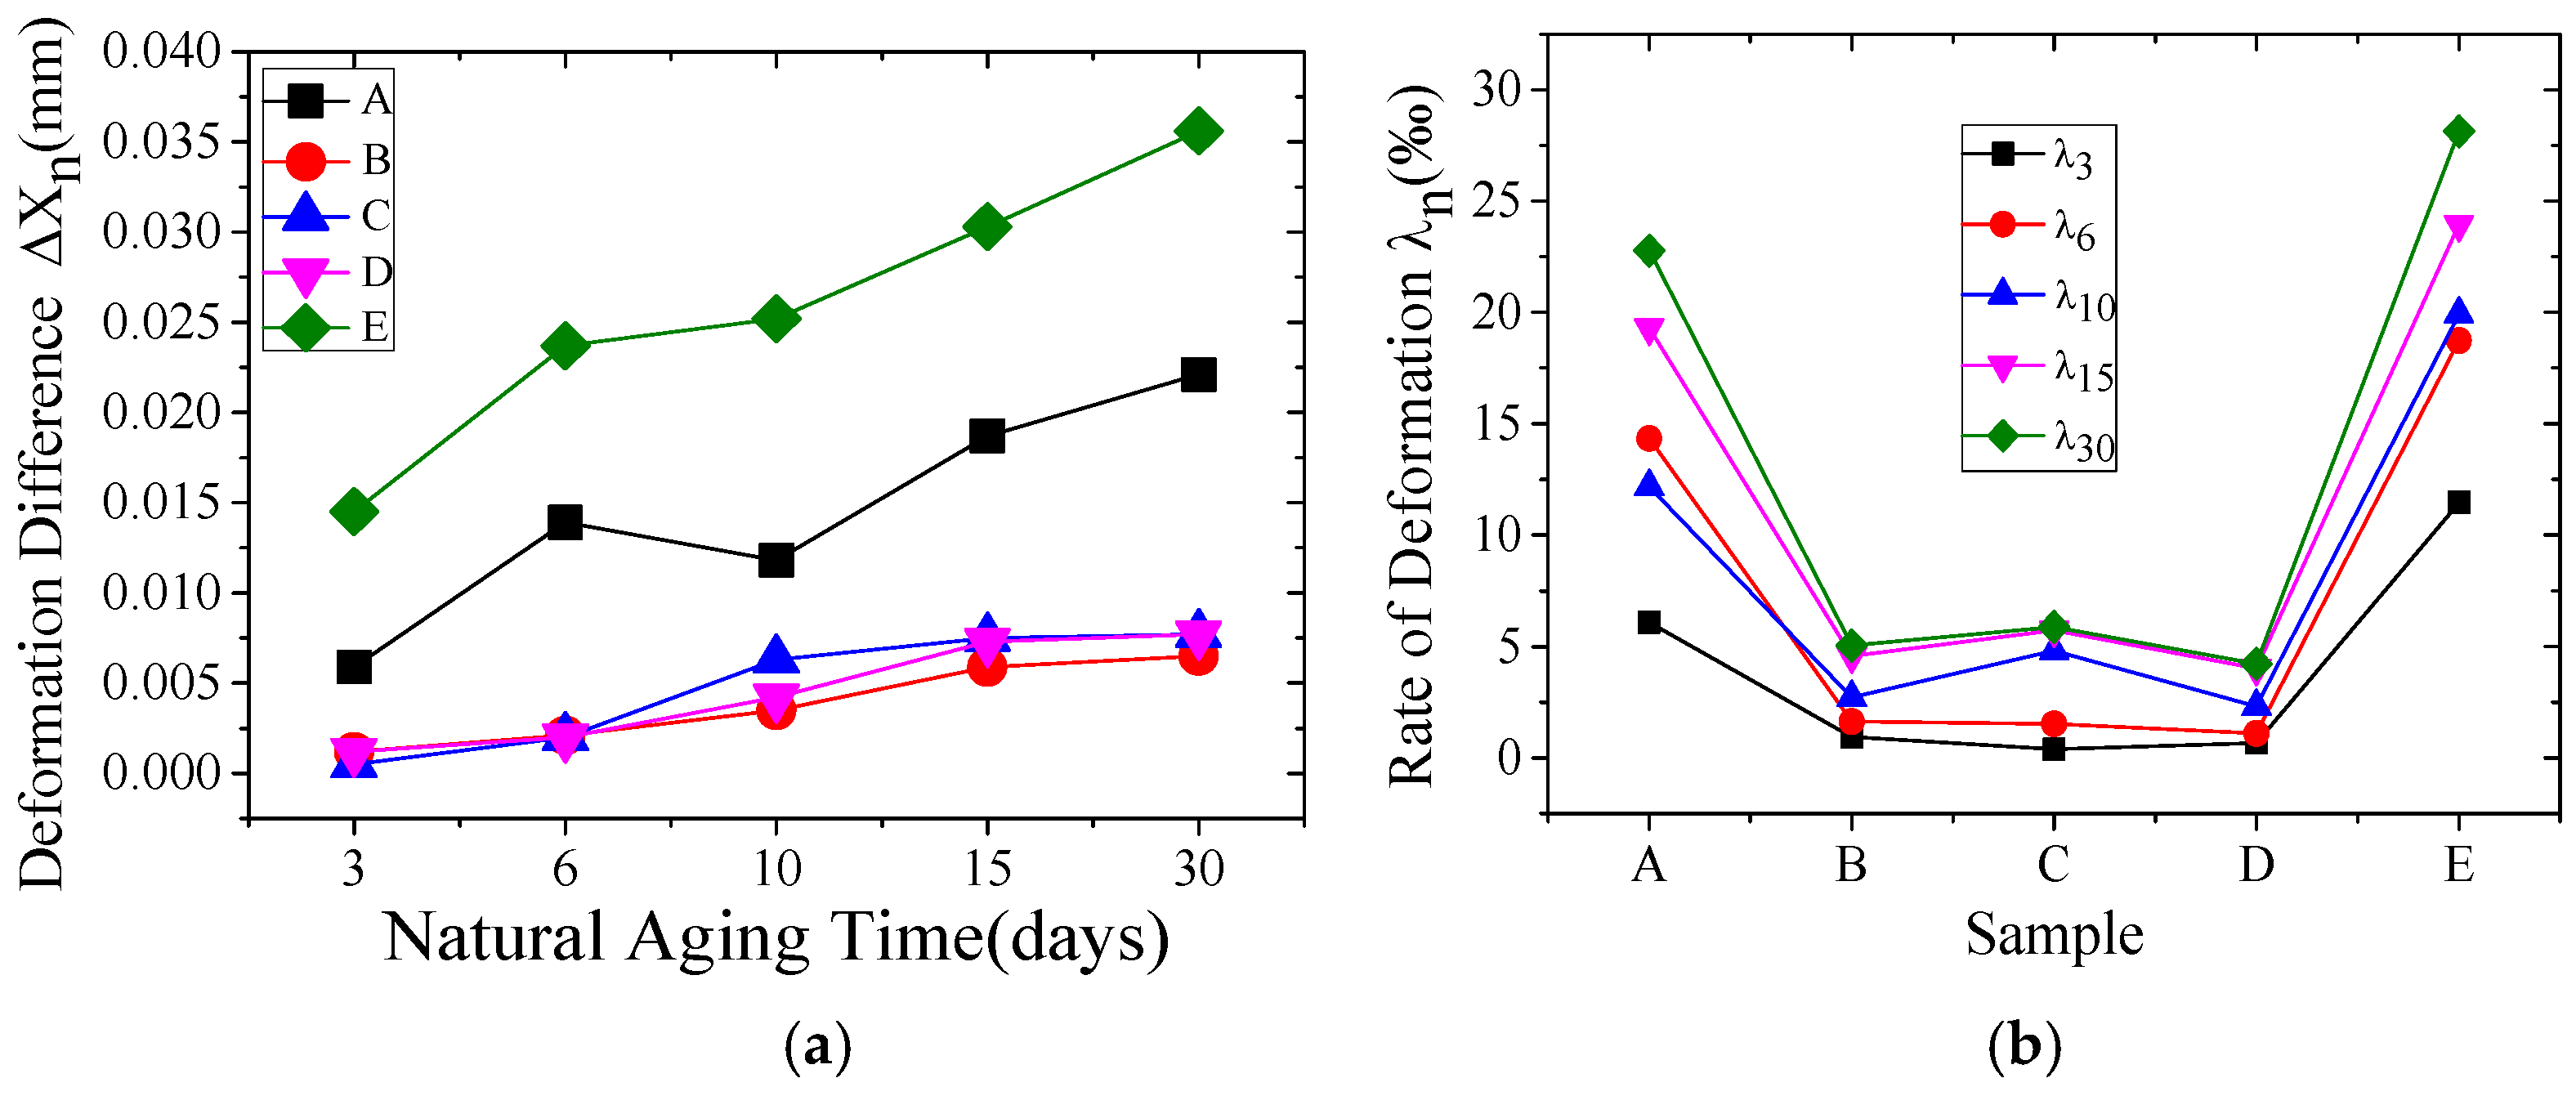
Figure 15.
Deformation comparison after natural aging and after machining. (a) Deformation difference; (b) change in the rate of deformation.
Figure 15.
Deformation comparison after natural aging and after machining. (a) Deformation difference; (b) change in the rate of deformation.

Figure 16.
Standard deviation of surface stress before and after VSR. (a) X stress; (b) Y stress.

Table 1.
The chemical composition of the studied aluminum alloy 7075.
| Composition | Si | Fe | Cu | Mn | Mg | Cr | Zn | Ti | Al |
|---|---|---|---|---|---|---|---|---|---|
| Wt % | 0.4 | 0.45 | 1.56 | 0.3 | 2.66 | 0.21 | 5.28 | 0.2 | Bal. |
© 2018 by the authors. Licensee MDPI, Basel, Switzerland. This article is an open access article distributed under the terms and conditions of the Creative Commons Attribution (CC BY) license (http://creativecommons.org/licenses/by/4.0/).
Share and Cite
MDPI and ACS Style
Gong, H.; Sun, Y.; Liu, Y.; Wu, Y.; He, Y.; Sun, X.; Zhang, M. Effect of Vibration Stress Relief on the Shape Stability of Aluminum Alloy 7075 Thin-Walled Parts. Metals 2019, 9, 27. https://doi.org/10.3390/met9010027
AMA Style
Gong H, Sun Y, Liu Y, Wu Y, He Y, Sun X, Zhang M. Effect of Vibration Stress Relief on the Shape Stability of Aluminum Alloy 7075 Thin-Walled Parts. Metals. 2019; 9(1):27. https://doi.org/10.3390/met9010027
Chicago/Turabian StyleGong, Hai, Yanjie Sun, Yaoqiong Liu, Yunxin Wu, Yipeng He, Xiaoliang Sun, and Minghai Zhang. 2019. "Effect of Vibration Stress Relief on the Shape Stability of Aluminum Alloy 7075 Thin-Walled Parts" Metals 9, no. 1: 27. https://doi.org/10.3390/met9010027
Note that from the first issue of 2016, this journal uses article numbers instead of page numbers. See further details here.