Quantification and Modelling of the Multiphase-Coupled Strengthening Effect in Al-Cu-Li Alloy

1
Light Alloy Research Institute, Central South University, Changsha 410083, China
2
State Key Laboratory of High Performance and Complex Manufacturing, Central South University, Changsha 410083, China
3
Kunming Metallurgical Research Institute, Kunming 650031, China
4
State Key Laboratory of Pressure Hydrometallurgical Technology of Associated Nonferrous Metal Resources, Kunming 650031, China
*
Author to whom correspondence should be addressed.
Metals 2019, 9(10), 1038; https://doi.org/10.3390/met9101038
Submission received: 26 August 2019
/
Revised: 15 September 2019
/
Accepted: 19 September 2019
/
Published: 24 September 2019
(This article belongs to the Special Issue Phase Transformations in Aluminium Alloys)
Abstract
:After aging heat treatment, Al-Cu-Li alloy, in general, contains a variety of precipitated phases that jointly influence the age-strengthening effect on the alloy. In this work, a multiphase-coupled strengthening model has been established on the basis of a dislocation bypassing mechanism. The model considered situations with different proportions of two strengthening phases, T1 and θ′, and then obtained the dimension and volume fractions of these two strengthening phases via experiments. The values predicted by the multiphase-coupled strengthening model and the classical strengthening superposition model were compared with the measured results. The multiphase-coupled strengthening model established in this work had better consistency with the measured results. Moreover, the modeling method proposed in the paper can also be extended to the system having over two primary strengthening phases. Hence, the model can contribute towards the development of a multi-component precipitation strengthening process for aluminum alloys.
1. Introduction
Owing to their characteristics such as their high specific modulus and specific strength, Al-Cu-Li alloys have been widely used in the lightweight structures of modern aeronautic and aerospace vehicles [1,2]. These characteristics primarily result from the highly efficient precipitation-strengthening phenomenon, in which the precipitated phases playing major strengthening roles are the T1 (Al2CuLi) and θ′ (Al2Cu) phases [3,4]. Because of the large number of alloying elements, Al-Cu-Li alloys have a relatively complex precipitation sequence [5]. The T1 phase precipitated during the aging process is a plate-like precipitated phase with {111} plane as the habit plane, and the θ′ phase is a plate-like precipitated phase with {001} as the habit plane [6,7], accompanied by a small amount of and phases [8,9,10]. Considering the complex microstructure as a mixture of several precipitated phases, it is especially difficult to perform strength evaluations.
In the past few decades, numerous studies have been carried out on mathematical modeling of the strengthening effect of precipitated phases [11,12,13,14,15,16]. Ashby [11] derived the modified Orowan equation and concluded that the strengthening effect of the precipitated phase is closely related to the spacing between the particles of the precipitated phases. As the obstacles formed by the unshearable particles increase the critical resolved shear stress of the dislocated bypassing particles, the following equation can calculate the corresponding increment τp:
where G denotes the shear modulus of the material, L denotes the spacing between the particles of precipitated phases, b denotes Burgers vector, ν denotes Poisson’s ratio, and r0 and R denote the inner and outer radii sheared by dislocation line, respectively. Considering the geometric relations and computational simulations, Nie et al. [17,18] and Zhu et al. [19] corrected calculation methods for the effective particle spacing and established the single-phase strengthening model for the unshearable particles of precipitated phases in aluminum alloy.
For the strengthening effect induced by the combination of several precipitated phases, Zhu et al. [20] proposed an arithmetic superposition model that can “superpose” the individual strengthening effect by each precipitated phase via the following equation:
where τp denotes the increment of the critical resolved shear stress due to total precipitation strengthening, and the index number, α, is a constant ranging from 1 to 2. However, in this paper, a multiphase-coupled strengthening model is established by analyzing the relationship between the shape, size, and position of T1 and θ′ phases in Al-Cu-Li alloys.
2. Materials and Methods
In this study, a typical third-generation Al-Li alloy (AA2195) was selected as the research material. The material used was a 2195-O sheet with a thickness of 12.7 mm (provided by Constellium Aluminum, Voreppe, France). The composition range of AA2195 is provided in Table 1. The alloy was solid-solution treated at the temperature of 510 °C for 1 h and subjected to artificial aging at 170 °C after water quenching. The measured yield strength of the solid solution-state test piece was 210 MPa. Then, the samples were respectively taken at 8, 16, 20, 28, 36, and 48 h for observation using a transmission electron microscope (FEI, Hillsboro, OR, USA) and mechanical tensile tests at room temperature.
Transmission electron microscope specimens were firstly mechanically thinned to a thickness of 80 µm and cut to 3 mm diameter disks. Then, they were twin-jet electro-polished in a solution of nitric acid and methyl alcohol (3:7 in volume) at approximately −30 °C. Finally, transmission electron microscope observations were carried out by an FEI Tecnai G2 F20 microscope (FEI, Hillsboro, OR, USA) operating at 200 kV. Tensile samples had a cross-section of 3 × 12.5 mm2 and a gauge length of 50 mm. Room-temperature tensile tests were carried out by an electronic universal testing machine (Changchun Research Institute of Mechanical Science Co., Ltd. in Changchun, China) at a tensile speed of 2 mm/min, and at least 10 measurements were made to obtain the average value.
3. Results
Figure 1a,b displays the images that were observed in the high angular annular dark field mode with scanning transmission electron microscopy (HAADF-STEM, FEI, Hillsboro, OR, USA)) of the samples performed after 8 and 20 h of artificial aging, respectively. The intragranular precipitated phase underwent a transition from the θ′ phase to T1 phase as the predominant phase. The electron diffraction pattern of the selected areas also changed significantly. To quantify the parameters of θ′ and T1 phases, it was necessary to perform measurements and statistics on the raw diameter and number density of the precipitated phase, recorded by the STEM photograph, and the thickness of the precipitated phase, recorded by the high-resolution transmission electron microscopy (HRTEM, FEI, Hillsboro, OR, USA) photograph, and further calculate the volume fractions of the precipitated phases. However, the method for measuring diameter and number density can be affected by various artifacts. These artifacts are related to the finite thickness of the observed sample and the two-dimensional projection of the microstructures; hence, the originally measured diameter needs to be properly corrected [21]. Dorin et al. [22], proposed a method to measure and correct the plate-like particles, which aims to obtain 3-D information through correcting the dimension distribution measured on the section. On the basis of classifying the dimension range of the particles, a probability matrix was used to accomplish the corrections to the dimensions [22], and then the volume fractions of precipitated phases were calculated. Considering the sample after 20 h aging as an illustration, its corrected true diameters of θ′ and T1 phases are shown in Figure 2a,b, respectively. According to the above method, the dimension and volume fractions of the T1 and θ′ phases at the aging times of 8, 16, 20, 28, 36, and 48 h are listed in Table 2. During the aging process, the volume fraction ratio between θ′ and T1 phases transitioned from a value over 1 to a value less than 1. In addition, the yield strengths of these specimens are also listed in Table 2.
4. Discussion
The proposed arithmetic superposition method is based on the mature single-phase strengthening theory, and the final strengthened effect is obtained by the mathematical superposition method [16,20,23,24]. The physical meaning of the arithmetic superposition is to distribute the strengthened contribution of each precipitated phase. The algorithm can directly target the result, but it does not consider the source of the multiphase strengthening effect. According to the well-known Orowan model, the obstacle of unshearable particles against the dislocation motion primarily results from the spacing of the particles. Figure 3 shows the schematic diagram of the obstacles of randomly distributed different types of strengthening phase particles against the dislocation motion. The effective spacing between the particles, formed in the case of the multiphase mixture, is determined by the shape, dimensions, and positional relationship of these precipitated phases.
4.1. Multiphase-Coupled Strengthening Modelling
The positional relationship between the T1 and θ′ phases as the primary strengthening phases in the aluminum matrix of Al-Cu-Li alloy is shown in Figure 4a. The T1 phase parallel to the slip plane was omitted because the probability of encountering the T1 phase during dislocation shearing at the special orientation is negligible. For the plate-like precipitated phases on {111} and {100} planes, the dihedral angles with {111} as the slip plane were 70.53° and 54.74°, respectively. For the areas on the {111} plane and {100} plane and sheared by the slip plane, the number of precipitated phase particles per unit volume, NA1 and NA2, are expressed as [18,25]:
where NV1 and NV2 denote the number of precipitated phase particles per unit volume; P1 and P2 denote the probabilities of the precipitated phase particles per unit volume sheared by the slip plane; and D1 and D2 denote the diameters of the precipitated phase. The volume fractions, f1 and f2, of plate-like precipitated phase particles on {111} and {100} per unit volume are expressed as [25]:
where V1 and V2 denote the volume of the single precipitated phase, and t1 and t2 denote the thickness of the precipitated phases. As per the positional relationship of plate-like phases on the {111} and {100} phases, the section on slip plane {111} is shown in Figure 4b. Accordingly, the center spacing between the precipitated phases on {111} and {100} are denoted as Lp1 and Lp2 [18]:
As per the equations, the center spacing of the precipitated phase is determined by the number of precipitated phase particles within the corresponding unit volume and is related to the volume fraction, diameter, and thickness.
The plate-like precipitated phase on the {111} plane mixes with that on the {100} plane, and a simplified model describing the mixing situation is presented in Figure 4b. The number difference between these two precipitated phases only manifests in the difference in center spacing of the two phases, Lp1 and Lp2, where the smaller value LD was used as the effective free spacing between the particles.
As Lp1 < Lp2, namely, the particle number per unit volume of the plate-like precipitated phase on the {111} plane is larger than that on the {100} plane:
As Lp1 > Lp2, the particle number per unit volume of the plate-like precipitated phase on the {100} plane is larger than that on the {111} plane:
Substituting Equations (6) and (7) into Equation (1), the Orowan equation with coupled strengthening induced by the plate-like precipitated phases on the {111} plane and {100} plane of the aluminum alloy can be obtained, where the outer diameter R is (tp1 + tp2)/2 = (1.061t1 + 1.225t2)/2, and r0 adopts the Burgers vector b [17,18,19,20].
4.2. Yield Strength Modelling
During the aging process of the Al-Cu-Li alloy, the compositions of precipitated phases and the yield strength vary continuously. As per the literature, the yield strength of the aluminum alloy in the solutionized state can be expressed according to the following equation [26,27]:
where σy denotes the yield strength of alloy material; M denotes the Taylor factor, which is the crystal’s orientation factor related to the orientations of texture and sample; σB denotes the strengthening effect of matrix and grain boundary of the aluminum alloy; and σSS denotes the solid-solution strength. The variation of these two items in the aging process can be denoted as:
where σB0 denotes the strengthening effect of matrix and grain boundaries before the aging process; and σc denotes the strengthening effect induced by the precipitated phases that are coherent or semi-coherent with the matrix, such as δ′ and σ phases [10,28], where the strengthening can be regarded as the strengthening effect on the aluminum matrix. σSS0 denotes the solution strength in the alloy before aging, and ΔσSS denotes the decrease in solution strength during aging. As σc and ΔσSS are extremely small compared to other strengthening effects in the Al-Cu-Li alloy, their difference (σc − ΔσSS) in Equation (9) can be ignored. The remaining values (σB0 + σSS0) can be obtained by the tensile test at room temperature for solid solution-state test pieces. Other parameters in the model are listed in Table 3.
4.3. Model Evaluation
The measured yield strength of the 2195 alloy specimens after being subjected to the artificial aging process at 170 °C is shown in Figure 5. The predicted values of the multiphase-coupled strengthening model and the arithmetic superposition model are also incorporated in the figure for comparison purposes. With respect to the arithmetic superposition model, as the index number α of the model is a parameter to be determined in the range of 1~2, the distribution interval of the value predicted by the model was plotted according to its value range. There was also a sudden change in α in the early stage of aging, namely, α = 2 predicts the value closest to the measured yield strength before 8 h of aging, and α = 1 predicts the value closest to the measured value in subsequent aging. Compared to the arithmetic superposition model (α is the optimal value) and the multiphase-coupled strengthening model established in this work, the maximum differences between the predicted and measured values were 17 and 5 MPa, respectively. The values predicted by the established model were closer to the measured yield strength, and its predicted bias was reduced to the values within the acceptable range in practical engineering.
5. Conclusions
In summary, aiming for the precipitation conditions in the aging process of Al-Cu-Li alloys, a multiphase-coupled strengthening model based on the modified Orowan equation has been established. As per the shape and dimensions of the strengthening phase particles on the different habit planes in the Al-Cu-Li alloy and their positional relationship in the aluminum matrix, a method was proposed to calculate the smallest free spacing between the strengthening phase particles per unit volume of the multiphase-mixed system. Compared with the existing arithmetic superposition model, the established model could better match the values for measured yield strength of the Al-Cu-Li alloy test piece. The model points out that the strengthening effect of multiphase-coupled strengthening is due to the combination of various factors, such as the type, size, and volume fraction of the precipitated phase, and the larger the aspect ratio and volume fraction of the precipitated phase are, the better the strengthening effect will be. Multi-component precipitation strengthening is one of the important future development directions for high-performance aluminum alloys. Therefore, the idea of the multiphase-coupled strengthening model proposed in this paper can also be easily extended and applied to more complex compositions of strengthening phases in novel alloy systems, which will be the focus of our future research work.
Author Contributions
Investigation, J.Z. and Z.L.; methodology, F.X.; project administration, C.B.; writing—original draft, J.Z.; writing—review and editing, F.X.
Funding
This work was supported by the National Key Research and Development Program of China (No. 2017YFB0306301), and the National Natural Science Foundation of China (No. 51705539).
Conflicts of Interest
The authors declare no conflict of interest.
References
- Williams, J.C.; Starke, E.A. Progress in structural materials for aerospace systems. Acta Mater. 2003, 51, 5775–5799. [Google Scholar] [CrossRef]
- Dursun, T.; Soutis, C. Recent developments in advanced aircraft aluminium alloys. Mater. Des. 2014, 56, 862–871. [Google Scholar] [CrossRef]
- Gumbmann, E.; De Geuser, F.; Sigli, C.; Deschamps, A. Influence of Mg, Ag and Zn minor solute additions on the precipitation kinetics and strengthening of an Al-Cu-Li alloy. Acta Mater. 2017, 133, 172–185. [Google Scholar] [CrossRef] [Green Version]
- Yoshimura, R.; Konno, T.J.; Abe, E.; Hiraga, K. Transmission electron microscopy study of the evolution of precipitates in aged Al–Li–Cu alloys: The θ′ and T1 phases. Acta Mater. 2003, 51, 4251–4266. [Google Scholar] [CrossRef]
- Ovri, H.; Lilleodden, E.T. New insights into plastic instability in precipitation strengthened Al–Li alloys. Acta Mater. 2015, 89, 88–97. [Google Scholar] [CrossRef]
- Zhang, J.; Wang, C.; Zhang, Y.; Deng, Y. Effects of creep aging upon Al-Cu-Li alloy: Strength, toughness and microstructure. J. Alloy Compd. 2018, 764, 452–459. [Google Scholar] [CrossRef]
- Liu, H.; Bellon, B.; Llorca, J. Multiscale modelling of the morphology and spatial distribution of θ′ precipitates in Al-Cu alloys. Acta Mater. 2017, 132, 611–626. [Google Scholar] [CrossRef]
- Schlesier, C.; Nembac, E. Strengthening of aluminium-lithium alloys by long-range ordered δ′-precipitates. Acta Mater. 1995, 43, 3983–3990. [Google Scholar] [CrossRef]
- Huang, J.C.; Ardell, A.J. Precipitation Strengthening of Binary AI-Li Alloys by δ′ Precipitates. Mater. Sci. Eng. A 1988, 104, 149–156. [Google Scholar] [CrossRef]
- Li, H.Y.; Huang, D.S.; Kang, W.; Liu, J.J.; Ou, Y.X.; Li, D.W. Effect of Different Aging Processes on the Microstructure and Mechanical Properties of a Novel Al–Cu–Li Alloy. J. Mater. Sci. Technol. 2016, 32, 1049–1053. [Google Scholar] [CrossRef]
- Ashby, M.F. Results and consequences of a recalculation of the Frank-Read and the Orowan stress. Acta Metall. 1966, 14, 679–681. [Google Scholar] [CrossRef]
- Foreman, A.J.E.; Makin, M.J. Dislocation movement through random arrays of obstacles. Can. J. Phys. 1967, 45, 511–517. [Google Scholar] [CrossRef]
- Merle, P.; Fouquet, F.; Merlin, J. Experimental and Theoretical Determinations of the Yield Stress of an Alloy Containing Plate-like Precipitates: θ′ Phase in an Al-4wt.% Cu Alloy. Mater. Sci. Eng. 1981, 50, 215–220. [Google Scholar] [CrossRef]
- Shercliff, H.R.; Ashby, M.F. A process model for age hardening of aluminium alloys—I. the model. Acta Metal. Mater. 1990, 38, 1789–1802. [Google Scholar] [CrossRef]
- Starink, M.J.; Wang, S.C. A model for the yield strength of overaged Al–Zn–Mg–Cu alloys. Acta Mater. 2003, 51, 5131–5150. [Google Scholar] [CrossRef]
- Bardel, D.; Perez, M.; Nelias, D.; Deschamps, A.; Hutchinson, C.R.; Maisonnette, D.; Chaise, T.; Garnier, J.; Bourlier, F. Coupled precipitation and yield strength modelling for non-isothermal treatments of a 6061 aluminium alloy. Acta Mater. 2014, 62, 129–140. [Google Scholar] [CrossRef]
- Nie, J.F.; Muddle, B.C. Strengthening of an Al–Cu–Sn alloy by deformation-resistant precipitate plates. Acta Mater. 2008, 56, 3490–3501. [Google Scholar] [CrossRef]
- Nie, J.F.; Muddle, B.C.; Polmear, I.J. The effect of precipitate shape and orientation on dispersion strengthening in high strength aluminium alloys. Mater. Sci. Forum 1966, 217, 1257–1262. [Google Scholar] [CrossRef]
- Zhu, A.W.; Starke, E.A. Strengthening effect of unshearable particles of finite size: A computer experimental study. Acta Mater. 1999, 47, 3263–3269. [Google Scholar] [CrossRef]
- Zhu, A.W.; Csontos, A.; Starke, E.A. Computer experiment on superposition of strengthening effects of different particles. Acta Mater. 1999, 47, 1713–1721. [Google Scholar] [CrossRef]
- Andersena, S.J.; Holmeb, B.; Marioara, C.D. Quantification of small, convex particles by TEM. Ultramicroscopy 2008, 108, 750–762. [Google Scholar] [CrossRef]
- Dorin, T.; Donnadieu, P.; Chaix, J.; Lefebvree, W.; De Geuser, F.; Deschamps, A. Size distribution and volume fraction of T1 phase precipitates from TEM images: Direct measurements and related correction TEM. Micron 2015, 78, 19–27. [Google Scholar] [CrossRef]
- De Vaucorbeil, A.; Poole, W.J.; Sinclair, C.W. The superposition of strengthening contributions in engineering alloys. Mater. Sci. Eng. A 2013, 582, 147–154. [Google Scholar] [CrossRef]
- Ardell, A.J. Precipitation Hardening. Metall. Trans. A 1985, 16, 2131–2165. [Google Scholar] [CrossRef]
- Fullman, R.L. Measurement of Particle Sizes in Opaque Bodies. Trans. AIME 1953, 197, 447–452. [Google Scholar] [CrossRef]
- Dorin, T.; Deschamps, A.; De Geuser, F.; Sigli, C. Quantification and modelling of the microstructure/strength relationship by tailoring the morphological parameters of the T1 phase in an Al–Cu–Li alloy. Acta Mater. 2014, 75, 134–146. [Google Scholar] [CrossRef]
- Rodgers, B.I.; Prangnell, P.B. Quantification of the influence of increased pre-stretching on microstructure-strength relationships in the Al-Cu-Li alloy AA2195. Acta Mater. 2016, 108, 55–67. [Google Scholar] [CrossRef]
- Li, H.Y.; Tang, Y.; Zeng, Z.D.; Zheng, Z.Q.; Zheng, F. Effect of ageing time on strength and microstructures of an Al–Cu–Li–Zn–Mg–Mn–Zr alloy. Mater. Sci. Eng. A 2008, 498, 314–320. [Google Scholar] [CrossRef]
Figure 1.
High angular annular dark field mode with scanning transmission electron microscopy (HAADF-STEM) images and corresponding diffraction patterns observed along the <110> zone axis after aging at 170 °C for (a) 8 h and (b) 20 h. (c) High-resolution transmission electron microscopy (HRTEM) image of the T1 phase observed along the <110> zone axis after aging at 170 °C for 20 h, and (d) HRTEM images of θ′ phase observed along the <001> zone axis after aging at 170 °C for 20 h.

Figure 2.
Corrected size distribution was measured in HAADF-STEM after aging at 170 °C for 20 h. (a) θ′ phase, (b) T1 phase.
Figure 2.
Corrected size distribution was measured in HAADF-STEM after aging at 170 °C for 20 h. (a) θ′ phase, (b) T1 phase.

Figure 3.
Schematic illustration of the dislocation interaction with unshearable plate-like particles, which are randomly distributed T1 phases on the {111} plane and θ′ phases on the {001} plane, where long and thin lines represent T1 phases and short and thick lines represent θ′ phases.
Figure 3.
Schematic illustration of the dislocation interaction with unshearable plate-like particles, which are randomly distributed T1 phases on the {111} plane and θ′ phases on the {001} plane, where long and thin lines represent T1 phases and short and thick lines represent θ′ phases.
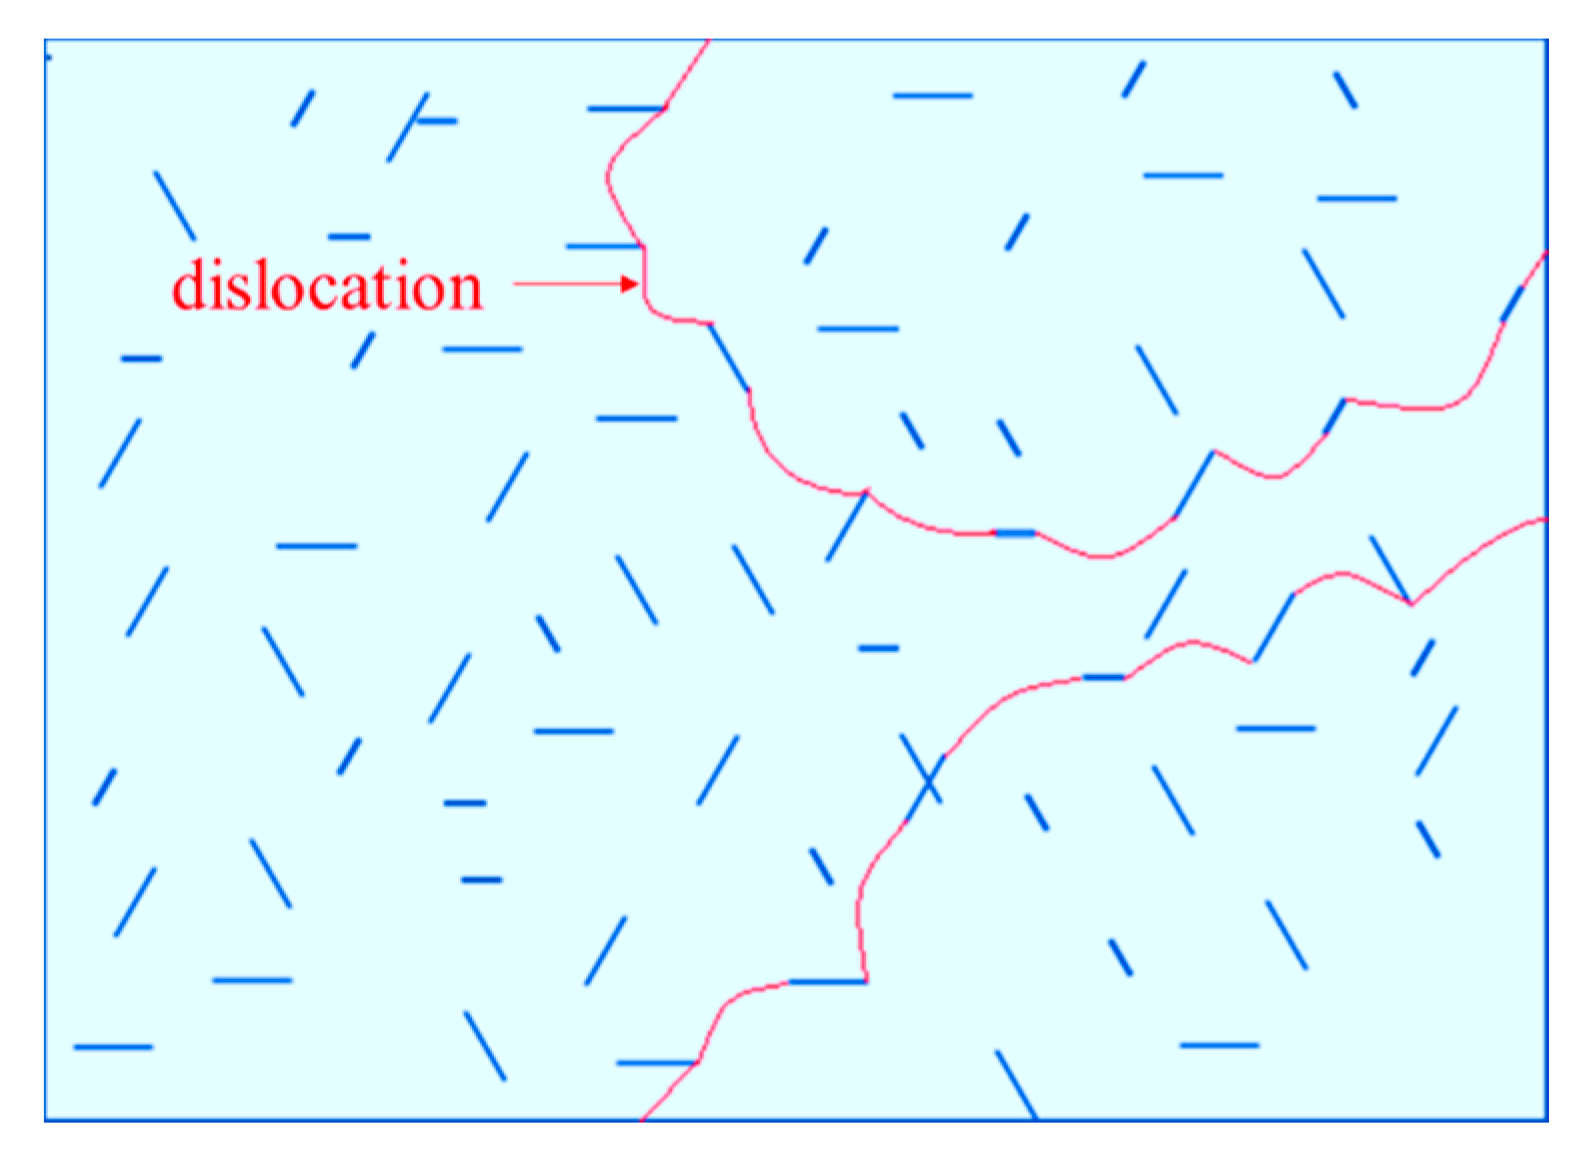
Figure 4.
(a) Schematic diagram of the shape of T1 and θ′ phases and their position in the aluminum matrix; (b) schematic section of T1 and θ′ phases on the slip plane {111}.
Figure 4.
(a) Schematic diagram of the shape of T1 and θ′ phases and their position in the aluminum matrix; (b) schematic section of T1 and θ′ phases on the slip plane {111}.

Figure 5.
Experimentally measured yield strength during aging treatment at 170 °C and predictions by the multiphase-coupled strengthening model and the arithmetic superposition model.
Figure 5.
Experimentally measured yield strength during aging treatment at 170 °C and predictions by the multiphase-coupled strengthening model and the arithmetic superposition model.


Table 1.
Composition of AA2195 alloy (wt.%).
| AA2195 | Cu | Li | Mg | Zr | Mn | Ag | Al |
|---|---|---|---|---|---|---|---|
| Min. | 3.70 | 0.80 | 0.25 | 0.08 | - | 0.25 | Bal |
| Max. | 4.30 | 1.20 | 0.80 | 0.16 | 0.25 | 0.60 | Bal |
Table 2.
Yield strength and quantitative measurements of T1 and θ′ precipitates in specimens aged at 170 °C.
Table 2.
Yield strength and quantitative measurements of T1 and θ′ precipitates in specimens aged at 170 °C.
| Aging Time (h) | Yield Strength (MPa) | Diameter (nm) | Thickness (nm) | Volume Fraction (%) | |||
|---|---|---|---|---|---|---|---|
| T1 | θ′ | T1 | θ′ | T1 | θ′ | ||
| 8 | 355 ± 4.6 | 102 | 31 | 1.96 | 3.02 | 0.4 | 0.8 |
| 16 | 408 ± 5.8 | 108 | 63 | 2.02 | 3.48 | 1.0 | 0.5 |
| 20 | 434 ± 7.3 | 116 | 66 | 2.46 | 3.54 | 1.2 | 0.6 |
| 28 | 448 ± 6.4 | 134 | 68 | 2.62 | 3.60 | 1.5 | 0.6 |
| 36 | 469 ± 4.2 | 142 | 73 | 2.78 | 3.78 | 1.7 | 0.7 |
| 48 | 485 ± 5.3 | 155 | 76 | 3.06 | 4.26 | 2.0 | 0.8 |
© 2019 by the authors. Licensee MDPI, Basel, Switzerland. This article is an open access article distributed under the terms and conditions of the Creative Commons Attribution (CC BY) license (http://creativecommons.org/licenses/by/4.0/).
Share and Cite
MDPI and ACS Style
Zhang, J.; Li, Z.; Xu, F.; Bao, C. Quantification and Modelling of the Multiphase-Coupled Strengthening Effect in Al-Cu-Li Alloy. Metals 2019, 9, 1038. https://doi.org/10.3390/met9101038
AMA Style
Zhang J, Li Z, Xu F, Bao C. Quantification and Modelling of the Multiphase-Coupled Strengthening Effect in Al-Cu-Li Alloy. Metals. 2019; 9(10):1038. https://doi.org/10.3390/met9101038
Chicago/Turabian StyleZhang, Jin, Zhide Li, Fushun Xu, and Chongjun Bao. 2019. "Quantification and Modelling of the Multiphase-Coupled Strengthening Effect in Al-Cu-Li Alloy" Metals 9, no. 10: 1038. https://doi.org/10.3390/met9101038
Note that from the first issue of 2016, this journal uses article numbers instead of page numbers. See further details here.