Modelling the Damage of Structural Components with Macrostructure Defects


Faculty of Civil Engineering and Architecture, Kielce University of Technology, Al. Tysiąclecia Państwa Polskiego 7, 25-314 Kielce, Poland
Metals 2019, 9(11), 1238; https://doi.org/10.3390/met9111238
Submission received: 23 October 2019
/
Revised: 6 November 2019
/
Accepted: 9 November 2019
/
Published: 19 November 2019
(This article belongs to the Special Issue Quasi-Static and Dynamic Testing of Metallic Materials)
Abstract
:The article presents a numerical analysis of the process of damage of structural steel, the scope of which encompassed the estimation of the time to failure of a structural component. The analysis was conducted using the Gurson–Tvergaard–Needleman material model, which takes into account the influence of microdefects on material strength. Considered was a plate element with a central hole modelling the material discontinuity that may arise in a structural component as a result of corrosion. The conducted simulation permitted an analysis of the phenomenon of nucleation and evolution of microdamage in S235JR steel, which allowed, for the analysed component, the detection of the initiation of microdamages and their development in the area susceptible to damage. Changes to the state of stress taking place during plastic deformation of structural steel due to the evolution of microdefects of the material structure were analysed. Presented are the results of this research, in which the stress state described by the stress triaxiality in relation to the changes in the volumetric fraction of voids determining the size of microdefects was given a detailed analysis.
1. Introduction
One of the main reasons for damage of structural components made of various metals is their fracture [1,2,3]. This is a process initiated at the microstructural level, which develops from microscale fractures that, as they develop, reach macroscopic sizes that are visible to the naked eye. They lead to material decohesion, resulting in local component damage. In the case of key areas and components, for example, in the case of a chain system defined in the theory of reliability, this leads to damage to the entire load-carrying system of a structure. Phenomena that facilitate the initiation, development and propagation of fractures are all kinds of notches taking the form of, among others, macrostructure defects.
Regarding components of building structures, many defects emerge as a result of corrosion, which cause significant material losses in the form of corrosion pits. In extreme cases, considerable discontinuities of the material structure arise, so that holes emerge in the components (Figure 1). As is known, in such a situation, the local load-carrying capacity of a component is thus drastically reduced due to the generation of significant stress gradients, which, depending on the defect geometry, may exceed the strength of the material, expressed by its yield limit, several times.
The basic methods enabling an analysis of such phenomena and the estimation of the load-carrying capacity of the damaged component are based on solutions from fracture mechanics, particularly in the case of brittle materials (linear-elastic fracture mechanics). In case of the emergence of such phenomena in elastic–plastic or plastic materials, which applies to steel structures used in the construction industry, a different approach must be used due to the different behaviour of such materials during deformation. Applied here can also be methods from fracture mechanics; however, a fuller view of the phenomena taking place is enabled by the application of the approach assumed in the theory of damage mechanics, which permits the consideration in the description of the material behaviour of the development of microstructure defects. Presently, of fundamental significance in the analysis of elastic–plastic and plastic materials are numerical analyses utilising material models developed in line with the theory of damage mechanics. This field has been intensively developed since the 1950s, resulting in many advanced material models applied in many problems and various materials, including recent achievements [4,5]. One such model is the Gurson porous material model [6], developed and utilised presently in its modified form by Tvergaard and Needleman as the Gurson–Tvergaard–Needleman (GTN) model [7,8,9]. It permits the consideration of the influence of developing porous material microstructure defects, including those of structural steel, on the strength of a material during deformation. This enables the execution of calculations and modelling the material behaviour across the entire scope, from the beginning of its loading all the way to complete failure.
Such an analysis is the subject of the present article. This work presents an analysis of the load-carrying capacity of a component with a defect, which utilises the approach based on damage mechanics. The Gurson–Tvergaard–Needleman model was applied to S235JR steel as one of the best models for ductile fracture modelling, which describes the reduction of material strength due to the growth of microstructural defects during the deformation process. It was successfully validated during experiments and numerical simulations of specimens made of S235JR steel subjected to tension in uniaxial as well spatial (triaxial) stress states. In the case of this steel grade, void nucleation and growth was a dominant failure mechanism. Thus, it was decided to try to apply the GTN material model for failure prediction of part of the structure. Thanks to the application of the Gurson–Tvergaard–Needleman porous material model, it was possible to model the material damage process, and, as a result, the estimation of the moment of destruction of the component with a defect in the form of a structural discontinuity.
The damage analysis and prediction of failure of a structural element based on the GTN material model is a novelty of the paper, in comparison with the majority of these types of studies. So far, small specimens were mostly considered. Additionally, one of the critical GTN damage parameters, void volume fraction fF, which is crucial for the definition of material failure, was applied based on the results of experimental investigations done on a real, physical material (i.e., S235JR steel). Mostly, the GTN parameters were calibrated, so the method presented in this approach should be highlighted.
2. Materials and Methods
2.1. GTN Porous Material Model
The GTN material model binds the level of damage to the material microstructure with material strength. The influence of microstructure defects is taken into account by the introduction to the plastic potential of the so-called void volume fraction:
where σe is the effective stress defined according to the Huber–Mises–Hencky strength hypothesis, (with σ1, σ2 and σ3 being the principal stresses); σ0 is the flow stress of the matrix material (yield stress); σm is the hydrostatic stress; f* is the modified void volume fraction and qi represents the Tvergaard’s coefficients.
The Gurson–Tvergaard–Needleman porous material model is a quite complex material model, in which an entire range of quantities defines both strength parameters as well as the structure and behaviour of a material during the plastic deformation process.
In this model, strength parameters are described by the yield limit σ0 and the so-called Tvergaard’s coefficients qi [7]. These coefficients were determined by Tvergaard as material constants defining the behaviour of a material in the plastic range. For metal materials most commonly used in technology, the values typically assumed are q1 = 1.5, q2 = 1.0 and q3 = q12 = 2.25 [7,10]. According to the approach presented in [11,12,13], Tvergaard’s coefficient values were bound to the elastic and strength properties of the material.
The parameter determining the material microstructure in the GTN model is its porosity, defined by the void volume fraction f. In the unloaded condition, the material is characterised by the initial void volume fraction f0. Its value influences the change in the share of voids during the deformation process in line with the function describing the changes of the modified void volume fraction f*:
where fc is the critical void volume fraction corresponding to the beginning of their coalescence, and fF is the void volume fraction at which there is a complete loss of stress carrying capacity in the material.
Any change of the current value of the modified void volume fraction is in reality dependent on microstructure parameters fc and fF, which directly determine the material structure damage process. The first of these is the critical void volume fraction fc, which corresponds to the beginning of void coalescence and is observed at the moment the material nominal strength drops. The second value fF determines the volumetric share of voids achieved in the moment of complete failure of the material.
2.2. Numerical Simulation of a Structural Component with a Defect Subjected to Tension
Within the scope of the conducted research, an analysis of a part of a structural component was conducted, in which a structural discontinuity was modelled in the form of a hole. It was assumed that the component was made of S235JR steel, which is the basic grade used for the manufacture of structural components in structural engineering. Conducted were numerical calculations, during which an analysis was performed of the strength of the component based on the GTN material model. This permitted a simulation of the increase of microstructure defects during the progress of deformation and their influence on the strength of the material and the load-carrying capacity of the component. This also permitted the estimation of the moment of the material failure, and, in the end, of the destruction of the component.
The first stage of research encompassed the determination of the fundamental mechanical parameters of S235JR steel, which are given in Table 1. Based on static tensile testing and results included in [14], assumed was the following approximation model σ(ε) for S235JR steel:
where ε is the strain, ε0 is the strain at yield limit, ε1 is the strain at the beginning of hardening, σ is the stress, σ0 is the yield limit, σ1 is the stress at the beginning of hardening, σ01 is the initial stress at the beginning of the nonlinear part of the approximation curve, E is the modulus of elasticity and N is the hardening exponent.
The hardening curve of Equation (3) was obtained based on the tensile uniaxial tests of S235JR steel [14]. It is in good agreement with classic elastic–plastic models taking into consideration the material yielding (flow). The proposed hardening curve was validated up to the range of maximal nominal stress, which corresponded to nominal strains of over 160%.
The next stage encompassed the execution of initial numerical calculations for a component with a defect. In the study, one basic type of corrosion pit was considered. It should be mentioned here that from a practical point of a view, it is worth analysing not fully formed corrosion pits due to the change of the stress state in their region. It is expected that the similar processes in this case may also be observed but of less intensity. The main objective was an analysis of the distribution of stress and the development of voids in conjunction with the estimated moment of the material damage, meaning, S235JR steel. Analysed was a component in the form of a plate subjected to tension, in which a central hole was made modelling a crosswise corrosion pit. It corresponded to the element utilised in the literature for fracture characterisation as well as structural simulations of materials (e.g., [15,16]). The geometry and load of the component are shown in Figure 2. The analysis was conducted in a quasi-static range, utilising a controlled increase of deformation of the upper component surface. The analysis was conducted assuming an increase of displacement ∆l of the free edges of the steel sheet (Figure 2b) with a controlled deformation speed of 1 s−1, corresponding to the speed of deformation v = 40 mm/s, simulating a sudden overload of the component.
Calculations were conducted using the Abaqus version 6.10 developed by Dassault Systèmes Simulia Corp. (Providence, RI, USA), with the use of explicit dynamic analysis. Utilising the symmetry of the component, only a quarter of it was modelled (Figure 2b). The numerical model is shown in Figure 3. In order to model properly the degrees of freedom, for the bottom surface (fracture plane), they direction, which is in accordance with the load direction, was fixed and the x and z directions were free, while for the left surface, the x direction was fixed and the y and z directions were free.
In order to conduct an analysis of the phenomena taking place across the thickness of the component, assumed was a three-dimensional calculation finite element model of type solid C3D8R. The density of the finite element mesh was assumed based on the so-called characteristic length. It describes the minimum dimensions of finite elements modelling the structure of materials, in which microdefects develop. According to the assumption of this method, the linking of two or more holes formed from coalescing inclusion colonies leads to fracture. Thus, a macrocrack formation only occurs when shear localises between multiple clusters, while void growth expands the cluster of inclusion colonies. The size of these inclusion colonies represents the length scale and is visible in a fractograph [14]. The characteristic length for S235JR steel was assumed according to [14] to be approximately 250 µm, which constituted a reference value. The size of the 3D finite elements (side lengths) was assumed to be 500 µm, constituting twice the required dimensions.
The possibility of the application of mesh-free methods for ductile fracture modelling should also be mentioned here. In this regard, the smoothed particle Galerkin (SPG) method, which has been recently introduced for solid mechanics applications, is particularly interesting. The basic SPG method key is to augment the standard functional by a penalty term leading to the dual stress points algorithm for particle integration [17]. This method can be successfully used to simulate different failure processes, even for simulation of three-dimensional metal grinding done by Wu et al. [18].
Assumed was a GTN porous material of parameter values determined and presented in the author’s earlier studies [12,13,14,19,20]. The homogenised microstructural parameters were defined for the GTN material model. According to this model, a void exists physically in a unit cell of a material. The void volume fraction f is defined as f = Vv/V, where Vv is the volume of the voids and V is the volume of the material. Thus, the void volume fraction f is described as randomly distributed cavities. The series of experiments and numerical simulations were done in order to validate GTN parameters. Smooth and notched round specimens of different notch radii subjected to tension were used. The initial stress triaxiality ranged from 1/3, and from 0.556 up to 1.345, which allowed consideration of both uniaxial and triaxial stress states. The GTN model parameters used at this stage of simulation are listed in Table 2.
The key parameter in the GTN model determining the softening of the material and, as a result, the reduction of its strength is developing voids described by the current volumetric fraction f*, which is the void volume fraction (VVF) parameter. The reduction of the material strength is conditioned upon its critical value fc, and the ultimate failure is mainly dependent on the critical void volume fraction fF.
In general, the critical value fF is defined as the value of the void volume fraction at the moment of complete failure of the material [8]. Its value differs depending on the type and structure of the material and the stress condition that is found during the damage process. The value fF is determined in various ways. Utilised are experiments, where the value of fF is determined directly by sample fractures with the usage of metallographic methods [19,20,21,22]. A different approach is the numerical determination of the value of fF along with other GTN parameters, calibrating them based on experimental research results [23,24,25,26,27] (e.g., as a stress–strain curve).
Fundamental influence on the stress condition is exerted by the course of material damage, including structural steels such as S235JR steel, requiring the consideration of stress parameters in the description of such processes. Due to the spatial character of the emerging phenomena, a useful parameter is stress triaxiality T, which binds in itself the product of the stress components in three directions with effective stress as
where σm = (σ11 + σ22 + σ33)/3 is the hydrostatic stress, and σe is the effective stress.
The fundamental objective of the first part of the numerical analysis was the determination of the stress condition that is found in the critical area, where the material is subject to damage. For this purpose, analysed were distributions of stress and, further on, values of stress triaxiality T in the component fracture plane (Figure 3). The finite element, where the most intense development of damage and the highest gradient of stress triaxiality T was observed, is shown in Figure 4.
An analysis was conducted of the changes of the value of T and VVF during deformation, ranging from the beginning of load application to the moment of void nucleation. In this regard, the typical, validated S235JR value of the critical void volume fraction fF = 0.667 was used in order to analyse these relations. The results of the analysis allowed for determining the value of fF representing the void fraction observed at the time of rupture of S235JR steel in the considered case, based on the relations determined experimentally and presented in the study [22]. As may be inferred from the curve in Figure 5a, the stress triaxiality in the discussed range fluctuated at T = 0.4−0.6.The change of T was directly related to the change in the prevailing state of stress in the area subjected to significant plastic deformations, in the range after exceeding the yield point. It was related to the increasing share of normal stresses acting in the transverse directions to the load direction of the analysed element. On the basis of the material damage model assumed in the analysis, as shown in Figure 5b, it was assumed that the degradation process begins with a strain of ε = 0.07 (Figure 5a). This corresponds to T = 0.6.
Study [22] analysed the relationship between the initial level of stress triaxiality T0 and the critical value of the void volume fraction fF for components characterised by T0 = 0.556−1.345. Obtained was a diagram of the relationship of fF (T0) as the function shown in Figure 6.
As can be seen, assuming a linear relation of fF (T0), two ranges can be differentiated between them. The first range spans values of T0 = 0.556−0.739, meaning that the range covering the value of T = 0.6 was of interest to us. By linear interpolation of the value of fF (T0) based on fF = 0.022984 and T0 + 0.683728, for T = 0.6, the value of the critical void volume fraction was determined at fF = 0.6975. This value was assumed for the fundamental load-carrying capacity analysis as the reference value for the void volume fraction that determines the total failure of the material.
The main body of research was conducted for the same component modelling the damaged structure part (Figure 2). Its main objective was the execution of an analysis of the process of the development of microstructure damage based on the GTN model and the estimation of the moment of material failure, and as a result, of the component.
An analogous numerical simulation was conducted as during the research conducted at the first stage, the objective of which was the determination of the critical value of the void volume fraction fF, determining the failure of S235JR steel.
In particular, considering the results of research on initial porosity [28,29] and metallurgical requirements for S235JR steel discussed in [30], assumed was a mean value of the initial void volume fraction of f0 = 0.001. The Tvergaard’s coefficients were determined based directly on the relations proposed by Faleskog et al. [11]. The authors linked values of qi with mechanical parameters of the material. On the basis of dependencies given in [11,12,13] in force with respect to the relation between the yield limit and Young’s modulus being σ0/E = 0.00155 and the hardening exponent of N = 0.195, Tvergaard’s coefficients qi were determined to be q1 = 1.91, q2 = 0.79 and q3 = 3.65. The critical void volume fraction was assumed to be fc = 0.06. Utilising the results of the analysis presented in the preceding paragraph, the critical void volume fraction at the moment of complete failure of S235JR steel was assumed to be fF = 0.6975. The assumed GTN microstructural parameters for GTN S235JR steel are shown in Table 3.
3. Results
In order to test phenomena taking place during deformation of the analysed component, attention was turned to an analysis of the distribution of plastic deformations in critical areas and their relation to changes in the VVF and T values. This permitted an analysis of the process of damage of S235JR steel and the estimation of the moment of its decohesion. As the damage criterion, assumed was a local equivalent critical plastic strain εecrpl = 1.4, registered at the time of failure of the elongated sample with a circular cross section. Detailed results of this analysis are shown and discussed below.
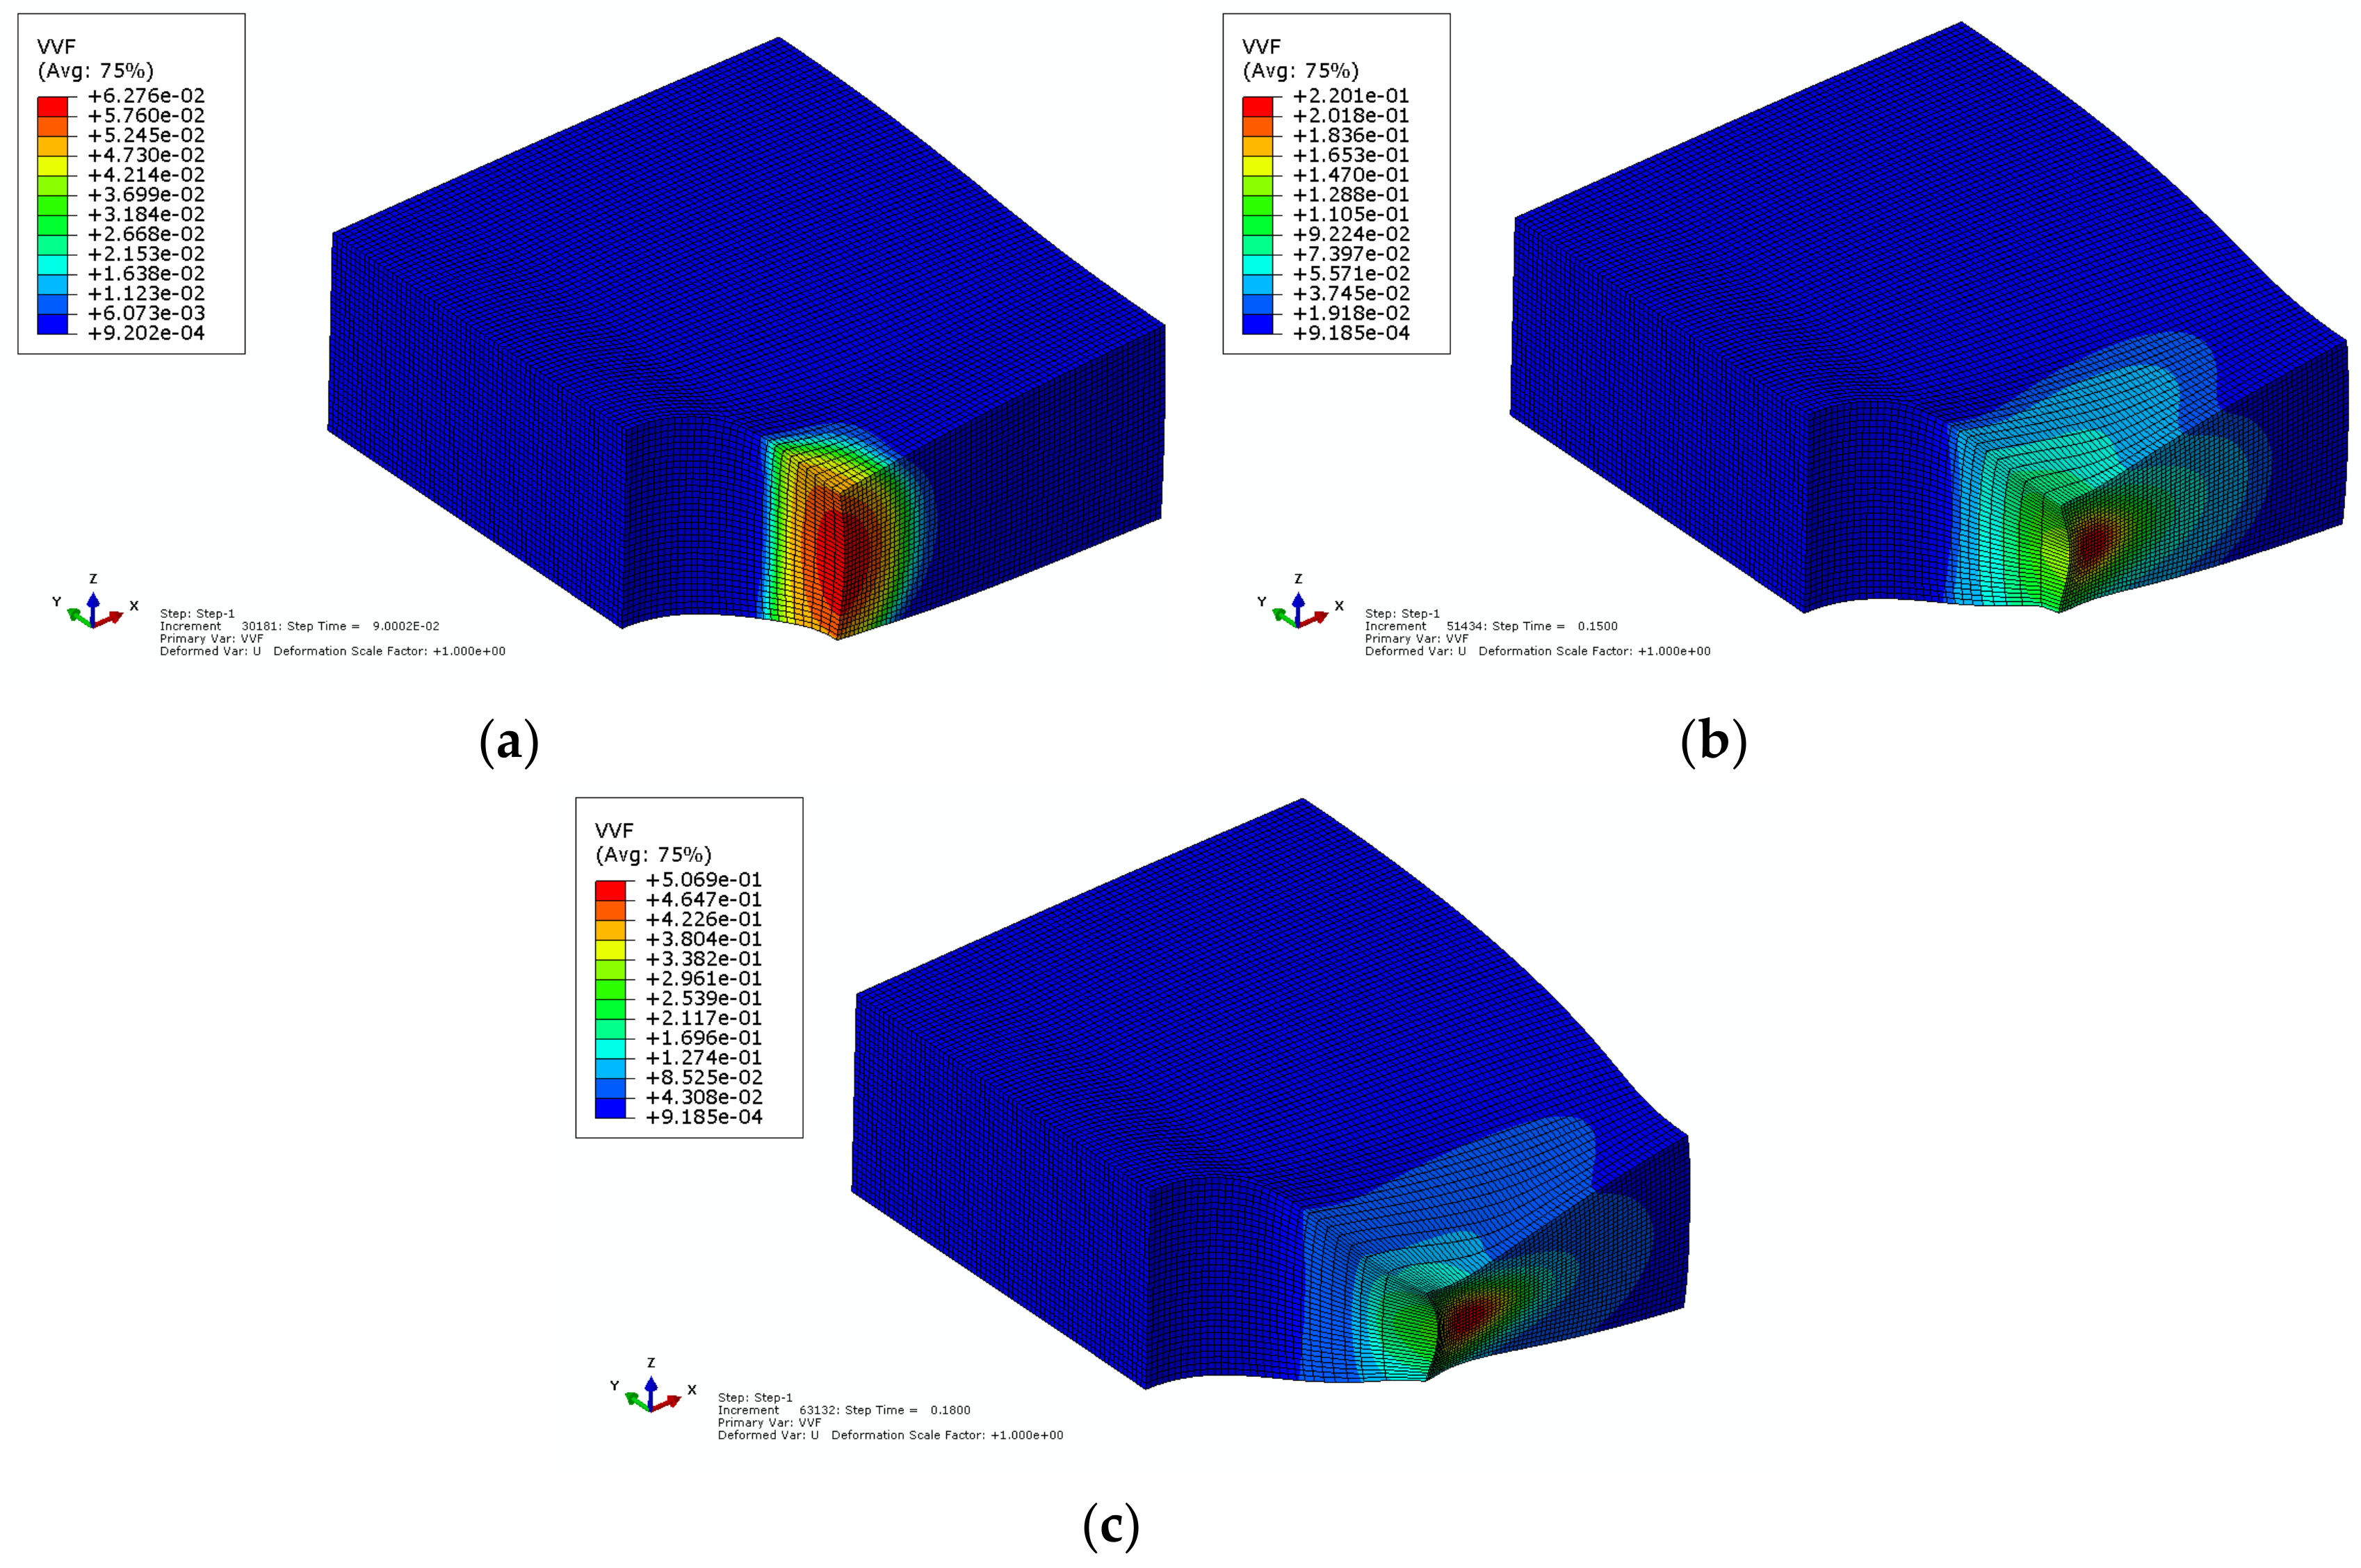
It must first be noted that the initiation of microdamages took place in an area adjacent to the lower plane of the component (the numerical model) and the wall of the hole. This corresponded to estimates that suggest themselves considering the solutions of the problem determined in line with the theory of fracture mechanics. Equivalent plastic strain εepl accumulated in a small volume in the central part of the cross section, reaching their maximum values there (Figure 7). In this area, voids were also nucleated, with their volume fraction rising very quickly (Figure 8). At a subsequent stage of deformation, the epicentre of development of voids shifted towards the side wall of the component, as seen in Figure 8b,c, showing maps of distribution of VVF for nominal strains of ε = 0.15 and ε = 0.18, corresponding to the final phase of deformation of the component.
Extreme values of stress triaxiality in turn were observed in the upper area of the hole (see Figure 2b), where they reached minimum values, and in an area located in the central part of the cross section, where they were highest (Figure 9). The area where T reached the upper extreme aligned with the area where the development of voids was greatest—where VVF values were highest (Figure 8b,c).
4. Discussion
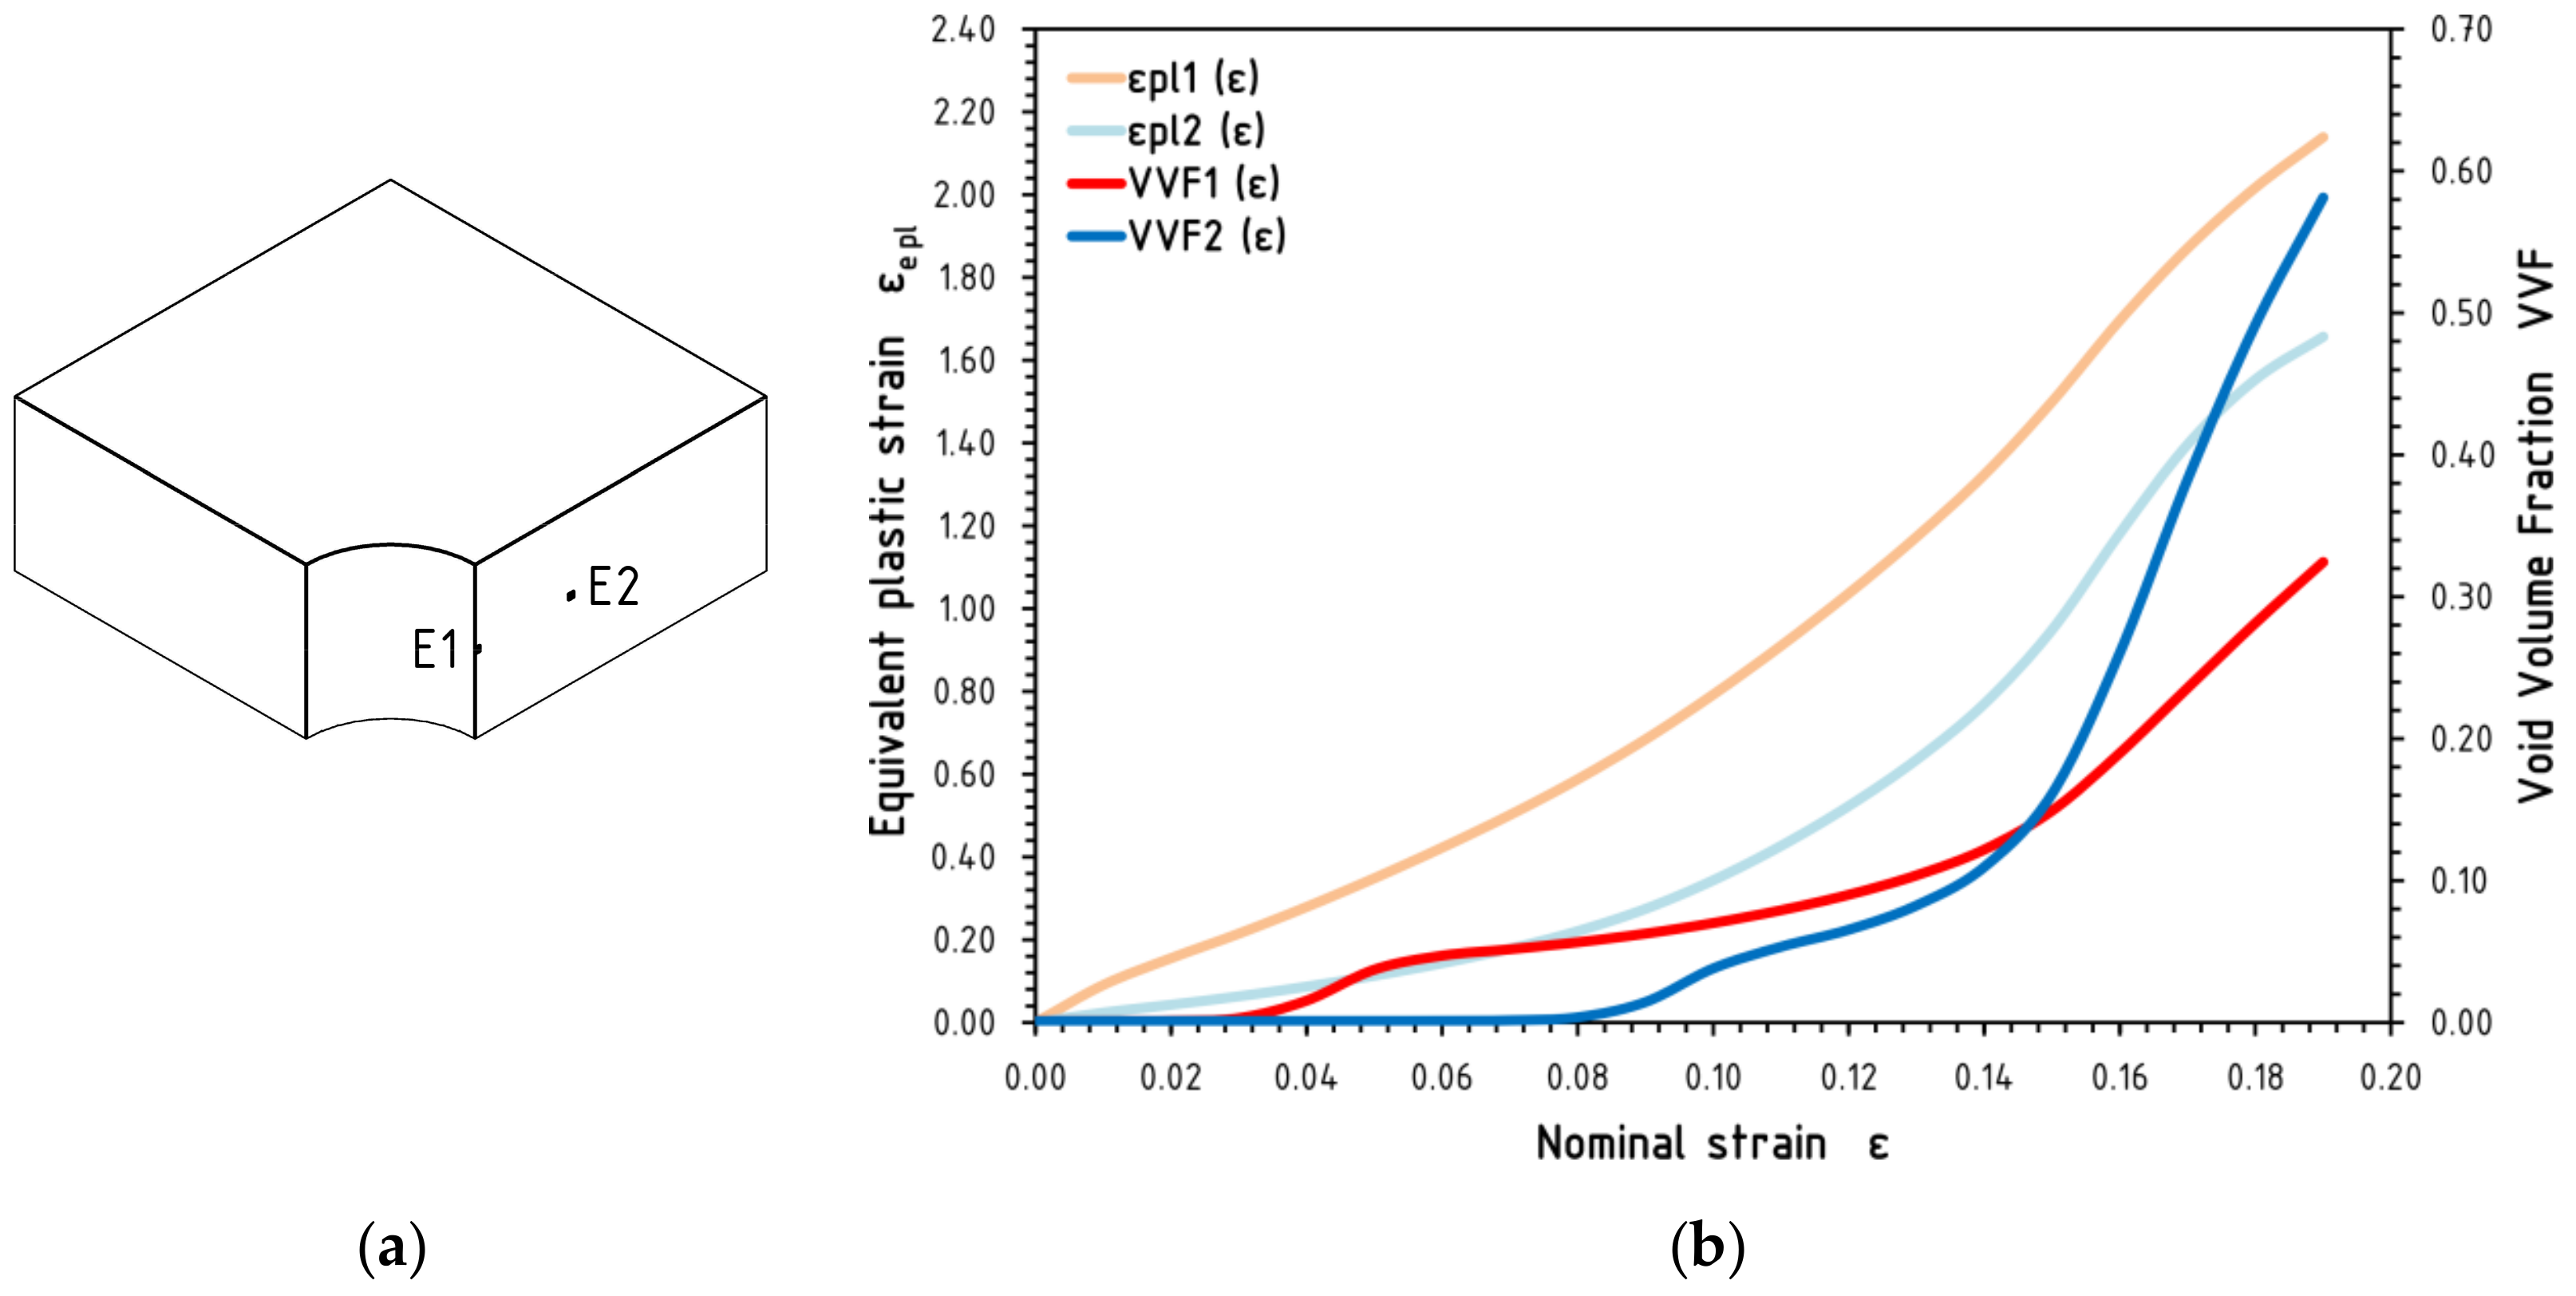
The obtained simulation results permitted the location of areas where one can expect the initiation of the material damage process leading to macroscale component destruction. For this purpose, a strength diagram for nominal stress over nominal strain σ(ε) was created for the calculated component. Analysed were phenomena that took place at the individual stages of material deformation, in particular, during its plastic deformation. In analysing the maps of equivalent plastic strain distributions (Figure 7) of the void volume fraction VVF (Figure 8) and the stress triaxiality T (Figure 9), diagrams of these changes over nominal strain were created for two characteristic areas. These results are presented in Figure 10b–d for finite elements marked as E1 and E2 (Figure 10a).
Analysed were diagrams shown in Figure 10b,d, which refer to the 3D equivalent plastic strain maps εepl, the void volume fraction VVF and the corresponding maps of the stress triaxiality T for characteristic nominal strain levels ε, from the first phase of plastic deformation of S235JR steel (beginning of hardening, ε = 0.02) through achievement of component load-carrying capacity (maximum σ, ε = 0.07) and all the way to the phase of microdefect initiation (ε = 0.12) and the total loss of capacity of the material (ε = 0.15−0.18).
During progressive deformation, and in particular during the material plastic deformation phase, an evolution of microdefects was observed in the area subject to significant strain, which is clearly shown in the diagram of changes of the VVF determined for finite element E1 (curve marked in Figure 10b,c as VVF(ε)-E1). This phenomenon was already observed by this author and was described in [31,32]. Initially, the most intense development of voids was observed in the area covering the surface of the hole (Figure 8a); however, later on, the centre of development of voids shifted towards the free side (Figure 8b,c). For nominal strain ε = 0.09 corresponding to maximum stress σmax, the maximum void volume fraction at element E1 was VVF = 0.062 (Figure 10b,d), and this value was close to the critical fraction fc. With respect to the stress triaxiality of T, initially, its maximum values were observed in an area covering the underside of the analysed component but at a certain distance from the hole edge (Figure 9a).
At a later stage, all the way to failure, the maximum strain (deformations) took place in an area adjacent to the hole wall. The development of microdefects, in turn, covered elements adjacent to this area, with the maximum growth of voids being observed slightly farther, towards the outer side. This area covered the layer adjacent to the lower plane of the analysed numerical model at the finite element marked as E2 (Figure 10a). The maps shown in Figure 7b,c clearly show that at a later stage of deformation, the areas where maximum values of equivalent plastic strain εepl are found did not overlap with areas where maximum VVF values were found.
In the discussed scope of material deformation, observed was an analogous phenomenon, with respect to the development of microdefects, concerning the evolution of the area, in which the concentration of stress occurred. The epicentre, where the maximum values of the triaxiality of stress T were found, shifted towards the free side (Figure 9b,c). The observed phenomenon is analogous to the evolution of microfractures observed in tensile round samples, in particular, in the case of a distributed state of stress. In the first stage, the development of microdefects was observed on the outside of elements in order to cover, in the final stage of destruction, the central part of the cross section in the fracture plane [31,32].
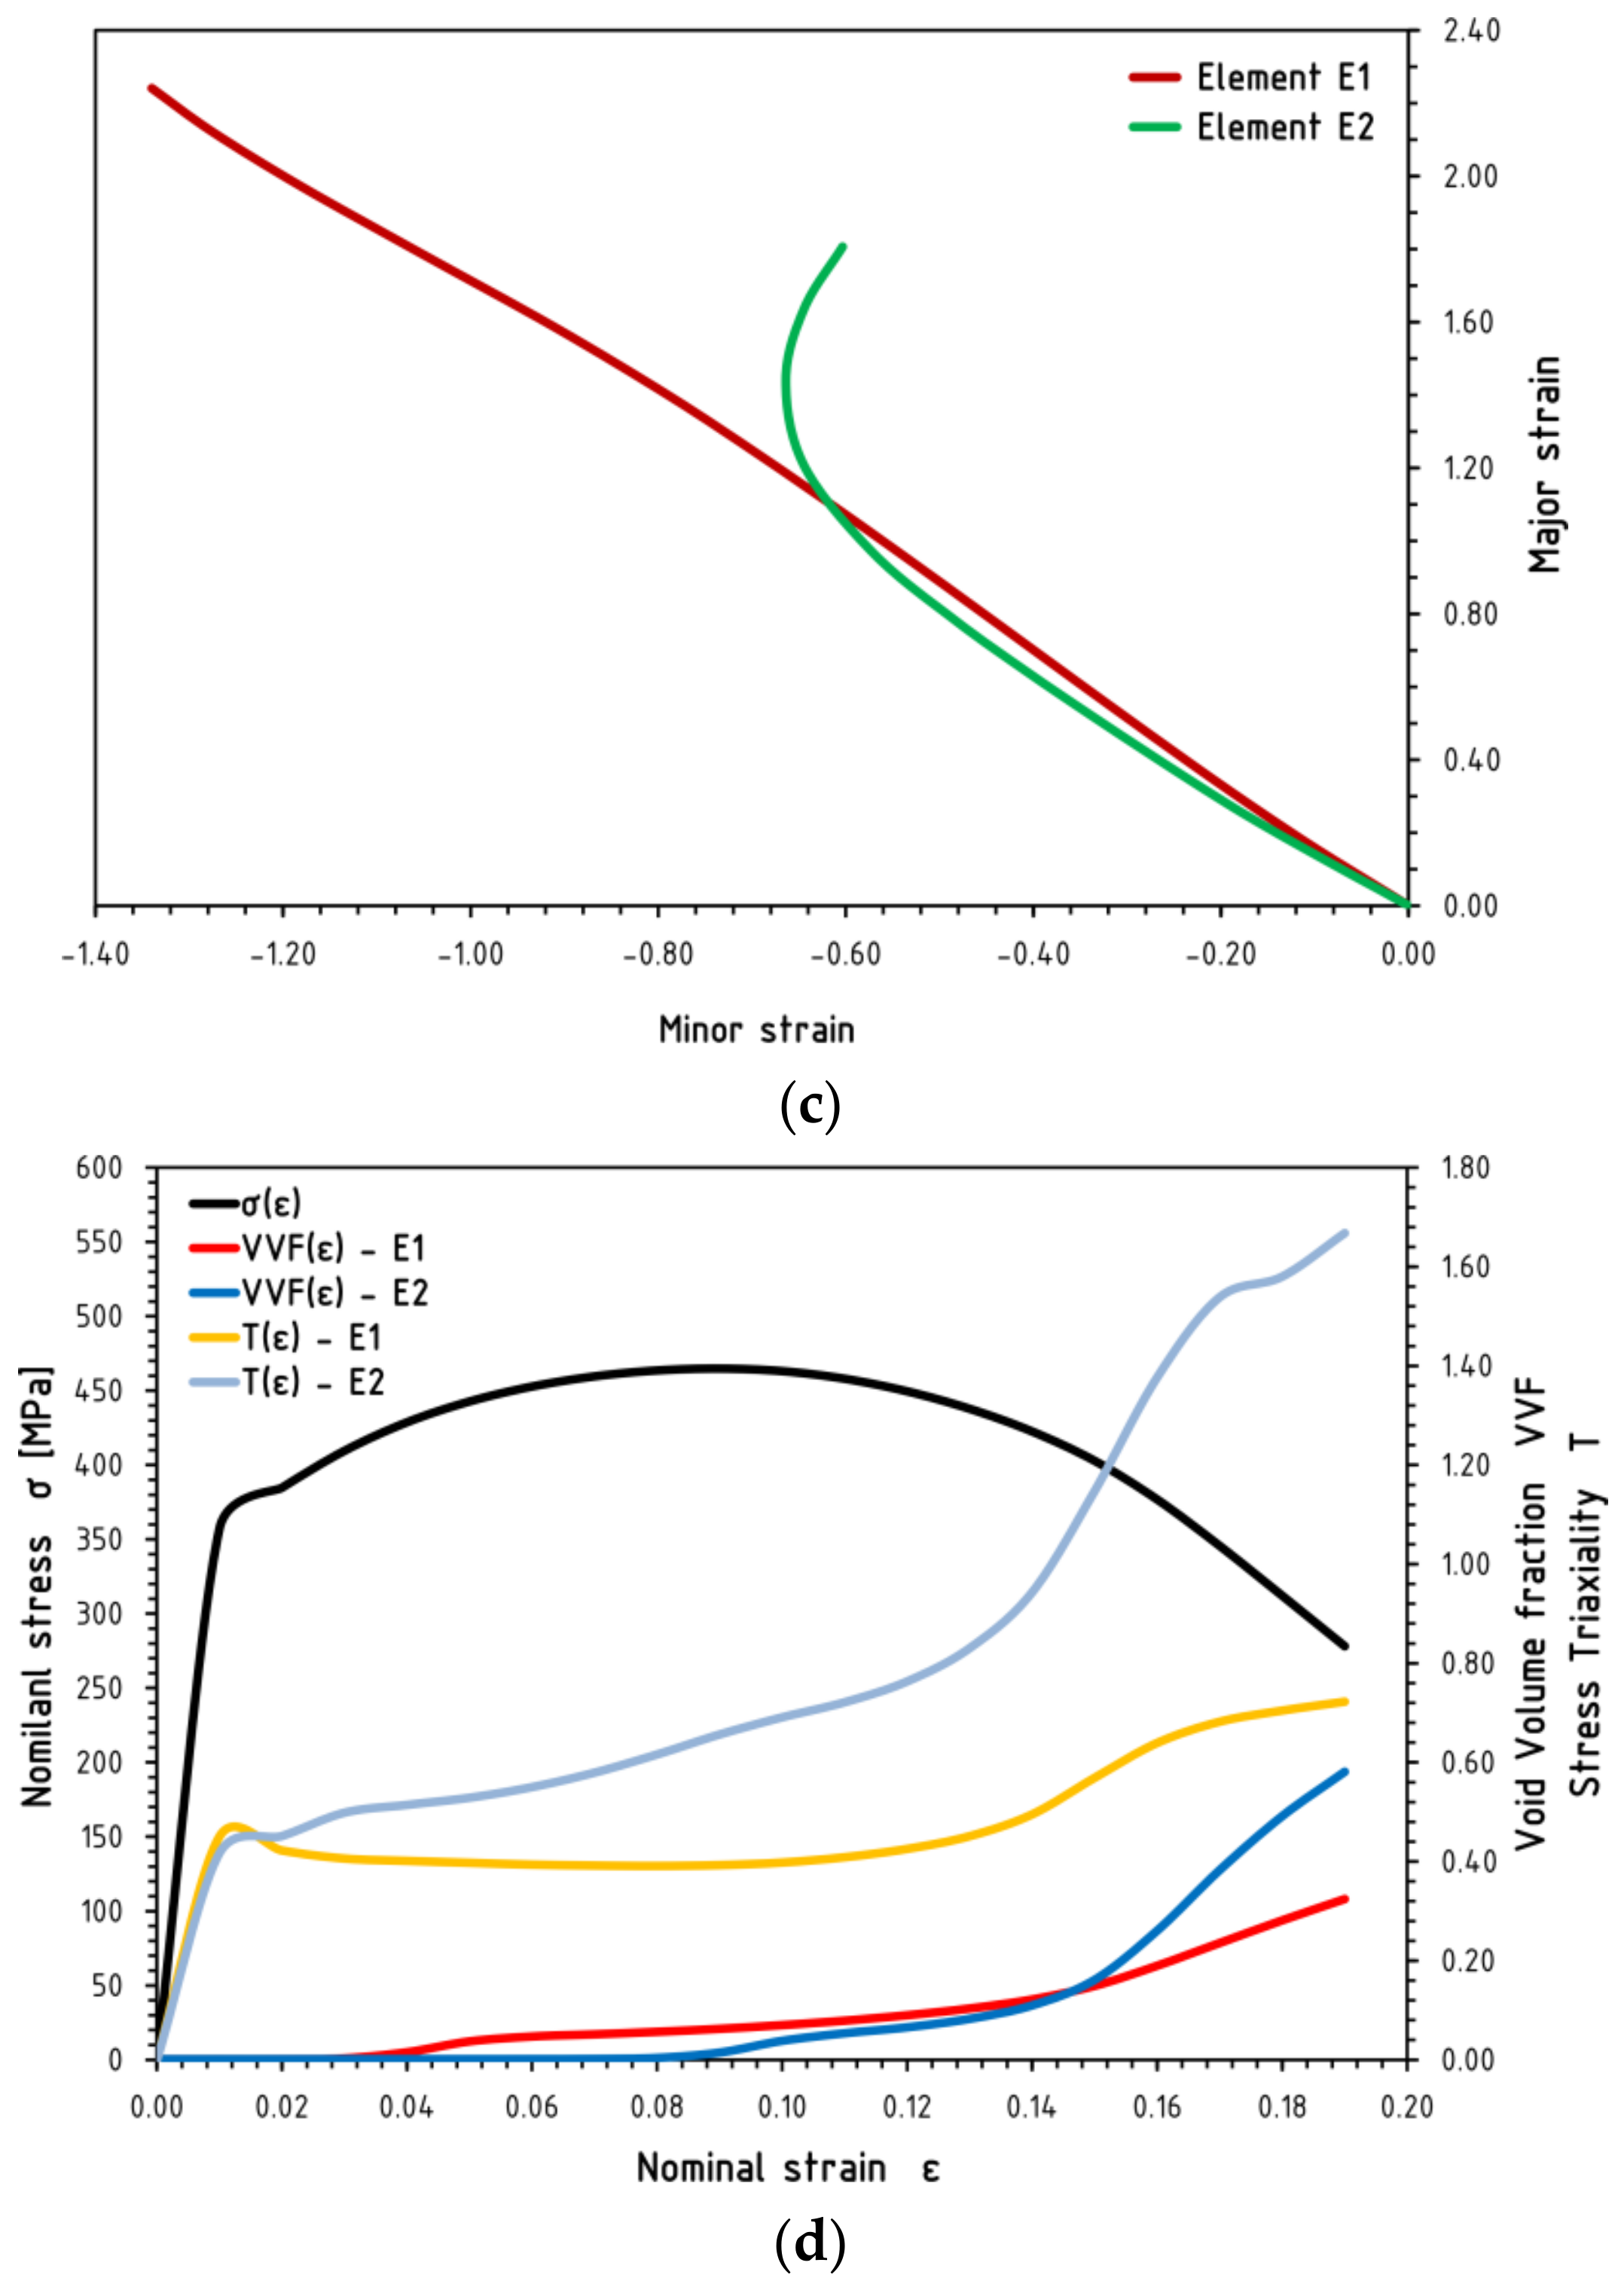
The most important phenomenon observed spanning the analysis of the process of the material damage was the significant relationship that emerged between the size of developing (increasing) microdefects and the changes in the stresses in the area where this occurred. This is clearly seen in the maps of parameters VVF and T shown in maps in Figure 8 and Figure 9. The damage location was strictly connected with the prevailing stress state in the area of the bottom surface (i.e., the changes of the principal stresses σ1, σ2 and σ3). In terms of plastic deformation of the material, maximum values of T were observed in the area, where intense development and growth of microfractures occurred. This effect may also be observed in the diagram of changes of the void volume fraction VVF and of the stress triaxiality T shown in Figure 10d. One clearly sees here changes to the stresses in the analysed area. This applies in particular to the area where voids grew most intensely (element E2). This applies to the increase in the stress triaxiality T, rising ever more intensely at the moment of nucleation and development of microdefects for strain of ε = 0.07−0.11. At a subsequent stage of plastic deformation, one can observe a sudden change of the state of stress, the result of which was a significant increase of the value of T, following, in a sense, the increase of the void volume fraction VVF. As a result of the exhaustion of material strength the moment porosity was achieved at VVF ≈ 0.6, there occurred a significant, natural so to speak, drop in stress.
It can thus be seen that the analysis of the evolution of microfractures in conjunction with changes to the state of stress permitted the registration of the critical moment of failure of the material until its decohesion. Assuming the strain criterion of failure of S235JR steel expressed through critical equivalent plastic strain εe crpl = 1.4, it can be seen that in the area where the most intense development of voids was seen (area located deep in the fracture plane), the critical level of the void volume fraction assumed a value of VVF = 0.40−0.50 (element E2, Figure 10b). It may thus be assumed that the physical destruction of the component will take place when the void volume fraction reaches a value of VVF > 0.50, and the destruction will be initiated in the layer adjacent to the lower plane of the analysed model (half of the height of the real component) in the direct vicinity of the hole wall. The value of the void volume fraction of VVF ≈ 0.50 observed at the moment of destruction and determined based on the deformation criterion was close to the value of VVF ≈ 0.60, which was determined earlier as a result of the conducted stress level, and more precisely, the relationship at the moment of destruction between the stress triaxiality T and the void volume fraction VVF.
Void coalescence reached a large size, which affected the global response of structural elements. This was confirmed for specimens made of S235JR steel, where the void fraction was determined in failure surfaces even up to over 70% [22]. In the case of the considered element, this can be clearly seen in the maps of VVF parameters shown in Figure 8. As we can see in Figure 8c, for the time slightly prior to globally observed damage, the volume of void coalescence included a significant volume of the material.
It should be also noted that a change of hole diameter or element thickness would have slightly impacted the outcomes of this study in terms of the critical location where fracture initiated. The critical location would be changed significantly in the case of the group of holes or holes of different shapes (e.g., ellipsoid or notch-shaped holes).
The presented study results were obtained from the numerical simulations. Typical validation involves experimentally testing the considered element in order to determine the critical void volume fractions at the time of the material rupture and total destruction of the element. Scanning the area where the expected microdamage should be the most intensive is the best way to verify the numerical results. Another possible validation is to use another material model. Taking into consideration the studies published recently, in the case of ductile fracture, which is typical for S235JR steel, good agreement was observed in simulations conducted by using the Bai–Wierzbicki material model [33]. The results presented in [34,35] give us confidence for achieving a reliable result.
5. Conclusions
To summarise the results of the conducted simulation, one must note the fundamental influence of the evolution of microdefects in the material structure (voids) on processes taking place in the material at the macroscale. Fundamental to this is the change in the existing stress level in the area of initiation and growth of voids, causing an increase of the parameter binding in itself the spatial stress condition, that is, the stress triaxiality T. As the plastic deformation process of the analysed S235JR steel progressed, the value of T increased gradually, reaching its maximum at the moment of material failure. These processes must be related to the location of microdefect initiation as determined based on observations of values and changes of the void volume fraction. On the basis of an analysis of this parameter, a subsequent important result is the possibility of the detection of areas where material damage can be expected. An analysis of the stress condition in relation to the location of areas of nucleation and growth of microdefects (voids) in real structural components permits the estimation of the progress of the material failure process. This is uniquely important from the practical point of view, as it permits the estimation of the limit load of the damaged component, as well as the determination of the point of initiation of the damage process, leading to destruction.
In summary, the main conclusions are as follows:
- The critical time to material failure may be predicted based on the analysis of the evolution of microdefects (voids) in conjunction with changes to the state of stress.
- For the considered element, the area where the most intense development of voids was seen was detected using the strain criterion of failure of S235JR steel expressed through critical equivalent plastic strain εe crpl = 1.4. The corresponding critical level of the void volume fraction was in the range of values from 0.40 to 0.50.
- The physical destruction of the component is expected when the void volume fraction reaches a value of above 0.50. The destruction of the component was detected in the layer adjacent to the lower plane of the analysed model, in the direct vicinity of the hole wall.
- The discussed critical value of the void volume fraction of about 0.50 observed at the time of element destruction was close to the value 0.60, which was determined based on the analysis of the relationship between the stress triaxiality and the void volume fraction.
Funding
This research received no external funding.
Conflicts of Interest
The author declares no conflict of interest.
References
- Kocańda, S. Fatigue Failure of Metals, 3rd ed.; Wydawnictwa Naukowo-Techniczne WNT: Warszawa, Poland, 1985. [Google Scholar]
- Neimitz, A. Fracture Mechanics, 1st ed.; Wydawnictwo Naukowe PWN: Warszawa, Poland, 1998. [Google Scholar]
- Abbassi, F.; Mistou, S.; Zghal, A. Failure analysis based on microvoid growth for sheet metal during uniaxial and biaxial tensile tests. Mater. Des. 2013, 49, 638–646. [Google Scholar] [CrossRef]
- Nguyen, T.H.A.; Bui, T.Q.; Hirose, S. Smoothing gradient damage model with evolving anisotropic nonlocal interactions tailored to low-order finite elements. Comput. Meth. Appl. Mech. Eng. 2018, 328, 498–541. [Google Scholar] [CrossRef]
- Nguyen, T.-T.; Waldmann, D.; Bui, T.Q. Role of interfacial transition zone in phase field modeling of fracture in layered heterogeneous structures. J. Comput. Phys. 2019, 386, 585–610. [Google Scholar] [CrossRef]
- Gurson, A.L. Continuum theory of ductile rupture by void nucleation and growth: Part I—Yield criteria and flow rules for porous ductile media. J. Eng. Mater. Technol. 1977, 99, 2–15. [Google Scholar] [CrossRef]
- Tvergaard, V. Influence of voids on shear band instabilities under plane strain conditions. Int. J. Fract. 1981, 17, 389–407. [Google Scholar] [CrossRef]
- Tvergaard, V.; Needleman, A. Analysis of the cup-cone fracture in a round tensile bar. Acta Metall. Mater. 1984, 32, 157–169. [Google Scholar] [CrossRef]
- Nahshon, K.; Hutchinson, J.W. Modification of the Gurson Model for shear failure. Eur. J. Mech. A Solids 2008, 27, 1–17. [Google Scholar] [CrossRef]
- Tvergaard, V. Material failure by void growth to coalescence. Adv. Appl. Mech. 1989, 27, 83–151. [Google Scholar]
- Faleskog, J.; Gao, X.; Shih, C.F. Cell model for nonlinear fracture analysis—I. Micromechanics calibration. Int. J. Fract. 1989, 89, 355–373. [Google Scholar] [CrossRef]
- Kossakowski, P.G. The analysis of influence of Tvergaard’s parameters on S235JR steel response in high stress triaxiality. Adv. Mater. Sci. 2012, 12, 27–35. [Google Scholar] [CrossRef]
- Kossakowski, P.G. An analysis of the Tvergaard parameters at low initial stress triaxiality for S235JR steel. Pol. Marit. Res. 2014, 21, 100–107. [Google Scholar] [CrossRef]
- Kossakowski, P.G. Simulation of ductile fracture of S235JR steel using computational cells with microstructurally-based length scales. J. Theor. Appl. Mech. 2012, 50, 589–607. [Google Scholar]
- Abedini, A.; Butcher, C.; Worswick, M.J. Experimental fracture characterization of an anisotropic magnesium alloy sheet in proportional and non-proportional loading conditions. Int. J. Solids Struct. 2018, 144–145, 1–19. [Google Scholar] [CrossRef]
- Abedini, A.; Butcher, C.; Worswick, M.J. Application of an evolving non-associative anisotropic-asymmetric plasticity model for a rare-earth magnesium alloy. Metals 2018, 8, 1013. [Google Scholar] [CrossRef]
- Wu, C.T.; Koishi, M.; Hu, W. A displacement smoothing induced strain gradient stabilization for the meshfree Galerkin nodal integration method. Comput. Mech. 2015, 56, 19–37. [Google Scholar] [CrossRef]
- Wu, C.T.; Bui, T.Q.; Wu, Y.; Luo, T.-L.; Wang, M.; Liao, C.-C.; Chen, P.-Y.; Lai, Y.-S. Numerical and experimental validation of a particle Galerkin method for metal grinding simulation. Comput. Mech. 2018, 61, 365–383. [Google Scholar] [CrossRef]
- Kossakowski, P.G. Analysis of the void volume fraction for S235JR steel at failure for low initial stress triaxiality. Arch. Civ. Eng. 2018, 64, 101–115. [Google Scholar] [CrossRef]
- Kossakowski, P.G.; Wciślik, W. Effect of critical void volume fraction fF on results of ductile fracture simulation for S235JR steel under multi-axial stress states. Key Eng. Mater. 2014, 598, 113–118. [Google Scholar] [CrossRef]
- Wciślik, W. Experimental determination of critical void volume fraction fF for the Gurson-Tvergaard-Needleman (GTN) model. Struct. Integr. Procedia 2016, 2, 1676–1683. [Google Scholar] [CrossRef]
- Kossakowski, P.G. Experimental determination of the void volume fraction for S235JR steel at failure in the range of high stress triaxialities. Arch. Metall. Mater. 2017, 62, 167–172. [Google Scholar] [CrossRef]
- Cuesta, I.I.; Alegre, J.M.; Lacalle, R. Determination of the Gurson–Tvergaard damage model parameters for simulating small punch tests. Fatigue Fract. Eng. Mater. Struct. 2010, 33, 703–713. [Google Scholar] [CrossRef]
- Zhang, Z.L.; Thaulow, C.; Ødegård, J. A complete Gurson model approach for ductile fracture. Eng. Fract. Mech. 2000, 67, 155–168. [Google Scholar] [CrossRef]
- Aoki, S.; Amaya, K.; Sahashi, M.; Nakamura, T. Identification of Gurson’s material constants by using Kalman filter. Comput. Mech. 1997, 19, 501–506. [Google Scholar] [CrossRef]
- Springmann, M.; Kuna, M. Identification of material parameters of the Gurson–Tvergaard–Needleman model by combined experimental and numerical techniques. Comput. Mater. Sci. 2005, 32, 544–552. [Google Scholar] [CrossRef]
- Zhong, J.; Xu, T.; Guan, K.; Zou, B. Determination of ductile damage parameters using hybrid particle swarm optimization. Exp. Mech. 2016, 56, 945–955. [Google Scholar] [CrossRef]
- Kossakowski, P.G. Influence of initial porosity on strength properties of S235JR steel at low stress triaxiality. Arch. Civ. Eng. 2012, 58, 293–308. [Google Scholar] [CrossRef]
- Kossakowski, P.G. Effect of initial porosity on material response under multi-axial stress state for S235JR steel. Arch. Civ. Eng. 2012, 58, 445–462. [Google Scholar] [CrossRef]
- Polish Committee for Standardization. PN-EN 10025-2:2007 Hot-rolled structural steel: Part 2—Technical Delivery Conditions for Non-Alloy Structural Steels; Polish Committee for Standardization: Warsaw, Poland, 2007. [Google Scholar]
- Kossakowski, P.G. An analysis of the load-carrying capacity of elements subjected to complex stress states with a focus on the microstructural failure. Arch. Civ. Eng. 2010, 10, 15–39. [Google Scholar] [CrossRef]
- Kossakowski, P.G. Microstructural failure criteria for S235JR steel subjected to spatial stress states. Arch. Civ. Eng. 2015, 1, 195–205. [Google Scholar] [CrossRef]
- Bai, Y.; Wierzbicki, T. A new model of metal plasticity and fracture with pressure and Lode dependence. Int. J. Plast. 2008, 24, 1071–1096. [Google Scholar] [CrossRef]
- Keim, V.; Nonn, A.; Münstermann, S. Application of the modified Bai–Wierzbicki model for the prediction of ductile fracture in pipelines. Int. J. Press. Vessels Pip. 2019, 171, 104–116. [Google Scholar] [CrossRef]
- Wen, H.; Mahmoud, H. Simulation of block shear fracture in bolted connections. J. Constr. Steel Res. 2017, 134, 1–16. [Google Scholar] [CrossRef]
Figure 1.
Example of pitting corrosion in a structural component.
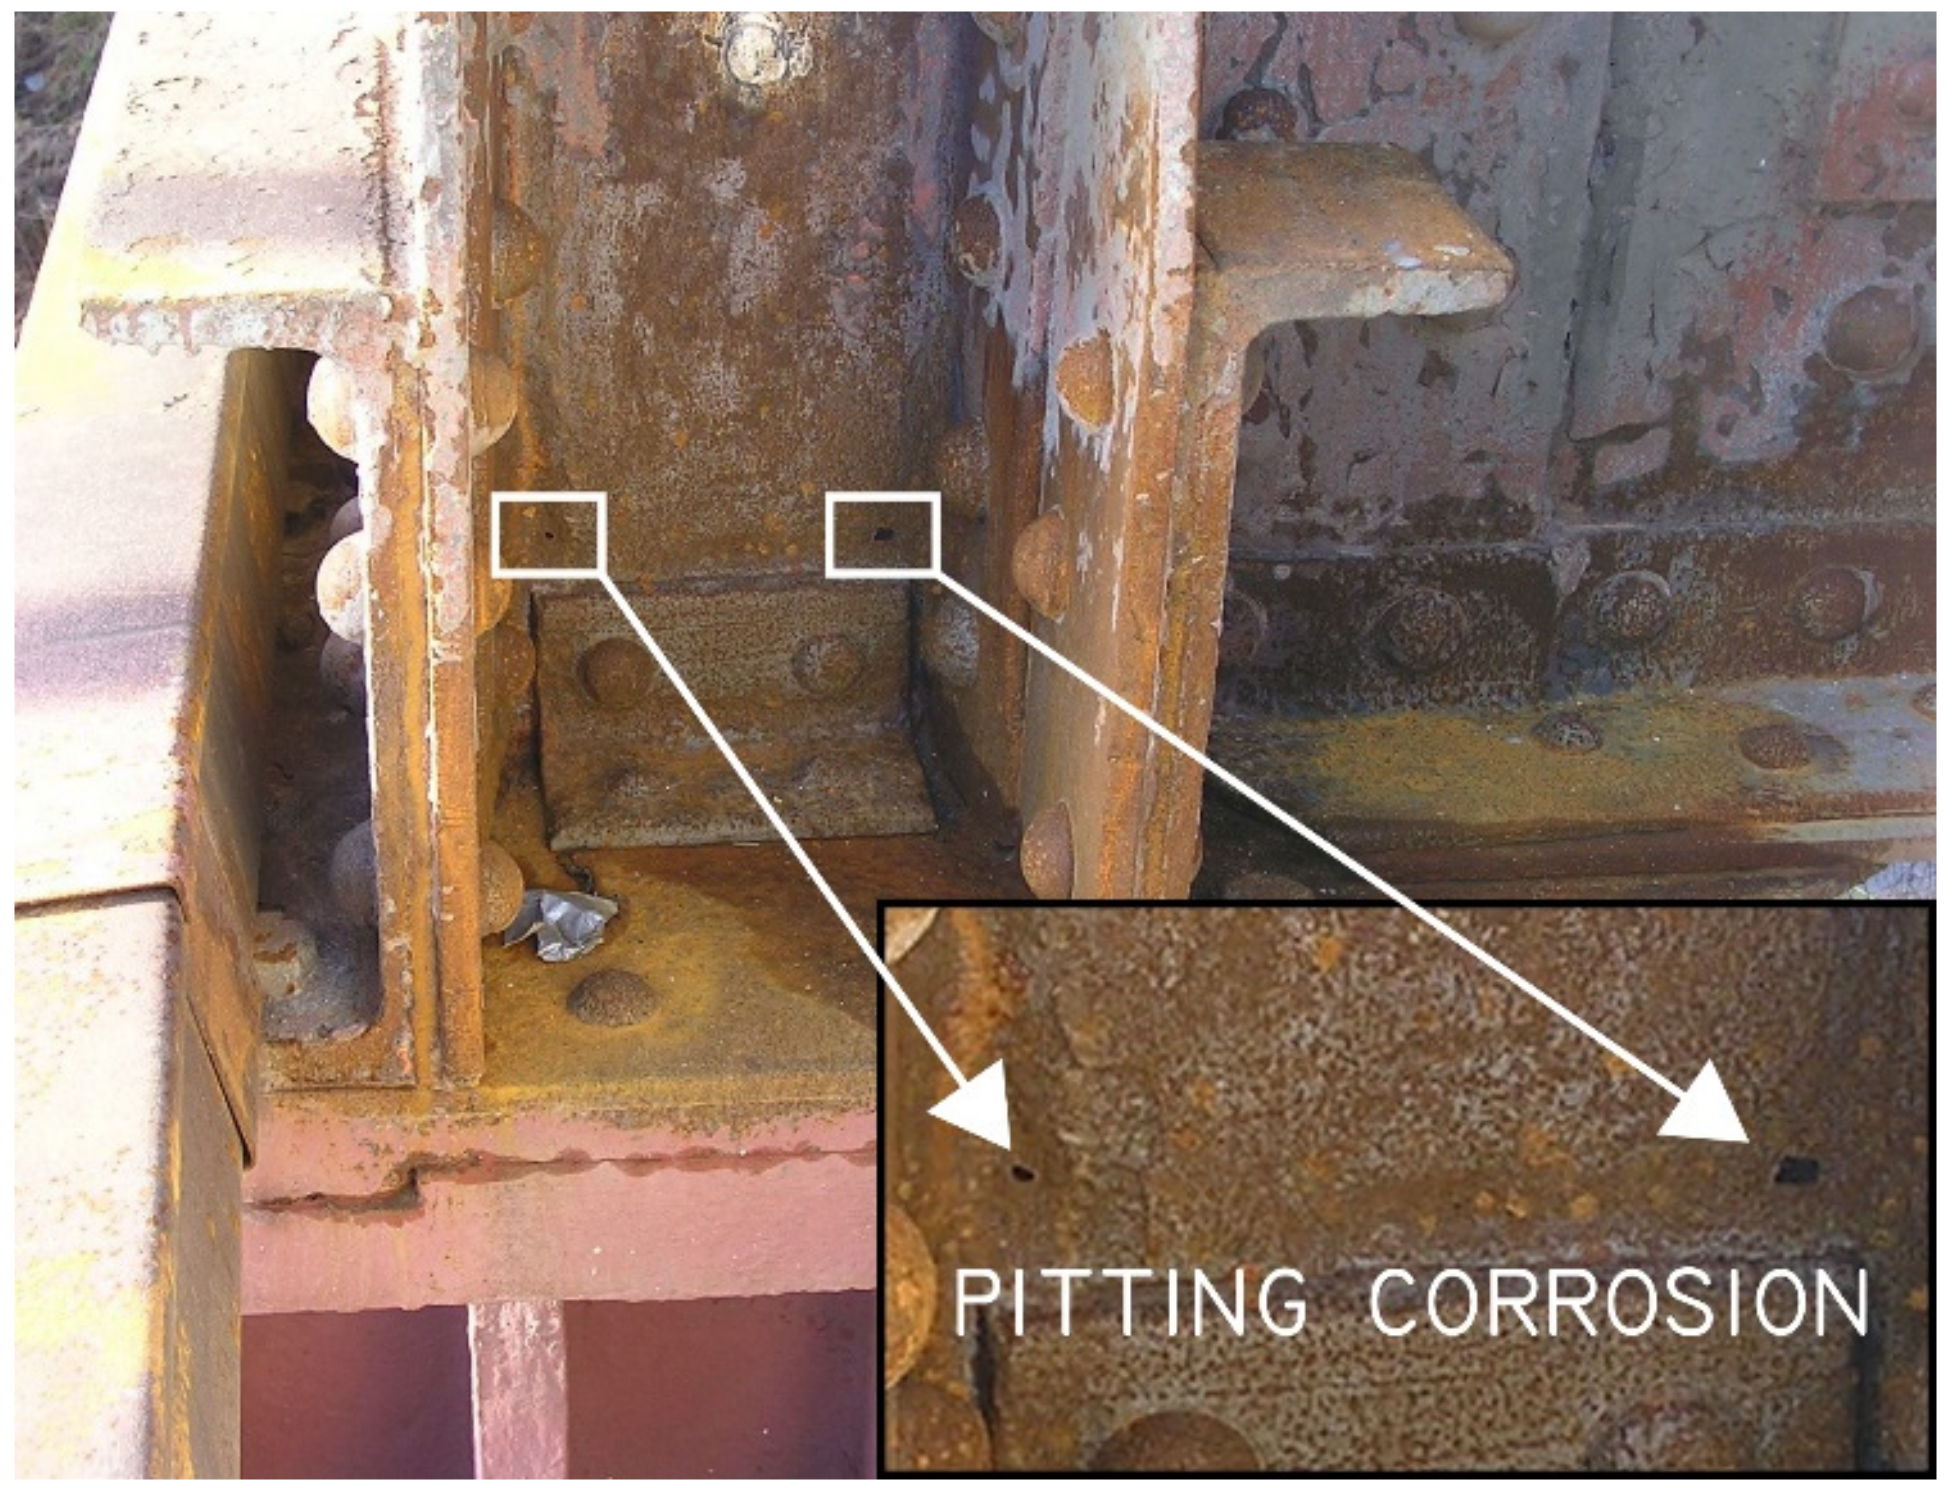
Figure 2.
(a) View of the structural component with the defect in the form of a central hole, which was the subject of simulations. (b) Geometry and load of the model of the analysed component.
Figure 2.
(a) View of the structural component with the defect in the form of a central hole, which was the subject of simulations. (b) Geometry and load of the model of the analysed component.
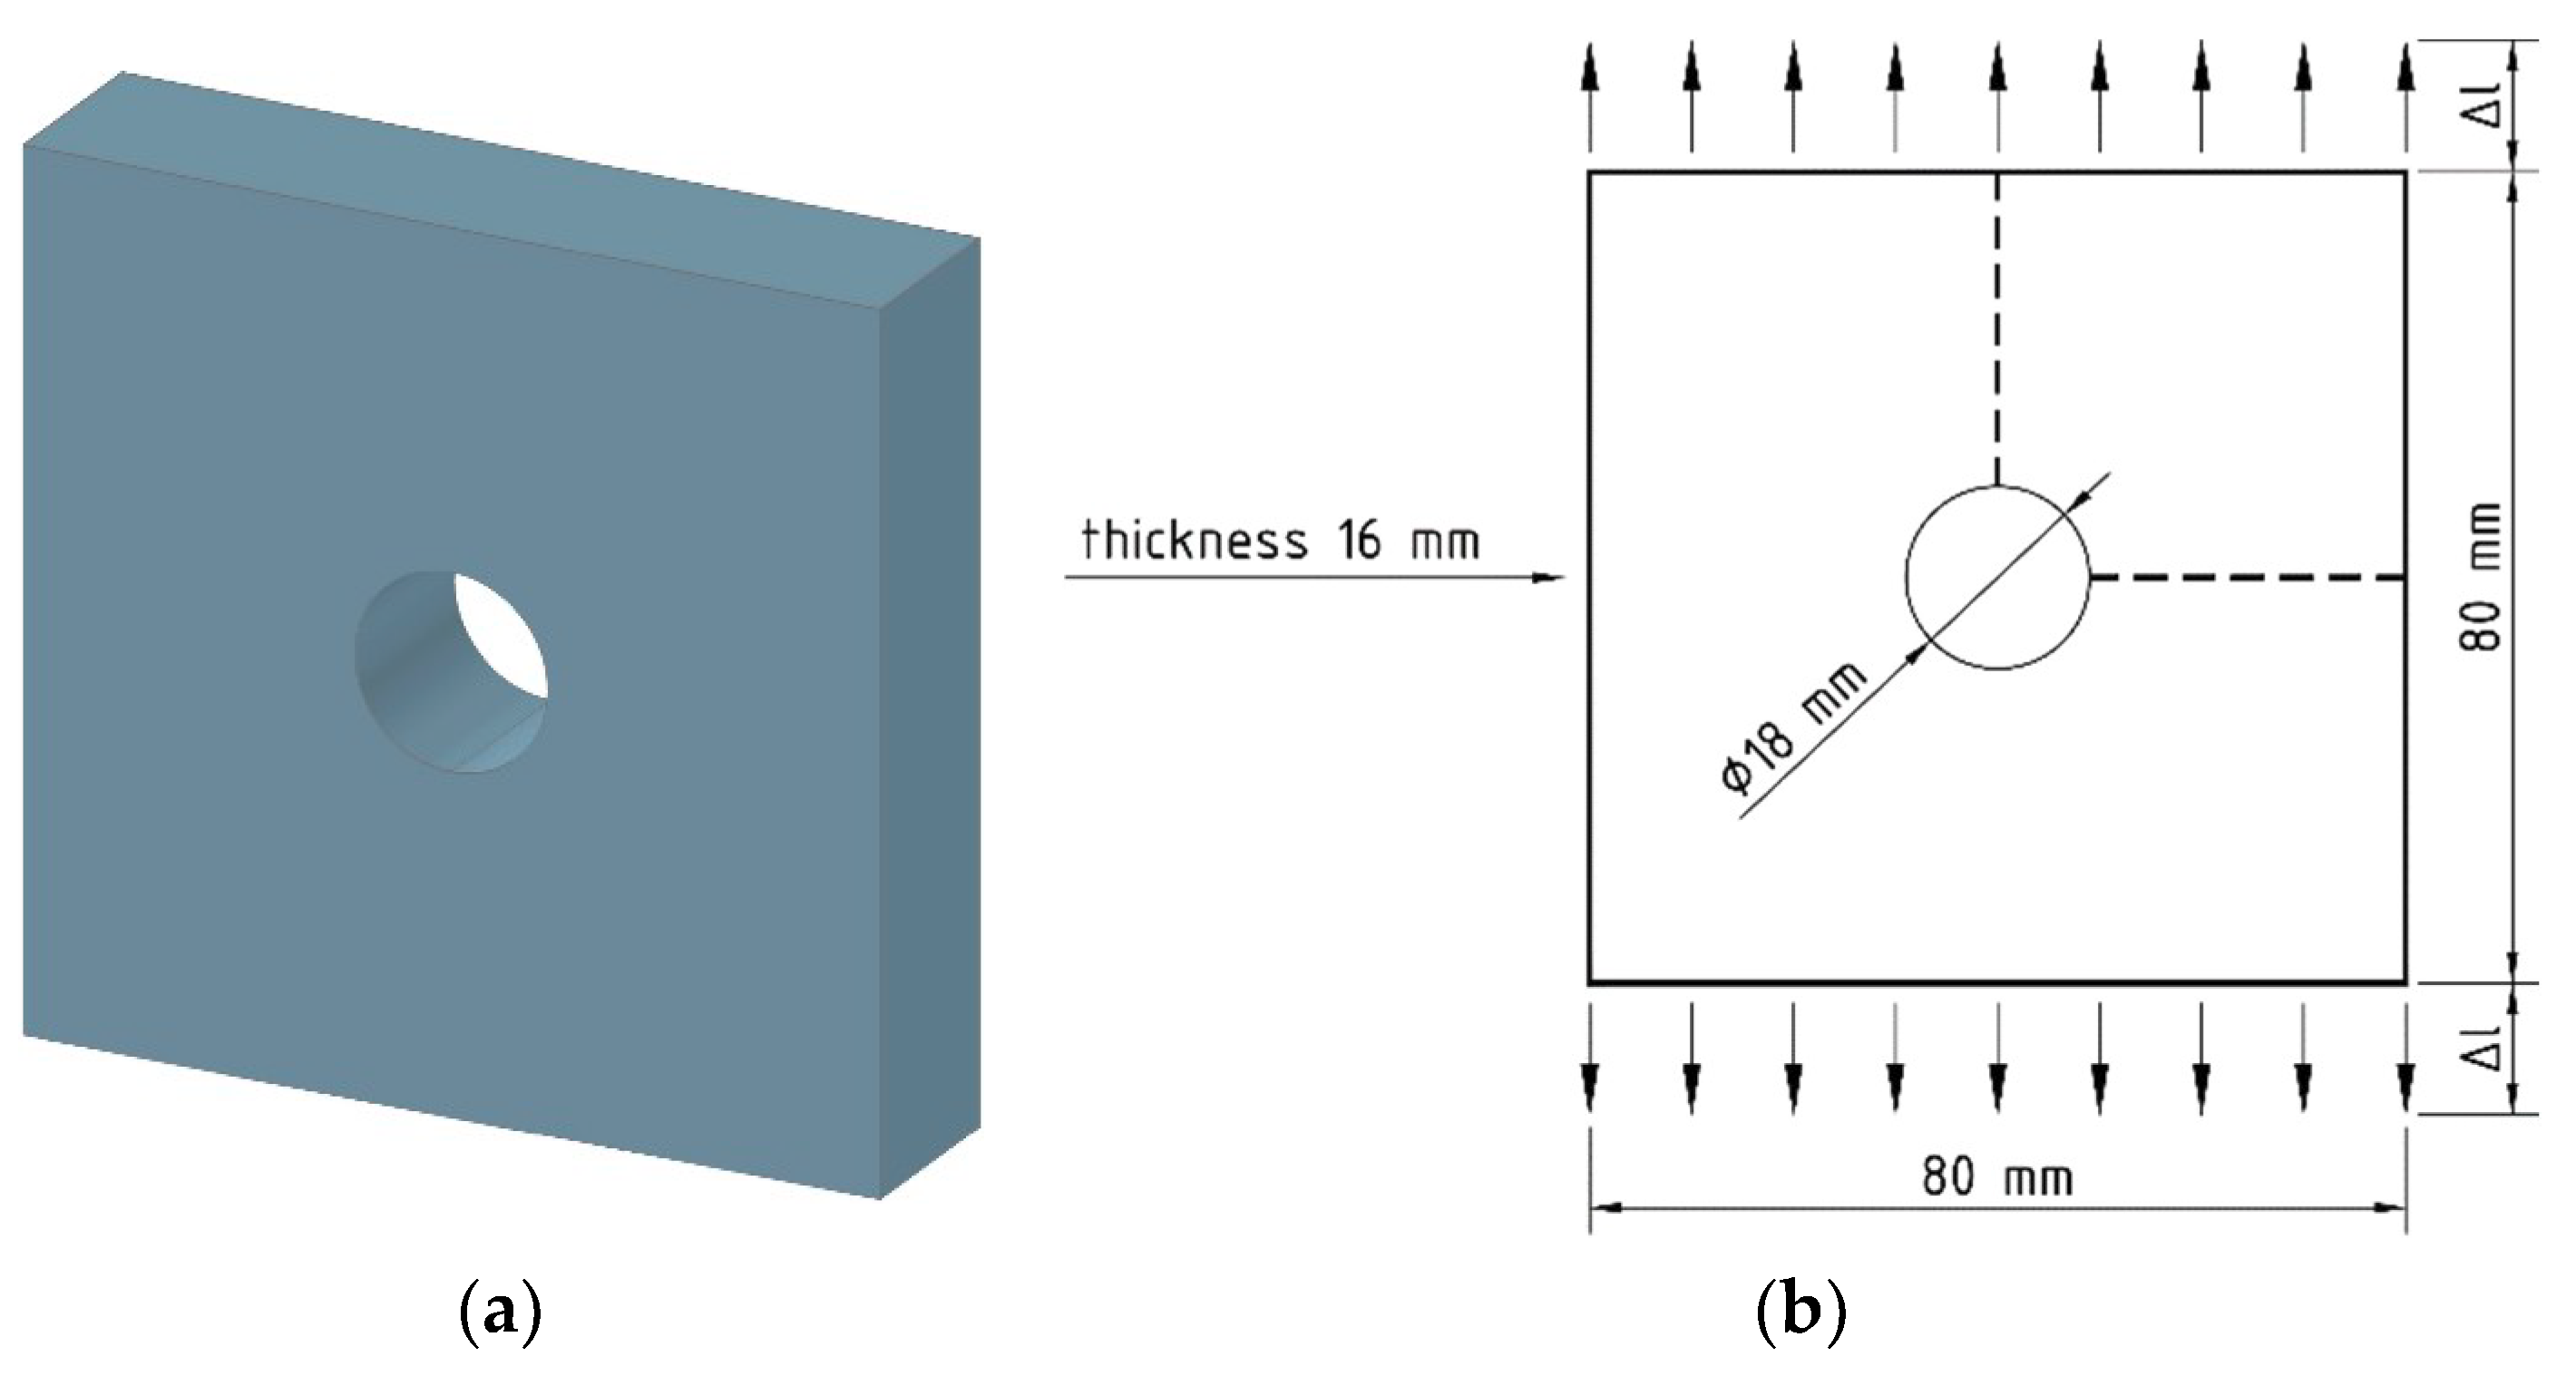
Figure 3.
Numerical model of the analysed component.
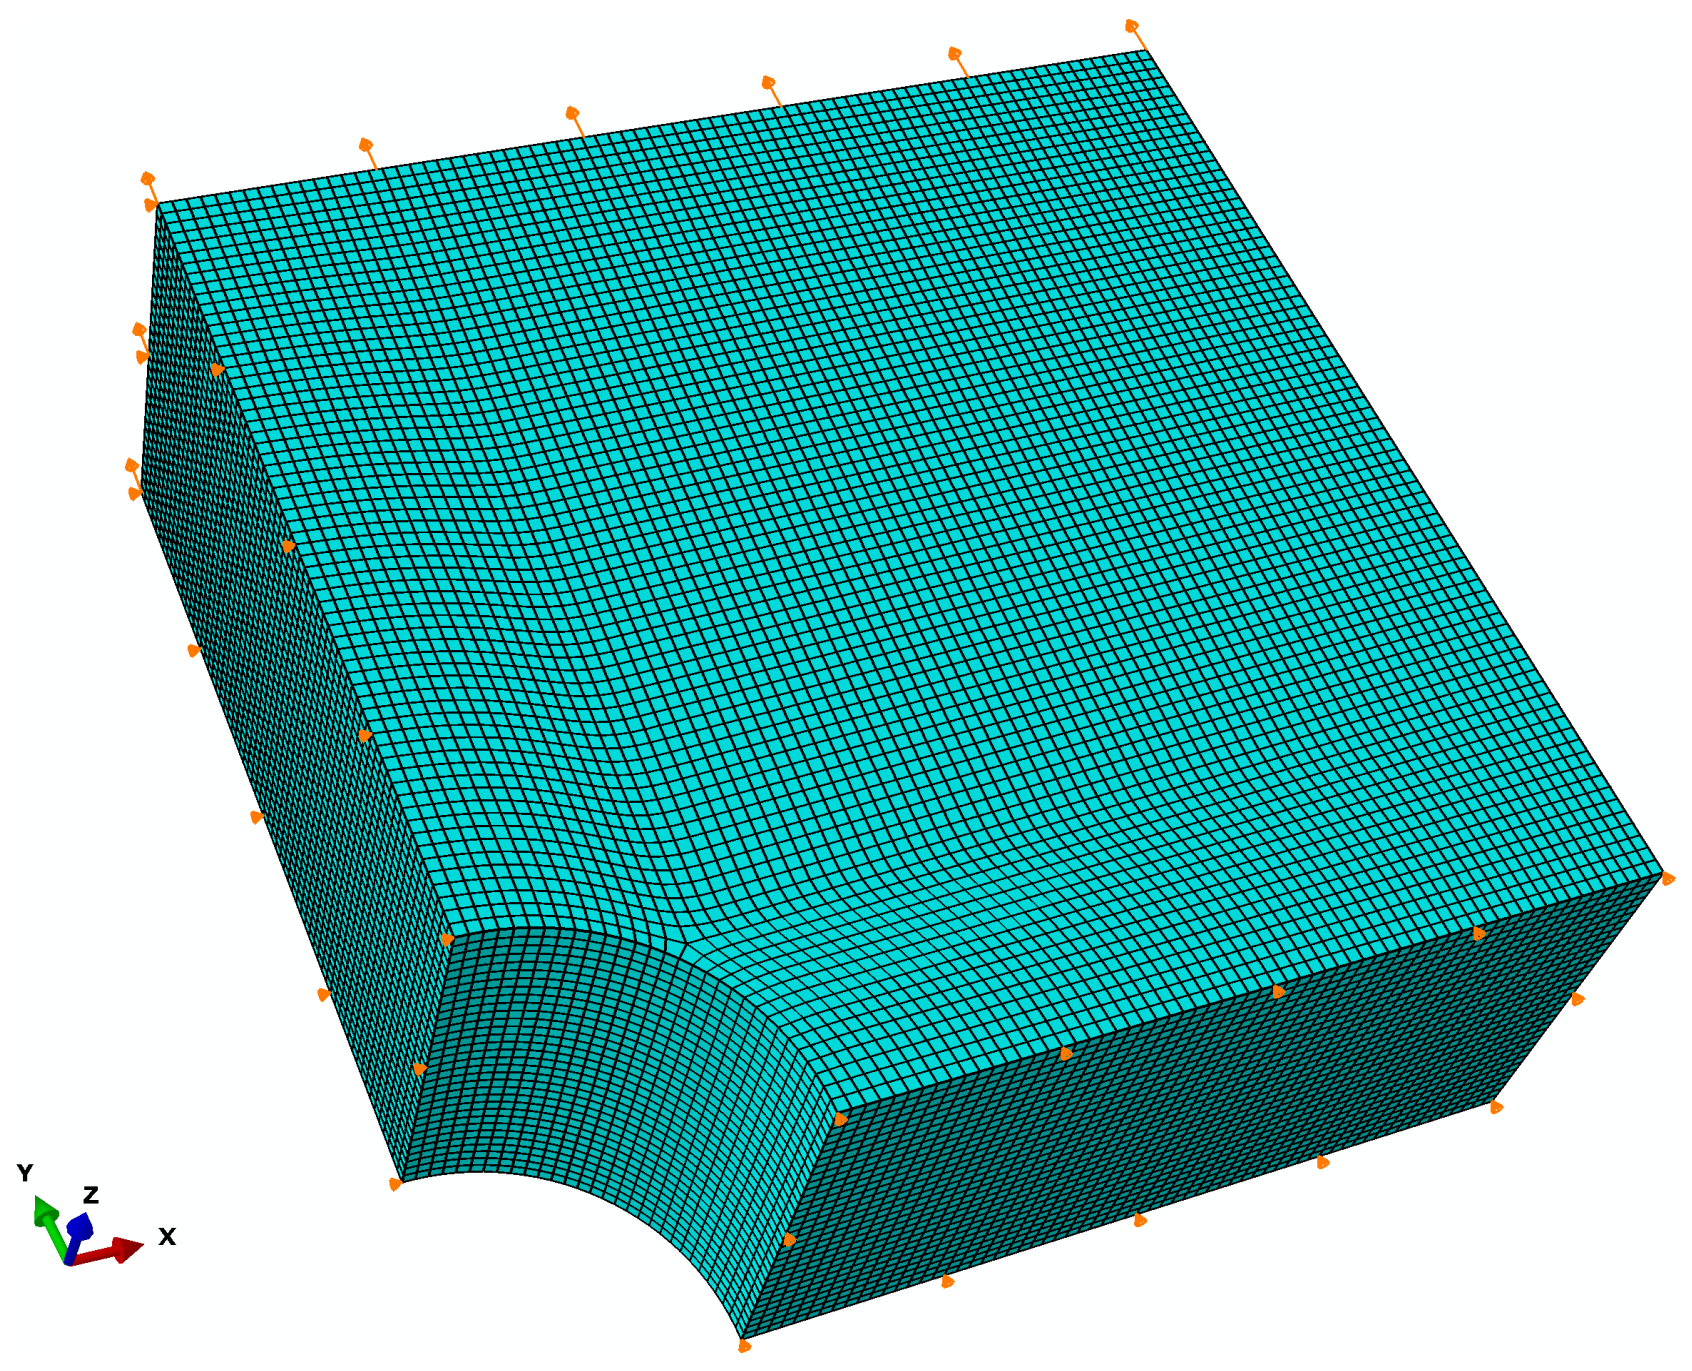
Figure 4.
Location of the finite element, in which the most intense development of damage and the highest gradient of stress triaxiality T was observed.
Figure 4.
Location of the finite element, in which the most intense development of damage and the highest gradient of stress triaxiality T was observed.
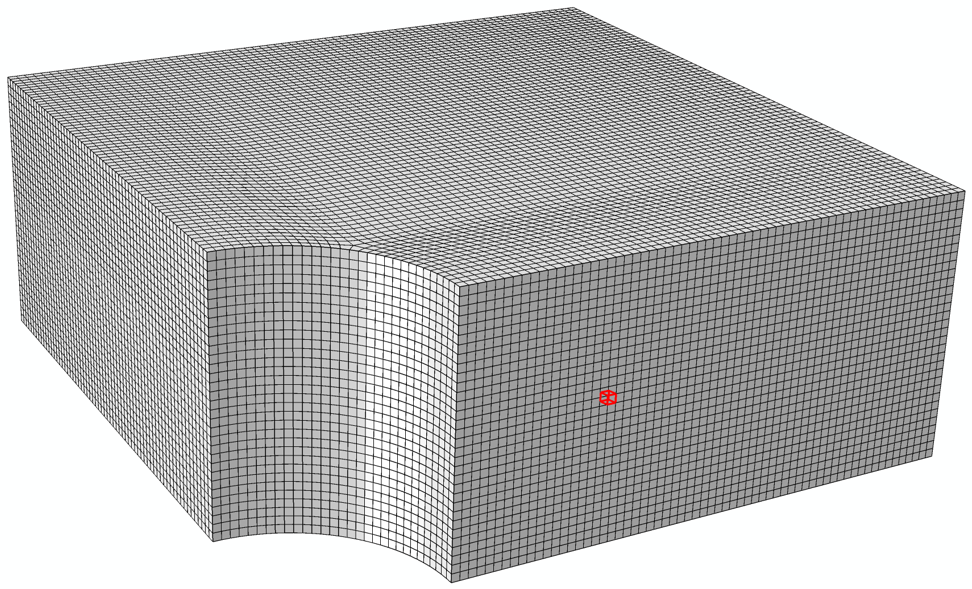
Figure 5.
(a) Curve of changes to the stress triaxiality T and the void volume fraction VVF versus nominal strain ε. (b) Material damage model assumed for the analysis.
Figure 5.
(a) Curve of changes to the stress triaxiality T and the void volume fraction VVF versus nominal strain ε. (b) Material damage model assumed for the analysis.
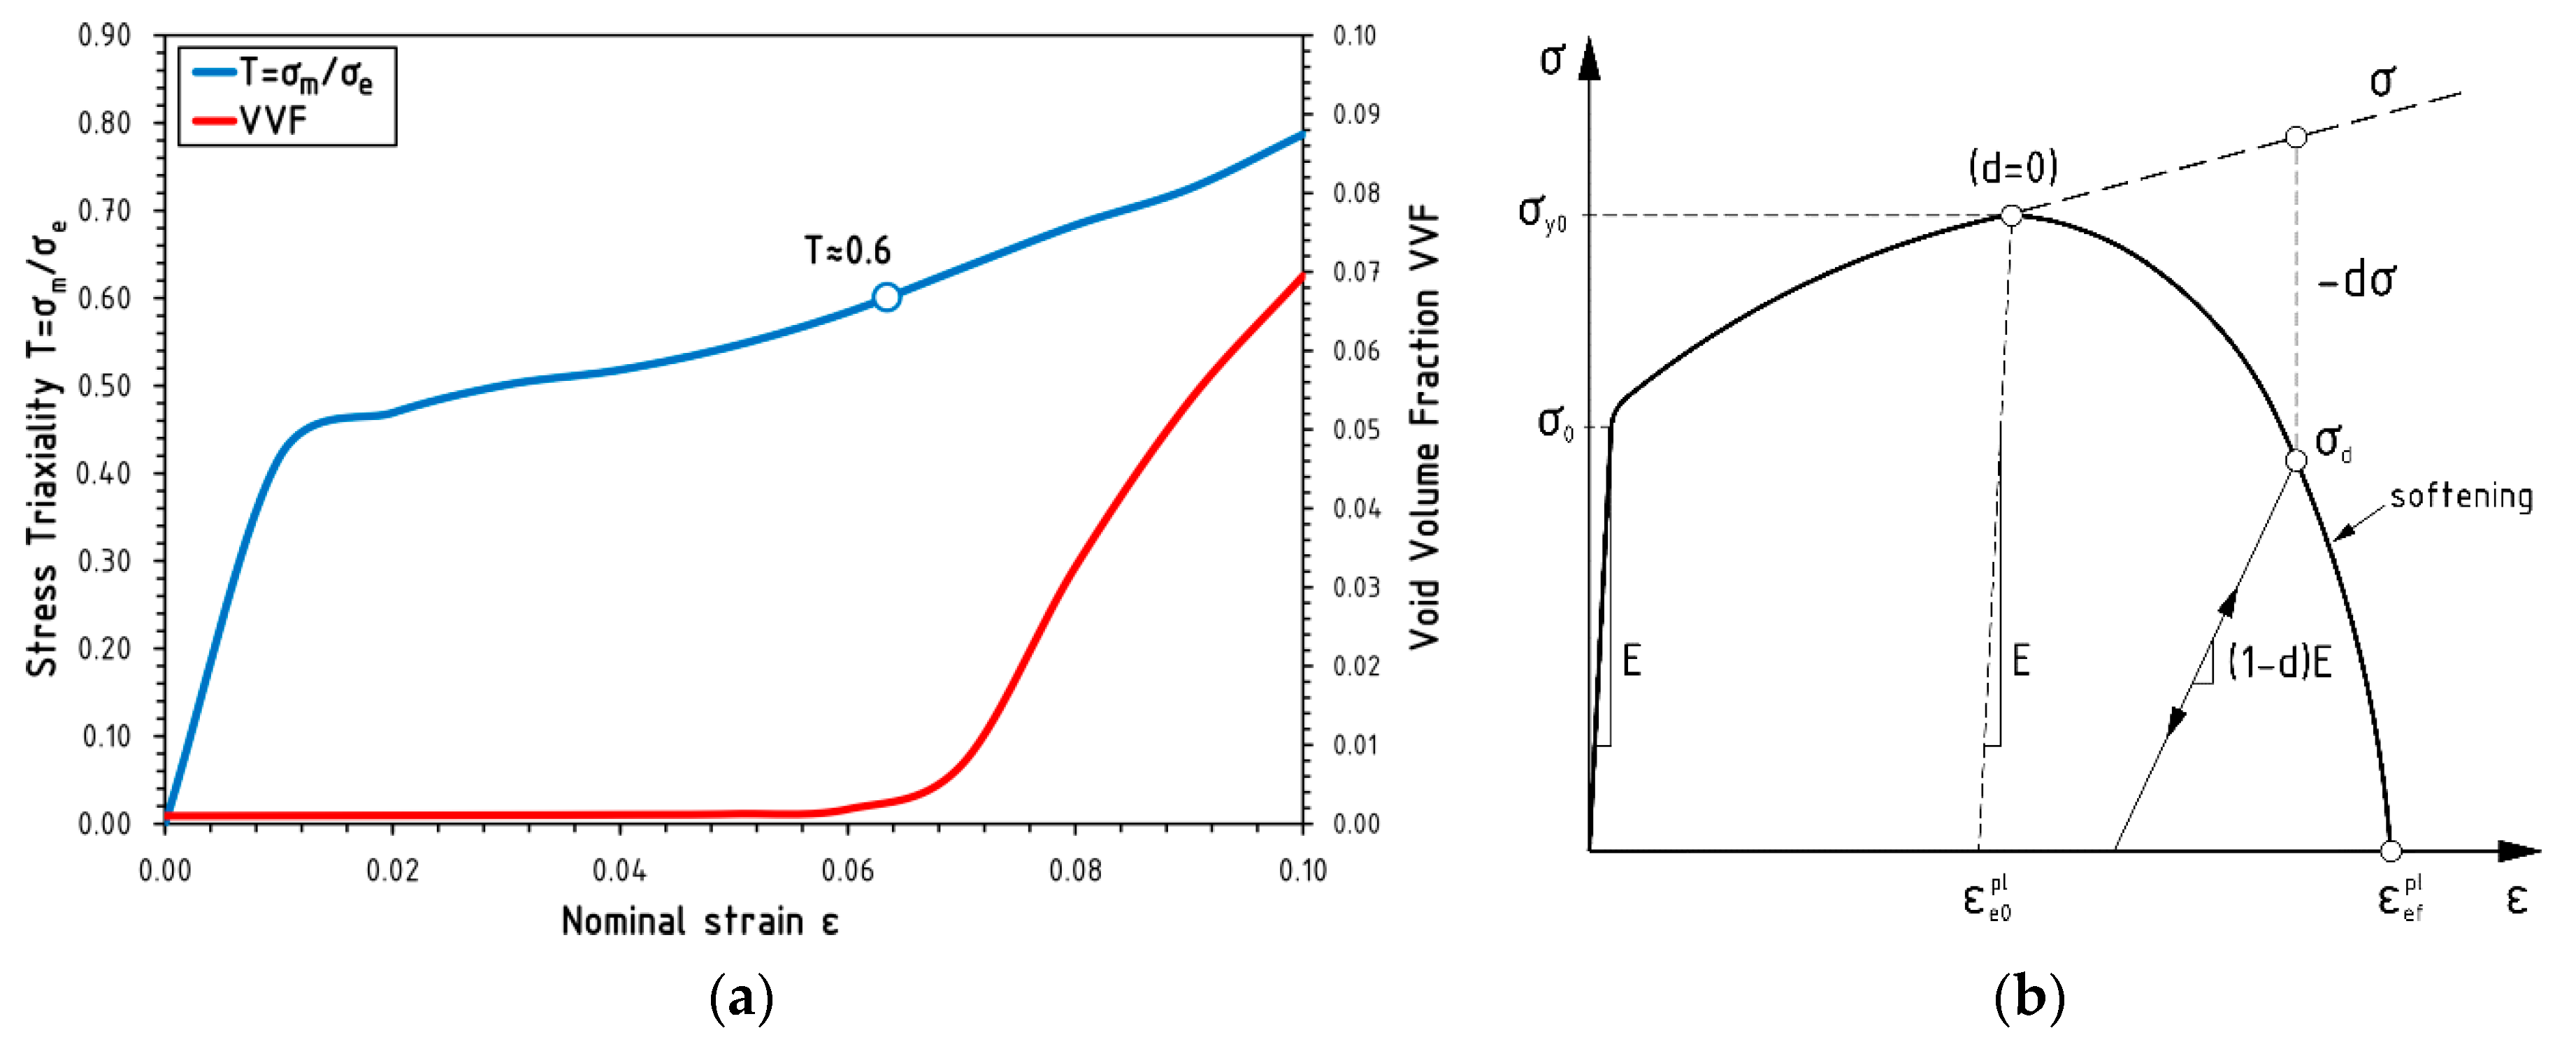
Figure 6.
Diagram of the relationship of the critical void volume fracture fF and the initial stress triaxiality T0 for S235JR steel [22].
Figure 6.
Diagram of the relationship of the critical void volume fracture fF and the initial stress triaxiality T0 for S235JR steel [22].

Figure 7.
Distribution maps of equivalent plastic strain εepl for subsequent nominal strain levels: (a) ε = 0.09, (b) ε = 0.15 and (c) ε = 0.18.
Figure 7.
Distribution maps of equivalent plastic strain εepl for subsequent nominal strain levels: (a) ε = 0.09, (b) ε = 0.15 and (c) ε = 0.18.

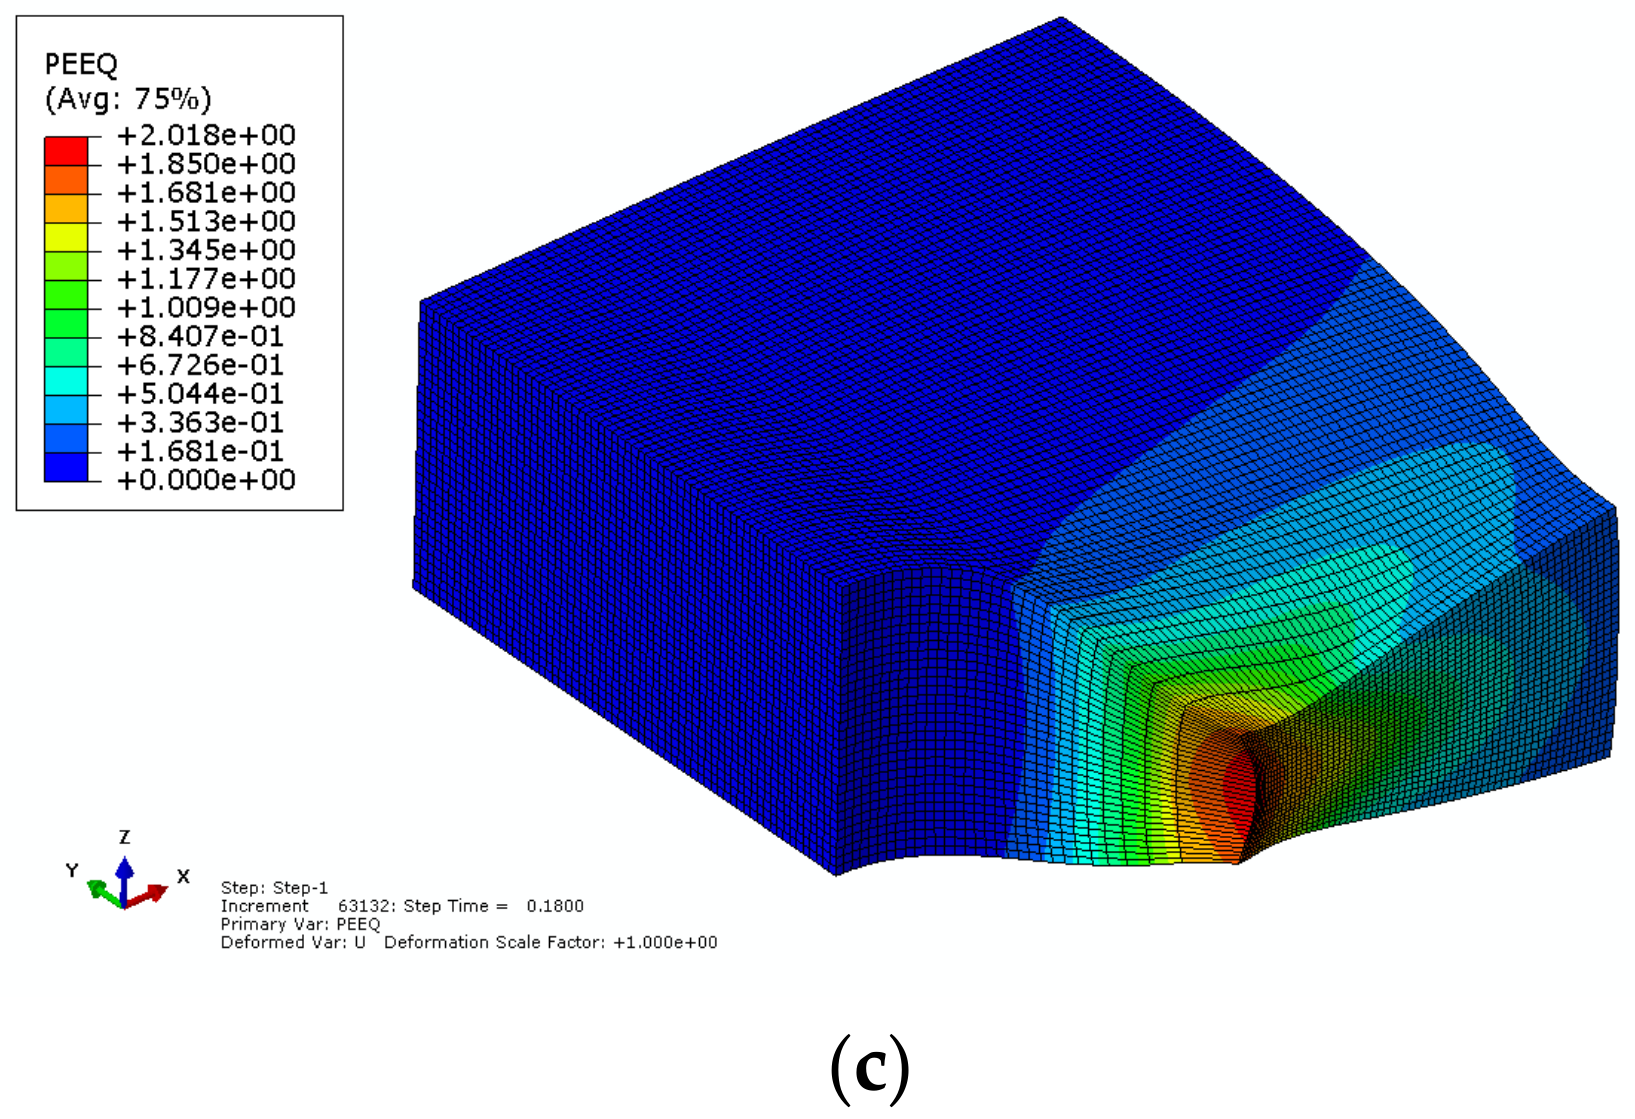
Figure 8.
Distribution maps of the void volume fraction VVF for subsequent nominal strain levels: (a) ε = 0.09, (b) ε = 0.15 and (c) ε = 0.18.
Figure 8.
Distribution maps of the void volume fraction VVF for subsequent nominal strain levels: (a) ε = 0.09, (b) ε = 0.15 and (c) ε = 0.18.

Figure 9.
Distribution maps of stress triaxiality T for subsequent nominal strain levels: (a) ε = 0.09, (b) ε = 0.15 and (c) ε = 0.18.
Figure 9.
Distribution maps of stress triaxiality T for subsequent nominal strain levels: (a) ε = 0.09, (b) ε = 0.15 and (c) ε = 0.18.

Figure 10.
(a) Designation of finite elements E1 and E2 in the analysed numerical model. (b) Diagram of changes of equivalent plastic strain εepl and the VVF versus nominal strain ε for elements E1 and E2. (c) Plastic principal strain path for elements E1 and E2. (d) Diagram of changes of nominal strain σ, VVF and T values over nominal strain ε for elements E1 and E2.

Table 1.
Mechanical parameters for S235JR steel.
| ε0 | ε1 | σ0 (MPa) | σ01 (MPa) | σ1 (MPa) | E (GPa) | N |
|---|---|---|---|---|---|---|
| 0.002 | 0.015 | 318 | 198 | 333 | 205 | 0.195 |
Table 2.
Gurson–Tvergaard–Needleman (GTN) microstructure parameters for S235JR steel.
| f0 | fc | fF | q1 | q2 | q3 | εN | fN | sN |
|---|---|---|---|---|---|---|---|---|
| 0.001 | 0.06 | 0.667 | 1.91 | 0.79 | 3.65 | 0.30 | 0.04 | 0.05 |
Table 3.
GTN microstructure parameters for S235JR steel.
| f0 | fc | fF | q1 | q2 | q3 | εN | fN | sN |
|---|---|---|---|---|---|---|---|---|
| 0.001 | 0.06 | 0.6975 | 1.91 | 0.79 | 3.65 | 0.30 | 0.04 | 0.05 |
© 2019 by the author. Licensee MDPI, Basel, Switzerland. This article is an open access article distributed under the terms and conditions of the Creative Commons Attribution (CC BY) license (http://creativecommons.org/licenses/by/4.0/).
Share and Cite
MDPI and ACS Style
Kossakowski, P.G. Modelling the Damage of Structural Components with Macrostructure Defects. Metals 2019, 9, 1238. https://doi.org/10.3390/met9111238
AMA Style
Kossakowski PG. Modelling the Damage of Structural Components with Macrostructure Defects. Metals. 2019; 9(11):1238. https://doi.org/10.3390/met9111238
Chicago/Turabian StyleKossakowski, Paweł Grzegorz. 2019. "Modelling the Damage of Structural Components with Macrostructure Defects" Metals 9, no. 11: 1238. https://doi.org/10.3390/met9111238
Note that from the first issue of 2016, this journal uses article numbers instead of page numbers. See further details here.