Effects of Eutectic Modification and Grain Refinement on Microstructure and Properties of PM AlSi7 Metallic Foams

1
Fraunhofer Institute for Manufacturing Technology and Advanced Materials IFAM, Wiener Straße 12, 28359 Bremen, Germany
2
Rolls-Royce Deutschland Ltd. & Co KG, Eschenweg 11, 15827 Blankenfelde-Mahlow, Germany
3
Deutsche Bahn AG, DB Systemtechnik GmbH, Bahntechnikerring 74, 14774 Brandenburg-Kirchmöser, Germany
4
TU Bergakademie Freiberg, Gustav-Zeuner-Straße 5, 09599 Freiberg, Germany
*
Author to whom correspondence should be addressed.
Metals 2019, 9(12), 1241; https://doi.org/10.3390/met9121241
Submission received: 14 October 2019
/
Revised: 12 November 2019
/
Accepted: 13 November 2019
/
Published: 20 November 2019
(This article belongs to the Special Issue Cellular Metals: Fabrication, Properties and Applications)
Abstract
:For AlSi7 foams, microstructure modification by variation of solidification rates and addition of Sr, B and TiB2/TiAl3 was investigated and its transfer to powder metallurgical metal foaming processes demonstrated. Microstructural characterization focused on grain size and morphology of the eutectic phase. Cooling rates during solidification were linked to secondary dendrite arm spacing, establishing a microstructure-based measure of solidification rates. Effects of refining and modification treatments were compared and their influence on foam expansion evaluated. Studies on foams focused on comparison of micro- and pore structure using metallographic techniques as well as computed tomography in combination with image analysis. Reference samples without additives and untreated as well as annealed TiH2 as foaming agent allowed evaluation of pore and microstructure impact on mechanical performance. Evaluation of expansion and pore structure revealed detrimental effects of Sr and B additions, limiting the evaluation of mechanical performance to the TiB2 samples. These, as well as the two reference series samples, were subjected to quasi-static compression testing. Stress-strain curves were gained and density-dependent expressions of ultimate compressive strength, plateau strength and tangent modulus derived. Weibull evaluation of density-normalized mechanical properties revealed a significant influence of grain size on the Weibull modulus at densities below 0.4 g/cm3.

1. Introduction
1.1. Foam Fundamentals
Metallic foams based on the powder compact melting or Fraunhofer process have by now reached sufficient levels of maturity to allow series production, e.g., for applications in the transport, machine tool and even the building industry [1,2,3,4]. The underlying process is based on hot compaction of a mixture of matrix metal, usually aluminum or an aluminum alloy, and foaming agent powders, usually TiH2. The resulting precursor material is then heated above its melting point and expands to yield a liquid foam, which is stabilized by solidification. The method was patented in 1990 by Baumeister et al. and has since been described in several publications [5,6]. A recent overview contrasting this process in terms of foam structure, performance and cost with alternative approaches has recently been published by Lehmhus et al. [7].
As a natural consequence of the material’s success, the call for statistically well founded design criteria as a prerequisite for making best use of the material‘s capabilities gains urgency. One major step to this end is an improved understanding of the role of different structural features in determining the mechanical properties, as well as their scatter. Both, however, are influenced by several characteristics, among which Mosler et al. and Martin et al. suggest the following hierarchy [8,9]:
- (a)
- global density
- (b)
- foam structure
- (c)
- matrix alloy
- (d)
- foam microstructure
Mu et al. introduce friction between cell walls as a further mechanism influencing behavior under compressive load, which, however, becomes effective only at high strain levels beyond the stress-strain curve’s typical plateau [10]. Density as the dominating aspect may be subdivided into global density and systematic density variations such as density gradients as typically induced by foam drainage, or by solidification shrinkage. Mechanical testing parallel to such density gradients will cause the lowest density cross sections to fail first, leading to a lowered yield point and a steeper plateau region than observed in samples of matching average density either tested perpendicular to any density gradient, or showing a homogeneous overall structure [11].
To shed additional light on the relative importance of the above features in determining mechanical performance, the present study concentrates on microstructure variation achieved via modification and grain refinement of the foam matrix alloy, AlSi7. Part of the methodology is to eliminate as far as possible the effects of the global density (a) by normalizing the results of mechanical testing. This was done according to a Gibson-Ashby type formulation of strength and stiffness as a function of global density [12]. Foam structural characteristics (b) were documented for all samples subjected to mechanical testing based on computed tomography (CT) scans in order to have a further basis for explanation of potential outliers among compression test results. To independently study the significance of cell structure, a second reference sample series was introduced based on thermally treated TiH2 as foaming agent. Treatments of this and similar kind have been demonstrated to allow tailoring of decomposition kinetics and can thus be employed to modify or improve pore structure and morphology [13,14,15,16,17,18]. Moreover, documentation of structural features is required for investigating any change induced by additives in this respect. The matrix alloy (c) itself is kept the same in all sample series, while the expression of the microstructure (d) is deliberately modified between series—either by means of appropriate additives (Sr, B, TiB2) or by varying the cooling rate in solidification.
Background to this approach are earlier observations suggesting that in Al-Si foams, coarse forms of the eutectic (lamellar or needle-shaped Si phase) can lead to Al-Si interface planes similar in size to the typical cell wall thickness, the latter being approximately 80 µm for the alloy system in question [19]. Such interfaces have been suggested as preferred initial failure sites in aluminum alloy foams [20]. The notion that Si particles and their geometry influence failure is also supported by several fracture mechanical studies on bulk Al-Si and closely related alloys, though mostly focusing on failure under conditions of fatigue. Among these, Gall et al. suggest that fatigue cracks preferably grow along the Al-Si interface [21]. Su et al. also observed particle debonding under conditions of wear based on experimental and numerical studies, while alternative mechanisms include particle fracture and plastic deformation of the Al matrix. Spherical shapes of Si particles are shown to reduce susceptibility to fracture [22,23]. Lados et al. confirmed the role of both primary Al dendrite and Si phase shape and size in this respect [24]. Chan et al. suggested that crack growth in fatigue of B319 Al alloy is mostly via fractured and debonded Si particles, while interdendritic grain boundaries provide preferred fracture paths in later stages of rapid crack growth [25]. In contrast, Xia et al. derived quantitative values of considerable magnitude (namely an interface shear strength of 240 ± 6 MPa and a normal strength of 247 MPa) from nanoidentation-based experimental studies combined with finite element analysis and claimed a good match with certain atomistic simulations [26].
Grain refinement and modification are thus directed at eliminating potential weaknesses caused by the foam matrix alloy microstructure. The relevance of such investigations is stressed by the fact that due to their good processing characteristics, near-eutectic Al-Si alloys in a composition range from approximately 7 wt.% Si upwards and related systems, e.g., containing further additions of Mg or Cu, have retained their role as backbone both in classic metal foam and metal foam sandwich production [2,27] and in more recent developments such as Advanced Pore Morphology (APM) foams [28,29,30,31]. In its concentration on additive-based microstructure modification, the approach complements studies on heat treatment of foams [32,33,34] and variation of the matrix alloy [35,36,37]. Of these, when it comes to identifying the role of matrix alloy and specifically microstructure, the latter will suffer greatly from coincidental differences in expansion characteristics and thus pore structure, as has recently been shown in much detail by Helwig et al. [38]. The former, in contrast, allows control of matrix material properties at constant pore structure, but is limited to alloys that show a notable response to heat treatment, such as the 6000 and 7000 series Al alloys susceptible to precipitation hardening.
1.2. Grain Refinement and Modification of Al-Si Alloys
While grain refinement and modification of Al-Si and related alloys are established techniques in metal casting, neither has yet been evaluated in the context of powder metallurgically produced foams. Additions of TiB2, a substance known for its refining capability, have as yet only been considered in the context of particle stabilization, e.g., by Kennedy et al. Grain refinement was also not investigated, nor was any such effect to be expected in these studies as a result of TiB2 particle size, which greatly exceeded dimensions of nucleation sites effective in the microstructural refining effect [39].
Depending on the understanding specifically of grain refinement, transfer of this essentially liquid phase technique to powder metallurgy may seem contradictory, and, in fact, the relevant literature is mostly associated with casting processes during which the liquidus line is passed with a considerable margin. An exception to this rule is a study by Nafisi and Ghomashchi, who also considered the semi-solid region in their work on A356, i.e., AlSi7 Mg, alloys, though only with respect to casting billets for further, semi-solid processing. Thus, the effects of, e.g., inhomogeneous distributions of refiners in the semi-solid state, is not reflected in their investigation [40]. In any case, though metal foams of the type covered here do start as a powder metallurgical (PM) precursor, they cross solidus and usually also liquidus temperature for a limited time during foaming. It has repeatedly been shown that unless specific measures are taken to ensure that expansion occurs solely in the semi-solid region [38,41,42], the final microstructure of the foam is entirely formed during solidification [36]. A remaining concern is the question how effective treatments can be if modifiers are contained only in a limited Al powder fraction, which is diluted by addition of conventional Al and alloying element powders. For economic reasons (cost of specially prepared powders with refining/modifying agents), such a processing route seems mandatory if modification and refinement are to be established on a commercial basis.
Grain refinement generally relies on increasing the number of available nucleation sites in a melt. This can either be achieved by influencing the constitution of the melt in a way that the critical radius above which nuclei may grow is reduced, and thus using mechanisms of homogeneous nucleation, or via heterogeneous nucleation by offering additional nucleation sites. Current state of the discussion suggests that standard treatments with TiB2/Al3Ti and AlB2 combine effects of both kinds, as is outlined in a dedicated review on the underlying principles of grain refinement mechanisms provided by Easton and St. John. According to them, the models proposed thus far fall into two main categories, termed the Nucleant and the Solute Paradigm. The Nucleant Paradigm itself encompasses nucleant particle theories, which stress the role of TiB2 and isomorphous AlB2 particles as primary nucleation sites, and phase diagram theories, which consider the properitectic Al3Ti phase as the main nucleation site. The problem of the former theories is that based on crystallographic considerations and some experimental evidence, both TiB2 and AlB2 have to be considered poor nucleants and only really show their benefits in the presence of additional Ti. In comparison, Al3Ti is a powerful nucleant due to a number of beneficial orientation relationships with α-Al and its peritectic reaction forming α-Al. However, pure phase diagram theories once again fail to deliver an explanation for the superior performance of combination of certain Ti levels with TiB2, AlB2 and (Al,Ti)B2 as used in commercial grain refiners of the so-called 5-1 Ti-B-Al kind. This deficiency is reflected in theories combining aspects of both views, including a possible higher Al3Ti stability in Al melts in the presence of borides or the peritectic hulk theory, which assumes a preferred nucleation of Al3Ti on the melt-TiB2 interface [43,44]. More recently, Schumacher et al. have demonstrated that the effectiveness of TiB2 particles in fact relies on their being covered by Al3Ti layers, which only form at Ti content levels exceeding 0.15 wt.% [45].
For modification of the eutectic Si phase, Sr- and Na-based treatments are common practice. Explanations of their effectiveness consider the influence of additives on Si nucleation and crystal growth. Among the latter, a distinction is made between kinetic effects caused by reduction of Si diffusion coefficients [46] and surface tension [47,48] in Sr-containing Al melts and blocking of Si lattice planes preferred in further crystal growth by local Na enrichment [49]. More recent studies by Srirangam et al. confirm significant influence of Sr additions on the liquid state structure of Al-Si alloys seen in simulations using synchrotron radiation, thus supporting a role of the additive in nucleation of the Si phase [50]. Further contributions to this topic by Timpel et al. based on atom-probe tomography and transmission electron microscopy suggest parallelism of two mechanisms, of which growth restriction of the eutectic Si phase is just one. Their measurements indicate the existence of two types of co-segregation of Sr with Al and Si, of which type I causes multiple twin formation in the Si crystal (“impurity-induced twinning”), which further facilitates multiple direction crystal growth, while larger size type II segregations restrict Si crystal growth [51].
Common to all theories, be they directed at grain refinement or eutectic modification, is that they require additional nucleation sites or solved additives in homogeneous distribution once solidification starts. Obviously, this is not necessarily a given thing in a PM material in which (a) refining/modifying agents may only be present in part of the metal powder components, and which (b) reaches the liquid state solely in the course of foam expansion and thus for seconds rather than minutes before solidification is initiated to stabilize the developing foam. Stability of the modified foam is an issue in itself, as earlier investigations indicate that B and Sr, but also TiB2 additions alter characteristics such as surface tension and viscosity [50,52,53,54], parameters that are instrumental in determining a metal foam’s susceptibility to detrimental phenomena such as cell wall rupture, coalescence or drainage [15,55,56]. For this reason, initial studies of refinement and modification have been performed on powder compacts without foaming agent and varied levels of additive-containing Al powders.
The present study will thus elucidate the possibility and the effects of transferring the aforementioned approaches for microstructural optimization to PM aluminum foams by evaluating microstructural features, expansion characteristics and mechanical behavior of such materials with and without additives.
2. Materials and Methods
As motivated above, the work described here is divided in three major sections, namely (a) the general evaluation of grain refinement and eutectic modification of powder compacts, (b) the evaluation of expansion characteristics of such powder compacts with addition of 0.5 wt.% TiH2 as blowing agent and (c) the microstructural and mechanical evaluation of foams produced from these precursor materials.
In this, steps (a) and (b) turned out to effectively narrow down the set of samples suitable for detailed studies along the lines of step (c).
2.1. Materials and Sample Production
Production of precursor materials and foams followed the principles of the Fraunhofer or powder compact melting process. Alloying was based on mixing of elementary Al and Si powders. Table 1 lists the powders used and their composition, including, where applicable, levels of modifying agent content, as well as measures of particle size according to specification and measurement. Powders containing modifying or grain refining additions were specifically prepared for this purpose by Alpoco and match in constitution materials commonly employed in preparation of powder compacts used in melt treatment of aluminum casting alloys. The choice of Sr as modifying agent as well as B and TiB2 for grain refinement was based on the dominant role of these additives in melt treatment in casting of aluminum in general, and specifically of hypoeutectic Al-Si alloys [57,58,59,60].
Particle sizes were measured using a Coulter LS 130 laser particle size analyzer (Beckman Coulter Inc., Brea, California, USA). Powders were dispersed in ethanol and subjected to ultrasonic agitation to break agglomerates before measurement.
Mixing of powders for hot pressing was done in a tumble mixing device. Compaction was realized as two-step process at a furnace temperature of 450 °C, using a Zwick 1474 universal testing machine with added furnace (ZwickRoell GmbH & Co. KG, Ulm, Germany), the initial load being 60 kN or 74.6 MPa during the first and a constant 90 kN (111.9 MPa) during the final stage. Holding time was 20 min for each step. The hardened steel dies with circular cross-section were filled at room temperature. During the first compaction stage, settling effects and plastic deformation in the powder bed led to a load decrease to below 20 kN. Hot extruded precursor material based on identical Al, Si and TiH2 powders was acquired from Entwicklungsgemeinschaft Schunk-Honsel for use as reference. Powder mixtures were cold isostatically pressed to a relative density of approximately 0.75 to 0.85. The billets gained were heated to a temperature of 450 °C and extruded using a die with rectangular cross-section of 160 × 40 mm. The thickness of 40 mm allowed producing cylindrical samples for expansion measurements and foaming of specimens for compression tests from the extruded precursor material with the central axis oriented perpendicular to the extrusion direction and the larger transversal extension of the extruded geometry.
Axially compacted samples were turned to 31 mm diameter and 28.5 mm height, corresponding to a maximum global sample of 0.66 g/cm3 considering the foaming molds used. Higher levels of foam density were achieved by interrupting foam expansion prior to complete filling of the mold. Both extruded and hot pressed materials show a preferred direction of expansion. In both types of samples, this direction coincides with the cylinder axis.
Foaming of all samples took place in a specially designed furnace configuration with an attached cooling device allowing both water and forced convection cooling. Furnace and attached cooling rig were designed to be raised and lowered automatically to avoid moving the then unstable sample prior to solidification. Foaming molds were machined from high temperature oxidation resistant steel grades (1.4713, 1.4828) with internal dimensions of D45 × 55 mm. The setup, including a foaming mold, is depicted in Figure 1.
For initial evaluation of refining and modification effects achievable in powder compacts, altogether nine different types of samples without blowing agent were produced containing three different levels of B, TiB2 and Sr, respectively. These specimens, as well as reference samples containing neither grain refining nor modifying additives, were subjected to thermal treatments at 660 and 680 °C, meant to simulate the foaming process. For those powder compacts representing the medium level of additives, a further variation of the quenching step following thermal treatment was foreseen. Full details of all sample series are reported in Table 2.
Evaluation of the expansion characteristics of a subset of the above sample types, including all additives, led to three different compositions of foamed samples being produced for structural, microstructural and mechanical evaluation. These are listed in Table 3. Further foam samples were produced to substantiate the observations on microstructural features made on powder compact samples.
2.2. Microstructural Characterization
Foam sample preparation followed general guidelines laid down by Müller et al. and Mosler et al. [61,62]. To clearly distinguish microstructural features such as the individual primary Al grains, Barker etching was employed. The method provides grain-level contrast under polarized light based on local crystallographic orientation via this feature’s influence on the growth of thin oxide layers during anodic etching [63]. For quantitative image analysis, the software package A4i-Analysis developed by Acquinto was used.
Grain size was established via two alternative approaches. For Barker etched samples, the largest extension of several grains’ was measured on approximately 100 grains per sample. Since larger grains showed better contrast, grain size tends to be slightly overestimated in this case. As an alternative, scanning electron microscopy and electron backscatter diffraction (EBSD) were employed for image acquisition. The method proved critical in eutectic regions, where presence of several Al-Si transitions in close vicinity did not allow for unambiguous detection of orientations. To compensate for this effect, a dilation of clearly identified Al grains was performed, leading to a single phase microstructure with polyhedral grains. General consideration of the alloy’s characteristics suggests that these approximate to the circumference of the complex shaped dendritic grains which make up the true microstructure. As a consequence, it is possible to derive the grain sizes of the true microstructure from its processed counterpart. In the present study, this has been done by measuring linear intercepts of grain boundaries for approximately 250 grains per sample. The second advantage, besides the increased database, is the fact that the method is capable of distinguishing and thus evaluating even very small grains, while the light microscopy approach effectively stressed larger grains showing better contrast due to the subjective selection step involved. In the following text, whenever grain sizes are given, the fundamental principle used in determining these is given.
Analysis of the degree of modification was based on metallographic sections images of which were acquired using light microscopy. In following Ohser and Lorz’s recommendation, the specific interface area SV between Al and Si phase in the eutectic as well as the integral of the average curvature of the Al-Si boundary MV in the two-dimensional (2D) section were determined [64].
As additional parameter, values of secondary dendrite arm spacing were established relying on light microscopy images of metallographic sections. Two methods were employed, namely selection of dendrites followed by interactive measurement of arm spacing and an automated approach based on the assumption that the thickness of dendrite arms matches the arm spacing. The latter method was used on anodically etched bright field light microscopy images providing high levels of contrast between the primary aluminum grains and the eutectic phase, thus allowing straightforward binarization. Evaluation first singled out isolated dendrite arms not connected (in the respective 2D section) to a dendrite stem, then determined and averaged the minimal Feret diameter of these. Generally, good agreement between both methods was observed; however, less effort and greater numbers of dendrite arms included in the analysis make the latter the principle of choice.
2.3. Pore Structure and Morphology
For evaluation of the pore structure, both cutting of foam samples to produce photographic images and computer tomography (CT) were employed. In the former case, preparation relied on wire EDM cutting as a means to avoid exerting mechanical loads on foam structural members. Part of the CT measurements was executed by Dr. Illerhaus at the Bundesanstalt for Materialforschung und -prüfung (BAM). Further CT investigations were performed on reference compression test samples using a Procon CT-MINI device, and on foamed samples using modified Yxlon equipment. Resolution was 60 µm, 65.2 µm and approximately 200 µm, respectively. The latter exceeds minimum cell wall thickness by an approximate factor of two, but still allows reconstruction of cellular structure based on averaging effects.
2.4. Foam Expansion Measurements
Foam expansion characteristics were determined using the so-called mechanical expandometer to simultaneously measure furnace and sample temperature as well as volume expansion of the foam by means of Ni-CrNi thermocouples and position encoders based on inductive sensors [65]. Samples tested were of 29 mm diameter and 9 mm height. Per sample type, at least three measurements were performed. Furnace temperature control was set to 750 °C, leading to an approximate 770 ± 5 °C within the furnace just beside the steel tube containing the sample. To eliminate side effects attributable, e.g., to thermal expansion of the device itself, a correction curve was calculated based on three measurements under the same conditions but without sample. This curve was subtracted from each individual expansion measurement. A further, temperature based correction relied on matching of solidus temperatures determined by differential scanning calorimetry (DSC, Netzsch STA 409 C) with temperature profiles measured during foam expansion.
2.5. Mechanical Testing and Evaluation of Test Results
General concerns about viability of mechanical test results in cellular materials were put to the test by Andrews et al. and more recently Yu et al. Andrews et al., as a consequence, proposed the principal dimensions of samples to be at least seven times the average pore size [66] and Yu et al. suggested specimen heights to exceed this parameter at a factor of six [67]. Alkheder and Vural basically confirmed these observations in a recent numerical study and add considerations of boundary layer influence, which they found to be insignificant once sample edge length equaled 10 times the average pore size [68]. With representative pore size values for the type of foam studied here between 2 and 3 mm, a diameter of 30 mm at a height of 25 mm was considered acceptable. Compliance with the criterion was checked, with positive results, based on CT measurements.
To eliminate effects of the foams’ typical solid skin, samples for mechanical testing were machined to final dimensions from foam cylinders originally measuring 45 mm in diameter and 55 mm in height by means of turning or wire EDM cutting. The main axis of these specimens coincides with that of the original foam cylinder, the main direction of expansion and gravity during foaming and the direction of the applied compressive load. Samples tested parallel to the direction of expansion have previously been shown to exhibit lower strength than those tested perpendicular to it, most likely due to a density gradient of identical direction [11]. In the present case, limitation of sample height to 25 mm allowed selecting a region of constant density in sampling.
Compression tests were performed in the quasi-static regime at a constant strain rate of 0.1 s−1 and stopped once densification had clearly been reached for all density levels, i.e., at a total strain of at least 80%, or at a load exceeding 100 kN (corresponding to 203.7 MPa). Modified foams were tested at TU Bergakademie Freiberg using a MTS 810 universal testing system. Reference samples were tested at Fraunhofer IFAM using a Zwick 1476 universal testing device and a 100 kN load cell.
As principal characteristics of the stress-strain response on which further evaluation was based, tangent modulus (defined as the maximum slope in the elasto-plastic region), ultimate compressive strength and plateau strength were selected. The latter was determined as the stress value associated with the intersection of a linear fit to the plateau region with a tangent to the elasto-plastic region of the stress-strain curve at the point of maximum inclination.
The strain interval for linear plateau region fits has an arbitrarily chosen lower boundary at 0.1 engineering or technical strain, while for the upper limit, a density dependent formulation was chosen in accordance to the initiation of densification as proposed by Gibson and Ashby [12]:
ε < (1−1.4 · ρrel) · (1 − D−1)
The value of the parameter D depends on, e.g., the characteristics of the matrix material. For metallic foams, Gibson and Ashby suggested a value of 2.3 [12], which has been taken over for the present study. Both definitions ascertain that for the whole density range studied neither initial stress peaks nor densification affect plateau stress values.
Ultimate compressive strength (UCS) was defined as the peak stress reached immediately after the elasto-plastic region. Identification of such a peak, which does not occur in very ductile foams [32], proved possible for all samples.
Results of this kind were evaluated using Weibull statistics [69]. For this purpose, all mechanical characteristics derived were normalized based on Gibson’s and Ashby’s fundamental models of strength and elastic modulus as function of density, which reads as follows, in its simplified form [12]:
σUCS/pl = CUCS/pl · ρrel3/2
E = CE · ρrel2
Normalization can be realized by dividing the respective property value by the relative density to the applicable power, i.e., 1.5 for plateau and ultimate strength and 2 for the tangent modulus, seen here as elastic materials characteristic. In the present study, a twofold deviation from this straightforward approach was followed: first, the dependence of density on strength was formulated based on absolute rather than relative density. Both descriptions are equivalent when assuming that in the former case, the respective power of the matrix density’s reciprocal forms part of a redefined constant CE. Second, instead of using the standard values introduced in Equations (2) and (3), normalization relied on the exponent of foam density found when fitting a power law function to the experimental density-dependent compression test data.
3. Results
3.1. Microstructural Modification of Powder Compacts
Figure 2 summarizes data on the influence of cooling rate and levels of different additives on grain size. Results from sample series 1 (holding temperature/time 660 °C/5 min.) are included. The diagram confirms that refining and modifying additions can reduce grain size significantly even at the highest cooling rate that could be realized by water quenching. Refining effects are visible even at lower additive levels, i.e., for an initial constitution which contains additives only in part of the aluminum powder fraction. Nevertheless, highest additive levels lead to smallest grains, but in size these still retain an order of magnitude which slightly exceeds the minimum cell wall thickness.
Figure 3 shows selected microstructures complementing the above diagram. In these, Barker etching is employed to achieve distinction between grains. Lines hold reference, Sr-, TiB2- and B-containing samples from top to bottom, while from column 1 to 3 the cooling rate increases from natural via forced convection to water quenching. Additive content levels are 250, 350 and 140 ppm for the Sr, B and TiB2 treated samples, respectively. Specifically the water-cooled Sr-based samples appear to show an exceedingly fine microstructure, additional quantitative data on which is related in Figure 4. A similar observation is made in Figure 5, which contrasts non-etched metallographic sections corresponding to the same sample types. The finding is, however, not directly reflected in the quantitative data gathered in Figure 2; grain sizes are almost identical for water-quenched samples containing additives, with Sr assuming an intermediate position between B and TiB2. A possible explanation for smaller grain sizes to be found in Sr-containing samples is the fact that Sr boosts the level of undercooling in solidifying Al alloys, and thus, promotes formation of additional crystallization nuclei [70].
Figure 4 displays graphically the influence of Sr, TiB2 and B additions on the morphology of the eutectic phase for the two holding times and temperatures compared. For B-refined samples, only data for sample series 1 is available. The diagrams show that both TiB2 and B additions have a coarsening effect on the eutectic phase. With rising additive content, both the integral of average curvature and the specific boundary layer increasingly fall below the reference data set by the additive-free samples. For Sr, the situation is different, as a coarsening is observed only for the lowest content level, whereas specifically the data from sample series 2 treated for 10 min at 680 °C testifies to the expected effect, i.e., a significant rise of both parameters scrutinized. Nevertheless, the focus of the investigation remains on sample series 1, as the analysis of temperature and expansion versus time curves for the various materials suggests that the respective conditions are a better approximation of the thermal history of foam than the increased time and temperature values adopted for sample series 2.
Micrographs corresponding to the diagrams in Figure 4 are presented in Figure 5 and Figure 6. While the former reflects the influence of cooling rate without as well as at the medium additive levels considered, the latter relates the impact of the amount of additives under conditions of water quenching, and thus, directly corresponds to the quantitative data presented above.
Figure 5 underlines the dominant effect of cooling rate on grain refinement as opposed to that of moderate additive levels. Contrast between the third column and the two others exceeds the difference between the reference sample in the top row and the additive-containing ones at matching cooling conditions. Still, both a refining and a modification effect are discernable: Specifically at forced convection, i.e., at slightly elevated cooling rates, the eutectic phase seems finest in B and TiB2-containing samples. Figure 6 optically confirms the data represented in Figure 4, as specifically the coarsening of the eutectic structures is clearly visible in lines 2 (d–f) and 3 (g–i), which correspond to TiB2 and B additions, while the finest structure is revealed in Figure 6c for highest Sr levels.
Since direct measurement of cooling rates in a solidifying foam is difficult, as a result, it may differ significantly depending on whether or not a thermocouple was in actual contact with the matrix material during data acquisition, and literally impossible if the macroscopic structure development must not be influenced (which is the case when using thermocouples within the sample); thus, alternative ways of establishing correct values have to be developed. Correlating microstructural features with solidification rates thus becomes attractive. Secondary dendrite arm spacing (SDAS) can be used for this purpose, with an expression of the type:
λa = A ν−1/3
Describing the relationship between both parameters according to Sahm et al., where λa describes the actual SDAS value in µm and ν the cooling rate in Ks−1 [71]. While the overall size of grains, be they dendritic in nature or not, is clearly influenced by refining additions, literature shows that secondary dendrite arm spacing (SDAS) is not. This allows SDAS measurements to be performed on reference samples containing neither additives nor foaming agents. For the current study, calibration experiments have been performed based on the melting of powder compacts without foaming agent and cooling via natural convection, forced convection using a pressurized air supply and a water jet. During all experiments, cooling rates were measured using thermocouples, while associated SDAS values were determined metallographically. Following suggestions from Schumann, the measured “solidification rate” was determined as the average cooling rate between 550 °C and 400 °C [63]. As a result, the value A = 45.75 has been gained by fitting an equation of the aforementioned type to the measured points, see Figure 7 as well as Equation (6). In doing so, the original equation has been modified to the two parameter form given in Equation (5):
Λa [µm] = A · vn
Λa [µm] = 45.75· v−0,3295, R2 = 0.94211
For the second parameter, the exponent n, regression results in a value of −0.3295, which almost matches the suggested theoretical value of −1/3, and thus, supports the viability of the underlying measurements. Based on this, it is possible to ascribe actual cooling rates to the foamed compression test samples via a microstructural feature.
Figure 7 underlines the fact that SDAS is independent of Sr, B or TiB2 additions, as no systematic deviation of the various sample series from the fit curve can be asserted. Study of the powder compacts has provided insights into refining and modification effects of the various additives considered. Furthermore, the investigations allowed to compare influence of additives with the effect of cooling rate specifically on grain size. The findings provide a microstructure-based measure of cooling rate which can be transferred from fully dense materials to foams, as well as a quantification thereof (see Equation (6)).
3.2. Expansion Characteristics and Pore Structure of Precursor Material Variants
Figure 8 sums up the expansion measurements performed on different material variants. Measurements on B-containing samples have not been included based on the results of the previous evaluation of grain refinement performance, which favors further study of TiB2 in the composition ranges accessible. The error bars denote the standard deviation observed within the sample series tested (three to six samples evaluated in each case). Comparison of the maximum porosities achievable shows that both Sr and B additions adversely affect foamability. The effect is most evident for B additions, where levels as low as 70 ppm suffice to reduce maximum expansion from an average of 438.8% to 342.2%, and thus, by 22.0%, whereas Sr addition levels of 250 ppm and 465 ppm lead to a decrease of 8.5% and 21.8%, respectively.
This finding is contrasted by improvements in maximum achievable porosity achieved by addition of TiB2. Ti contents of 350 ppm result in a maximum expansion which equals both the standard material (sample series Al-1/TiH2 as received) at an average expansion of 430.9% and an otherwise identical material based on pure aluminum powders with reduced oxygen content (sample series Al-2/TiH2 as received, maximum expansion 425.1%), the latter matching the respective values of the additive-containing powders. This sample series has explicitly been included to rule out a major influence of the oxygen content of Al powders on deviations in expansion characteristics. The parameter as such is known to significantly influence this property, as has, e.g., been shown by Weigand, who determined the effective oxygen content range for pure Al alloys to be between 0.2 and 0.72 wt.% [72], while Asavavisichai reported high expansion for the same material, though in a cold rather than hot compacted state, at oxygen contents 0.24, 0.3 and 0.33 wt.%, with a decrease observed for 0.73 wt.% [73]. The fact that the oxygen content of all powders used falls into this range supports the observation that no significant differences in foamability were found between the two standard sample series without additives and different oxygen content levels. Thus, the results of this comparison underline that for the present study, any influence of oxygen content on expansion is secondary to phenomena associated with the various additives. This point is stressed by the fact that a further rise in Ti content to 465 ppm brings about a major increase in expansion by 18.5% to 520.1%. This superior performance of the TiB2 sample series matches similar observations by Kennedy et al. on pure Al foam, though TiB2 addition was studied in terms of stabilization and strengthening instead of grain refinement, and thus, used a much higher content level of 10 wt.% TiB2 [39].
Sr additions to Al-Si alloys differ in their effects on characteristics such as melt viscosity and surface tension based on the Si content. Limited reduction in viscosity is reported for eutectic compositions, while an increase has been observed for hypoeutectic alloys according to Song et al. [54].
Lower melt viscosity is generally considered to adversely affect foam stability. Static metal foam stabilization concepts suggest increasing melt viscosity, e.g., by means of adding non-surface-active ceramic particles, to suppress cell wall drainage, thinning and rupture of cell walls [55,56,74]. In contrast, concepts of foam stability based on dynamic influences indicate that low viscosity might favor healing of local defects which could otherwise develop into rupture sites during stretching of these membranes in foam expansion [15]. The latter point is of interest when considering the superior performance exhibited by TiB2 based samples. For hypoeutectic compositions and specifically AlSi7, as investigated here, Yan et al. suggest a reduction in viscosity at least for the semi-solid state when TiB2/TiAl3 is employed for grain refinement [53].
On the other hand, no effect of TiB2 additions on surface tension is known, whereas Sr is reported by [50] to reduce this properties’ value in Al-Si alloys. Considering once again static foam stability criteria, a decrease of surface tension should influence stability to some advantage, since it would mean a reduction of free surface energy. However, the dynamic concept suggested by Lehmhus assumes that high surface tension increases the driving force for compensation of neck formation during stretching of cell walls in the course of foam expansion, and may thus increase foam stability in conditions where dynamic effects represent the major threat to foam stability [15]. Similarly, Nadella et al. correlate reduced stability in Al-Si-Mg foams with the lowering effect of Mg additions on the surface tension [75].
The overall result of expansion measurements is fundamental for the decision to concentrate on Sr and TiB2 as grain refining/modifying agent in the course of the present study, and solely on TiB2 in terms of sample production for foam microstructure evaluation, and specifically for mechanical testing.
Figure 9 contrasts the cell morphology of samples containing no additives and as received and thermally treated titanium hydride as foaming agent with that of a sample containing untreated TiH2 in combination with TiB2 additions for grain refinement. The images reveal no noticeable influence of this additive on the cellular structure, whereas it is clearly visible that thermal treatment of the foaming agent leads to a more regular structure with increased average pore size.
3.3. Microstructural Modification of Foams and Influence on Mechanical Properties
Microstructural evaluations of foams have been performed for materials containing no additives, 465 ppm of Sr and 465 ppm of Ti as TiB2. The parameters evaluated include the SDAS value, from which actual cooling rates could be derived. Data was gathered in top, central and bottom locations within the foam. The findings suggest that top and center locations experience similar thermal conditions, whereas the bottom of the foam samples is subjected to slower cooling. This observation may be linked to effects of drainage, the influence of the thermal mass associated with the mold support, and the shielding of this part of the mold from forced convection cooling and water quenching. Table 4 lists the cooling rates determined from SDAS in conjunction with Equation (6) for the different positions and sample compositions.
The listing in Table 4 shows that cooling rates reached within the foam may even exceed the values actually measured in solid powder compacts. This may be explained by reductions in heat capacity per unit volume which coincide with the increased porosity. However, the finding must be seen critical as it implies that the derived cooling rates are in many cases based on an extrapolation of Equation (6) to values not covered by the original data set, which only extends to about 33 K/s (see Figure 7).
Figure 10 summarizes the studies on grain refinement in foams and should be matched with Figure 2 and Figure 4 for comparison with results obtained on powder compacts. Figure 11 adds the corresponding metallographic sections. The top line contains images of Barker etched samples giving an indication of grain size, while the bottom line images allow evaluation of the eutectic structure.
Data in Figure 10a confirms that grain refining additions are effective and further add to the effect of cooling rate. TiB2 containing samples undercut the reference material by a margin of approximately 20% at low and in excess of 30% at high cooling rates, at which grain sizes well below 40 µm are observed. For Sr additions, given the prevailing level of scatter, no effect on grain refinement can be substantiated. It is noteworthy that these results fall below those of measurements on powder compacts as summarized in Figure 2 by approximately one order of magnitude.
In contrast, Figure 10b,c reveal that under conditions of foaming, in stark divergence from comparable findings based on non-foamed powder compacts and irrespective of the cooling rate, addition of Sr has very limited influence on the expression of the eutectic. Values of both the specific boundary layer SV and the integral of average curvature MV roughly match corresponding measurements on powder compacts, but show a more significant dependency on cooling rate than on additive content.
Figure 11 illustrates the findings expressed in the diagrams: Sr-, but even more so TiB2-containing samples show regions with fine and coarse eutectic morphologies that do not differ greatly from those observed in the reference samples.
For all density levels compared, foams produced with the thermally treated foaming agent show highest levels of strength. Moreover, they are characterized by a clearly defined stress peak immediately following the elasto-plastic region (encircled in Figure 12). As Alkheder and Vural pointed out, based on general considerations and 2D simulation results, such peaks can be interpreted as expression of stored elastic energy, which is released once collapse of the structure starts. Naturally, occurrence of this effect is favored in regular structures, in which the capacity of resistance to an external load is distributed more homogeneously, and thus localization of failure only arises at higher levels of global load [68,76].
When comparing grain refined and non-refined material variants based on untreated foaming agents, ultimate compressive strength levels nearly match for densities of approximately 0.3 and 0.4 g/cm3. At higher densities, the non-refined foams outperform the refined ones. Initial peaks can be identified, though they are less clearly distinguished in these sample series, and specifically so in the grain refined one.
A notable distinction between refined and non-refined samples is a postponed onset of densification observable in the former.
Figure 13 shows exemplarily the density dependence of plateau strength, ultimate compression strength and tangent modulus for the two unmodified reference series samples and the grain refined sample series. The diagram includes the fit curves derived for the various properties and specimen series using a variant of the standard Gibson/Ashby approach for describing the dependence between density and mechanical characteristics in foams already introduced as Equation (2) (plateau and ultimate compressive strength) and 3 (tangent modulus) above. Fitting is done according to a least squares method with variation of the factor C and the exponent n. Table 5 sums up all values derived for the parameters C and n and the three sample series. As all evaluations are based on the absolute density of the foam, the parameter C as given in the table differs in definition from the form introduced in Equations (2) and (3).
These data clearly show that among all sample series, those based on the thermally treated foaming agent show by far the best adherence to the general dependency of strength and stiffness on density postulated by Gibson and Ashby, even though the values of the fitting curve’s exponent do neither meet expectations for stiffness (with an expected value of 2 compared to 1.47 for the respective sample series) nor for strength (1.5 versus 1.98 and 1.56, respectively).
Thus, since this is the major difference specifically between both sample series without modification, but different foaming agents, it must be assumed that this phenomenon is based on the respective expression of the pore structure, which has already been shown to be favorable in the case of thermally treated TiH2 in Figure 9 as well as various earlier publications [13,14,16,17,77].
Closer observation, however, reveals that the expression of this structural deviation is alleviated at higher levels of porosity. In the present case, a boundary of this kind can be identified at a density of about 0.4 g/cm3, which corresponds roughly to the earlier observations related to the stress strain curves in Figure 12, which also tend to deviate more significantly at lower porosity and level of expansion. The observation as such is in line with earlier studies suggesting a healing of initial deficiencies in pore structure following an extended period of expansion, i.e., an expansion to a higher final porosity [14,77]. This finding is of considerable importance, as it may serve to define a limit in density above which pore structure can be effectively controlled to adapt global mechanical performance, which in turn implies that microstructural effects to this end should primarily be sought for—and aimed at—below this density level.
A fundamental assumption of the present study was that failure of foam is considerably affected by local failure initiation sides either in the form of Al-Si interfaces or grain boundaries approaching in their dimensions those of cell walls and struts. Such a dependence of failure initiation on local, randomly distributed microstructural weaknesses suggest a description of strength based on a Weibull distribution function. General recommendations for this type of analysis suggest a number of at least 30 samples/data points. At 38 and 60 for grain refined and untreated reference samples, this condition is fulfilled in both cases. Moreover, approximation via a Weibull distribution function is considered justified if an asymmetric shape of the probability density function is observed. This has qualitatively been verified for the three parameters plateau strength, ultimate compressive strength and tangent modulus via the observed histograms of these characteristics in their normalized form. The respective diagrams are contrasted in Figure 14, which contains data for non-refined, reference and TiB2-refined foams. Essentially, the non-refined foams do show a slight asymmetry, while the grain refined samples tend to exhibit a more symmetric distribution. Note that the parameters compared here are normalized using the observed density dependence as described in Section 2 of this manuscript.
The following Figure 15, Figure 16 and Figure 17 depict Weibull evaluation plots of the same compressive properties—namely plateau strength, ultimate compressive strength and tangent modulus. The Weibull distribution parameters for derived from this evaluation for both sample series are given in Table 4. The underlying cumulative distribution function is given by:
F(ρ) = 1 − exp(−(σ0 · ρ−1)m)
In general, the plots in Figure 15, Figure 16 and Figure 17 show a good match of the experimental data with the expected linear relationship in the double-logarithmic plot and thus support the possibility of expressing material performance via a Weibull distribution. For both plateau and ultimate compressive strength, the respective scale parameter reaches higher values in the case of the non-refined reference material. The tangent modulus, however, clearly deviates from this behavior (Table 6). Common to all material properties, however, is the fact that the shape parameter, i.e., the modulus m, is increased by the refinement. As higher values of this parameter indicate a narrower distribution, the conclusion is that grain refinement can indeed reduce the level of scatter observed.
4. Discussion
The present study shows that grain refinement of PM aluminum foams made from hypoeutectic Al-Si matrix alloys is a viable approach. Both the microstructural evaluation of powder compact samples without foaming agent as well as the corresponding studies on actual foam samples show a significant influence of the refining agent chosen, TiB2. However, contrasting data gathered from powder compacts and foam samples shows that though the relative influence of the refining treatment on grain size is similar in both cases, the absolute grain sizes differ significantly. For powder compacts, values roughly between 150 and 900 µm were found, while foam samples show grains of approximately 40 to 150 µm. Differences in cooling rate may be excluded as underlying cause of this phenomenon, as the evaluation of secondary dendrite arm spacing (SDAS) and the establishment of a correlation between this microstructural feature and the cooling rate on powder compacts has facilitated the association of cooling rates with the grain sizes measured on foams, too. As expected, the respective data do not support any large deviation of the cooling rates prevalent in foams from the range covered in the experiments performed on powder compacts. However, there is still room for several possible explanations: first, Ti content in foam samples is naturally increased, as the blowing agent, TiH2, will add to it. The result may be a secondary grain refining effect superimposed to that of the deliberately added TiB2. Second, the topology of the foam itself, and specifically the fact that the dimensions of its main structural elements, cell walls and struts fall short of the grain sizes measured on powder compacts by up to one order of magnitude, will prohibit the formation of large grains in a foam. This sterical hindrance is amplified further by the fact that the smooth surface of the solidified foam’s cell walls suggest that solidification and thus nucleation of grains occurs not only within these membranes, but may even start at the interface between liquid and gas, potentially helped by the fact that, e.g., oxide particles present in the matrix alloy [78] can accumulate here and act as heterogeneous nucleation sites, leaving once again less room for grains to grow within the cell walls and struts.
In contrast to grain refinement, modification of the eutectic structures has not been achieved in foams. The reason for this maybe deduced from the comparison of the two powder compact sample test series, which differ in temperature and in the time of exposure to the respective temperature. As mentioned earlier, comparison of initial powder compact sample series clearly shows that successful modification of the eutectic structure in a material produced by compaction of a powder mixture in which only one component brings in the modifying agent apparently requires an extended process window for distribution of the dissolved modifier. 10 min at 680 °C serve this purpose, while 5 min at 660 °C do not entirely; however, the latter is a better representation of the actual conditions during foaming as performed in the present study, which uses unmodified foaming agents in additive-containing samples. Since these conditions cannot be altered without putting the stability of the foam at risk—which, as this study has shown, is compromised by Sr addition anyway—the only way to achieve Sr-based eutectic modification in a metal foam of the type studied here would seem to be choosing an Al powder that contains the optimum level of modifying agent from the start. This would effectively eliminate the need for distributing Sr by the time- and temperature-dependent process of diffusion within the matrix material. In the present study, this approach was not adopted, since working with a master alloy-like powder containing increased levels of Sr allowed facile production of samples covering a range of Sr contents rather than a single value. In any case, the adverse effect of Sr on foam stability practically ruled out the production of compression test samples from this material variant and thus limited the studies on modification to microstructural investigations.
Comparison of compression test data between samples with and without grain refiner but identical, non-optimized foaming agents suggests that macroscopic deficiencies dominate mechanical response. The effect of grain refinement is thus somewhat obscured in stress-strain curves as well as strength-versus-density plots. This finding is stressed further by the obvious increase in strength observed for the third sample series based on thermally treated foaming agents. As a consequence, further studies on grain refinement should be based on samples with comparable regularity in macroscopic structure to facilitate a clearer discrimination of the influence of refinement and modification. Meanwhile, the fact that the optimization of the macroscopic foam structure achieved by means of using a thermally treated, oxidized and depleted blowing agent [14,77] not only results in the highest strength of all sample types compared, but also shows least scatter (see fit quality as expressed by R2 in table) and best adherence to the values of the exponent of the strength-density relation theoretically predicted by Gibson and Ashby [12] underlines that it is in fact this macroscopic structure which primarily controls a metal foam’s mechanical performance. In this respect, the results of the present study confirm the hierarchy of influencing factors put forward in the introduction based on authors like Mosler et al., Martin et al. or Mu et al. [8,9,10].
Furthermore, it is apparent that additional improvements in grain refining efficiency are required to bring grain sizes down to levels which clearly fall below the cross-sectional dimensions of the main structural elements of an aluminum foam of the type considered here. This relates to cell walls, but predominantly to the struts as the primary structural members; their size at least should ideally be undercut by one order of magnitude. At present, with typical membrane thicknesses of approximately 80 µm and struts approaching two–three times this value [19], this has not yet been achieved. The expected benefit of this would be a shift of cell wall failure mechanisms to regions in which the quasi-isotropic behavior of polycrystal dominates. As of now, the ratio between cell wall thickness and typical grain size implies that single crystal plasticity effects, and namely anisotropy of grains with unfavorable orientation relative to the loading direction, may act as additional weak spots within the foam’s structure. Moreover, as the studies of microstructural features of the powder compacts have shown, it must be assumed that any beneficial effect of grain size reduction is partly obscured by the observed coarsening effect of TiB2 and B on the expression of the eutectic phase. In this context, it must be considered unfortunate that the insufficient expansion characteristics of the Sr-containing materials did not allow stable production of sufficient numbers of samples for mechanical testing and specifically Weibull evaluation. Despite these facts, the Weibull evaluation does show a beneficial effect of grain refinement in the increased values of the Weibull modulus m in samples treated, a characteristic that indicates a reduction in scatter of the respective properties.
5. Conclusions
Though in principle successfully applicable, the results obtained show that grain refinement of the type employed here cannot lead to grain sizes that match or undercut the dimensions of typical cell walls. Thus, it remains questionable whether this approach alone can have significant influence on the mechanical performance of the foams. A different picture is observed for modification treatments affecting the eutectic phase. Here, both the influence of the modifying agents as well as secondary effects of the refining treatment can shift the size of the respective microstructural features to levels below typical cell wall thickness levels. This is of major relevance in view of the initial argument that specifically the interface area between Si and Al phases within the eutectic can act as weak spot at which cell wall failure is initiated. However, transferring this effect to foams requires a base material, i.e., matrix material powder, which already contains the modifying agent in homogeneous distribution and thus eliminates the need to achieve just this by diffusion during the foaming process; the present study has shown that the combination of time and temperature typical for foam expansion cannot guarantee this. Moreover, Sr additions introduced for eutectic modification turned out to adversely affect expansion characteristics—hence, Sr-modified samples could not be included in the evaluation of the foams’ mechanical performance.
Comparison of density-dependent strength and stiffness shows modified foams as weaker compared to both their untreated counterparts. A possible explanation may be that on the whole, more ductile matrix combined with an irregular structure, possibility of ductile deformation promotes premature macroscopic yield when compared to the fracture-based failure associated with the initial assumption that Si phases might be preferred fracture planes in cell walls.
Thus, the investigations clearly show that the influence of microstructural features is limited when it comes to average strength levels determined for samples identical in terms of composition—except for the respective modifying agents—and processing conditions. The scatter of these average strength values, however, is noticeably reduced by grain refinement. For designing with a material, the consequences of this achievement are similar to an increase in strength, since reduced scatter means that higher stress levels can be accepted at a given level of safety.
Furthermore, it is of great importance for metal foam production that the equivalence of two different concepts to achieve the intended microstructural changes could in principle be demonstrated; both an increase in cooling rate and the use of grain refining agents yield similar results. The fact that the effectivity of the former approach seems more pronounced does not devaluate the latter, since in foam production, local cooling rates are limited specifically where large parts are concerned due to effects such as the reduced thermal conductivity within the foam. Thus, grain refinement based on TiB2/TiAl3 additions may prove a valuable alternative.
Comparisons based on non-foamed powder compacts have shown that a limited increase in foaming time and final temperature will positively affect the efficacy of treatments; specifically for treatments based on solution of active substances, this finding is less than surprising. This is an additional argument for combining modification and grain refinement with the use of thermally treated foaming agents, which naturally induce a shift of processing conditions in the required direction. Moreover, such a combination, though not tested in the present study, must seem attractive based on the chance to combine improvements in micro- and pore structure.
Future investigations should have a closer look at conditions of adding grain refining substances, especially in terms of increasing levels of concentration of TiB2/TiAl3-containing Al powders, since using large proportions of such specialty powders for precursor material production would have unwanted economic implications. However, basing refinement on such an emphasized master alloy approach may cause local variations in the availability of nucleation sites, especially when assuming that the nucleant paradigm correctly describes the process, as in this case, non-soluble constituents, which cannot widely be redistributed during foam expansion, take the stress in initiating nucleation. The question of the ideal level of addition also needs to be answered, since in the current study maximum values were set by the powders available. Moreover, a further study of size effects should be envisaged to clarify to what degree microstructural modification will affect results of the kind seen by Blazy et al. [79].
Finally, the ongoing search for alternative grain refiners and modifying agents should be taken into account; recent developments in this area have been summarized by Easton et al. as well as Liu [58,60]. These, and other studies such as that of Xu et al., have highlighted potential new approaches in grain refinement, e.g., scandium addition [80]. Beyond a switch to new refining and modifying agents, combinations of both processes may also be considered [81], the more so since the present study has shown that Sr- and B-based modification on the one hand and TiB2-based grain refinement have opposed effects on foam expansion, Thus, combinations might partially cancel out negative side effects of Sr- and B-based treatments. In general, eutectic modification should in itself not be neglected—specifically if solutions can be identified with less detrimental effect on foam expansion. In the end, it is not only grain size that may reach the dimensions of cell walls, but also the size of eutectic silicon structures, which may just as well act as preferred fracture planes.
In conclusion, we believe the present study has shown that grain refinement of aluminum foam has both promises and challenges. Of the latter, not all have been successfully addressed yet. There is room for improvement, and we believe that our results provide a sound basis for such future research, for which we have suggested several promising paths.
Author Contributions
Conceptualization, U.M. (Ulrike Mosler), D.L., D.H., J.W. and U.M. (Ulrich Martin); methodology, U.M. (Ulrike Mosler), D.H. and D.L.; validation, D.H., U.M. (Ulrike Mosler) and D.L.; formal analysis, D.H., U.M. (Ulrike Mosler) and D.L.; investigation, D.H., U.M. (Ulrike Mosler) and D.L.; data curation, D.H., U.M. (Ulrike Mosler) and D.L.; writing—original draft preparation, D.L.; writing—review and editing, D.H., U.M. (Ulrike Mosler), U.M. (Ulrich Martin), J.W. and D.L.; visualization, D.H. and D.L.; supervision, U.M. (Ulrike Mosler), D.L. and U.M. (Ulrich Martin).
Funding
Part of this research was funded by the German Research Foundation (Deutsche Forschungsgemeinschaft, DFG) within SPP 1075, “Cellular Metallic Materials”.
Acknowledgments
CT measurement facilities were made accessible by B. Illerhaus, Bundesanstalt für Materialprüfung (BAM), Berlin, and J. Gudat, ProCon GmbH, Hannover, whose help is greatly appreciated. Illerhaus also gave support in the evaluation of CT data. Furthermore, Ray Cook, Alpoco, provided Al powders and contributed to the discussions on grain refinement and modification in general.
Conflicts of Interest
The authors declare no conflict of interest.
References
- Baumeister, J.; Rausch, G.; Stöbener, K.; Lehmhus, D.; Busse, M. Aluminium foam composites–applications in railroad manufacturing. Mater. Werkst. 2007, 38, 939–942. [Google Scholar] [CrossRef]
- Banhart, J.; Seeliger, H.-W. Aluminium Foam Sandwich Panels: Manufacture, Metallurgy and Applications. Adv. Eng. Mater. 2008, 10, 793–802. [Google Scholar] [CrossRef]
- Neugebauer, R.; Hipke, H. Machine tools with metal foams. Adv. Eng. Mater. 2006, 8, 858–863. [Google Scholar] [CrossRef]
- Garcia-Moreno, F. Commercial Applications of Metal Foams: Their Properties and Production. Materials 2016, 9, 85. [Google Scholar] [CrossRef]
- Baumeister, J. Verfahren Zur Herstellung Poröser Metallkörper. German Patent No. DE 40 18 360 C1, 8 June 1991. (date of filing, patent granted 29 May 1991). [Google Scholar]
- Banhart, J. Manufacture, characterization and application of cellular metals and metal foams. Prog. Mater. Sci. 2001, 46, 559–632. [Google Scholar] [CrossRef]
- Lehmhus, D.; Vesenjak, M.; de Schampheleire, S.; Fiedler, T. From Stochastic Foam to Designed Structure: Balancing Cost and Performance of Cellular Metals. Materials 2017, 10, 922. [Google Scholar] [CrossRef]
- Martin, U.; Mosler, U.; Lehmhus, D.; Müller, A.; Heinzel, G. Hierarchical structure of aluminium alloys and relation to compression behavior. High Temp. Mater. Process. 2007, 26, 291–296. [Google Scholar] [CrossRef]
- Mosler, U.; Martin, U.; Losseva, N.; Oettel, H. A statistic approach to estimate the compression strength of aluminium foams. In Cellular Metal: Manufacture, Properties, Applications; Banhart, J., Fleck, N.A., Mortensen, A., Eds.; MIT Publishing: Bremen, Germany, 2003; pp. 387–392. [Google Scholar]
- Mu, Y.; Yao, C.; Liang, L.; Luo, H.; Zu, G. Deformation mechanisms in closed-cell aluminum foam in compression. Scr. Mater. 2010, 63, 629–632. [Google Scholar] [CrossRef]
- Avalle, M.; Lehmhus, D.; Peroni, L.; Pleteit, H.; Schmiechen, P.; Belingardi, G.; Busse, M. AlSi7 metallic foams-aspects of material modelling for crash analysis. Int. J. Crashworth. 2009, 14, 269–285. [Google Scholar] [CrossRef]
- Gibson, L.J.; Ashby, M.F. Cellular Solids; Cambridge University Press: Cambridge, UK, 1997. [Google Scholar]
- Kennedy, A.R.; Lopez, V.H. The decomposition behaviour of as-received and oxidized TiH2 foaming-agent powder. Mater. Sci. Eng. A 2003, 357, 258–263. [Google Scholar] [CrossRef]
- Lehmhus, D.; Rausch, G. Tailoring titanium hydride decomposition kinetics by annealing in various atmospheres. Adv. Eng. Mater. 2004, 6, 313–330. [Google Scholar] [CrossRef]
- Lehmhus, D. Dynamic Collapse Mechanisms in Metal Foam Formation. Adv. Eng. Mater. 2010, 12, 465–471. [Google Scholar] [CrossRef]
- Matijasevic, B.; Banhart, J. Improvement of aluminium foam technology by tailoring of blowing agent. Scr. Mater. 2006, 54, 503–508. [Google Scholar] [CrossRef]
- Matijasevic-Lux, B.; Banhart, J.; Fiechter, S.; Görke, O.; Wanderka, N. Modification of titanium hydride for improved aluminium foam manufacture. Acta Mater. 2006, 54, 1887–1900. [Google Scholar] [CrossRef]
- Proa-Flores, P.M.; Drew, R.A.L. Production of Aluminum Foams with Ni-coated TiH2 Powder. Adv. Eng. Mater. 2008, 10, 830–835. [Google Scholar] [CrossRef]
- Stanzick, H.; Wichmann, M.; Weise, J.; Helfen, L.; Baumbach, T.; Banhart, J. Process control in aluminium foam production using real-time X-ray radioscopy. Adv. Eng. Mater. 2002, 4, 814–823. [Google Scholar] [CrossRef]
- Mosler, U.; Heinzel, G.; Martin, U.; Oettel, H. Microstructure and deformation behaviour of aluminium foams. Mater. Werkst. 2000, 31, 519–522. [Google Scholar] [CrossRef]
- Gall, K.; Yang, N.; Horstemeyer, M.; McDowell, D.L.; Fan, J. The debonding and fracture of Si particles during the fatigue of a cast Al-Si alloy. Metall. Mater. Trans. A 1999, 30, 3079–3088. [Google Scholar] [CrossRef]
- Su, J.F.; Nie, X.; Stoilov, V. Characterization of fracture and debonding of Si particles in AlSi alloys. Mater. Sci. Eng. A 2010, 527, 7168–7175. [Google Scholar] [CrossRef]
- Su, J.F. Characterization of Fracture and Debonding of Silicon Particles in Aluminium Silicon Alloys. Master Thesis, University of Windsor, Windsor, ON, Canada, 2009. [Google Scholar]
- Lados, D.A.; Apelian, D. Relationships between microstructure and fatigue crack propagation paths in Al–Si–Mg cast alloys. Eng. Fract. Mech. 2008, 75, 821–832. [Google Scholar] [CrossRef]
- Chan, K.S.; Jones, P.; Wang, Q. Fatigue crack growth and fracture paths in sand cast B319 and A356 aluminum alloys. Mater. Sci. Eng. A 2003, 341, 18–34. [Google Scholar] [CrossRef]
- Xia, S.; Qi, Y.; Perry, T.; Kim, K.-S. Strength Characterization of Al/Si interfaces: A hybrid method of nanoindentation and finite element analysis. Acta Mater. 2009, 57, 695–707. [Google Scholar] [CrossRef]
- Banhart, J.; Seeliger, H.-W. Recent Trends in Aluminum Foam Sandwich Technology. Adv. Eng. Mater. 2012, 14, 1082–1087. [Google Scholar] [CrossRef]
- Stöbener, K.; Lehmhus, D.; Avalle, M.; Peroni, L.; Busse, M. Aluminum foam-polymer hybrid structures (APM aluminum foam) in compression testing. Int. J. Solids Struct. 2008, 45, 5627–5641. [Google Scholar] [CrossRef]
- Lehmhus, D.; Baumeister, J.; Stutz, L.; Schneider, E.; Stöbener, K.; Avalle, M.; Peroni, L.; Peroni, M. Mechanical characterisation of particulate aluminium foams-strain-rate, density and matrix alloy vs. adhesive effects. Adv. Eng. Mater. 2010, 12, 596–603. [Google Scholar] [CrossRef]
- Vesenjak, M.; Gacnik, F.; Krstulovic-Opara, L.; Ren, Z. Behavior of composite advanced pore morphology foam. J. Compos. Mater. 2011, 45, 2823–2831. [Google Scholar] [CrossRef]
- Duarte, I.; Vesenjak, M.; Krstulović-Opara, L.; Ren, Z. Compressive performance evaluation of APM (Advanced Pore Morphology) foam filled tubes. Compos. Struct. 2015, 134, 409–420. [Google Scholar] [CrossRef]
- Lehmhus, D.; Banhart, J.; Rodriguez-Perez, M.A. Adaptation of aluminium foam properties by means of precipitation hardening. Mater. Sci. Technol. 2002, 18, 474–479. [Google Scholar] [CrossRef]
- Lázaro, J.; Solórzano, E.; Escudero, J.; de Saja, J.A.; Rodríguez-Pérez, M.A. Applicability of Solid Solution Heat Treatments to Aluminum Foams. Metals 2012, 2, 508–528. [Google Scholar] [CrossRef]
- Khan, K.L.A.; Kumar, G.; Prasad, R. Effect of Age Hardening and Quenching Media on Aluminium Foams. Int. J. Appl. Eng. Res. 2018, 13, 245–248. [Google Scholar]
- Duarte, I.; Banhart, J. A study of aluminium foam formation–kinetics and microstructure. Acta Mater. 2000, 48, 2349–2362. [Google Scholar] [CrossRef]
- Lehmhus, D.; Busse, M. Potential new matrix alloys for production of PM aluminium foams. Adv. Eng. Mater. 2004, 6, 391–396. [Google Scholar] [CrossRef]
- Campana, F.; Pilone, D. Effect of wall microstructure and morphometric parameters on the crush behaviour of Al alloy foams. Mater. Sci. Eng. A 2008, 479, 58–64. [Google Scholar] [CrossRef]
- Helwig, H.-M.; Garcia-Moreno, F.; Banhart, J. A study of Mg and Cu additions on the foaming behaviour of Al–Si alloys. J. Mater. Sci. 2011, 46, 5227–5236. [Google Scholar] [CrossRef]
- Kennedy, A.R.; Asavavisichai, S. Effect of TiB2 particle addition on the expansion, structure and mechanical properties of PM Al foams. Scr. Mater. 2004, 50, 115–119. [Google Scholar] [CrossRef]
- Nafisi, S.; Ghomashchi, R. Grain refining of conventional and semi-solid A356 Al–Si alloy. J. Mater. Process. Technol. 2006, 174, 371–383. [Google Scholar] [CrossRef]
- Helwig, H.-M.; Hiller, S.; Garcia-Moreno, F.; Banhart, J. Influence of Compaction Conditions on the Foamability of AlSi8Mg4 Alloy. Metall. Mater. Trans. B 2009, 40, 755–767. [Google Scholar] [CrossRef]
- Banhart, J.; Garcia-Moreno, F.; Heim, K.; Seeliger, H.-W. Light-weighting in transportation and defence using aluminium foam sandwich structures. In Proceedings of the International Symposium on Light Weighting for Defence, Aerospace and Transportation, Indian Institute of Metals, Goa, India, 11 November 2017. [Google Scholar]
- Easton, M.; St. John, D. Grain Refinement of Aluminium Alloys: Part, I. The Nucleant and Solute Paradigms–A Review of the Literature. Metall. Mater. Trans. A 1999, 30, 1613–1623. [Google Scholar] [CrossRef]
- Easton, M.; St. John, D. Grain Refinement of Aluminium Alloys: Part II. Confirmation of, and a Mechanism for, the Solute Paradigm. Metall. Mater. Trans. A 1999, 30, 1625–1633. [Google Scholar] [CrossRef]
- Schumacher, P. Keimbildungsmechanismen während der Kornfeinung von Al-Si-Legierungen. Giess. Rundsch. 2003, 50, 228–230. [Google Scholar]
- Müller, K. Möglichkeiten der Gefügebeeinflussung Eutektischer und Naheutektischer Aluminium-Silizium-Gusslegierungen unter Berücksichtigung der Mechanischen Eigenschaften; Fortschrittsberichte VDI, Series 5; VDI Verlag GmbH: Düsseldorf, Germany, 1996. [Google Scholar]
- Chen, X.-G. Kristallisation des Aluminium-Silizium-Eutektikums und Anwendung der Thermischen Analyse zur Kontrolle der Veredelung. Ph.D. Thesis, RWTH Aachen, Aachen, Germany, 1990. [Google Scholar]
- Chen, X.-G.; Ellerbrok, R.; Engler, S. Über die eutektischen Körner von Aluminium-Silizium-Legierungen. Teil 1. Veredeltes Eutektikum. Giessereiforschung 1990, 42, 1–10. [Google Scholar]
- Qiyang, L.; Qingchun, L.; Qifu, L. Modification of Al-Si alloys with Sodium. Acta Metall. Mater. 1991, 39, 2497–2502. [Google Scholar] [CrossRef]
- Srirangam, P.; Kramer, M.J.; Shankar, S. Effect of strontium on liquid structure of AlSi hypoeutectic alloys using high-energy X-ray diffraction. Acta Mater. 2011, 60, 503–513. [Google Scholar] [CrossRef]
- Timpel, M.; Wanderka, N.; Schlesiger, R.; Yamamoto, T.; Lazarev, N.; Isheim, D.; Schmitz, G.; Matsumura, S.; Banhart, J. The role of Strontium in modifying lauminium-silicon alloys. Acta Mater. 2012, 60, 3920–3928. [Google Scholar] [CrossRef]
- Dahle, A.K.; Tondel, P.A.; Paradies, C.J.; Arnberg, L. Effect of Grain Refinement on the Fluidity of Two Commercial AI-Si Foundry Alloys. Metall. Mater. Trans. A 1996, 27, 2305–2313. [Google Scholar] [CrossRef]
- Yan, M.; Luo, W. Effects of grain refinement on the rheological behaviors of semisolid hypoeutectic Al–Si alloys. Mater. Chem. Phys. 2007, 104, 267–270. [Google Scholar] [CrossRef]
- Song, X.; Bian, X.; Zhang, J.; Zhang, J. Temperature-dependent viscosities of eutectic Al–Si alloys modified with Sr and P. J. Alloys Compd. 2009, 479, 670–673. [Google Scholar] [CrossRef]
- Banhart, J. Metal Foams: Production and Stability. Adv. Eng. Mater. 2006, 8, 781–794. [Google Scholar] [CrossRef]
- Haibel, A.; Rack, A.; Banhart, J. Why are metal foams stable? Appl. Phys. Lett. 2001, 78, 154102. [Google Scholar] [CrossRef] [Green Version]
- Chen, Z.; Kang, H.; Fan, G.; Li, J.; Lu, Y.; Jie, J.; Zhang, Y.; Li, T.; Jian, X.; Wang, T. Grain refinement of hypoeutectic Al-Si alloys with B. Acta Mater. 2016, 120, 168–178. [Google Scholar] [CrossRef]
- Easton, M.; Qian, M.; Prasad, A.; St. John, D. Recent advances in grain refinement of light metals and alloys. Curr. Opin. Solid State Mater. Sci. 2016, 20, 13–24. [Google Scholar] [CrossRef] [Green Version]
- Lee, C. Effect of Ti-B addition on the variation of microporosity and tensile properties of A356 aluminium alloys. Mater. Sci. Eng. A 2016, 668, 152–159. [Google Scholar] [CrossRef]
- Liu, Z. Review of Grain Refinement of Cast Metals Through Inoculation: Theories and Developments. Metall. Mater. Trans. A 2017, 48, 4755–4776. [Google Scholar] [CrossRef]
- Müller, A.; Mosler, U. Gefügeinterpretation von Aluminiumschäumen. In Sonderbände der Praktischen Metallographie; Petzow, G., Ed.; Werkstoff-Informationsgesellschaft mbH: Frankfurt, Germany, 2001; Volume 32, p. 279. [Google Scholar]
- Mosler, U.; Heinzel, G.; Martin, U.; Oettel, H. Quantitative Charakterisierung der zellularen Struktur von Aluminium-Schäumen. In Sonderbände der Praktischen Metallographie; Petzow, G., Ed.; Werkstoff-Informationsgesellschaft mbH: Frankfurt, Germany, 2001; Volume 32, p. 121. [Google Scholar]
- Schumann, H. Metallographie; Wiley-VCH Verlag: Weinheim, Germany, 2004. [Google Scholar]
- Ohser, J.; Lorz, U. Quantitative Gefügeanalyse: Theoretische Grundlagen und Anwendung. In Freiberger Forschungshefte, B 276: Metallurgie und Werkstofftechnik, Werkstoffeinsatz; Deutscher Verlag für Grundstoffindustrie: Leipzig, Germany, 1994. [Google Scholar]
- Weber, M. Herstellung von Metallschäumen und Beschreibung der Werkstoffeigenschaften. Ph.D. Thesis, Technical University of Clausthal, Clausthal, Germany, 1995. [Google Scholar]
- Andrews, E.W.; Gioux, G.; Onck, P.; Gibson, L.J. Size effects in ductile cellular solids. Part II: Experimental results. Int. J. Mech. Sci. 2001, 43, 701–713. [Google Scholar] [CrossRef] [Green Version]
- Yu, H.; Guo, Z.; Li, B.; Yao, G.; Luo, H.; Liu, Y. Research into the effect of cell diameter of aluminium foam on its compressive properties. Mater. Sci. Eng. A 2007, 454, 542–546. [Google Scholar] [CrossRef]
- Alkheder, M.; Vural, M. Mechanical response of cellular solids: Role of cellular topology and microstructural irregularity. Int. J. Eng. Sci. 2008, 46, 1035–1051. [Google Scholar] [CrossRef]
- Weibull, W. A statistical distribution function of wide applicability. J. Appl. Mech. 1951, 18, 293–297. [Google Scholar]
- Chen, X.; Geng, H.; Li, Y. Study on the Eutectic Modification Level of Al-7Si Alloy by Computer Aided Recognition of Thermal Analysis Cooling Curves. Mater. Sci. Eng. A 2006, 419, 283–289. [Google Scholar] [CrossRef]
- Sahm, P.R.; Egry, I.; Volkmann, T. Schmelze, Erstarrung, Grenzflächen–Eine Einführung in die Physik und Technologie Flüssiger und Fester Metalle; Viehweg-Verlag: Wiesbaden, Germany, 2003. [Google Scholar]
- Weigand, P. Untersuchung der Einflussfaktoren auf die Pulvermetallurgische Herstellung von Aluminiumschaum. Ph.D. Thesis, RWTH Aachen, Aachen, Germany, 1999. [Google Scholar]
- Asavavisichai, S.; Kennedy, A.R. The role of oxidation during compaction on the expansion and stability of Al foams made via a PM Route. Adv. Eng. Mater. 2006, 8, 568–572. [Google Scholar] [CrossRef]
- Körner, C.; Arnold, M.; Singer, R.F. Metal foam stabilization by oxide network particles. Mater. Sci. Eng. A 2005, 396, 28–40. [Google Scholar] [CrossRef]
- Nadella, R.; Sahu, S.N.; Gokhale, A.A. Foaming characteristics of Al-Si-Mg (LM25) alloy prepared by liquid metal processing. Mater. Sci. Technol. 2010, 26, 908–913. [Google Scholar] [CrossRef]
- Tekoglu, C.; Gibson, L.J.; Pardoen, T.; Onck, P.R. Size effects in foams: Experiments and modelling. Prog. Mater. Sci. 2011, 56, 109–138. [Google Scholar] [CrossRef]
- Lehmhus, D.; Busse, M. Mechanical performance of structurally optimized AlSi7 aluminum foams—An experimental study. Mater. Werkst. 2014, 45, 1061–1071. [Google Scholar] [CrossRef]
- Asavavisichai, S.; Kennedy, A.R. The effect of oxides in various aluminium powders on foamability. Procedia Eng. 2012, 32, 714–721. [Google Scholar] [CrossRef] [Green Version]
- Blazy, J.-S.; Marie-Louise, A.; Forest, S.; Chastel, Y.; Pineau, A.; Awade, A.; Grolleron, C.; Moussy, F. Deformation and fracture of aluminium foams under proportional and non-proportional multi-axial loading: Statistical analysis and size effect. Int. J. Mech. Sci. 2004, 46, 217–244. [Google Scholar] [CrossRef]
- Xu, C.; Ma, C.; Sun, Y.; Hanada, S.; Lu, G.; Guan, S. Optimizing strength and ductility of Al-7Si-0.4 Mg foundry alloy: Role of Cu and Sc addition. J. Alloys Compd. 2019, 810, 151944. [Google Scholar]
- Riestra, M.; Ghassemali, E.; Bogdanoff, T.; Seifeddine, S. Interactive effects of grain refinement, eutectic modification and solidification rate on tensile properties of Al-10Si alloy. Mater. Sci. Eng. A 2017, 703, 270–279. [Google Scholar] [CrossRef]
Figure 1.
Foaming furnace used for sample production—(a) general layout including control units for heating (left) and movement (right), (b) nozzle arrangement for forced convection (FC) cooling (below furnace, with cylindrical foaming mold).
Figure 1.
Foaming furnace used for sample production—(a) general layout including control units for heating (left) and movement (right), (b) nozzle arrangement for forced convection (FC) cooling (below furnace, with cylindrical foaming mold).

Figure 2.
Average grain size of powder compacts, (a) as a function of Sr, B and TiB2 additive content when quenched in water, (b) depending on cooling rate for reference material without additives and samples containing medium levels of Sr, B and TiB2 addition as given in the diagram.
Figure 2.
Average grain size of powder compacts, (a) as a function of Sr, B and TiB2 additive content when quenched in water, (b) depending on cooling rate for reference material without additives and samples containing medium levels of Sr, B and TiB2 addition as given in the diagram.

Figure 3.
Metallographic sections of powder compacts containing (a–c) no additives (AlSi7 reference material), (d–f) Sr, (g–i) TiB2 and (j–l) B additions after thermal treatment (melting) for 5 min at 660 °C and cooling via (a,d,g,j) natural convection (NC), (b,e,h,k) forced convection (FC) and (c,f,I,l) water quenching (WQ), revealing differences in grain size and morphology (Barker etching). Content levels of Sr, TiB2 and B are 250, 350 and 140 ppm, respectively.

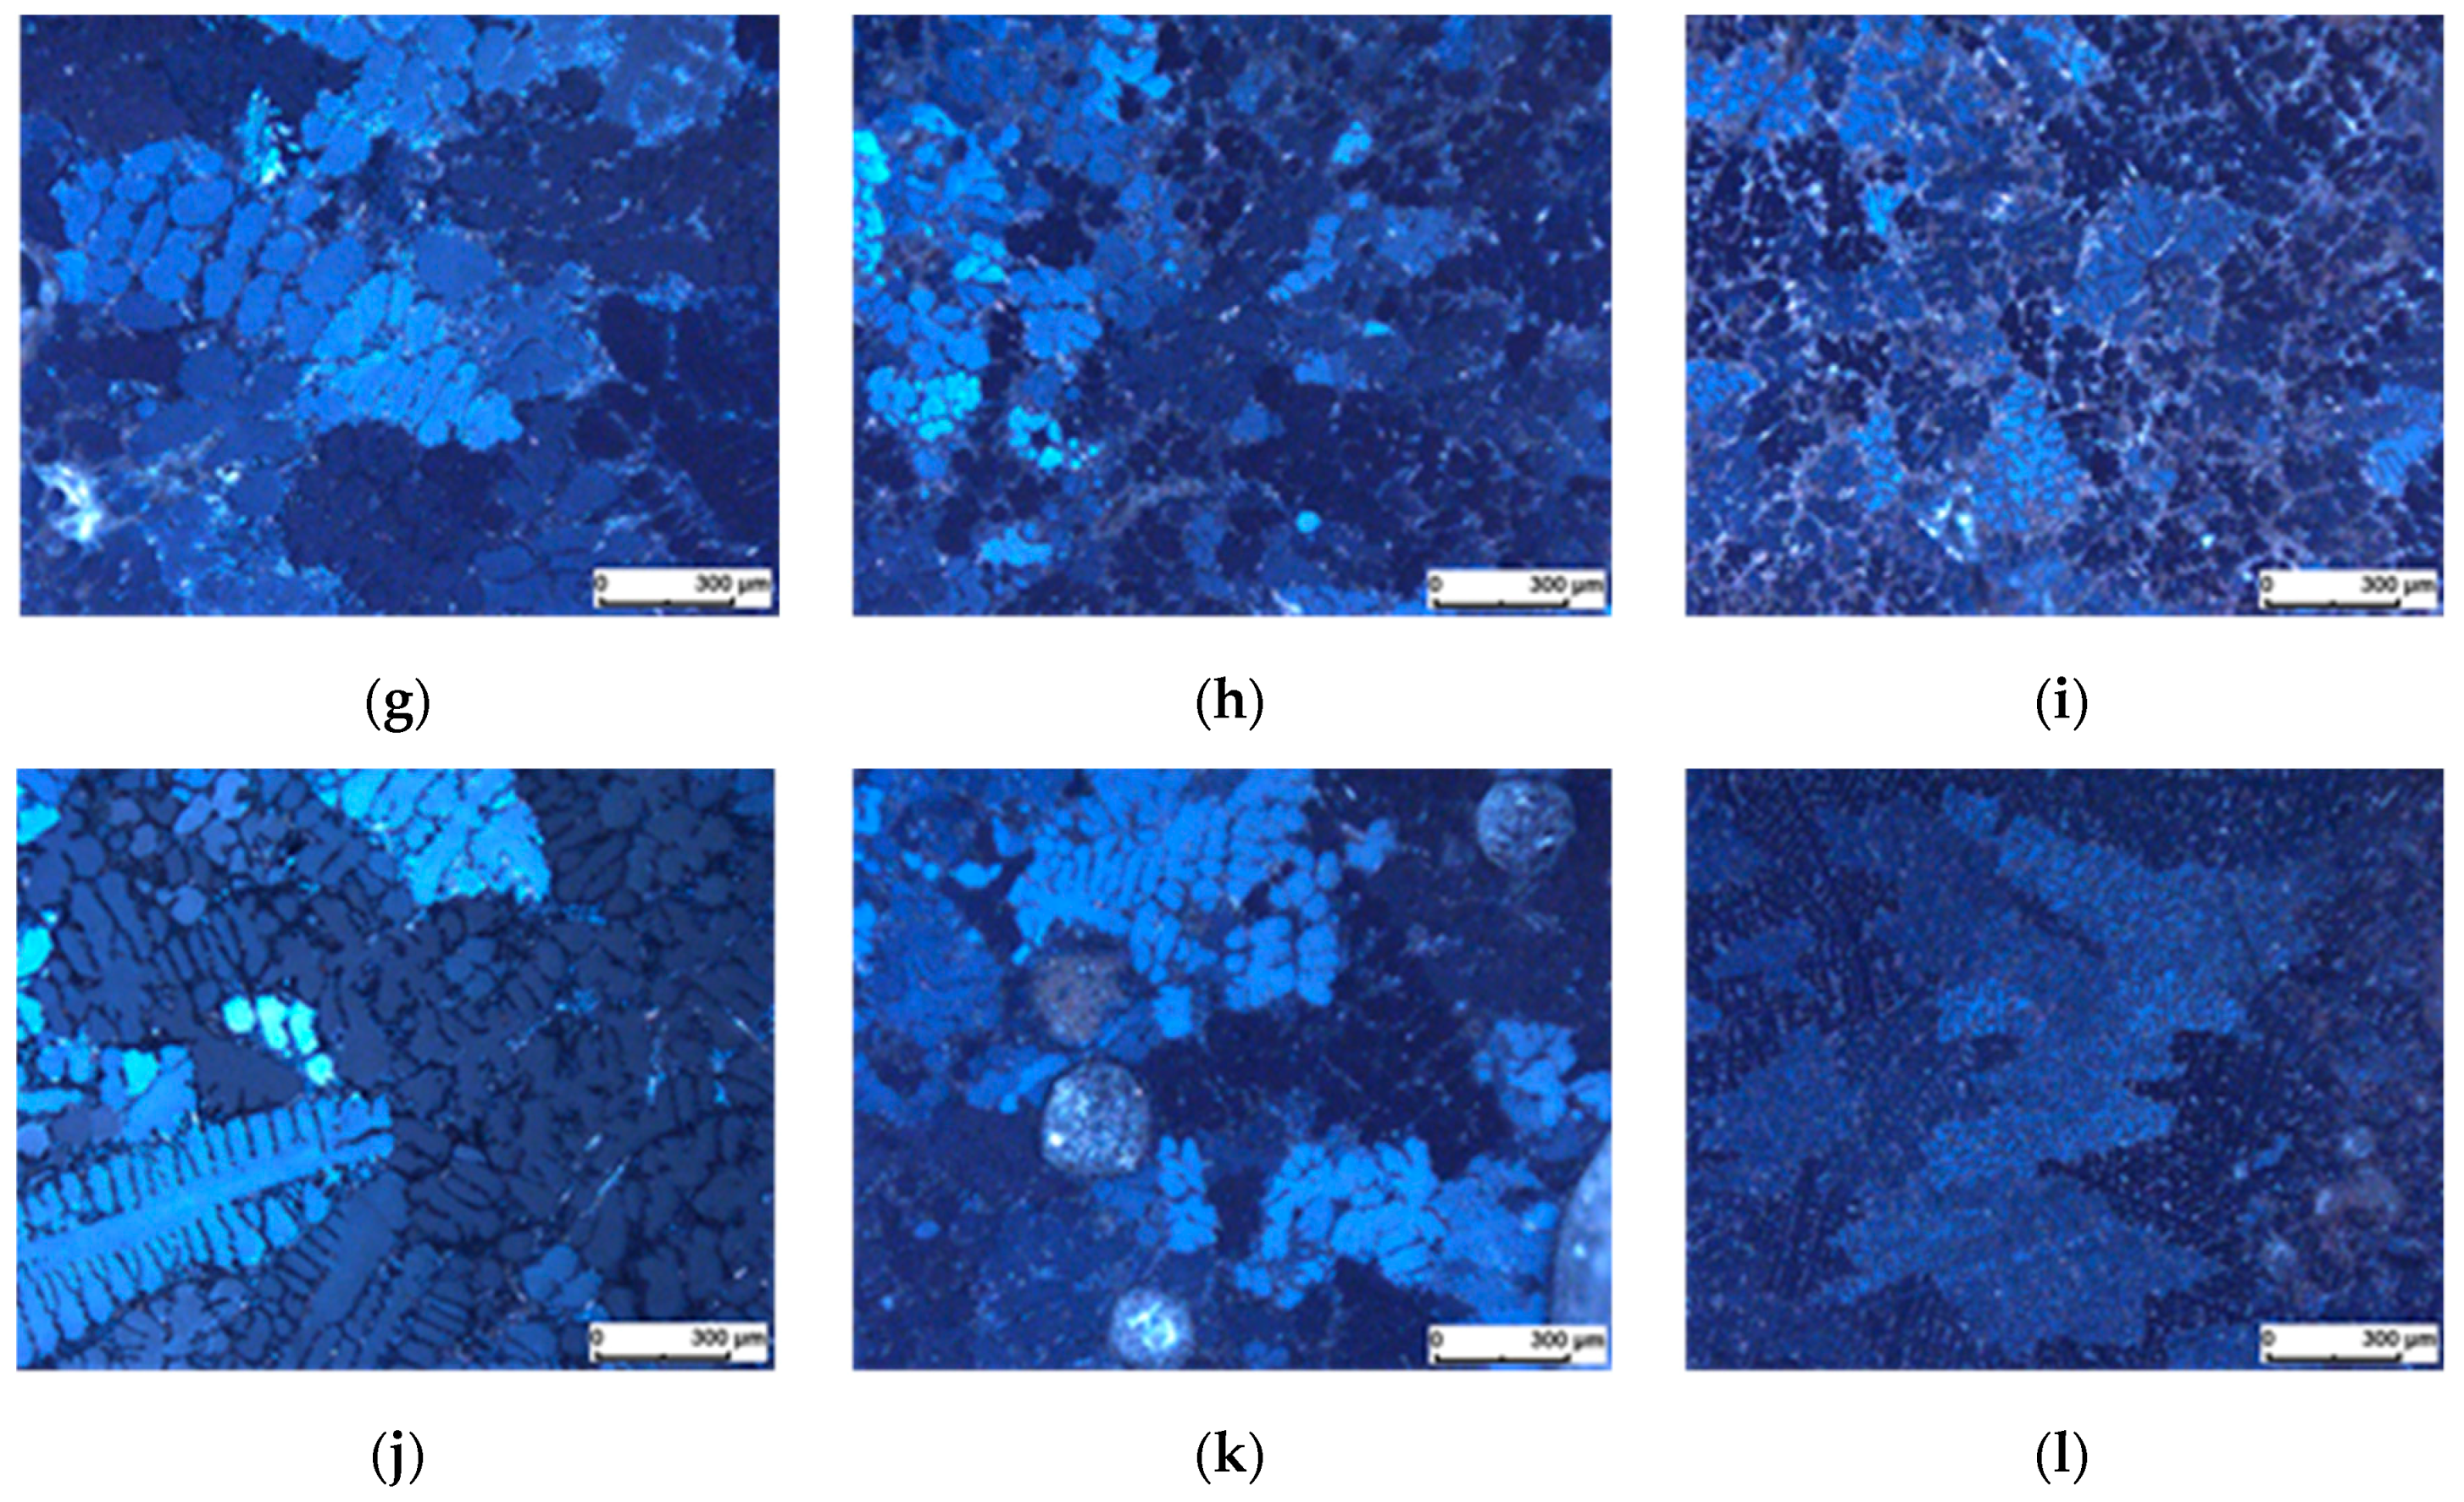
Figure 4.
Influence of holding time and temperature on expression of geometrical characteristics of the eutectic phase in powder compacts after melting and resolidification, (a) with Sr additions, (b) with TiB2 and (c) with B additions. Cooling is done by water quenching in all cases. For samples containing B additions, experimental data is available only for materials held for 5 min at 660 °C (series 1). The legend provided in Figure 4b refers to all diagrams.


Figure 5.
Powder compacts, morphology of the eutectic phase, influence of cooling rate and additives. Columns from left to right correspond to (a,d,g,j) natural convection, (b,e,h,k) forced convection and (c,f,I,l) water quenching, lines from top to bottom showing (a–c) reference samples without additives, followed by (d–f) 250 ppm Sr, (g–i) 350 ppm TiB2 and (j–l) 140 ppm B. All images taken at identical magnification.

Figure 6.
Powder compacts, morphology of the eutectic phase, influence of additive content at high cooling rates. In columns from left to right, additive level is stepped up from 130 to 250 to 465 ppm (Sr, top row, (a–c)), 260 to 350 to 465 ppm (TiB2, center row, (d–f)) and 70 to 140 to 280 ppm (B, bottom row, (g–h)). Note the twofold increase in magnification compared to Figure 5.

Figure 7.
Measured values for secondary dendrite arm spacing (SDA) and cooling rate and fit curve based on Sahm’s equation (Equation (4), [71]).
Figure 7.
Measured values for secondary dendrite arm spacing (SDA) and cooling rate and fit curve based on Sahm’s equation (Equation (4), [71]).
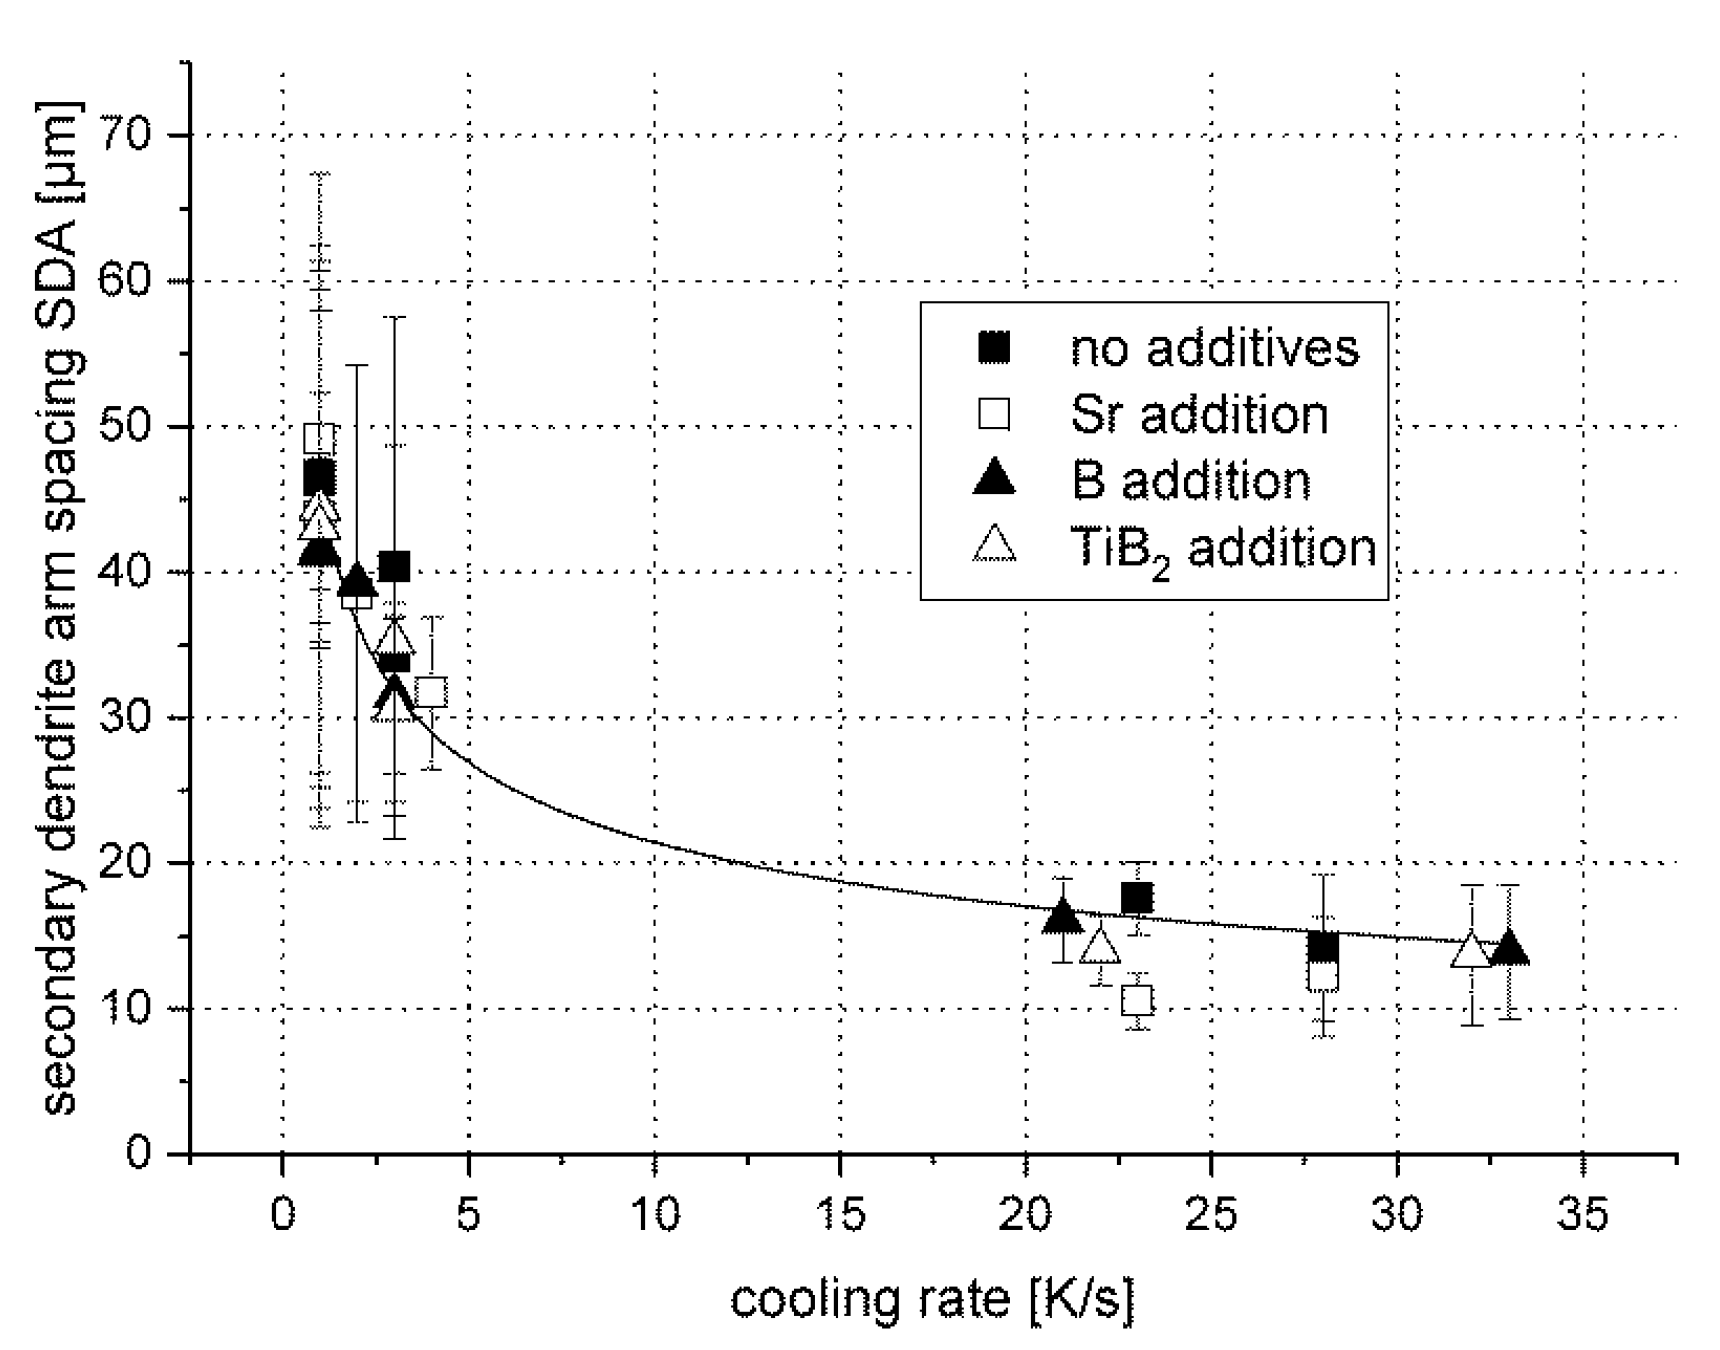
Figure 8.
Maximum expansion of various precursor material variants, highlighting the influence of additive type and content.
Figure 8.
Maximum expansion of various precursor material variants, highlighting the influence of additive type and content.

Figure 9.
Foam pore structure, alloy variants AlSi7 with “as received” TiH2 as foaming agent (left), thermally treated TiH2 as foaming agent (center), “as received” TiH2 as foaming agent and Ti/TiB2 modification (right). Left and center image represent scans of cut samples, while the right image is derived from computer tomography (CT) data.

Figure 10.
Foam microstructure, diagrams: (a) grain size as function of additive level and (b, c) geometrical characteristics of the eutectic phase as a function of cooling rate.
Figure 10.
Foam microstructure, diagrams: (a) grain size as function of additive level and (b, c) geometrical characteristics of the eutectic phase as a function of cooling rate.

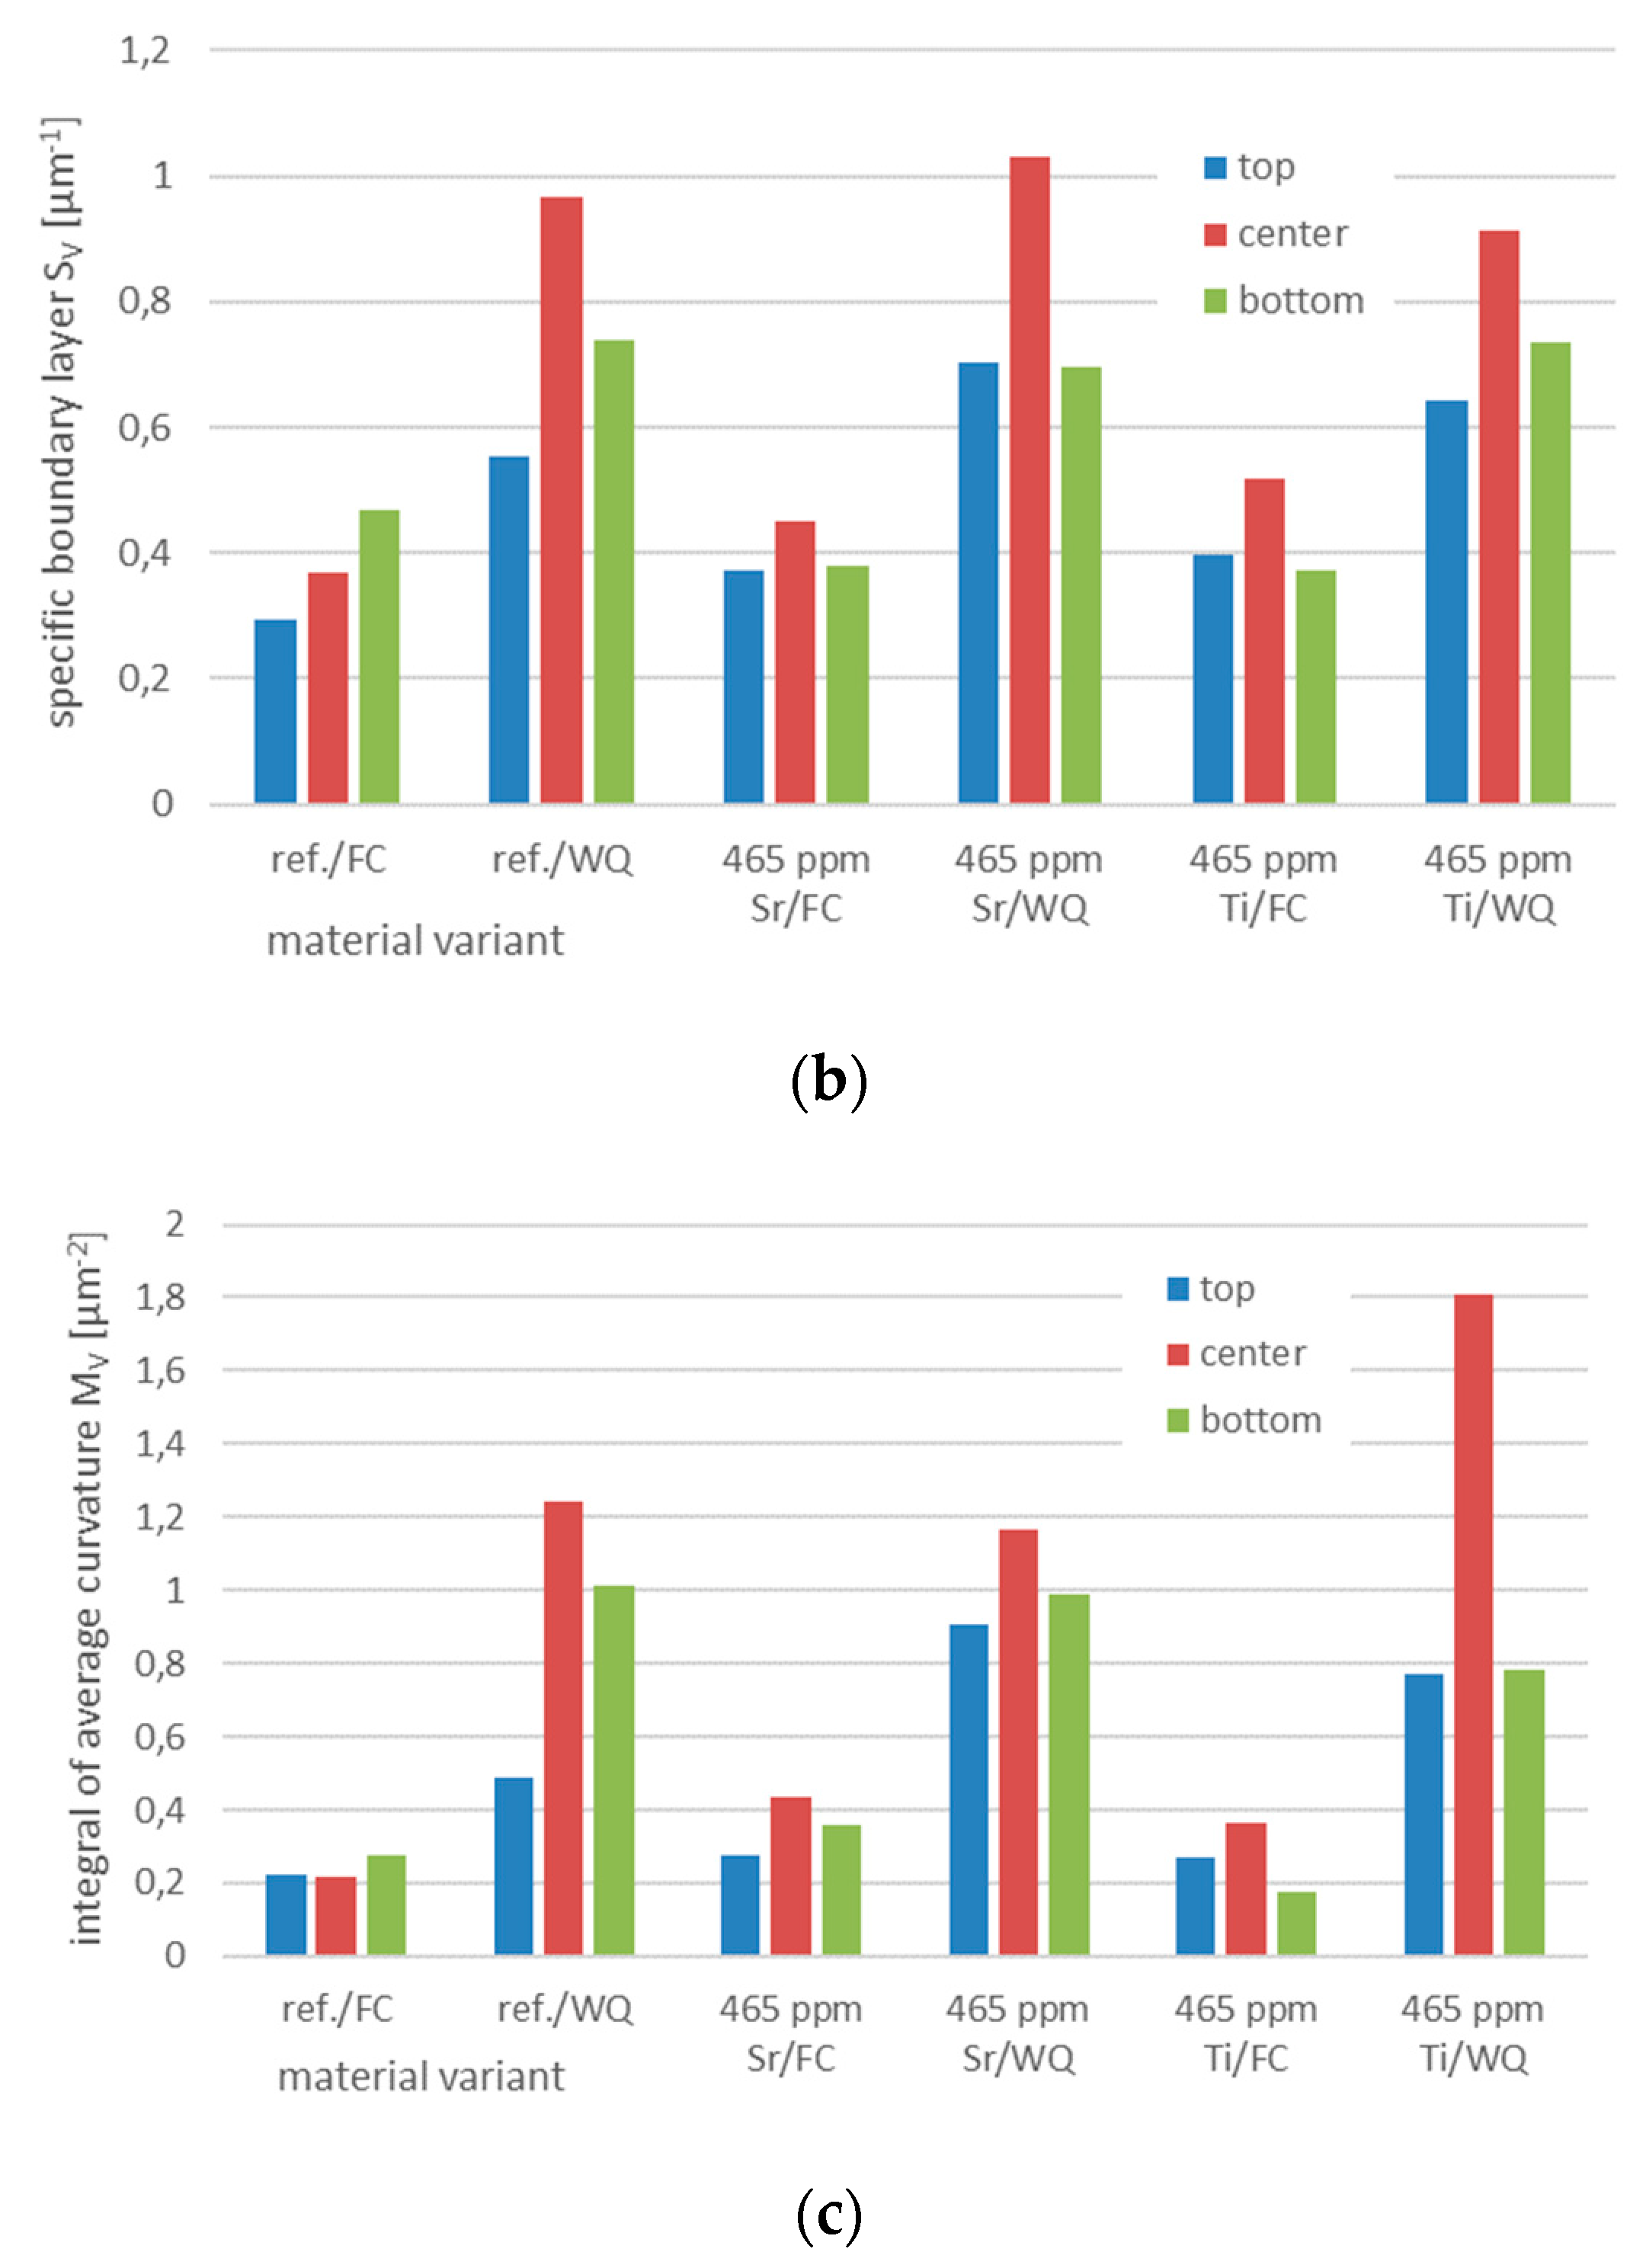
Figure 11.
Foam microstructure, (a–c) Barker etching emphasizing grain sizes, (d–f) expression of the eutectic phase. (a,d) Reference material AlSi7 with conventional, as received foaming agent, (b,e) with 465 ppm Sr and (c,f) with 465 ppm Ti as TiB2 added.
Figure 11.
Foam microstructure, (a–c) Barker etching emphasizing grain sizes, (d–f) expression of the eutectic phase. (a,d) Reference material AlSi7 with conventional, as received foaming agent, (b,e) with 465 ppm Sr and (c,f) with 465 ppm Ti as TiB2 added.
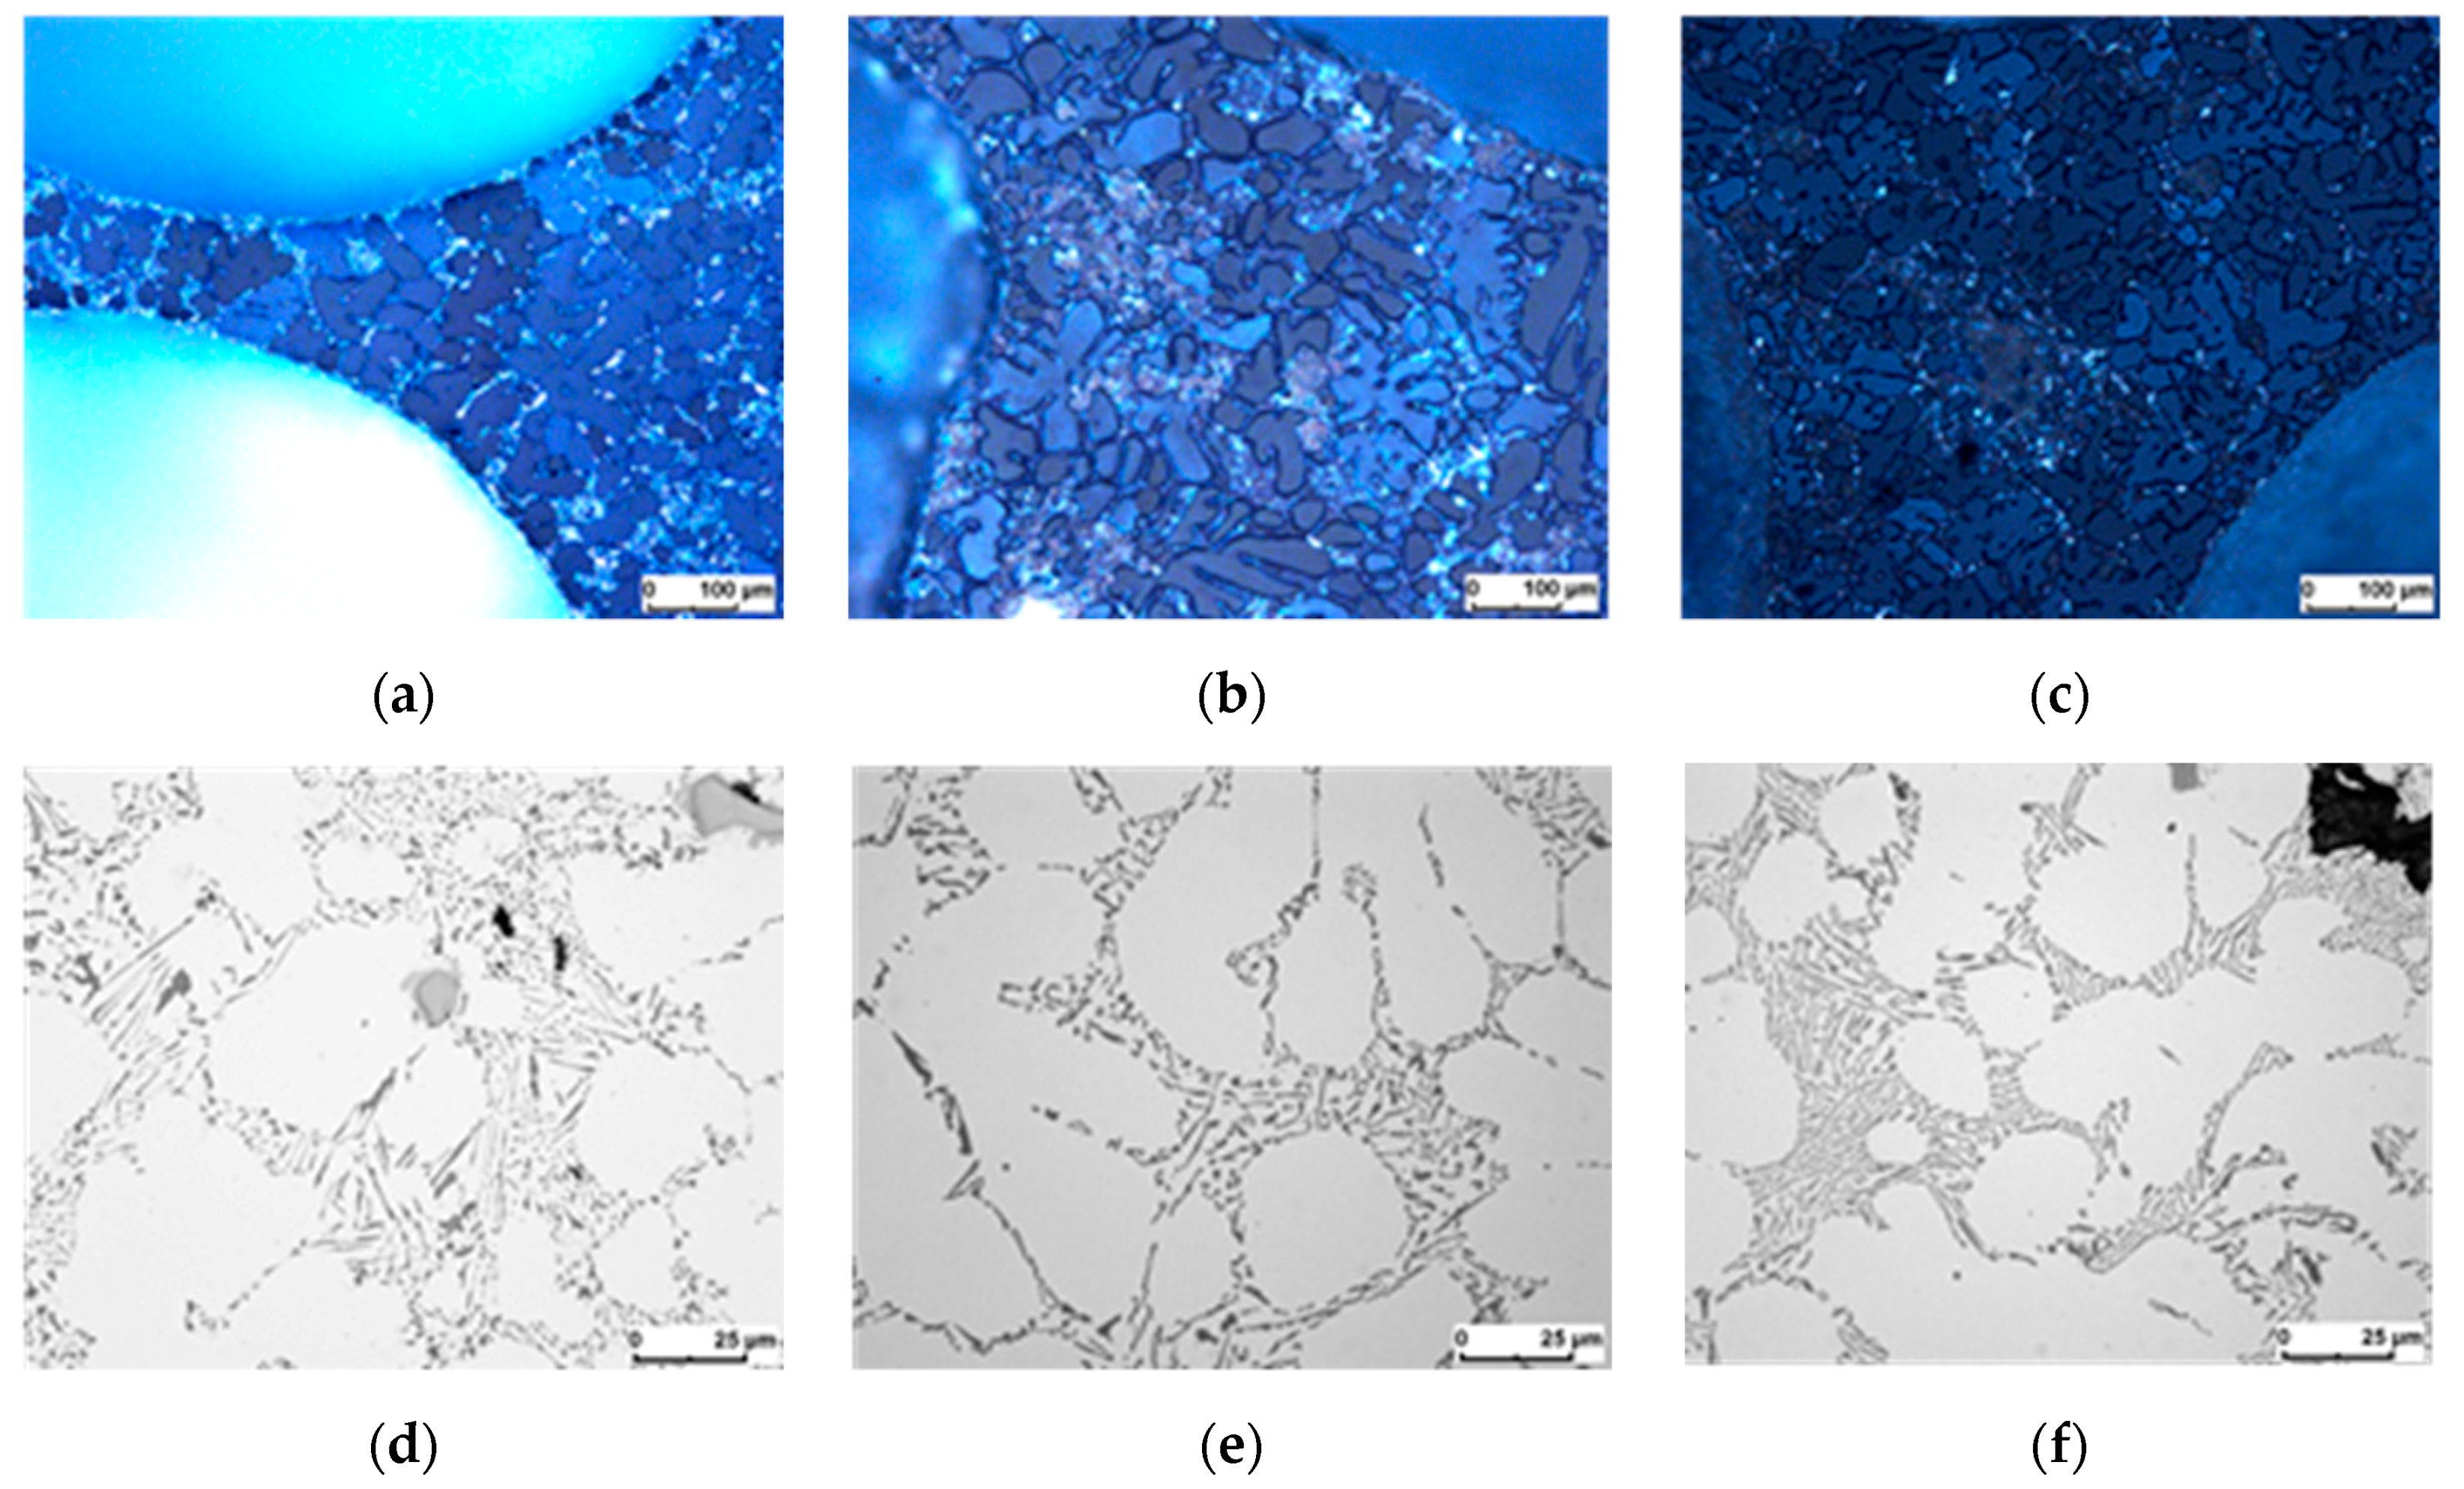
Figure 12.
Compression test results—comparison between stress-strain curves associated with different density levels: 0.3 g/cm3 (a), 0.4 g/cm3 (b), 0.53-55 g/cm3 (c), 0.58-0.61 g/cm3 (d). Note the difference in the scaling of the x- (i.e., stress-) axis in Figure 12 (a,b) compared to (c,d).
Figure 12.
Compression test results—comparison between stress-strain curves associated with different density levels: 0.3 g/cm3 (a), 0.4 g/cm3 (b), 0.53-55 g/cm3 (c), 0.58-0.61 g/cm3 (d). Note the difference in the scaling of the x- (i.e., stress-) axis in Figure 12 (a,b) compared to (c,d).
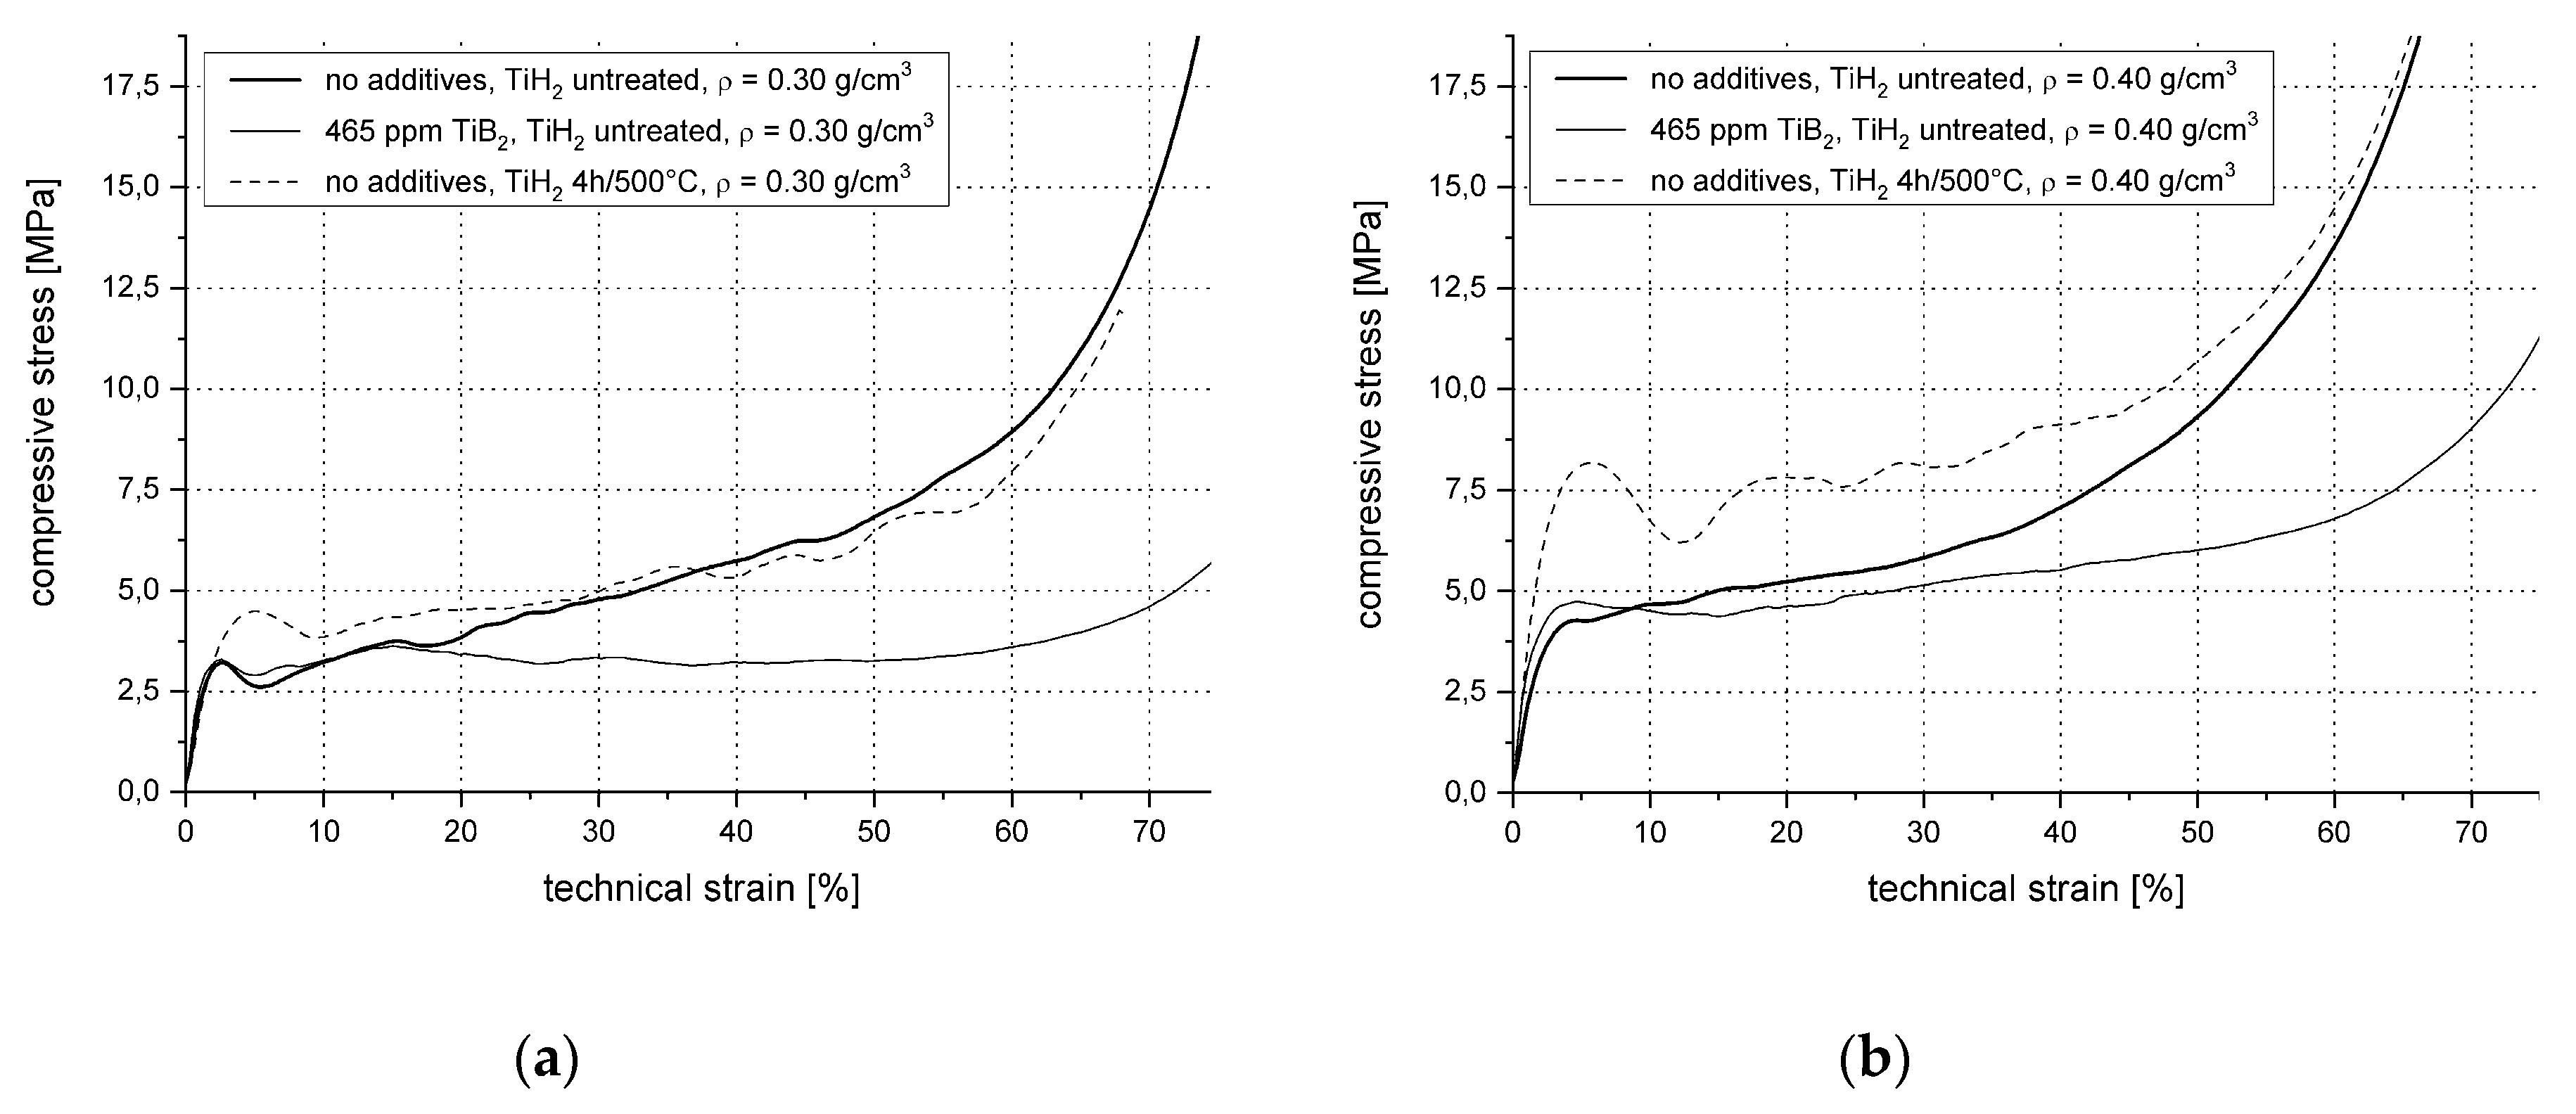

Figure 13.
Compression test results: ultimate compressive strength (a), plateau strength (b) and tangent modulus (c) versus density.
Figure 13.
Compression test results: ultimate compressive strength (a), plateau strength (b) and tangent modulus (c) versus density.


Figure 14.
Distributions of normalized properties for the reference material AlS7 expanded using “as received” TiH2 and the same with added TiB2 grain refiner—(a,b), plateau strength, (c,d) ultimate compressive strength and (e,f) tangent modulus.
Figure 14.
Distributions of normalized properties for the reference material AlS7 expanded using “as received” TiH2 and the same with added TiB2 grain refiner—(a,b), plateau strength, (c,d) ultimate compressive strength and (e,f) tangent modulus.


Figure 15.
Compression test results—Weibull evaluation of plateau strength for AlSi7 with (a) and without TiB2 grain refiner (b), as-received TiH2 as foaming agent.
Figure 15.
Compression test results—Weibull evaluation of plateau strength for AlSi7 with (a) and without TiB2 grain refiner (b), as-received TiH2 as foaming agent.

Figure 16.
Compression test results—Weibull evaluation of ultimate compressive strength for AlSi7 foam with (a) and without TiB2 grain refiner (b), as-received TiH2 as foaming agent.
Figure 16.
Compression test results—Weibull evaluation of ultimate compressive strength for AlSi7 foam with (a) and without TiB2 grain refiner (b), as-received TiH2 as foaming agent.

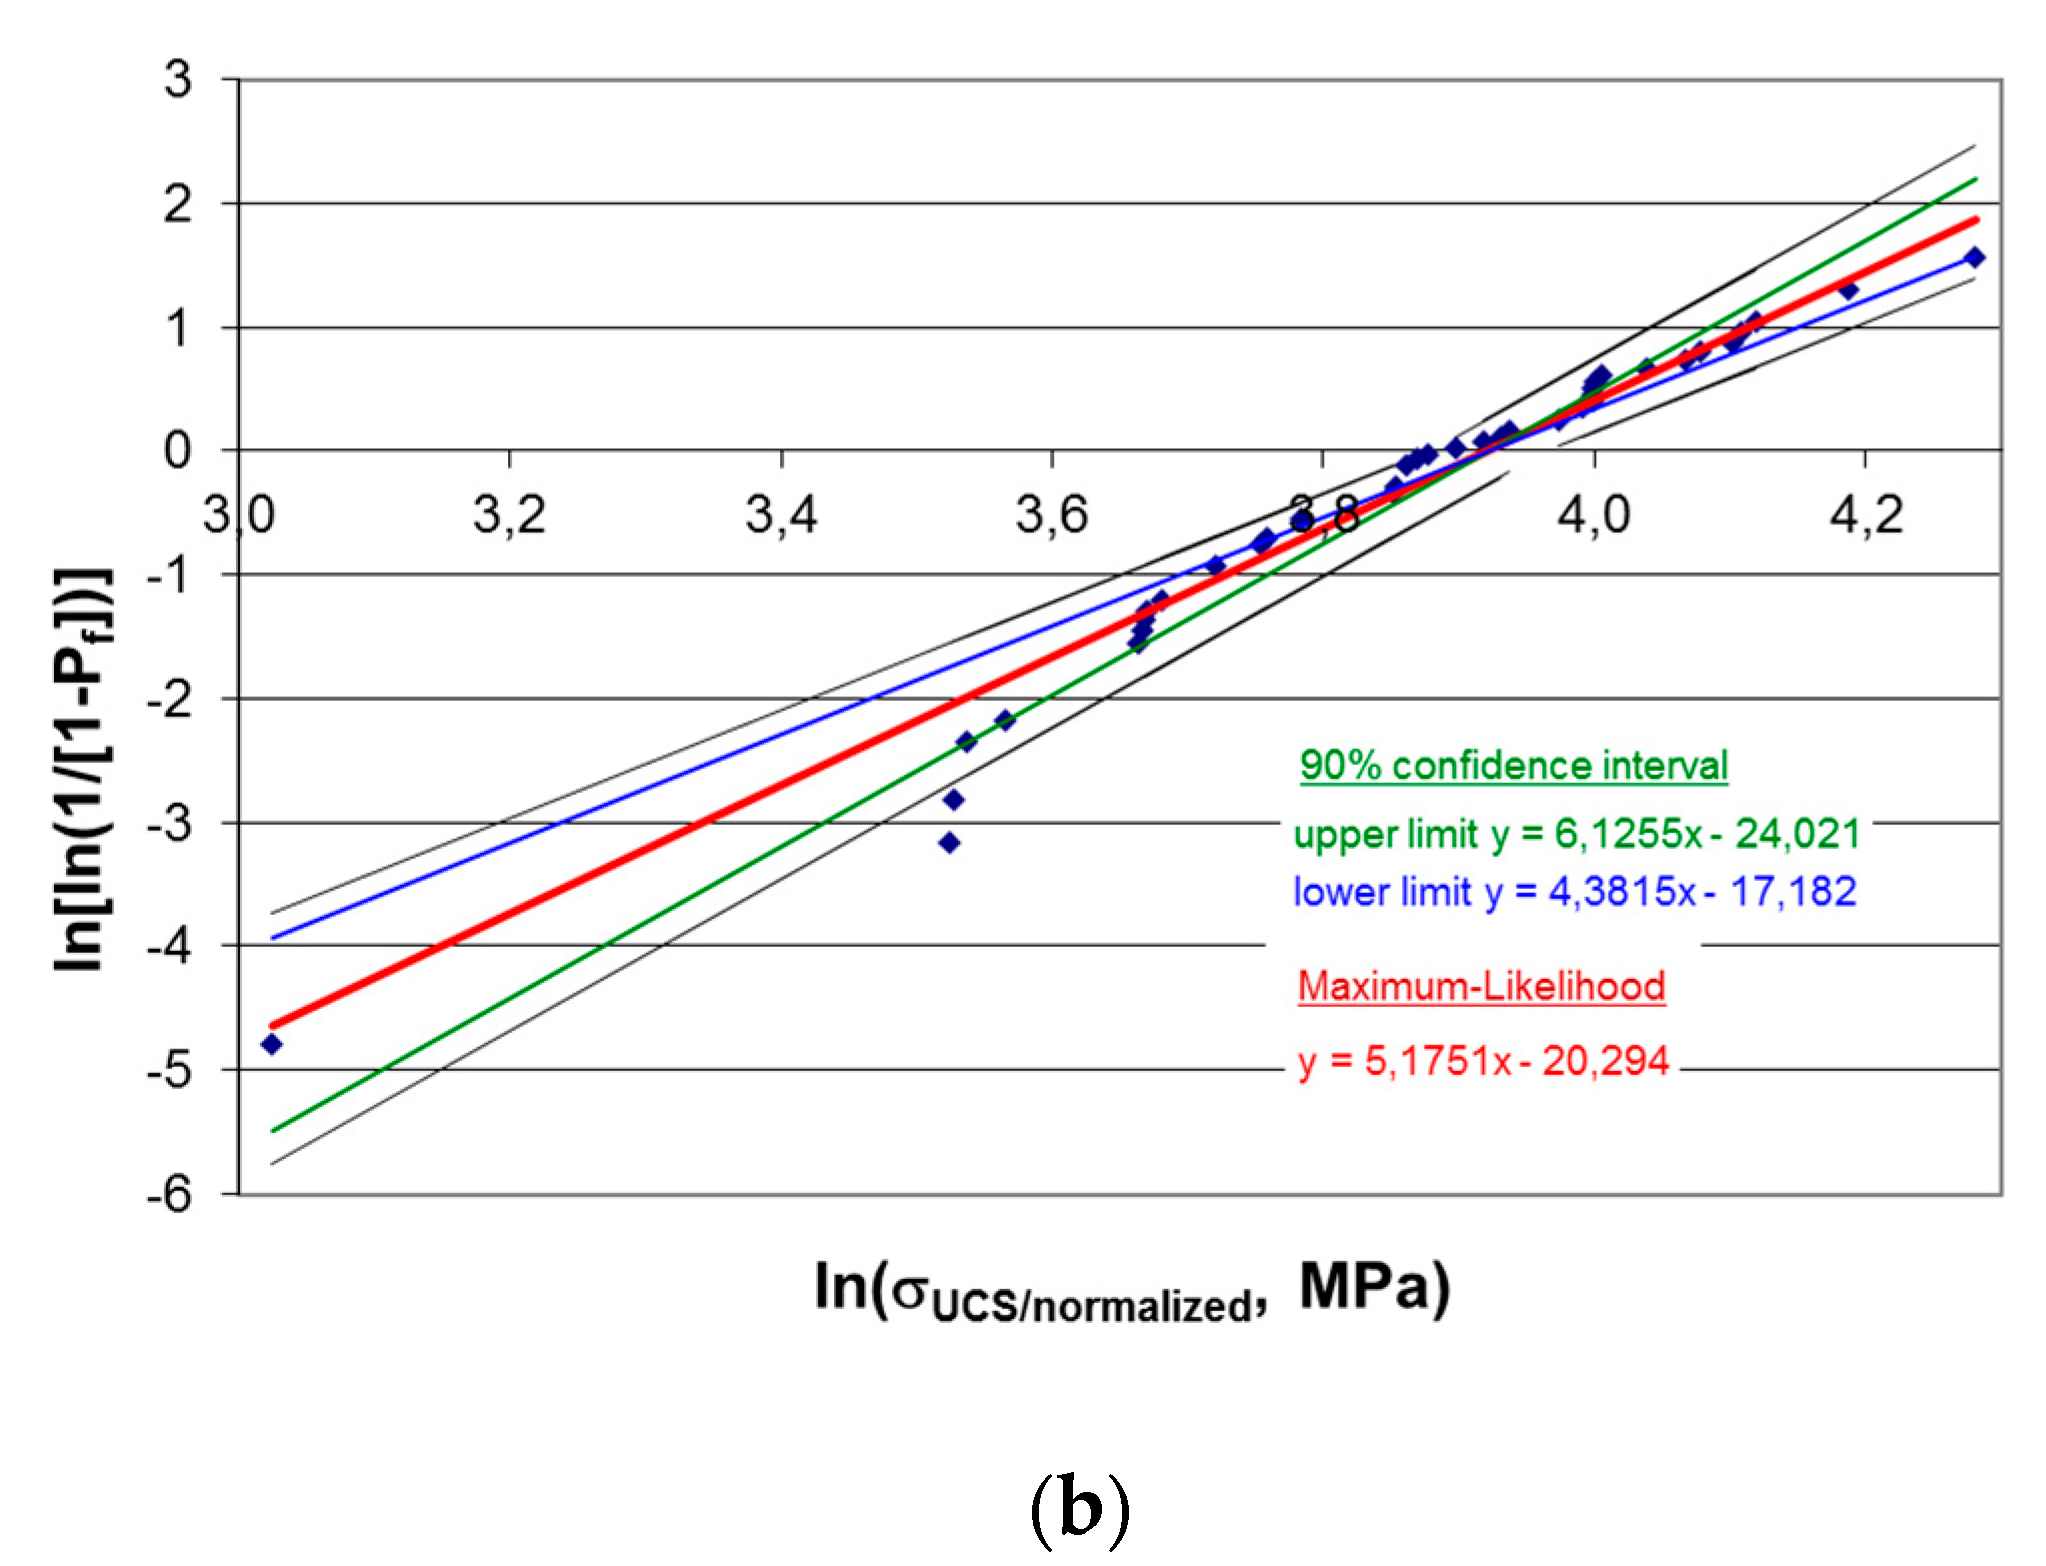
Figure 17.
Compression test results—Weibull evaluation of tangent modulus for AlSi7 foam with (a) and without TiB2 grain refiner (b), as-received TiH2 as foaming agent.
Figure 17.
Compression test results—Weibull evaluation of tangent modulus for AlSi7 foam with (a) and without TiB2 grain refiner (b), as-received TiH2 as foaming agent.
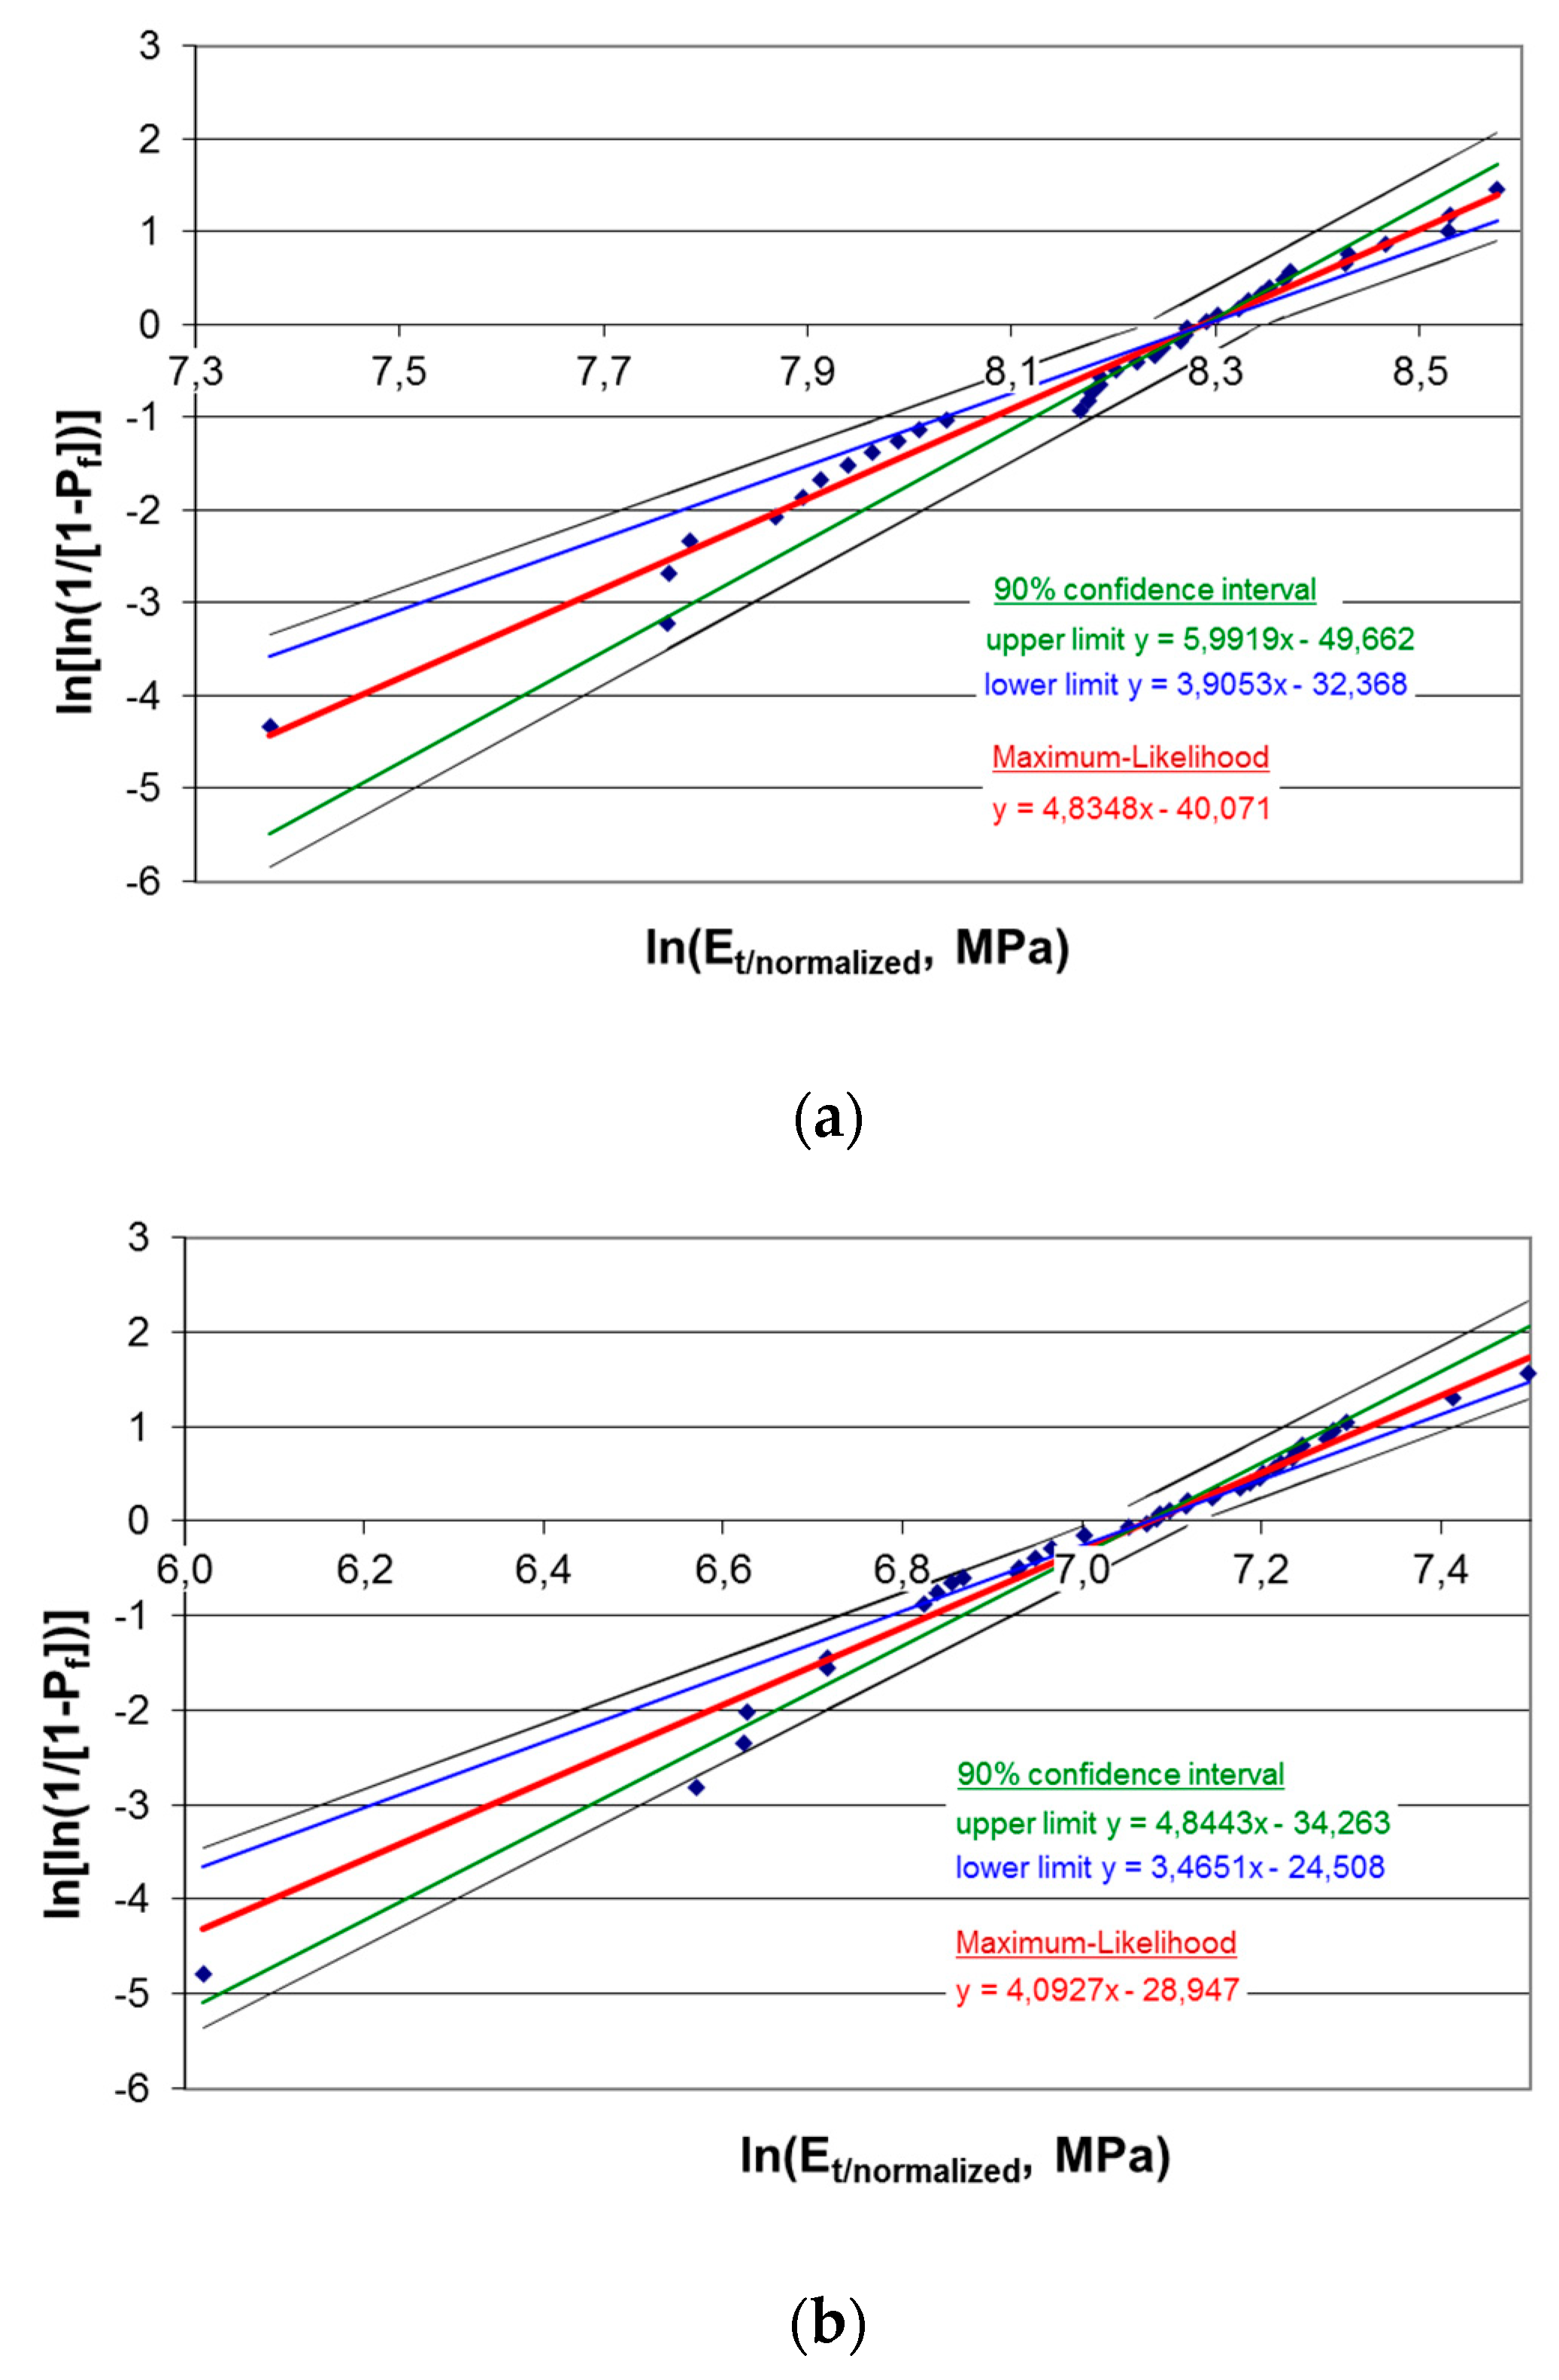

Table 1.
Composition, production method and supplier of powder variants.
| Powder | Supplier Information | Measurement | ||||||
|---|---|---|---|---|---|---|---|---|
| Name | Production Method | Purity [wt.%] | Particle Size [µm] | Modifying Agent (MA) | MA Content [wt.%] | Particle Size, Dmean [µm] | Particle Size, D50 [µm] | |
| Al-1 | Ecka 1 grade AS71 | air atomized | 99.7 | <160 | - | - | 77.38 | 70.08 |
| Al-2 | Alpoco | inert gas atomized | 99.7 | <150 | - | - | 39.40 | 25.41 |
| Al/Sr | Alpoco | inert gas atomized | n. a. 2 | <150 | Sr | 0.05 | 39.61 | 28.00 |
| Al/B | Alpoco | inert gas atomized | n. a. 2 | <150 | B | 0.007 | 57.30 | 41.63 |
| Al/TiB2 | Alpoco | inert gas atomized | n. a. 2 | <150 | Ti/TiB2 | 0.05 Ti, as 5/1 TiBAl | 42.11 | 29.71 |
| Si | Ölschläger | milled | 98.5 | 60–100 | n.a. | n.a. | 25.71 | 20.25 |
| TiH2 | Chemetall grade N | milled | 99 | < 63 | n.a. | n.a. | 18.14 | 16.04 |
1 Ecka Granules. 2 Not applicable.
Table 2.
Overview of powder compact sample series for evaluation of grain refinement and modification of the Al-Si eutectic.
Table 2.
Overview of powder compact sample series for evaluation of grain refinement and modification of the Al-Si eutectic.
| Sample Series | 1 | 2 | |||||
|---|---|---|---|---|---|---|---|
| Holding temperature | [°C] | 660 | 680 | ||||
| Holding time | [min.] | 5 | 10 | ||||
| Cooling method | water quenching (WQ) | forced convection (FC) | natural convection (NC) | water quenching (WQ) | forced convection (FC) | natural convection (NC) | |
| Reference AlSi7 | n.a. | ||||||
| B grain refined | [wt%] | 0.007 | - | - | - | - | - |
| 0.014 | 0.014 | 0.014 | 0.014 | 0.014 | 0.014 | ||
| 0.028 | - | - | - | - | - | ||
| TiB2 grain refined 1 | [wt%] | 0.026 | - | - | - | - | - |
| 0.035 | 0.035 | 0.035 | 0.035 | 0.035 | 0.035 | ||
| 0.0465 | - | - | - | - | - | ||
| Sr modified | [wt%] | 0.013 | - | - | - | - | - |
| 0.025 | 0.025 | 0.025 | 0.025 | 0.025 | 0.025 | ||
| 0.0465 | |||||||
1 Ti as Al-5Ti-1B.
Table 3.
Overview of foam sample series for mechanical testing. As also implied by the series’ designations, forced convection cooling was employed in all cases.
Table 3.
Overview of foam sample series for mechanical testing. As also implied by the series’ designations, forced convection cooling was employed in all cases.
| Sample Series | ||||
|---|---|---|---|---|
| Al-FC | Al/TiB2-FC | Al-TiH2-ht-FC | ||
| Number of compression test samples | [-] | 60 | 38 | 20 |
| Compaction method | hot … | extrusion | axial pressing | axial pressing |
| Al powder | Al-1 | Al-2; Al/TiB2 | Al-1 | |
| Foaming agent | TiH2 as received | TiH2 as received | TiH2, treated 4h@500 °C, air | |
| Ti level (as 5/1 TiBAl) | [ppm] | - | 465 | - |
| min./max. density of compression test samples | [g/cm3] | 0.18/0.78 | 0.17/0.61 | 0.19/0.92 |
| cooling method | forced conv. 1 | forced conv. | forced conv. | |
1 Forced convection using compressed air.
Table 4.
Local cooling rates determined for foam samples containing no as well as Sr and Ti as TiB2 additives (465 ppm each) determined via evaluation of SDAS.
Table 4.
Local cooling rates determined for foam samples containing no as well as Sr and Ti as TiB2 additives (465 ppm each) determined via evaluation of SDAS.
| Sample Series | Cooling | Cooling Rate Ks−1 at Position Within Foam Sample | ||
|---|---|---|---|---|
| Top | Center | Bottom | ||
| Reference AlSi7 | forced convection | 17.79 | 11.83 | 7.10 |
| water quenching | 47.51 | 82.94 | 69.13 | |
| AlSi7 with 465 ppm Sr | forced convection | 11.21 | 14.40 | 25.05 |
| water quenching | 28.17 | 67.85 | 55.36 | |
| AlSi7 with 465 ppm Ti as TiB2 | forced convection | 19.86 | 15.79 | 9.77 |
| water quenching | 63.03 | 92.04 | 79.50 | |
Table 5.
Compression test results, comparison of fit curve parameters for density dependence of plateau and ultimate strength as well as tangent modulus for different sample series (standard series with TiH2 as received and thermally treated, TiB2 grain refined with TiH2 as received—all series produced using forced convection cooling with air).
| Property | Sample Series | ρMatrix−n · Cpl/UCS/Et | n | R2 |
|---|---|---|---|---|
| Plateau Strength (Cpl) 1 | AlSi7/Ref-FC | 11.415 | 1.155 | 0.7179 |
| AlSi7-TiB2-FC | 8.2648 | 0.8882 | 0.6934 | |
| AlSi7-TiH2/ht-FC | 30.45 | 1.977 | 0.9827 | |
| Ultimate Compressive Strength (CUCS) 1 | AlSi7/Ref-FC | 14.672 | 1.197 | 0.7254 |
| AlSi7-TiB2-FC | 12.373 | 1.232 | 0.8389 | |
| AlSi7-TiH2/ht-FC | 29.609 | 1.562 | 0.9882 | |
| Tangent Modulus (CEt) 1 | AlSi7/Ref-FC | 514.73 | 0.7620 | 0.4870 |
| AlSi7-TiB2-FC | 1035.8 | 1.283 | 0.6995 | |
| AlSi7-TiH2/ht-FC | 1198.7 | 1.471 | 0.9621 |
1 Indicates the associated constant quantified in column 3.
Table 6.
Compression test results, comparison of Weibull distribution parameters for AlSi7 foam with and without TiB2 grain refiner with as received TiH2 as foaming agent.
Table 6.
Compression test results, comparison of Weibull distribution parameters for AlSi7 foam with and without TiB2 grain refiner with as received TiH2 as foaming agent.
| Property | Weibull Parameter | Reference AlSi7 | Refined AlSi7-TiB2 |
|---|---|---|---|
| Plateau Strength | scale parameter σ0, plateau/normalized | 37.8 | 21.0 |
| shape parameter/ modulus mplateau | 4.06 | 6.19 | |
| Ult. Comp. Strength | σ0, UCS/normalized | 50.5 | 44.0 |
| mUCS | 5.18 | 6.36 | |
| Tangent Modulus | E0, t/normalized | 1179.4 | 3976.2 |
| mEt | 4.09 | 4.83 |
© 2019 by the authors. Licensee MDPI, Basel, Switzerland. This article is an open access article distributed under the terms and conditions of the Creative Commons Attribution (CC BY) license (http://creativecommons.org/licenses/by/4.0/).
Share and Cite
MDPI and ACS Style
Lehmhus, D.; Hünert, D.; Mosler, U.; Martin, U.; Weise, J. Effects of Eutectic Modification and Grain Refinement on Microstructure and Properties of PM AlSi7 Metallic Foams. Metals 2019, 9, 1241. https://doi.org/10.3390/met9121241
AMA Style
Lehmhus D, Hünert D, Mosler U, Martin U, Weise J. Effects of Eutectic Modification and Grain Refinement on Microstructure and Properties of PM AlSi7 Metallic Foams. Metals. 2019; 9(12):1241. https://doi.org/10.3390/met9121241
Chicago/Turabian StyleLehmhus, Dirk, Daniela Hünert, Ulrike Mosler, Ulrich Martin, and Jörg Weise. 2019. "Effects of Eutectic Modification and Grain Refinement on Microstructure and Properties of PM AlSi7 Metallic Foams" Metals 9, no. 12: 1241. https://doi.org/10.3390/met9121241
Note that from the first issue of 2016, this journal uses article numbers instead of page numbers. See further details here.