Electron Microscopy Investigations of А356 Alloy Modified with Nanoparticles
by
 ,
,
Rositza Dimitrova
1,*, 
Roumen Petrov
2,3,
Pavel Kuzmanov
1,
Аngel Velikov
1 and
Valentin Manolov
1 1
Institute of Metal Science, Equipment and Technologies with Hydro and Aerodynamics Centre “Acad. A. Balevski”, Bulgarian Academy of Sciences, 67 Shipchenski prohod blvd., Sofia 1574, Bulgaria
2
Department of Electromechanical Systems and Metal Engineering, Research group Materials Science and Technology, Ghent University, Tech Lane Science Park Campus A, 46, 9062 Gent, Belgium
3
Department of Materials science and Engineering, Delft University of Technology, Mekelweg 2, 2628 CD Delft, The Netherlands
*
Author to whom correspondence should be addressed.
Metals 2019, 9(12), 1294; https://doi.org/10.3390/met9121294
Submission received: 31 October 2019
/
Revised: 24 November 2019
/
Accepted: 28 November 2019
/
Published: 1 December 2019
(This article belongs to the Special Issue Microstructure, Texture and Properties Control in Alloys)
Abstract
:Two types of A356 alloy castings in initial and modified with nanoparticles condition produced by gravitational casting were studied. Samples, as-cut from the castings, were subjected to light optical microscopy (LM), thermal analyses, Electron Backscattered Diffraction (EBSD) and Scanning Transmission Electron Microscopy (STEM) analyses. Results, obtained by EBSD, confirmed that there is grain refinement in samples from castings with added nanoparticles compared to the initial ones. STEM analysis shows agglomerates of nanoparticles in examined foils. Nanoparticles’ position in the microstructure confirms the hypothesis that they act as nucleating sites during the alloy solidification, which is the reason for observed fine-grained microstructure.
1. Introduction
Aluminum cast alloy, А356 (AlSi7Mg), is widely used for production of complex shaped parts for shipbuilding, electrical, automotive and aerospace application [1,2]. The as cast parts mechanical properties are directly linked to their microstructure [3,4] and hence, they can be effectively controlled via the as cast microstructure during the solidification stage or later via appropriate thermal treatment. Effective ways to control the microstructure during solidification are via changes of alloy chemical composition, via selection of appropriate cooling rates, and via addition of modifying compounds. All of the above methods act on the refinement of aluminum grains, or they modify the eutectic structure, changing it from coarse needled second phase particles to rounded worm-like refined particles. This effect can be obtained by one of the following ways: (1) addition of alloying elements in the liquid alloy and processing (refinement and/or modification); (2) stirring during crystallization; and (3) heat treatment. First process has been widely used and well reported in [5,6,7,8,9,10,11,12,13,14,15,16,17,18,19,20,21,22,23,24,25,26,27,28]. Alternatively, many researchers worked on improving the wear properties of the cast Al alloys via addition of micro particles, which form after solidification so-called micro composite structure [29,30,31]. In the last 2 decades the idea of using small quantities of nanoparticles (up to 0.1 wt.%) for modification and refining of metallic alloys is being explored by many researchers [32,33,34,35,36,37,38,39,40,41,42]. Some special properties of refractory nanoparticles, like high area/volume ratio in the particles size range from 1 to 100 nm as well as very high melting temperature, are considered as promising for their behavior when introduced in a molten metal. However, different type of nanoparticles (chemical composition, size, and fraction) will have different influence on the microstructure and the properties of cast alloy.
The goal of this work is to study the influence of addition of two different types of nanosized particles (NP)—namely SiC and TiCN, on the microstructure formation of A356 aluminum alloy during solidification. The studies, presented in this paper, were conducted in an attempt to better understand the strengthening mechanism of the studied alloys imposed by the nanoparticles.
2. Materials and Methods
Two different types of aluminum castings were investigated; the composition of aluminum alloy (A356) is given in Table 1.
In the casting practice, and in particular when the castings are modified with nanosized particles, different crystallization rates are possible in one casting. For this reason, we study the effect of nanoparticles on the structure of a complex casting (Figure 1, samples S1 and S2), which crystallizes at a relatively high rate (cast in metallic form). The other case (Figure 2, samples S3 and S4), considered by us, is the crystallization of a conical casting cooled by free air convection with a relatively low crystallization rate, which is typical for castings in sand molds. In addition, we had the ability to precisely measure the temperature during the crystallization process, especially in the selected section from which the samples for the microstructural analysis were taken.
The castings were obtained via gravitational casting with strict temperature control. The casting methodology for the casting shown on Figure 1 contains 9 steps. It is described also in [43,44,45,46,47] and can be summarized as follows:
(1) Preparation of nanoparticles (NP) for introducing into melt: weighing of NP and wrapping in aluminum foil, capsulation in aluminum thin-walled cartridge and closing the cartridge, and attaching the cartridge to a specially designed stirrer for homogenization of the melt after the NP introduction.
(2) Melting of the alloy in an electric resistance furnace with a capacity of 2.5 kg.
(3) Constant temperature measurement with a submersible thermocouple protected by a ceramic shield.
(4) Cleaning the melt mirror after reaching a temperature of 750 °C.
(5) Argon degassing for 5 min.
(6) Introducing the NP into the melt at 740 °C by immersing the stirrer with the cartridge and stirring for 3 min at speed 100 rpm.
(7) After the complete homogenization of the melt, the stirrer is removed from the melt and the furnace is closed with a lid until a casting temperature of 730 °C is reached.
(8) Removing the crucible from the furnace and pouring the melt from the crucible into the metal mold.
(9) After complete cooling, the casting is removed from the mold and cut according to the scheme (Figure 1).
Samples S1 and S2 were cut from the cross section of the casting, shown in Figure 1, and shown with the arrow. The sample surface sizes are approximately 15 × 15 mm2. Sample indicated as S1 was cut from a non-modified casting, and sample S2—from exactly the same zone of the casting modified with 0.1 wt.% SiC. By using this procedure, we can be sure that both samples S1 and S2 were at the same cooling conditions during the solidification process and hence all microstructural changes can be attributed to the modification procedure. The average nanoparticle size of SiC is 50 ± 5 nm (calculated from Singular Spectrum Analysis (SSA)—taken from nanopowder certificate). Nanoparticles were activated via currentless cladding with Cu [48], and SiC:Cu ratio was 1:0.1.
To characterize the change in temperature during solidification process and the corresponding macro- and microstructure changes with and without addition of nanoparticles, a methodology was developed in which small samples are taken directly from the furnace crucible. A thin-walled conical shaped casting molds which were made of stainless steel with a height of 33 mm, and diameters 18 mm on the bottom and 22.5 mm on the top were constructed and used in this experiment (Figure 2). The casting methodology for samples S3 and S4 is described below, as follows:
(1) Pre-treatment of stainless steel mold (Figure 2), including coating the inner surface with a non-sticking coating, installation on the central vertical axis of the mold a 1 mm diameter, K-type thermocouple (SS316), protected by a thin-walled steel tube, mounting to the stand and heating the mold up to 200 °C.
(2) After performing steps 1 to 7 from the procedure mentioned above, the mold is immersed in the furnace crucible and filled up.
(3) Removing the filled mold and fixing the stand upright.
(4) Continuous recording the temperature with fast acting temperature recorder type USB FLASH ARCHIVER MS DL-F2 (Microsyst, Plovdiv, Bulgaria) at discrete time points of 0.2 s with an accuracy of 0.1% from the time of filling until the temperature of the sample drops below 450 °C.
(5) Recorded data is used for thermal analysis (example shown in Figure 7).
(6) After final cooling, the samples are removed from the mold and cut to prepare samples for metallographic analysis (Figure 2).
Sample S3 was cut from non-modified casting, and sample S4, from the casting modified with 0.04 wt.% TiCN, and the chosen section (shown with the white arrow in Figure 2), from which the samples were cut, is the region where the thermocouple is placed. In both crucibles exactly the same amount of alloy (63 g) was cast to avoid as much as possible the mass effects on the time-temperature record.
The as-cut samples were prepared as metallographic samples for optical metallography analyses using routine procedure—ground with SiC paper up to #1200, mechanically polished with diamond paste and revealed with 0.5% HF water solution. Observations were done using Polyvar Met optical microscope (Reichert-Jung, Wien, Austria), with magnifications up to ×1000.
Microhardness was measured with microhardness tester Micro-Duromat 4000 (Reichert-Jung, Wien, Austria), with load of 10 gf, the maximum load of 10 gf was reached for 10 s and holding time was 10 s.
Samples were prepared for EBSD analyses via routine procedure, and the final step was 30 min mechanical polishing with 35 nm colloidal silica (OPS). They were analyzed by means of an EBSD system attached to a Quanta450 FEG-SEM *(Thermo Fisher Scientific, Electron Microscopy Solutions, 5350 NE Dawson Creek Drive Hillsboro, OR, USA) operating at 20 kV. The final aperture was 30 µm, which ensures a probe current of 2.4 nA. The sample was tilted 70° towards the EBSD detector, the working distance was 16 mm, and the analyzed area of 2 × 2 mm² was scanned in a hexagonal scan grit with a step size of 1 µm. All orientation data were acquired with OIM-Data Collection version 6 software (AMETEK Materials Analysis Division, Mahwah, NJ, USA) and postprocessed and analyzed with OIM-Data Collection version 6 software (AMETEK Materials Analysis Division, Mahwah, NJ, USA). The original data were postprocessed by clean up procedure including only grain confidence index standardization (CI > 0.1; min misorientation of 5° and minimum 7 pixels per grain). All points with a confidence index lower than 0.1 were removed later from the measurement as dubious.
For investigations of the finest particles, thin slice from the bottom of S2 was cut; it was mechanically thinned down to 100 µm, and three specimens, foils with diameter of 3 mm, were punched from it. Next, foils were electrochemically polished and revealed with A2 electrolyte using Tenupol-5 (Struers, GmbH Nederland, Zomerdijk 34 A, 3143 CT Maassluis, The Netherlands). The foils were analyzed in a transmission electron microscope (TEM) Jeol JEM2200-FS (JEOL (Europe) BV Lireweg 4, 2153 PH Nieuw-Vennep, The Netherlands) at 200 kV accelerating voltage in scanning transmission (STEM) mode, and energy dispersive X-ray (EDX, AMETEK BV, Ringbaan Noord 103, 5046 AA Tilburg, The Netherlands) analysis was used to determine the composition of the individual particles of interest.
3. Results
3.1. Samples S1 and S2 (Modification with SiC Nanoparticles)
In Table 2 are given the calculated average secondary dendrite arm spaces (SDAS) and the corresponding microhardness HV0.01 (averaged from 5 individual measurements) for S1 and S2.
Results from the EBSD microstructure characterization are shown in Figure 4.
Each grain is colored with different color and for a grain is considered any group of minimum 7 neighboring points (pixels) with a misorientation between them lower than 5°. The white spots in the measurements correspond to the points that do not fulfil the above-mentioned requirements or have a CI < 0.1. (The confidence index CI is a measure for the reliability of the indexation procedure and values of CI > 0.1 correspond to reliability of more than 95%).
Based on the EBSD data the grain sizes (equivalent calculated grain diameters) for both samples are calculated and shown on Figure 5.
Grain diameters vary from 28.53 µm to 967.47 µm for S1 and from 14.58 µm to 316.15 µm for S2. Тhe largest area fractions (each 0.2) in S1 is taken of grain diameters 967.47 µm and 572.13 µm, while in S2 the largest area fractions are taken by grain diameters 173.302 µm, which cover an area fraction of 0.11, and 141.557 µm, 125.685 µm and 109.812 µm cover an area fraction of 0.08 for each group.
3.2. Samples S3 and S4 (Modification with TiCN Nanoparticles)
Light optical microscope images of samples S3 (non-modified) and S4 (modified with TiCN) are shown in Figure 6.
On Table 3 are given calculated average SDAS for both S3 and S4 samples together with the measured microhardness HV0.01 (averaged from 5 individual measurements).
A comparison of the time-temperature cooling curves and specifically the position of the liquidus temperature in both alloys is given in Figure 7.
Average calculated grain diameters vary from 59.6 µm to 1192.1 µm for the non-modified alloy (sample S3) and from 16.7 µm to 595.4 µm for the sample modified with TiCN alloy (sample S4). The arbitrary taken EBSD maps show also that the largest area fraction in the EBSD map in sample S3 (0.454) is covered by a grain with diameter of 1192.1 µm while in the sample S4, the largest area fraction (0.26) is covered by a grain with twice small diameter of 504 µm.
3.3. STEM Analysis of Sample S2 (Modification with SiC Nanoparticles)
Transmission electron microscopy analysis was carried out on thin foils produced by electrolytic double jet thinning of sample S2. The bright field scanning transmission microscopy image (STEM) is shown in Figure 10, whereas the results from the EDX point analyses are shown in Table 4, as well as base alloy content for the same chemical elements for an easy comparison is added (in at.%).
The numbers in the first column from left correspond to the point in STEM image. It should be mentioned that the results from the C and O content are semi-quantitative, i.e., they only show that these elements are present, but they cannot be considered as a measure of the quantity of the elements.
4. Discussion
4.1. Samples S1 and S2—LM and EBSD Characterization
Light optical microscopy analysis (Figure 3a,b) shows the changes in the microstructure of the two samples—the unmodified (Figure 3a) and the modified (Figure 3b). As they are cut from the same zone (Figure 1) and the initial conditions—melt and mold temperatures—are practically the same (729 °C for the melt, 166 °C for the mold, S1; and 730 °C for the melt, 156 °C for the mold, S2), it means that the cooling conditions that control the solidification process are identical. Hence, the observed differences between the microstructures of the two samples can be attributed only to the addition of SiC nanoparticles in the sample S2. As a consequence, the SDAS of S2 decreased with 62% in comparison to the sample S1, and correspondingly, the microhardness of the sample S2 was increased with 13% (see Table 2).
Based on the EBSD data for the equivalent calculated grain diameters and area fraction for both samples (Figure 5) and the data analyses, it can be seen that the minimum diameter is reduced twice in S2, and the maximum one is triple reduced in S2 compared to S1.
4.2. Samples S3 and S4—LM, Thermal Analyses and EBSD Characterization
Light optical microscopy analysis (Figure 6a,b) did not show as strong change in microstructure as in couple of samples S1 and S2. Nevertheless, SDAS was decreased with 7.8%, and the microhardness was increased with 3.5% (Table 3).
The analysis of time-temperature records shows that the undercooling value for non-modified sample S3 is 1.76 °C (black line in Figure 7) whereas for TiCN modified sample S4, it is only 0.23 °C (dotted line in Figure 7). It is reasonable to assume that the addition of TiCN nanoparticles into the melt increases the number of crystallization nuclei, and as a consequence, the undercooling of the alloy required to start the solidification process is reduced.
Based on the EBSD data for the equivalent calculated grain diameters and area fraction for both samples (Figure 9) and the data analyses, it can be seen that the minimum grain diameter in sample S4 is reduced 3.5 times, and the maximum one is twice reduced compared to the grains measured in sample S3.
4.3. STEM Analysis of Sample S2
Several specific points corresponding to the microstructure were analyzed. Point #32 (Figure 10) corresponds to the grain interior where no precipitates are found, and the chemical composition is in good agreement with the average composition of the Al alloy (see Table 1). This point is used as a kind of calibration point for the EDS measurement. The increased amount of Cu measured in this point is associated to a signal that may originate from the copper grit on the STEM sample holder. Such effects are common in the EDS/STEM analysis. Having in mind that the SiC nanoparticles were cladded with Cu, it is reasonable to accept for a specific indicator for the nanoparticles the increased Cu content and the appearance of C peaks in relevant sample points. The presence of significantly high concentrations of Cu and C at points with numbers 28–31 indicates the presence of nanoparticles or their conglomerates. Isolated nanoparticles were not found in the microstructure, but conglomerates of nanoparticles were frequently observed. The size of these conglomerates was around 130 nm, whereas some individual nanoparticles with a size between 20 nm and 40 nm can be distinguished inside the conglomerates (see Figure 10). Similar effect of agglomeration was frequently observed and reported [49] because of the attractive Van der Waals forces. It is interesting that at some points an increased concentration of oxygen was measured (28–32). Most probably the reason for the increased oxygen content is in the oxidation of cladding metal Cu, as nanoparticles were not stored in inert environment before use.
All conglomerates of nanoparticles were found in the grain interior but not close to boundaries or in the grain boundaries. Hence, from this observation one can conclude that they appear and act as nucleation sites during crystallization, which was also found by Borodianskiy et al. [42] and explains their effect as grain refiners in modified samples.
5. Conclusions
Two types of casting samples, one non-modified and another modified with nanoparticles, were investigated via LM, SEM-EBSD, STEM-EDX analysis and micro-hardness tests. The results can be summarized as follows:
The addition of 0.1 wt.% Cu-cladded SiC nanoparticles to the studied Al alloy refined significantly the as-cast microstructure. After modification, the maximum grain diameters decreased from 967.47 µm to 316.15 µm, and the SDAS decreased from 46.7 µm to 17.7 µm. As a consequence of the grain refinement, the microhardness of the modified castings increased with 13%.
Similar but not so effective results were obtained in the Al castings with addition of 0.04 wt.% TiCN nanoparticles. After modification with TiCN nanoparticles, the maximum grain diameter of the modified alloy decreased from 1192.1 µm to 595.4 µm and the SDAS from 47.83 µm to 44.12 µm, which resulted in an increase of the microhardness of 3.5%.
Nanoparticle clusters’ existence in grain interior was found by STEM investigations. Thermal analysis records showed that the nanoparticle-modified alloy solidifies at smaller undercooling compared to the non-modified one. The above-mentioned confirms the hypothesis that nanoparticles act as crystallization nuclei, even when the particle clustering appears.
Author Contributions
Conceptualization, V.M.; methodology, R.D., R.P., A.V., V.M.; formal analysis, R.D., R.P., P.K.; investigation, R.D., R.P., P.K., A.V.; resources, R.D., R.P., P.K., A.V.; data curation, R.D., R.P.; writing—original draft preparation, R.D., R.P.; writing—review and editing, R.D., R.P., V.M.; visualization, R.D., R.P., P.K.; supervision, V.M., project administration, V.M.; funding acquisition, V.M., R.P.
Funding
This work is supported by a project under contract Nr. DN 07/20/15.12.2016, funded by the Bulgarian Scientific Research Fund (BNSF).
Conflicts of Interest
The authors declare no conflict of interest. The funders had no role in the design of the study; in the collection, analyses, or interpretation of data; in the writing of the manuscript; or in the decision to publish the results.
References
- Polmear, I.; StJohn, D.; Nie, J.F.; Qian, M. Light Alloys: Metallurgy of the Light Metals; Butterworth&Heinemann: Oxford, UK, 2017. [Google Scholar]
- Gruzleski, G.; Closset, J. The Treatment of Liquid AL-Si Alloys; AFS: Des Plaines, IL, USA, 1990; Volume 97, pp. 107–126. [Google Scholar]
- Krushenko, G.G.; Torshilova, S.I.; Krushenko, S.G. Complex modification of hypoeutectic Al-Si alloys. Cast. Prod. 1984, 2, 32. (In Russian) [Google Scholar]
- Lu, J.; Chen, B.; Liu, X.; Yang, F.; Robinson, I. 3D microstructure reconstruction of casting aluminum alloy based on serial block-face scanning electron microscopy. J. Alloy. Compd. 2019, 778, 721–730. [Google Scholar] [CrossRef]
- Rao, J.; Zhang, J.; Liu, R.; Zheng, J.; Yin, D. Modification of eutectic Si and the microstructure in an Al-7Si alloy with barium addition. Mater. Sci. Eng. A 2018, 728, 72–79. [Google Scholar] [CrossRef]
- Amirkhanlou, S.; Shouxun, J. Casting lightweight stiff aluminum alloys: A review. Crit. Rev. Solid State Mater. Sci. 2019, 1–16. [Google Scholar] [CrossRef]
- Lee, M.S.; Terry, B.S. Effects of processing parameters on aluminide morphology in aluminum grain refining master alloys. Mater. Sci. Technol. 1991, 7, 608–612. [Google Scholar] [CrossRef]
- Rao, A.A.; Murty, B.S.; Chakraborty, M. The role of zirconium and impurities in grain refinement of aluminium with AI-Ti-B. Mater. Sci. Technol. 1997, 13, 769–777. [Google Scholar] [CrossRef]
- Nogita, K.; Dahle, A.K. Eutectic growth mode in strontium, antimony and phosphorous modified Al–Si foundry alloys. Mater. Trans. 2001, 42, 393–396. [Google Scholar] [CrossRef]
- Lu, S.-Z.; Hellawell, A. The mechanism of silicon modification in aluminum–silicon alloys: Impurity induced twinning. Metall. Trans. A 1987, 18, 1721–1733. [Google Scholar] [CrossRef]
- Abdollahi, A.; Gruzleski, J.E. An evaluation of calcium as a eutectic modifier in A357 alloy. Int. J. Cast Met. Res. 1998, 11, 145–155. [Google Scholar] [CrossRef]
- Szajnar, J.; Wróbel, T. Inoculation of aluminum with titanium and boron addition. J. Achiev. Mater. Manuf. Eng. 2007, 23, 51–54. [Google Scholar]
- Kwon, Y.D.; Lee, Z.H. The effect of grain refining and oxide inclusion on the fluidity of Al-4.5Cu-0.6Mn and A356 Alloys. Mater. Sci. Eng. 2003, 360, 372–376. [Google Scholar] [CrossRef]
- Knuutinen, A.; Nogita, K.; McDonald, S.D.; Dahle, A.K. Modification of Al–Si alloys with Ba, Ca, Y and Yb. J. Light Met. 2001, 1, 229–240. [Google Scholar] [CrossRef]
- Sritharan, T.; Li, H. Influence of titanium to boron ratio on the ability to grain refine aluminum-silicon alloys. Mater. Process. Technol. 1997, 63, 585–589. [Google Scholar] [CrossRef]
- Spittle, J.A.; Sadli, S. Effect of alloy variables on grain refinement of binary aluminum alloys with Al–Ti–B. Mater. Sci. Technol. 1995, 11, 533–537. [Google Scholar] [CrossRef]
- Spittle, J.A.; Keeble, J.M.; Meshhedani, A.I. The Grain Refinement of Al-Si Foundry Alloys; TMS Light Metals: Pittsburgh, PA, USA, 1997; pp. 795–800. [Google Scholar]
- Sigworth, G.K.; Guzowaski, M.M. Grain refining of hypo-eutectic Al–Si alloys. AFS Trans. 1985, 93, 907–912. [Google Scholar]
- Jones, G.P.; Pearson, J. Factors affecting the grain-refinement of aluminum using titanium and boron additives. Metall. Trans. B 1976, 7, 223–234. [Google Scholar] [CrossRef]
- Kori, S.A.; Murty, B.S.; Chakraborty, M. Development of an efficient grain refiner for Al–7Si alloy and its modification with strontium. Mater. Sci. Eng. A 2000, 283, 94–104. [Google Scholar] [CrossRef]
- Rao, A.K.P.; Kumar, G.S.V.; Reddy, N.S.; Venkateswarulu, K.; Kori, S.A.; Prasad, K.V.S.; Rao, A.A. Grain Refinement and Modification of Al Alloys; Department of Metallurgical and Materials Engineering, Indian Institute of Technology Madras: Chennai, India, 2002. [Google Scholar]
- Saburov, V.P. Choice of Modificators and Practice of Cast Alloys Modification; Publishing house OmPI: Omsk, Russia, 1984; p. 98. (In Russian) [Google Scholar]
- Schaffer, P.L.; Dahle, A.K. Settling behavior of different grain refiners in aluminum. Mater. Sci. Eng. A 2005, 413, 373–378. [Google Scholar] [CrossRef]
- Kalinina, N.E.; Kavatz, O.A.; Kalinin, V.T. Modification influence of mechanical and corrosion properties of cast aluminum alloys, In Hightemperature Technique Problems; Dagestan State University Publishing House: Makhachkala, Russia, 2008; pp. 57–61. (In Russian) [Google Scholar]
- Krushenko, G.G.; Joukov, M.F.; Kornilov, A.A. Method for alloys modification. J. Invent. 1981, 23. (In Russian) [Google Scholar]
- Balashov, B.A.; Krushenko, G.G.; Vasilenko, Z.A.; Anikina, B.I. Dependence of Al grains sizes of method for master alloy Al-Zr production. Non-Ferr. Met. 1989, 5, 92–93. (In Russian) [Google Scholar]
- Basavakumara, K.G.; Mukunda, P.G.; Chakraborty, M. Influence of grain refinement and modification on microstructure and mechanical properties of Al–7Si and Al–7Si–2.5Cu cast alloys. Mater. Charact. 2008, 59, 283–289. [Google Scholar] [CrossRef]
- Davies, I.G.; Dennis, J.M.; Hellawell, A. The nucleation of aluminum grains in alloys of aluminum with titanium and boron. Metall. Trans. 1970, 1, 275–280. [Google Scholar]
- Mazahery, A.; Shabani, M.O. Microstructural and abrasive wear properties of SiC reinforced aluminum-based composite produced by compocasting. Trans. Nonferrous Met. Soc. China 2013, 23, 1905–1914. [Google Scholar] [CrossRef]
- Nagaral, M.; Bharath, V.; Auradi, V. Effect of Al2O3 Particles on Mechanical and Wear Properties of 6061al Alloy Metal Matrix Composites. J. Mater. Sci. Eng. 2013, 2, 120. [Google Scholar] [CrossRef]
- Ramesh, M.; Karthikeyan, T.; Kumaravel, A.; Kumaran, S.S.; Raja, V.L. Metallurgical and Mechanical Behavior of Basalt Particulate Reinforced Aluminum (A356) Matrix Composites. Eur. J. Sci. Res. 2012, 95, 524–532. [Google Scholar]
- Shin, J.H.; Jeon, J.H.; Bae, D.H. Microstructure refining of aluminum alloys using aluminothermic reaction with ZnO nanoparticles. Mater. Lett. 2015, 151, 96–99. [Google Scholar] [CrossRef]
- Borodianskiy, K. Metallurgical processes in AlSi alloy improved by WC nanoparticles. In Proceedings of the 15-th Israeli-Russian Bi-National Workshop 2016, The Optimization of Composition, Structure and Properties of Metals, Oxides, Composites, Nano and Amorphous Materials, Ekaterinburg, Russia, 26–30 September 2016; pp. 10–18. [Google Scholar]
- Mohsen, H.; Omid, M.; Mohammadian-Semnani, H. Evaluation of microstructural and mechanical properties of A356 composite strengthened by nanocrystalline V8C7-Al2O3 particles synthesized through mechanically activated sintering. J. Alloy. Compd. 2019, 782, 995–1007. [Google Scholar]
- Ferreira, V.; Egizabal, P.; Popov, V.; de Cortázar, M.G.; Irazustabarrena, A.; López-Sabirón, A.M.; Ferreira, G. Lightweight automotive components based on nanodiamond-reinforced aluminum alloy: A technical and environmental evaluation. Diam. Relat. Mater. 2019, 92, 174–186. [Google Scholar] [CrossRef]
- Valikhov, V.; Kahidze, N.; Khrustalyov, A.; Zhukov, I.; Vorozhtsov, A. Investigation of structure, mechanical properties and crystallization of aluminum alloys containing aluminum oxide nanoparticles. MATEC Web Conf. 2018, 243, 22. [Google Scholar] [CrossRef]
- Veeraiah, G.; Santosh Kumar, M.S.S.; Vimal Varma, V.V.; Sudhakar, I. Synthesis of nano particles reinforced composites using A356 aluminium alloy as matrix for brake shoes using stir casting route. IOP Conf. Ser. Mater. Sci. Eng. 2018, 455, 012077. [Google Scholar] [CrossRef]
- Afkham, Y.; Khosroshah, R.A.; Rahimpour, S.; Aavani, C.; Brabazon, D.; Mousavian, R.T. Enhanced mechanical properties of in situ aluminum matrix composites reinforced by alumina nanoparticles. Arch. Civ. Mech. Eng. 2018, 18, 215–226. [Google Scholar] [CrossRef]
- Hashim, F.A.; Abdulkader, N.J.; Jasim, N.S. Effect of nano BN Addition on the Properties of an Aluminum Metal Matrix Composite. Eng. Technol. J. 2018, 36, 196–695. [Google Scholar] [CrossRef]
- Yijie, Z.; Ji, S. Shouxun, Reinforcement of TiB2 Nanoparticles in Aluminum Piston Alloys for High Performance at Elevated Temperature. Nanomanuf. Metrol. 2018, 1, 248–251. [Google Scholar] [CrossRef]
- Ibrahim, S.I.; Tawfeeq, A.F. The Response of Some Properties of (Al-Si-Mg) Alloy to Nano-Ceramic Materials’ Addition. J. Eng. (Eng. J.) 2018, 24, 1–14. [Google Scholar] [CrossRef]
- Borodianskiy, K.; Kossenko, A.; Zinigrad, M. Improvement of the Mechanical Properties of Al-Si Alloys by TiC Nanoparticles. Metall. Mater. Trans. A 2013, 44, 4948–4953. [Google Scholar] [CrossRef]
- Dimitrova, R.; Kuzmanov, P.; Lazarova, R.; Manolov, V. Investigation of nanopowders application in metal casting. Adv. Mater. Res. 2013, 629, 284–291. [Google Scholar] [CrossRef]
- Kuzmanov, P.; Dimitrova, R.; Lazarova, R.; Cherepanov, A.; Popov, S.; Petrov, R.; Manolov, V. Investigation of the structure and mechanical properties of castings of alloy AlSi7Mg, cast iron GG15 and GG25 and steel GX120Mn12, modified by nanosized powders. Proc. Inst. Mech. Eng. Part N J. Nanoeng. Nanosyst. 2014, 228, 11–18. [Google Scholar] [CrossRef]
- Dimitrova, R.; Kuzmanov, P.; Stanev, S.; Lazarova, R.; Manolov, V. Investigation of metal alloys modified with nano-sized particles. J. Mater. Sci. Technol. 2012, 20, 98–116. [Google Scholar]
- Bojanova, N.; Dimitrova, R.; Velikov, A.; Stanev, S. Effect of nanomodifiers on the density and the porosity of AlSi7Mg alloy castings. J. Mach. Technol. Mater. 2013, 3, 56–59. [Google Scholar]
- Lazarova, R.; Bojanova, N.; Dimitrova, R.; Panov, I.; Manolov, V. Influence of nanoparticles introducing in the melt of aluminum alloys on castings microstructure and properties. Int. J. Met. 2016, 10, 466–476. [Google Scholar] [CrossRef]
- Kaleicheva, J.; Mishev, V.; Avdeev, G.; Karaguiozova, Z.; Dineva, B. Influence of nanoadditives on the structure and properties of austempered ductile irons. In Proceedings of the European Conference on Heat Treatment and 21st IFHTSE Congress, Munich, Germany, 12–15 May 2014. [Google Scholar]
- Gobre, V.V.; Tkatchenko, A. Scaling laws for van der Waals interactions in nanostructured materials. Nat. Commun. 2013, 4, 2341. [Google Scholar] [CrossRef] [PubMed] [Green Version]
Figure 1.
Outlook of casting, from which S1 and S2 were cut. The arrow indicates the sample surface used in optical microscopy as well as for Electron Backscattered Diffraction (EBSD) analyses.
Figure 1.
Outlook of casting, from which S1 and S2 were cut. The arrow indicates the sample surface used in optical microscopy as well as for Electron Backscattered Diffraction (EBSD) analyses.

Figure 2.
Metal mold for thermal analysis (a) and cast sample (b), samples S3 and S4. The arrow indicates direction of samples surface, used in light optical microscopy (LM), as well as for EBSD analyses.
Figure 2.
Metal mold for thermal analysis (a) and cast sample (b), samples S3 and S4. The arrow indicates direction of samples surface, used in light optical microscopy (LM), as well as for EBSD analyses.
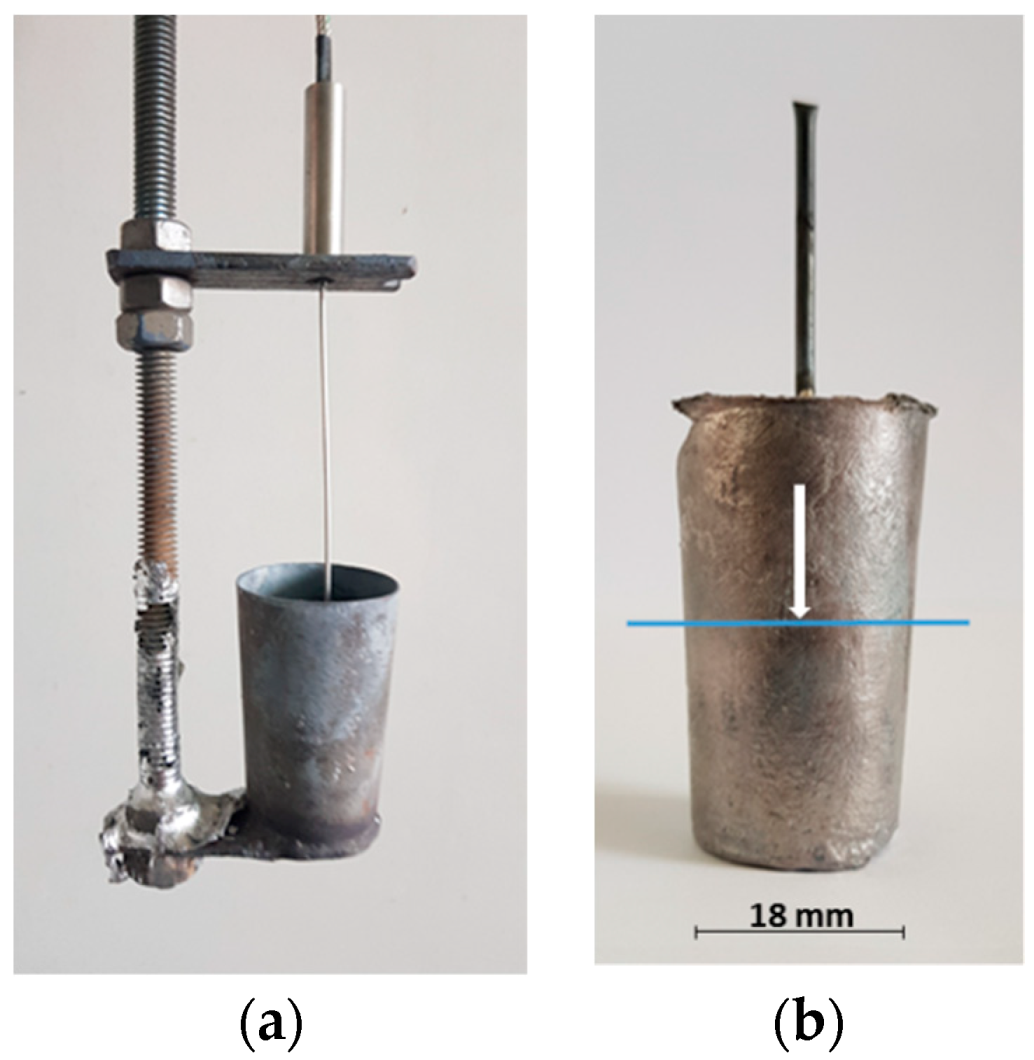
Figure 3.
LM images of (a) S1 (non-modified), and (b) S2, modified with 0.1 wt.% SiC + Cu. Magnified views in the top right corner show the eutectic morphology.
Figure 3.
LM images of (a) S1 (non-modified), and (b) S2, modified with 0.1 wt.% SiC + Cu. Magnified views in the top right corner show the eutectic morphology.
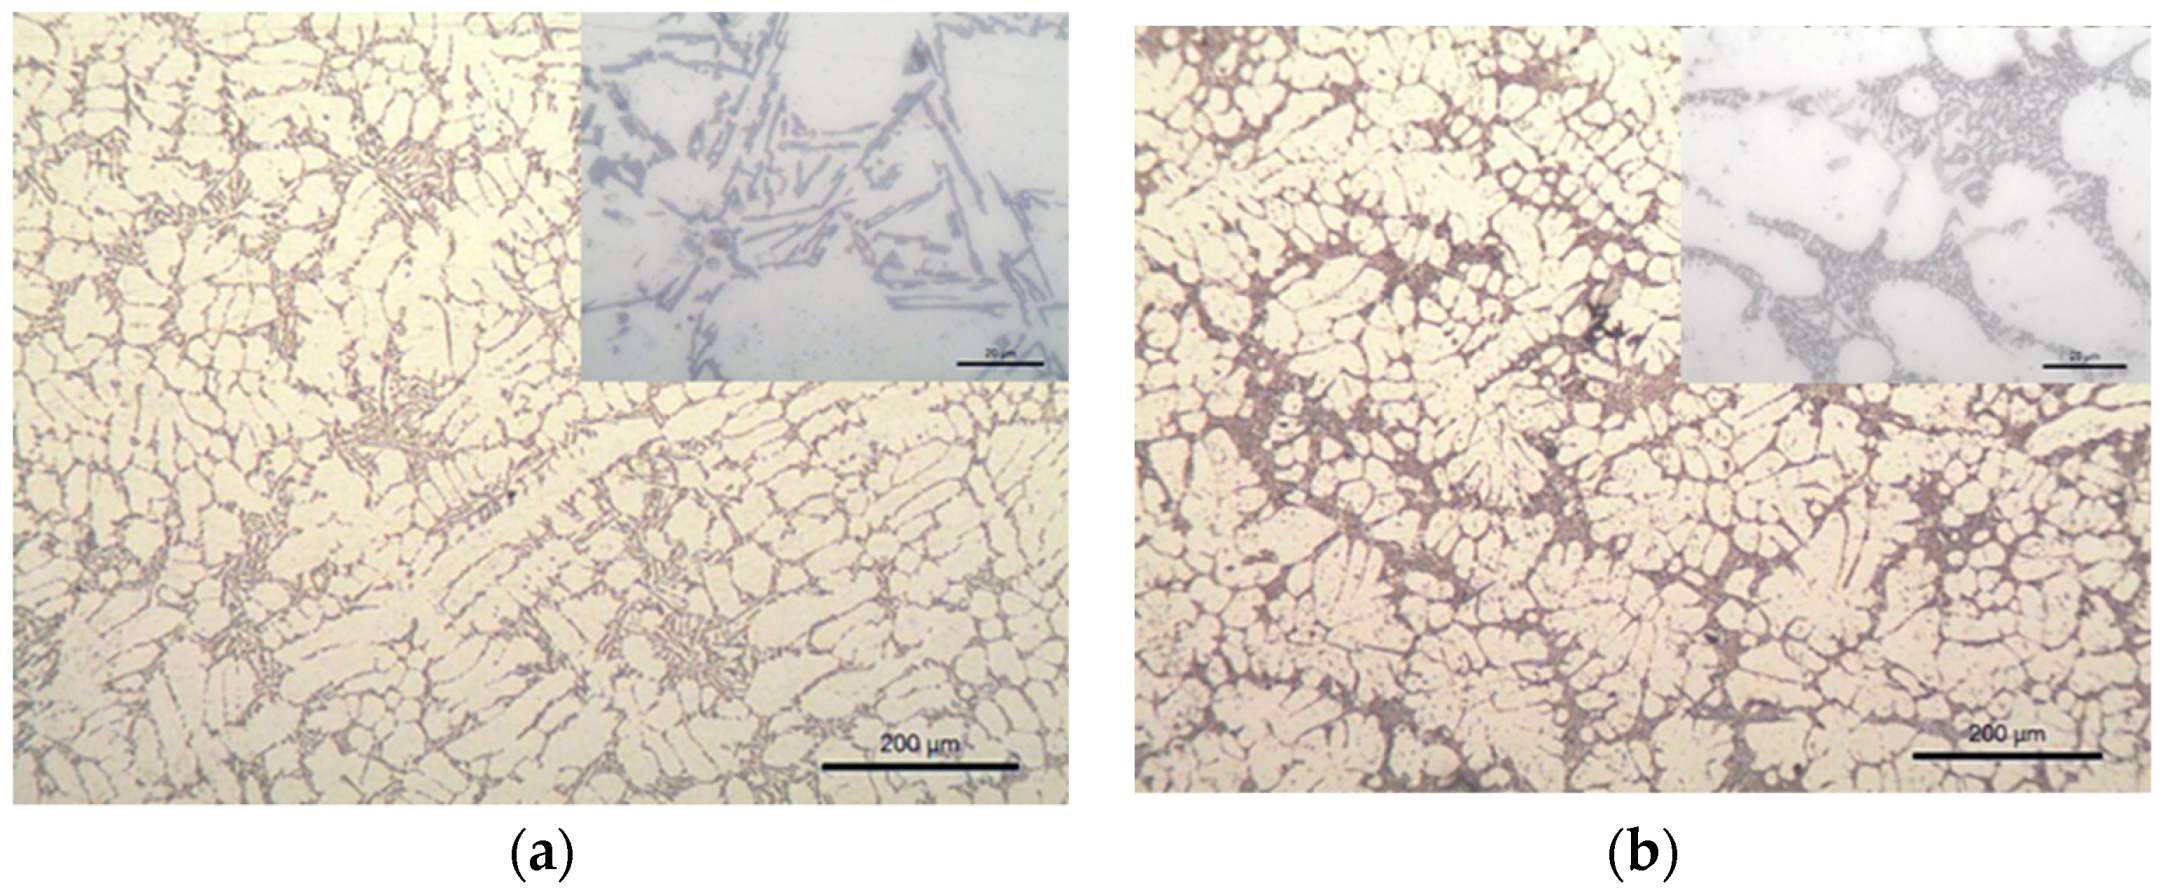
Figure 4.
Unique grain color EBSD maps for (a) S1 (unmodified) and (b) S2 (modified with 0.1 wt.% SiC + Cu) samples.
Figure 4.
Unique grain color EBSD maps for (a) S1 (unmodified) and (b) S2 (modified with 0.1 wt.% SiC + Cu) samples.
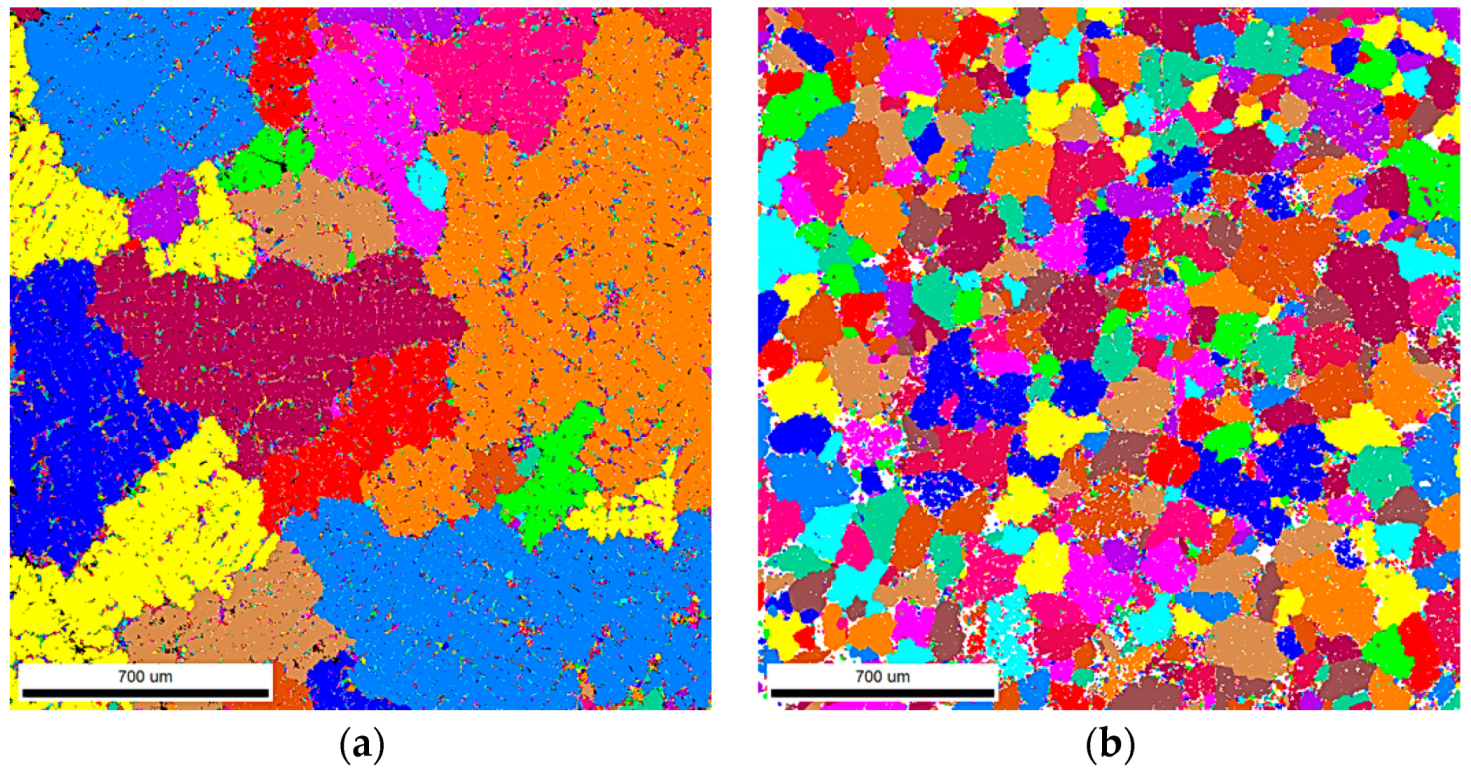
Figure 5.
Grain sizes (diameters) for S1 and S2 and area fraction.
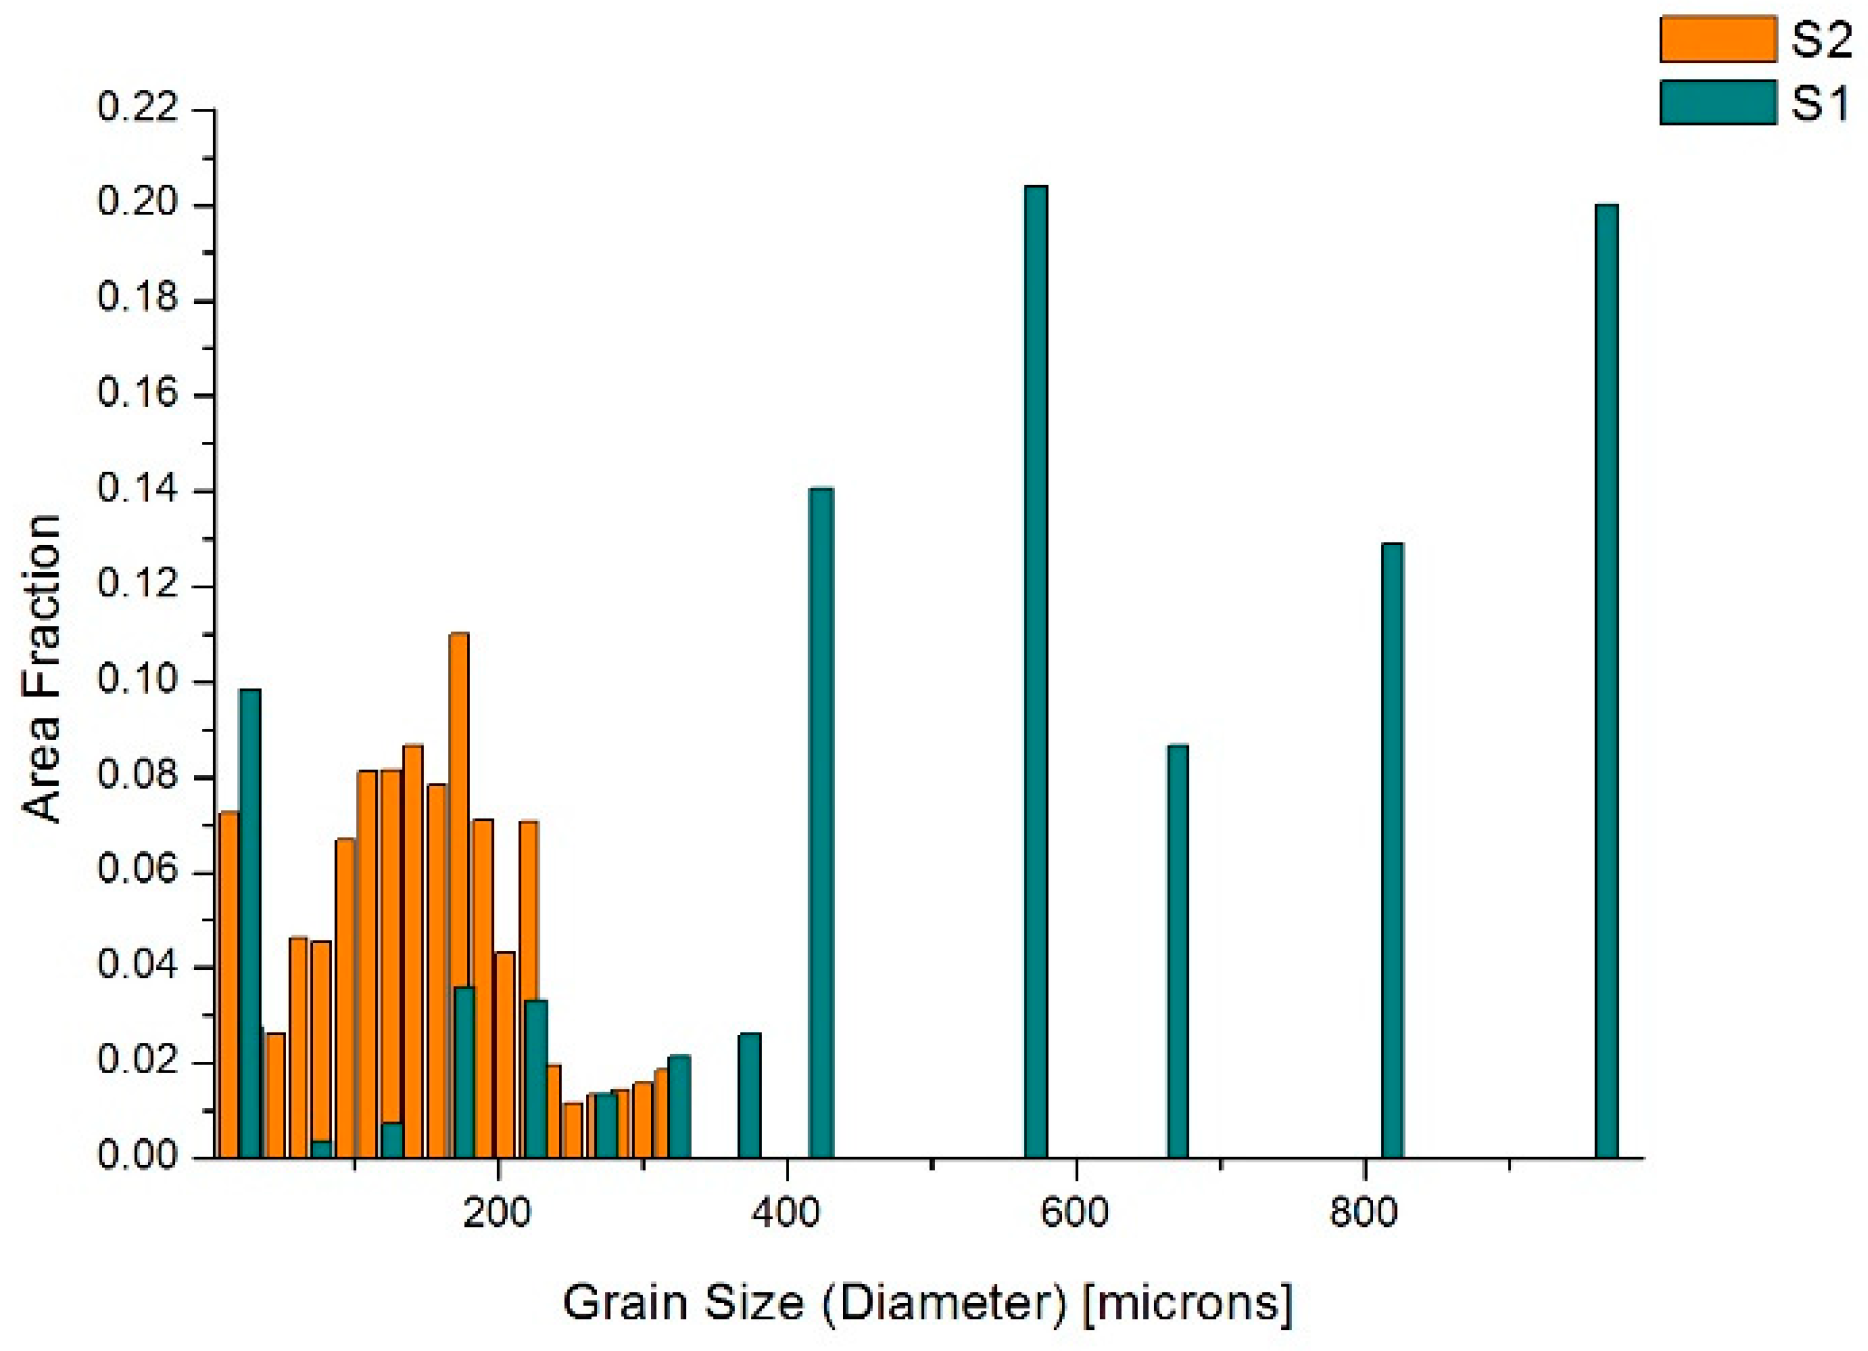
Figure 6.
LM images of (a) S3 (non-modified) and (b) S4 modified with 0.04 wt.% TiCN. Magnified views on the top right corners show the eutectic morphology.
Figure 6.
LM images of (a) S3 (non-modified) and (b) S4 modified with 0.04 wt.% TiCN. Magnified views on the top right corners show the eutectic morphology.
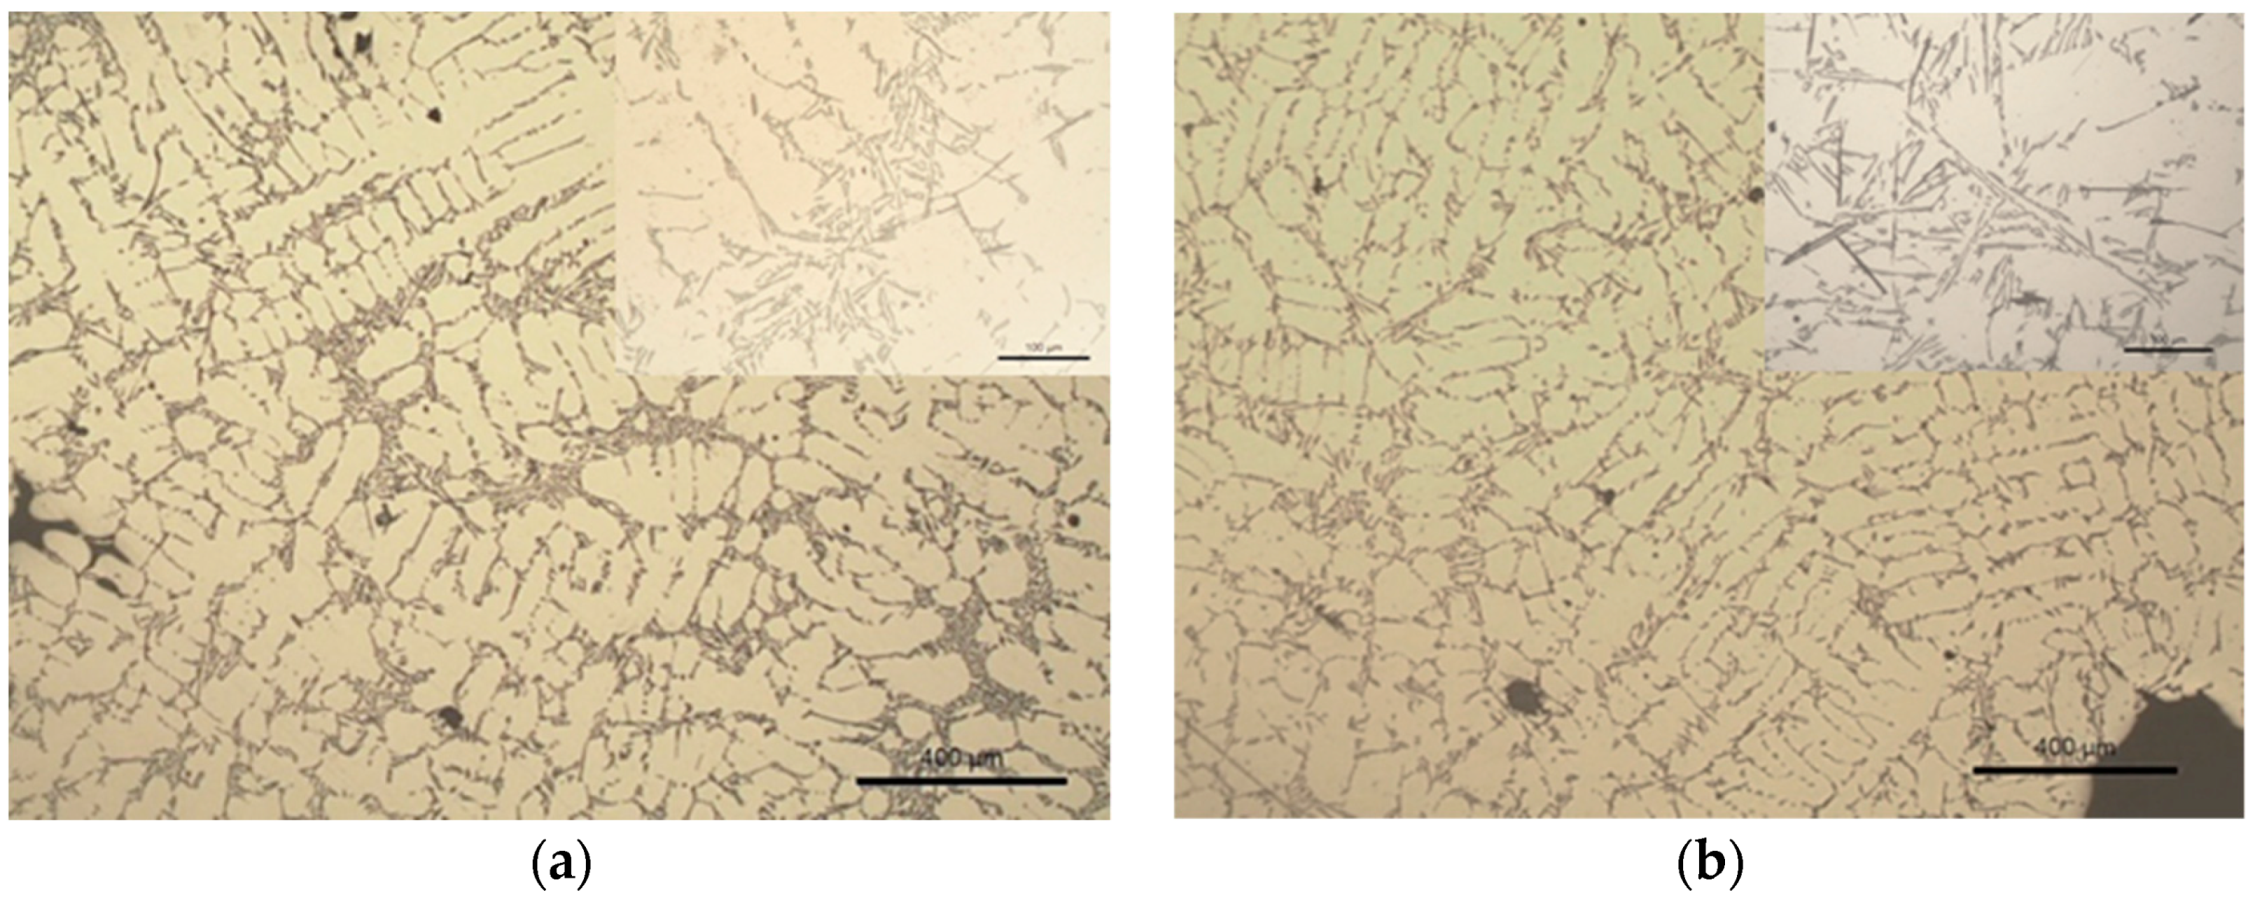
Figure 7.
Temperature curves of samples S3 (non-nmodified) and S4 (modified with 0.04 wt.% TiCN).
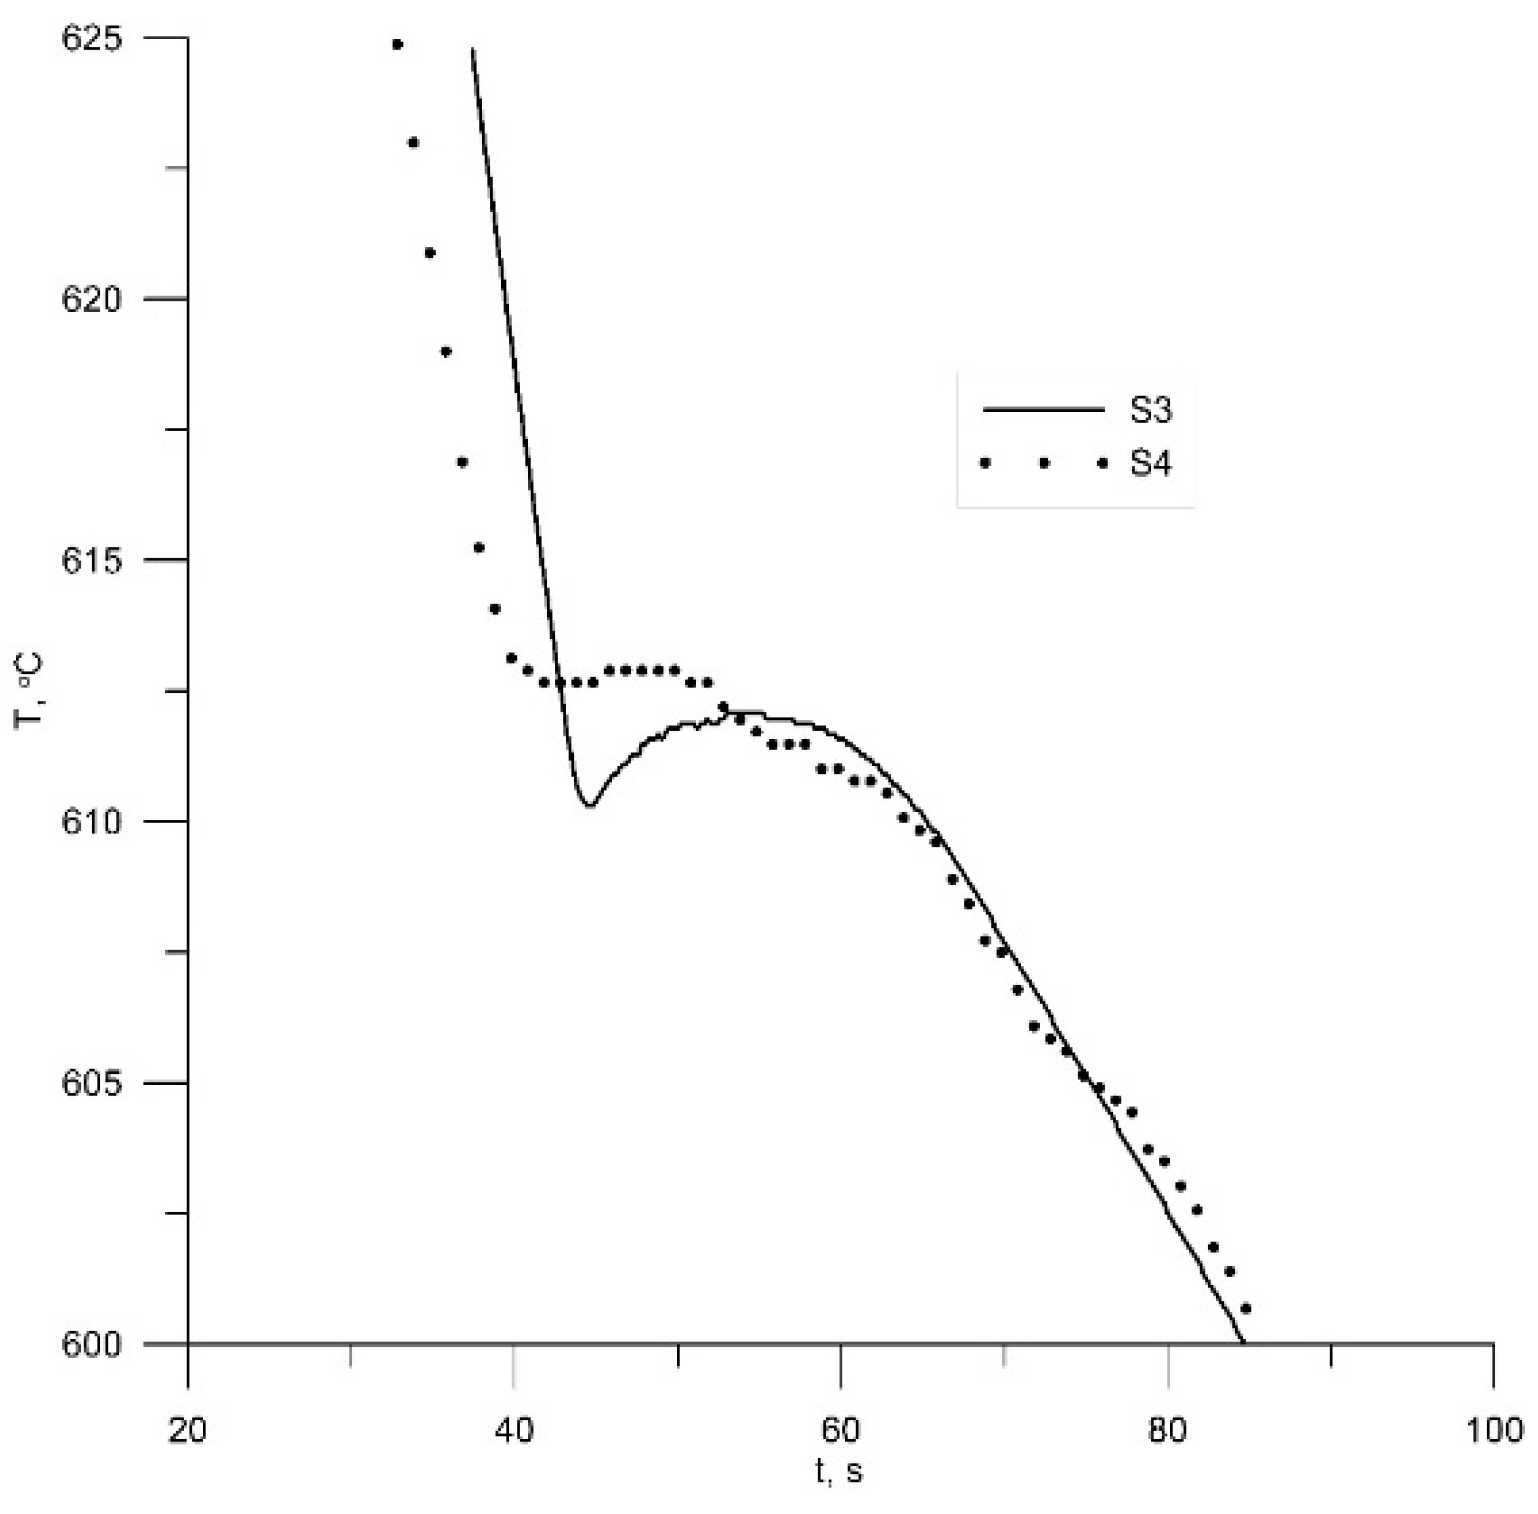
Figure 8.
Unique grain colour EBSD maps for (a) samples S3 (non-modified) and (b) sample S4 (modified with 0.04 wt.% TiCN).
Figure 8.
Unique grain colour EBSD maps for (a) samples S3 (non-modified) and (b) sample S4 (modified with 0.04 wt.% TiCN).
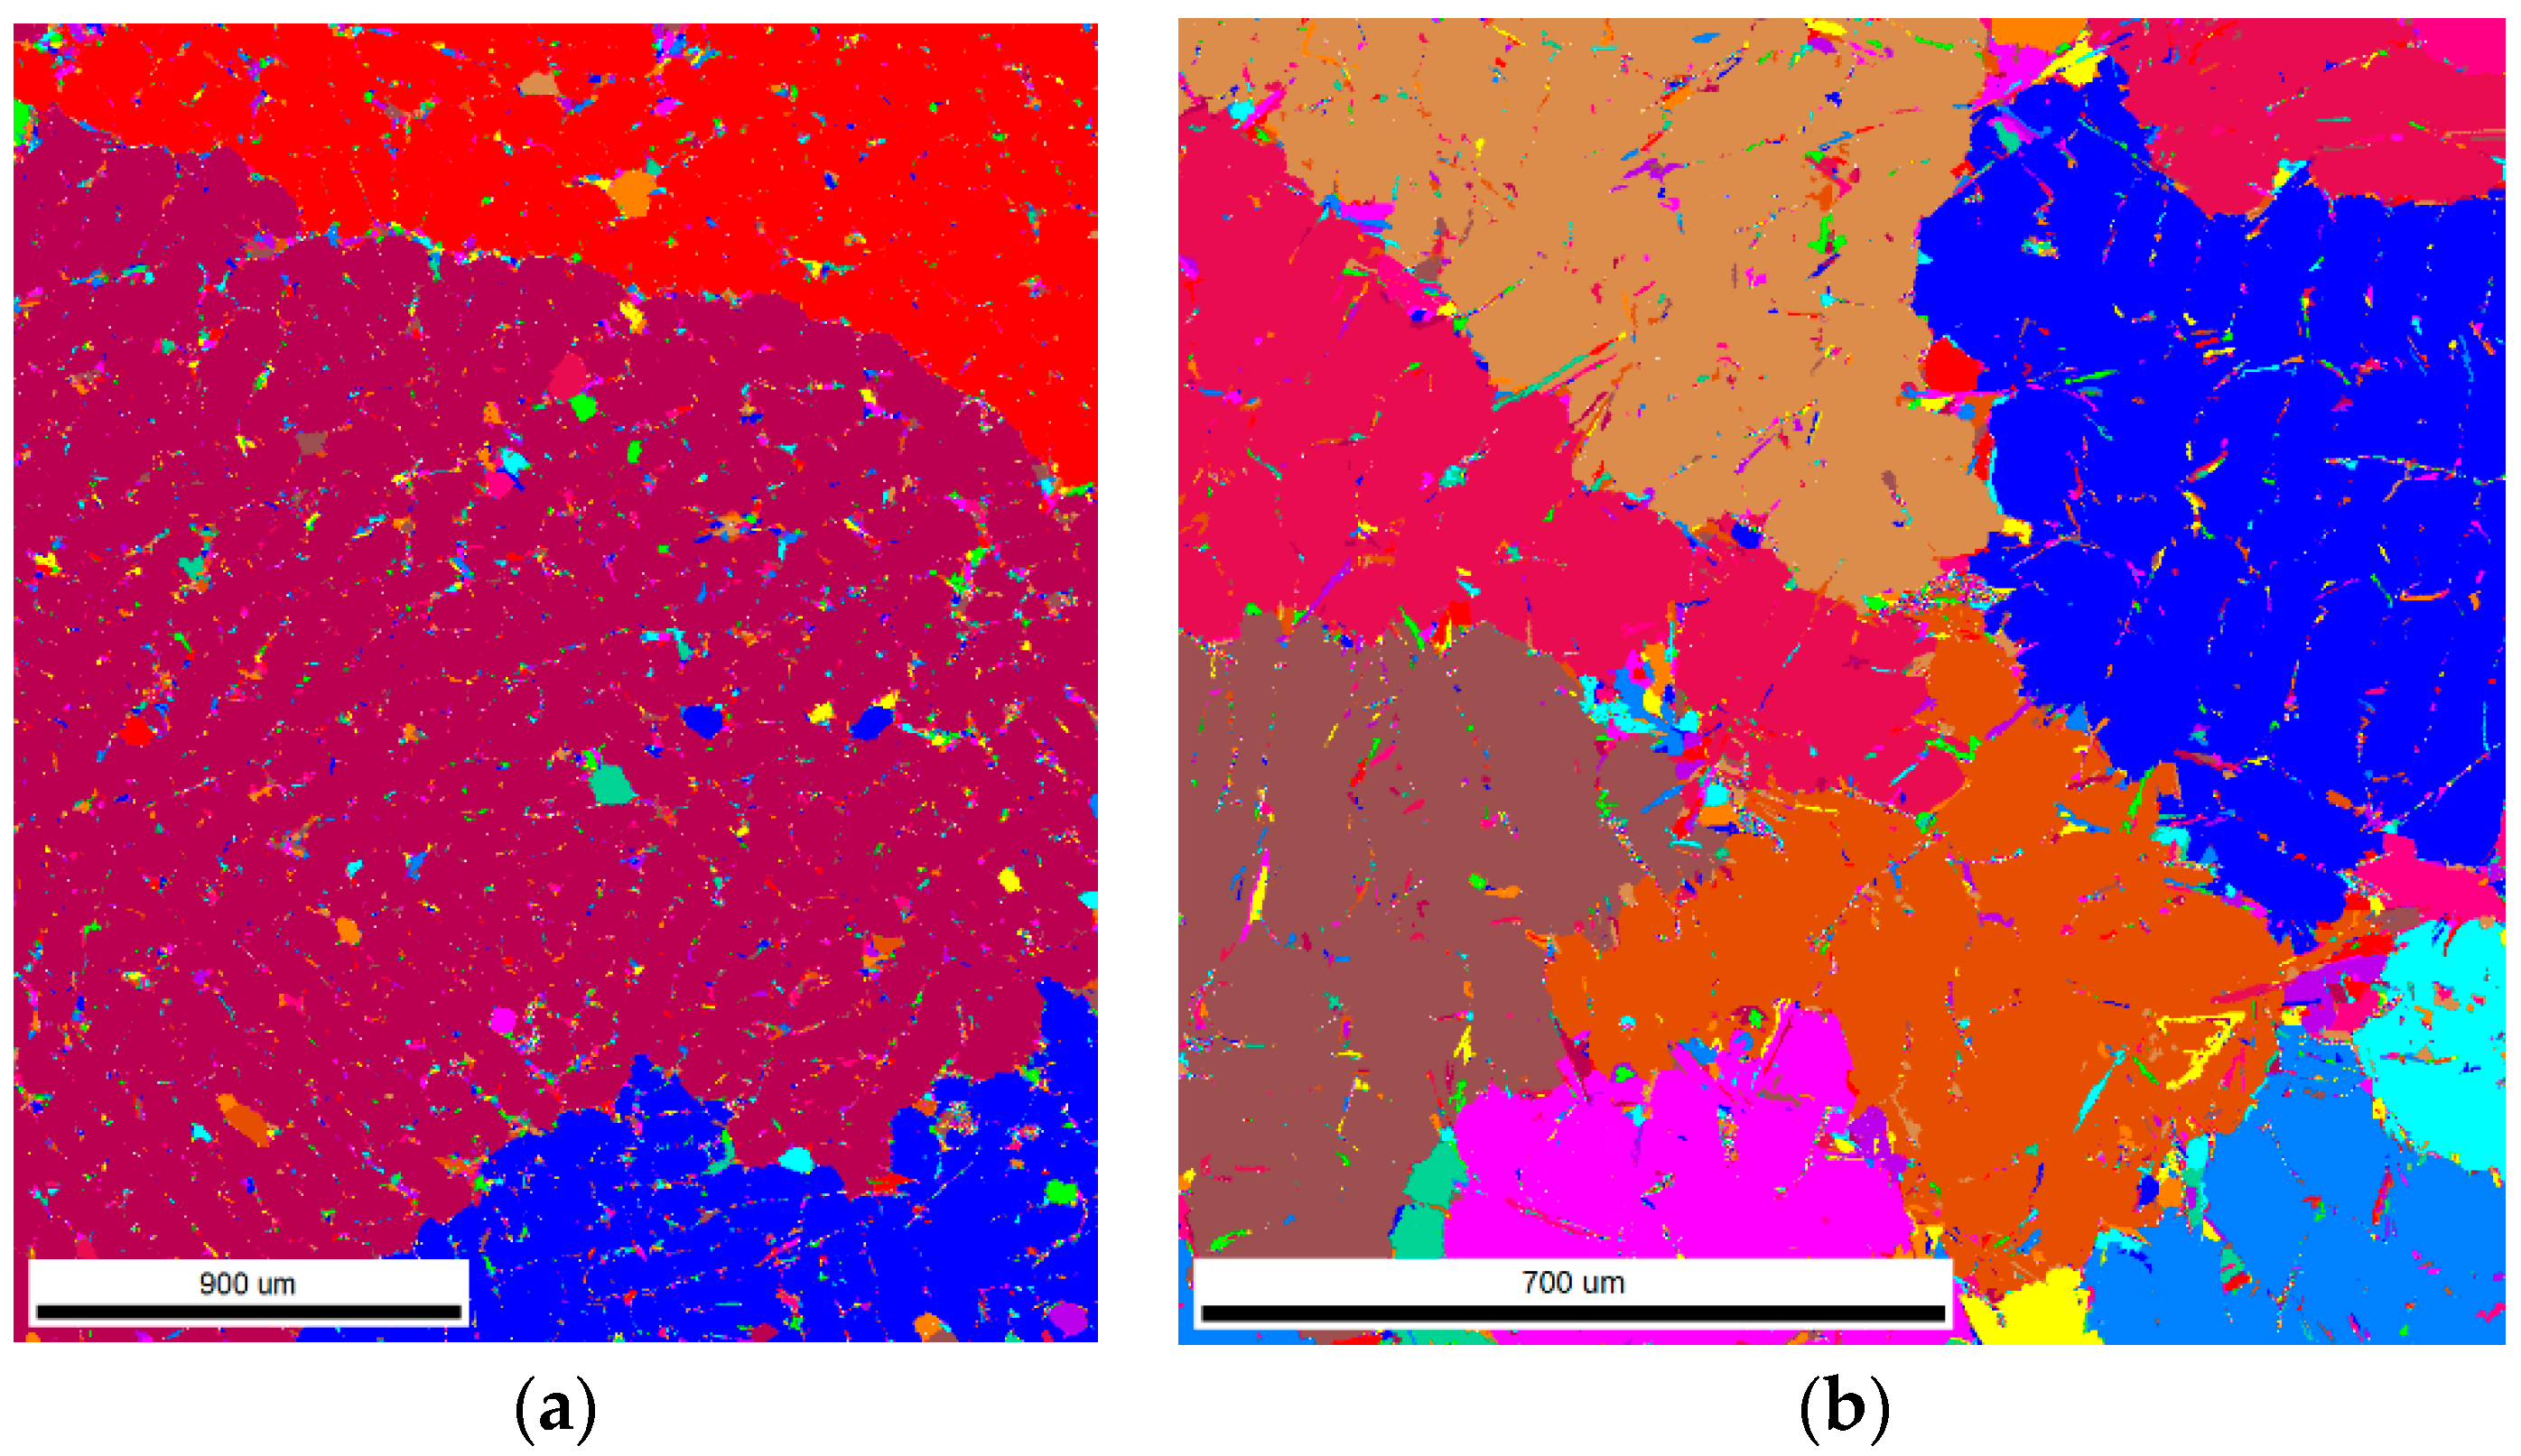
Figure 9.
Grain sizes (diameters) for S3 and S4.
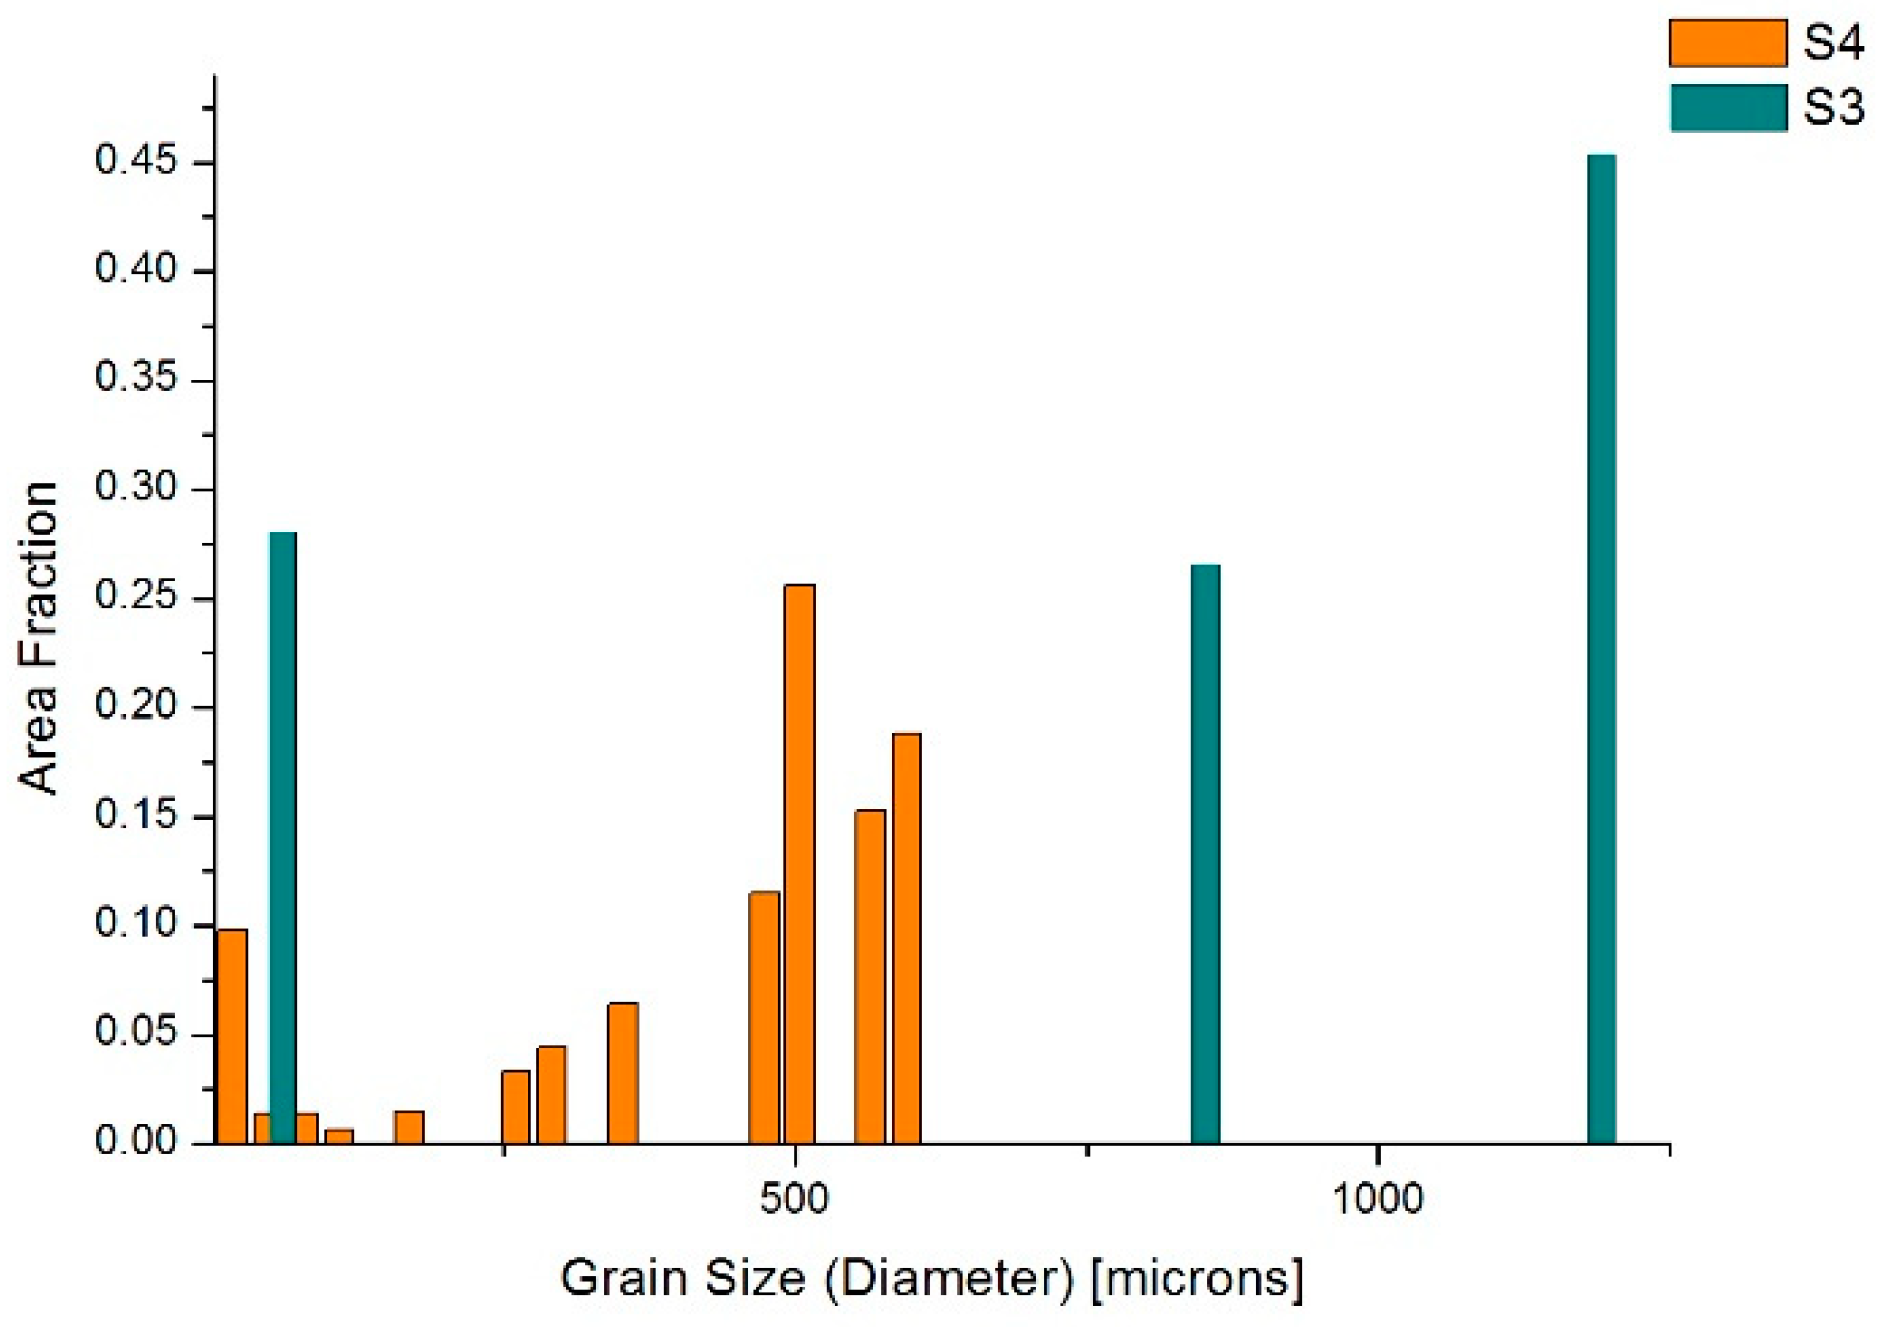
Figure 10.
STEM image with indication of the points of interest on which EDX analysis was carried out. The results are shown in Table 4.
Figure 10.
STEM image with indication of the points of interest on which EDX analysis was carried out. The results are shown in Table 4.


Table 1.
Chemical composition of used aluminum alloy (A356) in wt.%.
| Si | Mg | Ti | Fe | Cu | Mn | Al |
|---|---|---|---|---|---|---|
| 7.50 | 0.30 | 0.02 | 0.39 | 0.05 | 0.03 | bal. |
Table 2.
SDAS and HV0.01 data for the unmodified S1 and modified S2 samples. The arrows and the numbers next to them show the direction and the percentage in which the parameter is changed.
Table 2.
SDAS and HV0.01 data for the unmodified S1 and modified S2 samples. The arrows and the numbers next to them show the direction and the percentage in which the parameter is changed.
| Sample | SDAS, µm | HV0.01 |
|---|---|---|
| S1—non-modified | 46.7 | 598.2 |
| S2—modified with 0.1 wt.% SiC+Cu | 17.7 (↓62%) | 675.7 (↑13%) |
Table 3.
SDAS and HV0.01 data for the unmodified S3 and modified S4 samples. The arrows and the numbers next to them show the direction and the percentage in which the parameter is changed.
Table 3.
SDAS and HV0.01 data for the unmodified S3 and modified S4 samples. The arrows and the numbers next to them show the direction and the percentage in which the parameter is changed.
| Sample | SDAS, µm | HV0.01 |
|---|---|---|
| S3—non-modified | 47.83 | 638.2 |
| S4—modified with 0.04 wt.% TiCN | 44.12 (↓7.8%) | 660.6 (↑3.5%) |
Table 4.
EDX point analyses results for S2 and base alloy composition, in at.%.
| Memo | C | O | Mg | Al | Si | Fe | Cu | Total (at.%) Accuracy |
|---|---|---|---|---|---|---|---|---|
| 28 | 1.33 | 6.87 | 0.18 | 11.04 | 1.31 | 0.37 | 78.9 | 100 |
| 29 | 2 | 3.71 | 0 | 12.87 | 1.45 | 0.48 | 79.49 | 100 |
| 30 | 2.37 | 11.89 | 0.23 | 12.85 | 1.68 | 0.49 | 70.49 | 100 |
| 31 | 1.43 | 12.25 | 0.42 | 56.91 | 1.73 | 0.28 | 26.98 | 100 |
| 32 | 0 | 7.6 | 0.15 | 88.85 | 1.6 | 0.24 | 1.56 | 100 |
| Base alloy | - | - | 0.3336 | 92.187 | 7.2417 | 0.1899 | 0.0214 | 99.9736 |
© 2019 by the authors. Licensee MDPI, Basel, Switzerland. This article is an open access article distributed under the terms and conditions of the Creative Commons Attribution (CC BY) license (http://creativecommons.org/licenses/by/4.0/).
Share and Cite
MDPI and ACS Style
Dimitrova, R.; Petrov, R.; Kuzmanov, P.; Velikov, А.; Manolov, V. Electron Microscopy Investigations of А356 Alloy Modified with Nanoparticles. Metals 2019, 9, 1294. https://doi.org/10.3390/met9121294
AMA Style
Dimitrova R, Petrov R, Kuzmanov P, Velikov А, Manolov V. Electron Microscopy Investigations of А356 Alloy Modified with Nanoparticles. Metals. 2019; 9(12):1294. https://doi.org/10.3390/met9121294
Chicago/Turabian StyleDimitrova, Rositza, Roumen Petrov, Pavel Kuzmanov, Аngel Velikov, and Valentin Manolov. 2019. "Electron Microscopy Investigations of А356 Alloy Modified with Nanoparticles" Metals 9, no. 12: 1294. https://doi.org/10.3390/met9121294
Note that from the first issue of 2016, this journal uses article numbers instead of page numbers. See further details here.