Nickel, Graphene, and Yttria-Stabilized Zirconia (YSZ)-Added Mg by Grinding in Hydrogen Atmosphere for Hydrogen Storage


1
Hydrogen & Fuel Cell Research Center, Division of Advanced Materials Engineering, Engineering Research Institute, Jeonbuk National University, 567 Baekje-daero Deokjin-gu, Jeonju 54896, Korea
2
Department of Materials Engineering, Graduate School, Jeonbuk National University, 567 Baekje-daero Deokjin-gu, Jeonju 54896, Korea
*
Author to whom correspondence should be addressed.
Metals 2019, 9(12), 1347; https://doi.org/10.3390/met9121347
Submission received: 22 November 2019
/
Revised: 9 December 2019
/
Accepted: 10 December 2019
/
Published: 14 December 2019
(This article belongs to the Special Issue Advanced Hydrogen Storage Metallic Materials/Nanomaterials)
Abstract
:Magnesium (Mg) has good hydrogen storage features except for its slow reaction kinetics with hydrogen and high hydride decomposition temperature. Yttria (Y2O3)-stabilized zirconia (ZrO2) (YSZ), nickel (Ni), and graphene were picked as additives to Mg to solve these problems. Samples with a composition of 92.5 wt% Mg + 2.5 wt% YSZ + 2.5 wt% Ni + 2.5 wt% graphene (designated as Mg + YSZ + Ni + graphene) were prepared by grinding in hydrogen atmosphere. The activation of Mg + YSZ + Ni + graphene was finished at the third cycle (n = 3). Mg + YSZ + Ni + graphene had an efficient hydrogen storage capacity (the amount of hydrogen absorbed for 60 min) over 7 wt% (7.11 wt%) at n = 1. Mg + YSZ + Ni + graphene contained Mg2Ni phase after cycling. The addition of Ni and Ni + YSZ greatly increased the initial hydride formation and decomposition rates, and the amount of hydrogen absorbed and released for 60 min, Ha (60 min) and Hd (60 min), respectively, of a 95 wt% Mg + 5 wt% graphene sample (Mg + graphene). Rapid nucleation of the Mg2Ni-H solid solution in Ni-containing samples is believed to have led to higher initial decomposition rates than Mg + graphene and Mg. The addition of YSZ also enhanced the initial decomposition rate and Hd (60 min) compared to a sample with a composition of 95 wt% Mg + 2.5 wt% Ni + 2.5 wt% graphene (Mg + Ni + graphene).
1. Introduction
Magnesium (Mg) has good hydrogen storage features except its slow reaction kinetics with hydrogen and high hydride decomposition temperature [1,2,3,4]. In many studies, attempts to solve these problems were made by adding transition metals [5,6,7] and by preparing Mg-including compounds [8].
Oxides can be easily crushed during grinding in mills because they are brittle. The hydride formation and decomposition kinetics of Mg have also been ameliorated by adding oxides to MgH2 or Mg [9,10,11,12,13,14,15,16,17,18]. Yttria (Y2O3)-stabilized zirconia (ZrO2) (YSZ) is used for tooth crowns due to its hardness and chemical inertness [19]. We were interested in YSZ as an oxide additive.
Nickel (Ni) is known to act as an active site for chemisorption of hydrogen molecules and recombination of hydrogen atoms [20]. To increase the hydride formation and decomposition rates of magnesium, nickel (Ni) was doped in many works [21,22,23,24]. Heat transfer is one of the rate-determining steps in the hydride formation of Mg and the decomposition of MgH2. Graphite has a relatively high thermal conductivity. The addition of graphite can thus transfer and disperse heat rapidly. The average specific gravity of graphite is small, and its specific surface area is large. Graphene, one of the carbon allotropes, has a theoretical specific surface area (SSA) of 2630 m2/g [25]. We were also interested in Ni and graphene as additives.
In this work, yttria (Y2O3)-stabilized zirconia (ZrO2) (YSZ), Ni, and graphene were picked as additives to increase the hydride formation and decomposition rates of Mg. The sum of the additive contents was 7.5 wt%. Samples with a composition of 92.5 wt% Mg + 2.5 wt% YSZ + 2.5 wt% Ni + 2.5 wt% graphene were prepared by grinding in hydrogen atmosphere. The samples were designated as Mg + YSZ + Ni + graphene. The hydride formation and decomposition features of the samples were investigated and a comparison was made with samples containing Mg, Mg and graphene, and Mg, Ni, and graphene.
2. Materials and Methods
Pure Mg powder (particle size: −20 + 100 mesh, purity 99.8%, metal basis; Alfa Aesar, Haverhill, MA, USA), YSZ (partially stabilized zirconia powder with uniform dispersion of 3 mol% yttria, made by co-precipitation method; Tosoh Corporation, Tokyo, Japan), Ni (nickel powder, average particle size 2.2–3.0 µm, purity 99.9%, metal basis, C typically less than 0.1%; Alfa Aesar, Haverhill, MA, USA), and graphene (3–10 multilayer graphene, length 5–10 µm, purity greater than 99 wt%, thickness 3–6 nm, surface area 150 m2/g, made by chemical exfoliation proprietary method; Carbon Nano-material Technology Co., Ltd., Pohang, Republic of Korea) were used for sample preparation.
Grinding in hydrogen atmosphere was carried out in a high-performance planetary ball mill (Planetary Mono Mill; Pulverisette 6, Fritsch). Mixtures (total weight = 7.8 g) composed of 95 wt% Mg, 2.5 wt% YSZ, and 2.5 wt% Ni were mixed with 105 hardened steel balls (total weight = 360 g) in a hermetically sealed container (of 250 mL volume) made of stainless steel. Samples were all treated in an argon-filled glove box so that the samples might not be oxidized. About 12 bar of high purity hydrogen was charged in the mill container. The samples were ground for 12 h, refilling the hydrogen every two hours. The disc revolved at a speed of 400 rpm.
To prepare Mg + YSZ + Ni + graphene, 0.2 g of graphene was also mixed in the planetary ball mill (Planetary Mono Mill; Pulverisette 6, Fritsch) for 30 min under conditions similar to those for preparing the mixture composed of 95 wt% Mg, 2.5 wt% YSZ, and 2.5 wt% Ni. The sample to ball weight ratio was 1/45.
The prepared Mg + YSZ + Ni + graphene sample was put into the reactor in the Ar-filled glove box before performing absorption and desorption measurements as a function of time. The quantity of hydrogen contained in the sample was measured by releasing hydrogen from the prepared Mg + YSZ + Ni + graphene sample as the temperature of the reactor was increased at a heating rate of 5–6 K/min.
The absorbed or released hydrogen amount was measured as a function of time using a volumetric method with a Sieverts-type hydride formation and decomposition apparatus described previously [26]. During the measurements, the hydrogen pressures were maintained as nearly constant by replenishing the absorbed hydrogen from a small reservoir of a known volume during hydride formation reaction and by removing the released hydrogen to the small reservoir during hydride decomposition reaction. The weight of samples for these measurements was 0.5 g. After the absorbed (in 12 bar H2) and desorbed (in 1.0 bar H2) hydrogen amounts were measured at 573 K, 593 K, or 623 K for 1 h, hydrogen was then released in vacuum at 623 K for 2 h.
X-ray diffraction (XRD) patterns of the samples after grinding in hydrogen atmosphere and after hydride formation–decomposition cycling were obtained in a Rigaku D/MAX 2500 powder diffractometer (Rigaku Corporation, Tokyo, Japan) with Cu Kα radiation. The micrographs of the samples were obtained using a JSM-5900 scanning electron microscope (SEM) (JEOL, Austin, TX, USA) operated at 15 kV. Transmission electron microscope (HR-TEM) (JEM-2010) (ACMAL, Michigan Technological University, Houghton, MI, USA) was also used to observe the microstructures of the powders and to obtain selected area electron diffraction (SAED) patterns. The transmission electron microscope was operated at 200 kV.
3. Results and Discussion
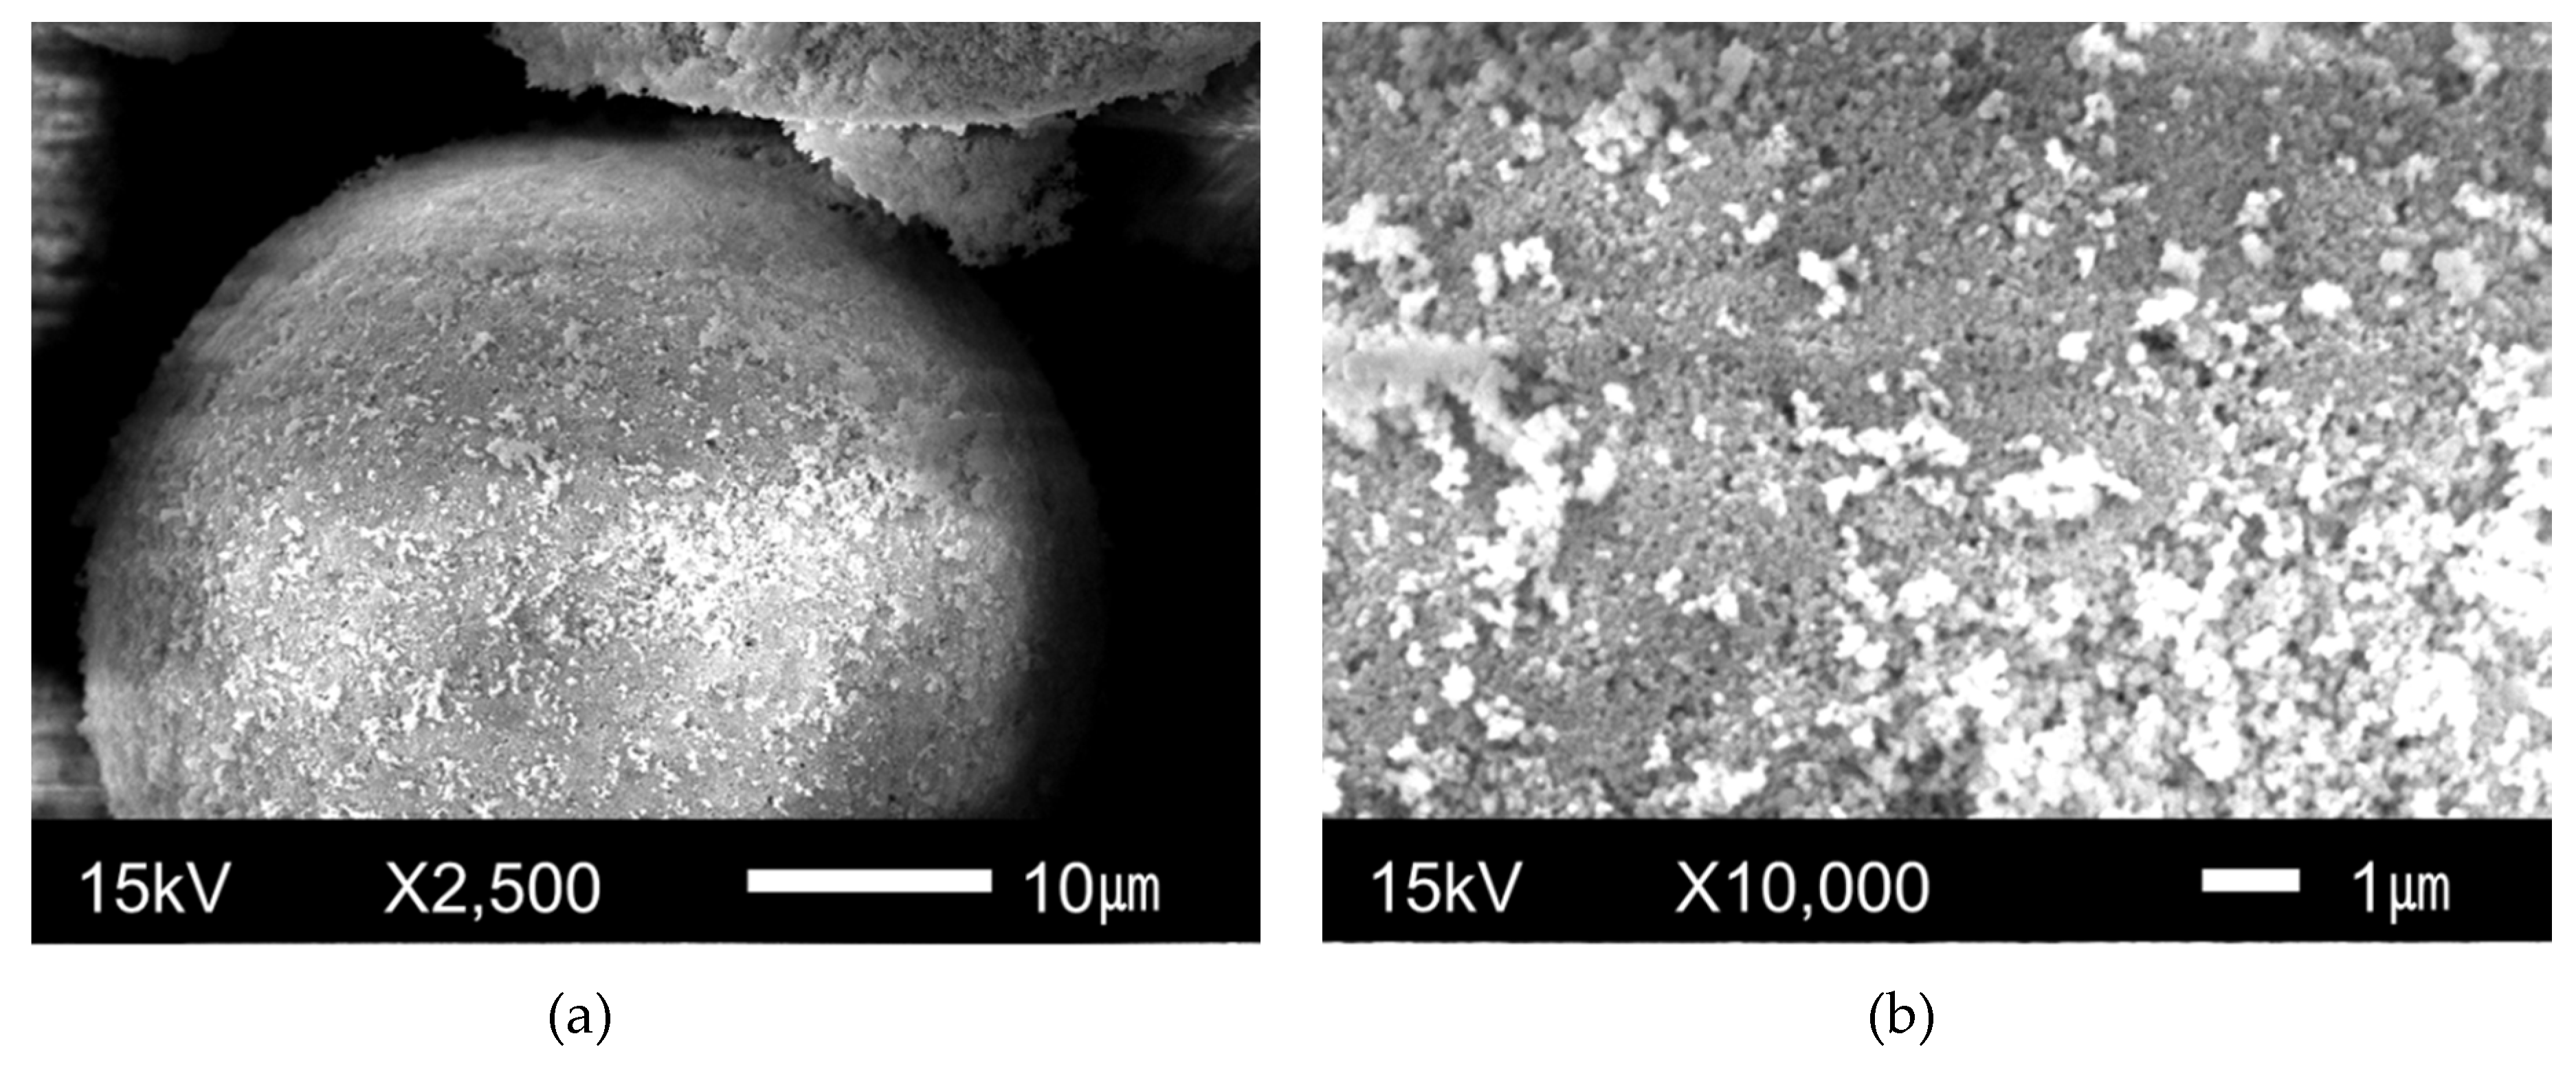
The particle sizes of YSZ were not homogeneous. Figure 1 shows the microstructures of YSZ observed by SEM at two different magnifications. The shape of the particles was spherical and the surfaces of the particles were not smooth. The particles appeared to consist of fine particles.
The SEM micrographs at different magnifications of Mg + YSZ + Ni + graphene after grinding in hydrogen atmosphere are shown in Figure 2. The particle sizes were not homogeneous. The surfaces of the particles were relatively smooth. The particles of this sample were much smaller than those of YSZ. The added YSZ was pulverized during grinding in hydrogen atmosphere. The pulverized YSZ, together with Ni and graphene, is believed to have made the particles of the sample finer.
Figure 3 shows the XRD pattern of Mg + YSZ + Ni + graphene after grinding in hydrogen atmosphere. The background of the XRD pattern was quite high and the peaks in the XRD pattern are slightly broad, showing that the sample was quite noncrystalline. A large quantity of β-MgH2 with small quantities of Mg, γ-MgH2, YSZ, Ni, graphene, and MgO was found. The reaction of Mg with H2 during grinding in hydrogen atmosphere formed β-MgH2 (a low pressure form of magnesium hydride) and γ-MgH2 (a high pressure form of magnesium hydride). β-MgH2 has a tetragonal structure and γ-MgH2 has an orthorhombic structure of the α-PbO2 type. γ-MgH2 usually forms in high hydrogen pressure. The treatment of the sample in air for XRD pattern obtainment is believed to have led to the adsorption of oxygen on the particle surfaces, which are very reactive. This adsorbed oxygen is thought to have reacted with Mg to form MgO. The amount of hydrogen absorbed in the as-prepared Mg + YSZ + Ni + graphene sample was measured after putting the sample into the Sieverts-type hydride formation and decomposition apparatus. The quantity of hydrogen absorbed in this sample was 4.28 wt%.
A sample with a composition of 95 wt% Mg + 5 wt% graphene (designated as Mg + graphene) was prepared under conditions similar to those used for preparing Mg + YSZ + Ni + graphene. A TEM image of the as-prepared Mg + graphene and Raman spectra of graphene and the as-prepared Mg + graphene are shown in Figure 4. Raman spectrum measurements were carried out with an NTEGRA Raman microscope (NT-MDT Spectrum Instruments, Moscow, Russia) with a laser excitation wavelength of 532 nm. The TEM image of the as-prepared Mg + graphene (Figure 4a) showed that graphene was partly broken after milling with the pre-milled Mg. The Raman spectrum of the graphene used in the present study showed D, G, and 2D peaks, which are concerned with graphene. The Raman shifts of D, G, and 2D peaks for graphene were 1355, 1584, and 2713 cm−1, respectively. The ratio of intensities of D and G peaks, ID/IG, for graphene was 0.846. It was reported by Ferrari et al. [27] that the shape and intensity of the 2D peak of graphene were very different from those of bulk graphite which consists of two components 2D1 and 2D2. Ferrari et al. also reported that the graphene D peak is a single sharp peak, whereas in graphite a band consisting of two peaks D1 and D2 [27] is seen. The Raman spectrum in Figure 4b shows that the material used in this work was not graphite, but graphene. It was reported that IG/I2D is about 0.3 in a single layer, increases linearly until quintuple layers, and is saturated in more than sextuple layers [28]. The graphene used in the present study (Figure 4b) had IG/I2D of 1.253, showing that the graphene used in this work was multilayer graphene. Hodkiewicz et al. [29] reported that the D peak is known as the disorder band or the defect band and the intensity of the D peak is directly proportional to the level of defects in the sample. It was reported by Rusi and Majid [30] that increments of ID/IG can be attributed to an increase in defects on the surface of the sample that were produced in the course of synthesis. The ratio of intensities of D and G peaks, ID/IG, for the as-prepared Mg + graphene was 1.255. The increase in ID/IG after grinding in hydrogen atmosphere of graphene with the pre-milled Mg showed that the number of defects of graphene increased, indicating that graphene was partly broken after grinding in hydrogen atmosphere with the pre-milled Mg.
Figure 5 shows the TEM micrographs at various magnifications and a selected area electron diffraction (SAED) pattern of Mg + YSZ + Ni + graphene after grinding in hydrogen atmosphere. The particles had a large number of defects on the surfaces. The surfaces of the particles were undulated. The particles consisted of fine particles. Particles were covered with carbon layers of graphene. Graphene was observed to be partly broken. The SAED pattern of Mg + YSZ + Ni + graphene after grinding in hydrogen atmosphere exhibited that of a polycrystalline structure and revealed the presence of β-MgH2 and γ-MgH2 phases. The interplanar spacings of 0.25, 0.15, and 0.12 nm were for the 101, 310, and 202 planes of β-MgH2, respectively. The interplanar spacings of 0.21 nm was for the 112 plane of γ-MgH2.
The amount of hydrogen absorbed by the sample, Ha, and the amount of hydrogen released by the sample, Hd, were both defined using the sample weight as a standard. Ha and Hd were expressed in the unit of wt% H. The initial hydride formation rate (wt% H/min) was calculated by dividing the amount of hydrogen absorbed for 2.5 min by 2.5. The initial hydride decomposition rate (wt% H/min) was calculated by dividing the amount of hydrogen released for 2.5 min by 2.5.
Changes in the Ha vs. time t curve in 12 bar H2 and the Hd vs. t curve in 1.0 bar H2 at 573 K, with the cycle number, n, for Mg + YSZ + Ni + graphene are presented in Figure 6. From the first cycle, the initial hydride formation rate was very high and the amount of hydrogen absorbed for 60 min, Ha (60 min), was very large. As n increased from one to two, the initial hydride formation rate decreased very slightly and from n = 2 to n = 4, the initial hydride formation rate increased very slightly. The initial hydride formation rates at n = 1–4 were very similar. The Ha (60 min) decreased from n = 1 to n = 4. Mg + YSZ + Ni + graphene absorbed 4.32 wt% H for 10 min and 7.11 wt% H for 60 min at n = 1 and absorbed 4.39 wt% H for 10 min and 6.12 wt% H for 60 min at n = 3. Table 1 shows the variations in Ha with time t at 573 K in 12 bar H2 at n = 1–4 for Mg + YSZ + Ni + graphene. At n = 1, the initial hydride decomposition rate was quite high and the amount of hydrogen released for 60 min, Hd (60 min), was quite large. As n increased from one to three, the initial hydride decomposition rate increased and the initial hydride decomposition rate decreased from n = 3 to n = 4. The Hd (60 min) decreased from n = 1 to n = 4. Mg + YSZ + Ni + graphene released 1.65 wt% H for 10 min and 5.02 wt% H for 60 min at n = 1 and released 1.99 wt% H for 10 min and 4.74 wt% H for 60 min at n = 3. Table 2 shows the variations in Hd with t at 573 K in 1.0 bar H2 at n = 1–4 for Mg + YSZ + Ni + graphene.
Figure 6 shows that the activation of Mg + YSZ + Ni + graphene was finished at n = 3. An efficient hydrogen storage capacity was defined as the amount of hydrogen absorbed for 60 min. Mg + YSZ + Ni + graphene had a high, efficient hydrogen storage capacity over 7 wt% (7.11 wt%) at n = 1.
Variations in the Ha vs. t curve in 12 bar H2 and the Hd vs. t curve in 1.0 bar H2 at n = 1, with temperature (573 K, 593 K, and 623 K), for Mg + YSZ + Ni + graphene are shown in Figure 7. The initial hydride formation rates at 573 K and 593 K were quite high. With the increase in temperature from 573 K to 593 K, the initial hydride formation rate increased. As the temperature increased from 593 K to 623 K, the initial hydride formation rate decreased. The main phase of Mg + YSZ + Ni + graphene was Mg. The equilibrium plateau pressures of the MgH2 system are 1.61 bar, 2.87 bar, and 6.38 bar at 573 K, 593 K, and 623 K, respectively [31]. The driving force for hydride formation reaction is the gap between the applied hydrogen pressure (12 bar in this work) and the equilibrium plateau pressure. The driving forces for hydride formation reaction at 573 K, 593 K, and 623 K are 10.39 bar, 9.13 bar, and 5.62 bar, respectively. The relatively small driving force for hydride formation reaction at 623 K is believed to have decreased the initial hydride formation rate with the increase in temperature from 593 K to 623 K, probably because the effect of the driving force decrease is larger than that the effect of the temperature increase from 593 K to 623 K. Ha (60 min) at 573 K was the largest, followed by Ha (60 min) values at 593 K and 623 K in decreasing order. The initial hydride decomposition rates at 573 K, 593 K, and 623 K were quite high. As the temperature increased from 573 K to 593 K, and then to 623 K, the initial hydride decomposition rate increased. The equilibrium plateau pressures of the MgH2 system are 1.61 bar, 2.87 bar, and 6.38 bar at 573 K, 593 K, and 623 K, respectively [31]. The driving force for hydride decomposition reaction is the gap between the equilibrium plateau pressure and the applied hydrogen pressure (1.0 bar in this work). The driving forces for hydride decomposition reaction at 573 K, 593 K, and 623 K are 0.61 bar, 1.87 bar, and 5.38 bar, respectively. The increases in the driving force and the reaction temperature are believed to have increased the initial hydride decomposition rate as the temperature increased from 573 K to 593 K, and then to 623 K. Hd (60 min) at 593 K was the largest, followed by those at 623 K and 573 K in decreasing order. The smaller Hd (60 min) at 623 K compared to Hd (60 min) at 593 K was caused by the smaller Ha (60 min) at 623 K compared to Ha (60 min) at 593 K before the measurements for the hydride decomposition reaction.
The microstructures observed by SEM at different magnifications of Mg + YSZ + Ni + graphene dehydrided at the 4th hydride formation–decomposition cycle are presented in Figure 8. The sample did not have a homogeneous particle size. The particle sizes of this sample were similar to, but very slightly larger than, those of the sample after grinding in hydrogen atmosphere (Figure 2). Maintenance at a relatively high temperature (593 K) during hydride formation–decomposition cycling is thought to have caused the sintering of particles and led to the very slight increase in the particle sizes.
The XRD pattern of Mg + YSZ + Ni + graphene dehydrided at the 4th hydride formation–decomposition cycle at 593 K is shown in Figure 9. The sample had a large quantity of Mg and small quantities of MgO and β-MgH2. Very small amounts of C, Mg2Ni, and YSZ were also observed. The treatment of the sample in air for XRD pattern obtainment is believed to have led to the adsorption of oxygen on the particle surfaces, which are very reactive. This adsorbed oxygen is thought to have reacted with Mg to form MgO. Graphene was changed to carbon after hydride formation–decomposition cycling. Mg2Ni is thought to have been formed by the reaction of Mg with Ni. The γ-MgH2, which was observed after grinding under hydrogen atmosphere, is believed to have been transformed to β-MgH2 during hydride formation–decomposition cycling. The peaks in the XRD pattern were sharp, and the background of the XRD pattern was very high, showing that the crystallinity of the sample was good. The sample, which was quite noncrystalline after grinding in hydrogen atmosphere, became crystalline.
Mg had large particles that were smooth with a few cracks [31]. Figure 4 and Figure 5 show that Mg + YSZ + Ni + graphene after grinding in hydrogen atmosphere had fine particles and defects. Figure 4 shows that graphene after grinding in hydrogen atmosphere was partly broken. The grinding in hydrogen atmosphere of Mg with graphene, Ni, and YSZ is thought to have pulverized graphene, Ni, and YSZ. The grinding in hydrogen atmosphere of Mg with graphene, Ni, and YSZ is also believed to have produced imperfections on the particle surfaces and inside the particles, exposed the clean surfaces of Mg particles, and made the Mg particles smaller. These effects make easy the nucleation of hydrides for hydride formation reaction and the nucleation of solid solutions of hydrogen with Mg and Mg2Ni for hydride decomposition reaction, make Mg particles highly reactive, and reduce the distance of hydrogen atom diffusion in Mg particles.
As mentioned above, since oxides are brittle, they can be easily crushed during grinding in mills. The added YSZ and/or their particles crushed during grinding can assist the particles of magnesium and magnesium hydride (MgH2) to become smaller. The addition of YSZ is thus deemed to have increased the initial hydride formation and decomposition rates, Ha (60 min), and Hd (60 min).
Since the thermal conductivity of graphene is relatively high and the specific surface area of graphene is large (2630 m2/g) [25], the addition of graphene can make heat to be rapidly transferred and dispersed and the particles to be well separated and isolated. The addition of graphene is thus believed to have increased the initial hydride formation and decomposition rates, Ha (60 min), and Hd (60 min).
Mg2Ni is reported to absorb hydrogen more rapidly than Mg, and the hydride of Mg2Ni, Mg2NiH4, is reported to release hydrogen more rapidly than MgH2 [6]. It is thought that the formed Mg2Ni contributed to increasing the hydride formation rate of Mg + YSZ + Ni + graphene. At 573 K in 1.0 bar H2, the driving forces for the hydride decomposition reaction of Mg and Mg2Ni, which are related to the gap between the equilibrium plateau pressures and the applied hydrogen pressure (1.0 bar H2 in this work), are 1.56 bar and 3.14 bar, respectively [32,33]. The rapid nucleation of the Mg2Ni-H solid solution in Mg + YSZ + Ni + graphene due to the relatively large driving force is believed to have led to the high initial hydride decomposition rate of Mg + YSZ + Ni + graphene.
The Ha vs. t curves at 573 K in 12 bar H2 for Mg, Mg + graphene, a sample with a composition of 95 wt% Mg + 2.5 wt% Ni + 2.5 wt% graphene (designated as Mg + Ni + graphene), and Mg + YSZ + Ni + graphene at n = 1 are shown in Figure 10. Mg and Mg + Ni + graphene samples were also made in a way similar to Mg + YSZ + Ni + graphene. Mg did not absorb hydrogen. Mg + graphene, Mg + Ni + graphene, and Mg + YSZ + Ni + graphene had much higher initial hydride formation rates and much larger Ha (60 min) than Mg, indicating that the addition of YSZ, Ni, and/or graphene considerably increased the initial hydride formation rate and Ha (60 min) of Mg. The initial hydride formation rate of Mg + YSZ + Ni + graphene was very slightly higher than that of Mg + Ni + graphene, and the Ha (60 min) was very slightly larger than that of Mg + Ni + graphene. The Ha vs. t curves of Mg + YSZ + Ni + graphene and Mg + Ni + graphene were very similar. The initial hydride formation rates of Mg + YSZ + Ni + graphene and Mg + Ni + graphene were considerably higher than that of Mg + graphene. The Ha (60 min) of Mg + YSZ + Ni + graphene and Mg + Ni + graphene were considerably larger than that of Mg + graphene. These results proved that the addition of Ni and/or YSZ to Mg + graphene considerably increased the initial hydride formation rate and Ha (60 min) of Mg + graphene.
Figure 11 shows the Hd vs. t curves at 573 K in 1.0 bar H2 for Mg, Mg + graphene, Mg + Ni + graphene, and Mg + YSZ + Ni + graphene at n = 1. Mg did not release hydrogen. Mg + graphene had a slightly higher initial hydride decomposition rate and a slightly larger Ha (60 min) than Mg, showing that the addition of graphene slightly increased the initial hydride decomposition rate and Hd (60 min) of Mg. The initial hydride decomposition rate of Mg + graphene was low, and the Hd (60 min) of Mg + graphene was small. The initial hydride decomposition rate of Mg + YSZ + Ni + graphene was higher than that of Mg + Ni + graphene, and the Hd (60 min) of Mg + YSZ + Ni + graphene was larger than that of Mg + Ni + graphene. The initial hydride decomposition rates of Mg + YSZ + Ni + graphene and Mg + Ni + graphene were considerably higher than that of Mg + graphene. The Hd (60 min) of Mg + YSZ + Ni + graphene and Mg + Ni + graphene were considerably larger than that of Mg + graphene. These results show that the addition of Ni to Mg + graphene considerably increased the initial hydride decomposition rate and Hd (60 min) of Mg + graphene, and the addition of YSZ to Mg + Ni + graphene considerably increased the initial hydride decomposition rate and Hd (60 min) of Mg + Ni + graphene.
The microstructures observed by SEM of Mg + graphene, Mg + Ni + graphene, and Mg + YSZ + Ni + graphene after grinding in hydrogen atmosphere are exhibited in Figure 12. Mg + graphene had relatively large particles, and the particles of Mg + graphene had smooth surfaces with some cracks. The particle sizes of Mg + Ni + graphene and Mg + YSZ + Ni + graphene were not homogeneous, and their large particles had small particles on their surfaces. Mg + YSZ + Ni + graphene had the smallest particles, followed by Mg + Ni + graphene and Mg + graphene in increasing order.
The addition of Ni and Ni + YSZ greatly increased the initial hydride formation rate and Ha (60 min) of Mg + graphene (Figure 10). The addition of Ni and Ni + YSZ greatly increased the initial hydride decomposition rate and Hd (60 min) of Mg + graphene (Figure 11).
The rapid nucleation of the Mg2Ni-H solid solution in Mg + Ni + graphene and Mg + YSZ + Ni + graphene due to the large driving force is believed to have led to higher initial hydride decomposition rates of Mg + Ni + graphene and Mg + YSZ + Ni + graphene than those of Mg + graphene and Mg. The addition of YSZ also elevated the initial hydride decomposition rate and Hd (60 min) compared to Mg + Ni + graphene.
Mg + YSZ + Ni + graphene had the smallest particles, followed by Mg + Ni + graphene, Mg + graphene, and Mg in increasing order (Figure 12). The order of particle size agreed well with those of the initial hydride decomposition rate and Hd (60 min): Mg + YSZ + Ni + graphene had the highest initial hydride decomposition rate and the largest Hd (60 min), followed by Mg + Ni + graphene, Mg + graphene, and Mg in decreasing order.
The order of particle size also agreed well with those of the initial hydride formation rate and Ha (60 min): Mg + YSZ + Ni + graphene had the highest initial hydride formation rate and the largest Ha (60 min), followed by Mg + Ni + graphene, Mg + graphene, and Mg in decreasing order. The initial hydride formation rates and Ha (60 min) of Mg + YSZ + Ni + graphene and Mg + Ni + graphene were very similar. It is believed that in 12 bar H2 which exerts a large driving force for hydride formation reaction at 573 K, Mg + YSZ + Ni + graphene and Mg + Ni + graphene had high nucleation rates, which led to similar high initial hydride formation rates and similar large Ha (60 min) values.
Mg + YSZ + Ni + graphene had a high, efficient hydrogen storage capacity over 7 wt% (7.11 wt%) at n = 1. At n = 1 and after activation (n = 3), Mg + YSZ + Ni + graphene had relatively high initial hydride formation and decomposition rates. At 573 K and n = 3, Mg + YSZ + Ni + graphene had an initial hydride formation rate of 1.76 wt% H/min in 12 bar H2 and an initial hydride decomposition rate of 0.22 wt% H/min in 1.0 bar H2. Figure 6 shows that, however, Mg + YSZ + Ni + graphene had a relatively poor cycling performance. A study on the improvement of the cycling performance of Mg + YSZ + Ni + graphene will be done in the future.
4. Conclusions
Samples with a composition of 92.5 wt% Mg + 2.5 wt% YSZ + 2.5 wt% Ni + 2.5 wt% graphene (designated as Mg + YSZ + Ni + graphene) were prepared by grinding in hydrogen atmosphere. Mg + YSZ + Ni + graphene was activated completely at n = 3. Mg + YSZ + Ni + graphene had an efficient hydrogen storage capacity (the quantity of hydrogen absorbed for 60 min) over 7 wt% (7.11 wt%) at n = 1. The sample absorbed 5.89 wt% H for 10 min and 6.12 wt% H for 60 min in 12 bar H2 and released 1.99 wt% H for 10 min and 4.74 wt% H for 60 min in 1.0 bar H2, at 573 K and n = 3. Mg + YSZ + Ni + graphene contained Mg2Ni phase after hydride formation–decomposition cycling. The additions of Ni and Ni + YSZ greatly increased the initial hydride formation and decomposition rates, Ha (60 min), and Hd (60 min) of Mg + graphene. The rapid nucleation of the Mg2Ni-H solid solution in Mg + Ni + graphene and Mg + YSZ + Ni + graphene due to the large driving force is believed to have led to the higher initial hydride decomposition rates of Mg + Ni + graphene and Mg + YSZ + Ni + graphene than those of Mg + graphene and Mg. The addition of YSZ also increased the initial hydride decomposition rate and Hd (60 min), compared with those of Mg + Ni + graphene. The increasing order of particle sizes agreed well with the decreasing order of the initial hydride formation and decomposition rates, Ha (60 min), and Hd (60 min) of the samples: Mg + YSZ + Ni + graphene, Mg + Ni + graphene, Mg + graphene, and Mg.
Author Contributions
M.Y.S. conceived and designed the experiments, analyzed the data, and wrote the paper. E.C. and Y.J.K. performed the experiments and analyzed the data.
Funding
This research was funded by the Ministry of Education for Republic of Korea (grant number NRF-2017R1D1A1B03030515). The APC was funded by Jeonbuk National University.
Acknowledgments
This research was supported by the Basic Science Research Program through the National Research Foundation of Korea (NRF) funded by the Ministry of Education (grant number NRF-2017R1D1A1B03030515).
Conflicts of Interest
The authors declare no conflicts of interest.
References
- Stampfer, J.F., Jr.; Holley, C.E., Jr.; Suttle, J.F. The magnesium-hydrogen System. J. Am. Chem. Soc. 1960, 82, 3504–3508. [Google Scholar] [CrossRef] [Green Version]
- Song, M.Y.; Kwak, Y.J.; Lee, S.H.; Park, H.R. Formation of a high pressure form of magnesium hydride γ-MgH2 by mechanical grinding under low hydrogen pressure. Korean J. Met. Mater. 2013, 51, 119–123. [Google Scholar] [CrossRef]
- Hong, S.-H.; Kwak, Y.J.; Song, M.Y. Enhancement of the hydrogen-storage characteristics of Mg by adding Mg2Ni and Ni to MgH2 via high energy ball milling in hydrogen atmosphere. Korean J. Met. Mater. 2018, 56, 59–65. [Google Scholar]
- Hong, S.-H.; Song, M.Y. Hydrogen absorption and release properties of MgH2, Mg2Ni, and Ni-added Mg via reactive mechanical grinding. Korean J. Met. Mater. 2018, 56, 141–148. [Google Scholar]
- Hong, S.-H.; Kwon, S.N.; Song, M.Y. Characteristics of melt spun Mg-23.5Ni-xCu alloys and Mg-23.5Ni-2.5Cu alloy mixed with Nb2O5 and NbF5. Korean J. Met. Mater. 2011, 49, 298–303. [Google Scholar]
- Reilly, J.J.; Wiswall, R.H., Jr. The reaction of hydrogen with alloys of magnesium and nickel and the formation of Mg2NiH4. Inorg. Chem. 1968, 7, 2254–2256. [Google Scholar] [CrossRef]
- Kwak, Y.J.; Park, H.R.; Song, M.Y. Advancement in the hydrogen absorbing and releasing kinetics of MgH2 by mixing with small percentages of Zn(BH4)2 and Ni. Met. Mater. Int. 2018, 22, 423–432. [Google Scholar] [CrossRef]
- Boulet, J.M.; Gerard, N. The mechanism and kinetics of hydride formation in Mg-10 wt% Ni and CeMg12. J. Less-Common Met. 1983, 89, 151–161. [Google Scholar] [CrossRef]
- Oelerich, W.; Klassen, T.; Bormann, R. Comparison of the catalytic effects of V, V2O5, VN, and VC on the hydrogen sorption of nanocrystalline Mg. J. Alloy. Compd. 2001, 322, L5–L9. [Google Scholar] [CrossRef]
- Dehouche, Z.; Klassen, T.; Oelerich, W.; Goyette, J.; Bose, T.K.; Schulz, R. Cycling and thermal stability of nanostructured MgH2–Cr2O3 composite for hydrogen storage. J. Alloy. Compd. 2002, 347, 319–323. [Google Scholar] [CrossRef]
- Barkhordarian, G.; Klassen, T.; Bormann, R. Fast hydrogen sorption kinetics of nanocrystalline Mg using Nb2O5 as catalyst. Scr. Mater. 2003, 49, 213–217. [Google Scholar] [CrossRef]
- Barkhordarian, G.; Klassen, T.; Bormann, R. Kinetic investigation of the effect of milling time on the hydrogen sorption reaction of magnesium catalyzed with different Nb2O5 contents. J. Alloy. Compd. 2006, 407, 249–255. [Google Scholar] [CrossRef]
- Friedrichs, O.; Klassen, T.; Sánchez-López, J.C.; Bormann, R.; Fernández, A. Hydrogen sorption improvement of nanocrystalline MgH2 by Nb2O5 nanoparticles. Scr. Mater. 2006, 54, 1293–1297. [Google Scholar] [CrossRef]
- Friedrichs, O.; Aguey-Zinsou, F.; Ares Fernández, J.R.; Sánchez-López, J.C.; Justo, A.; Klassen, T.; Bormann, R.; Fernández, A. MgH2 with Nb2O5 as additive, for hydrogen storage: Chemical, structural and kinetic behavior with heating. Acta Mater. 2006, 54, 105–110. [Google Scholar] [CrossRef]
- Aguey-Zinsou, K.F.; Ares Fernández, J.R.; Klassen, T.; Bormann, R. Using MgO to improve the (de)hydriding properties of magnesium. Mater. Res. Bull. 2006, 41, 1118–1126. [Google Scholar] [CrossRef]
- Song, M.Y.; Bobet, J.-L.; Darriet, B. Improvement in Hydrogen Sorption Properties of Mg by Reactive Mechanical Grinding with Cr2O3, Al2O3 and CeO2. J. Alloy. Compd. 2002, 340, 256–262. [Google Scholar] [CrossRef]
- Long, S.; Zou, J.; Liu, Y.; Zeng, X.; Ding, W. Hydrogen storage properties of a Mg–Ce oxide nano-composite prepared through arc plasma method. J. Alloy. Compd. 2013, 580, S167–S170. [Google Scholar] [CrossRef]
- Long, S.; Zou, J.; Chen, X.; Zeng, X.; Ding, W. A comparison study of Mg–Y2O3 and Mg–Y hydrogen storage composite powders prepared through arc plasma method. J. Alloy. Compd. 2014, 615, S684–S688. [Google Scholar] [CrossRef]
- Available online: https://en.wikipedia.org/wiki/Yttria-stabilized_zirconia (accessed on 3 March 2019).
- Song, M.Y.; Pezat, M.; Darriet, B.; Hagenmuller, P. Hydriding mechanism of Mg2Ni in the presence of oxygen impurity in H2. J. Mater. Sci. 1985, 20, 2958–2964. [Google Scholar] [CrossRef]
- Hong, S.-H.; Song, M.Y. MgH2 and Ni-coated carbon-added Mg hydrogen-storage alloy prepared by mechanical alloying. Korean J. Met. Mater. 2016, 54, 125–131. [Google Scholar]
- Song, M.Y.; Kwak, Y.J.; Lee, S.H.; Park, H.R. Enhancement of hydrogen storage characteristics of Mg by addition of nickel and niobium (V) fluoride via mechanical alloying. Korean J. Met. Mater. 2016, 54, 210–216. [Google Scholar] [CrossRef]
- Song, M.Y.; Kwak, Y.J.; Park, H.R. Hydrogen Storage Characteristics of Metal Hydro-Borate and Transition Element-Added Magnesium Hydride. Korean J. Met. Mater. 2016, 54, 503–509. [Google Scholar] [CrossRef]
- Kwon, S.N.; Park, H.R.; Song, M.Y. Hydrogen storage and release properties of transition metal-added magnesium hydride alloy fabricated by grinding in a hydrogen atmosphere. Korean J. Met. Mater. 2016, 54, 510–519. [Google Scholar]
- Available online: https://en.wikipedia.org/wiki/Graphene (accessed on 4 October 2019).
- Song, M.Y.; Baek, S.H.; Bobet, J.-L.; Hong, S.H. Hydrogen storage properties of a Mg-Ni-Fe mixture prepared via planetary ball milling in a H2 atmosphere. Int. J. Hydrogen Energy 2010, 35, 10366–10372. [Google Scholar] [CrossRef]
- Ferrari, A.C.; Meyer, J.C.; Scardaci, V.; Casiraghi, C.; Lazzeri, M.; Mauri, F.; Piscanec, S.; Jiang, D.; Novoselov, K.S.; Roth, S.; et al. Raman spectrum of graphene and graphene layers. Phys. Rev. Lett. 2006, 97, 187401. [Google Scholar] [CrossRef] [PubMed] [Green Version]
- Available online: https://www.nanophoton.net/applications/22.html (accessed on 15 October 2019).
- Available online: https://tools.thermofisher.com/content/sfs/brochures/D19505~.pdf (accessed on 15 October 2019).
- Majid, S.R. Green synthesis of in situ electrodeposited rGO/MnO2 nanocomposite for high energy density supercapacitors. Sci. Rep. 2015, 5, 16195. [Google Scholar]
- Song, M.Y.; Kwak, Y.J.; Lee, S.H.; Park, H.R. Comparison of hydrogen storage properties of pure Mg and milled pure Mg. Bull. Mater. Sci. 2014, 37, 831–835. [Google Scholar] [CrossRef] [Green Version]
- Song, M.Y.; Kwak, Y.J. Comparison of the hydrogen release properties of Zn(BH4)2-added MgH2 alloy and Zn(BH4)2 and Ni-added MgH2 alloy. Korean J. Met. Mater. 2018, 56, 244–251. [Google Scholar]
- Song, M.Y.; Park, H.R. Pressure-composition isotherms in Mg2Ni-H2 system. J. Alloy. Compd. 1998, 270, 164–167. [Google Scholar] [CrossRef]
Figure 1.
Microstructures of YSZ observed by SEM at (a) low magnification and (b) high magnification.
Figure 1.
Microstructures of YSZ observed by SEM at (a) low magnification and (b) high magnification.

Figure 2.
SEM micrographs at (a) low magnification and (b) high magnification of Mg + YSZ + Ni + graphene after grinding in hydrogen atmosphere.
Figure 2.
SEM micrographs at (a) low magnification and (b) high magnification of Mg + YSZ + Ni + graphene after grinding in hydrogen atmosphere.

Figure 3.
XRD pattern of Mg + YSZ + Ni + graphene after grinding in hydrogen atmosphere.

Figure 4.
(a) TEM image of the as-prepared Mg + graphene and Raman spectra of (b) graphene and the as-prepared Mg + graphene (c).
Figure 4.
(a) TEM image of the as-prepared Mg + graphene and Raman spectra of (b) graphene and the as-prepared Mg + graphene (c).


Figure 5.
TEM micrographs at various magnifications (a–c) and a selected area electron diffraction (SAED) pattern (d) of Mg + YSZ + Ni + graphene after grinding in hydrogen atmosphere.
Figure 5.
TEM micrographs at various magnifications (a–c) and a selected area electron diffraction (SAED) pattern (d) of Mg + YSZ + Ni + graphene after grinding in hydrogen atmosphere.


Figure 6.
Changes in (a) Ha vs. time t curve in 12 bar H2 and (b) Hd vs. t curve in 1.0 bar H2 at 573 K, with the number of cycles, n, for Mg + YSZ + Ni + graphene.
Figure 6.
Changes in (a) Ha vs. time t curve in 12 bar H2 and (b) Hd vs. t curve in 1.0 bar H2 at 573 K, with the number of cycles, n, for Mg + YSZ + Ni + graphene.

Figure 7.
Variations in (a) the Ha vs. t curve in 12 bar H2 and (b) the Hd vs. t curve in 1.0 bar H2 at n = 1, with temperature (573 K, 593 K, and 623 K), for Mg + YSZ + Ni + graphene.
Figure 7.
Variations in (a) the Ha vs. t curve in 12 bar H2 and (b) the Hd vs. t curve in 1.0 bar H2 at n = 1, with temperature (573 K, 593 K, and 623 K), for Mg + YSZ + Ni + graphene.

Figure 8.
Microstructures observed by SEM at (a) low magnification and (b) high magnification of Mg + YSZ + Ni + graphene dehydrided at the 4th hydride formation–decomposition cycle at 593 K.
Figure 8.
Microstructures observed by SEM at (a) low magnification and (b) high magnification of Mg + YSZ + Ni + graphene dehydrided at the 4th hydride formation–decomposition cycle at 593 K.

Figure 9.
XRD pattern of Mg + YSZ + Ni + graphene dehydrided at the 4th hydride formation–decomposition cycle.
Figure 9.
XRD pattern of Mg + YSZ + Ni + graphene dehydrided at the 4th hydride formation–decomposition cycle.

Figure 10.
Ha vs. t curves at 573 K in 12 bar H2 for Mg, Mg + graphene, Mg + Ni + graphene, and Mg + YSZ + Ni + graphene at n = 1.
Figure 10.
Ha vs. t curves at 573 K in 12 bar H2 for Mg, Mg + graphene, Mg + Ni + graphene, and Mg + YSZ + Ni + graphene at n = 1.

Figure 11.
Hd vs. t curves at 573 K in 1.0 bar H2 for Mg, Mg + graphene, Mg + Ni + graphene, and Mg + YSZ + Ni + graphene at n = 1.
Figure 11.
Hd vs. t curves at 573 K in 1.0 bar H2 for Mg, Mg + graphene, Mg + Ni + graphene, and Mg + YSZ + Ni + graphene at n = 1.

Figure 12.
Microstructures observed by SEM of (a) Mg + graphene, (b) Mg + Ni + graphene, and (c) Mg + YSZ + Ni + graphene after grinding in hydrogen atmosphere.
Figure 12.
Microstructures observed by SEM of (a) Mg + graphene, (b) Mg + Ni + graphene, and (c) Mg + YSZ + Ni + graphene after grinding in hydrogen atmosphere.


Table 1.
Variations in Ha (wt% H) with time t at 573 K in 12 bar H2 at n = 1–4 for Mg + YSZ + Ni + graphene.
Table 1.
Variations in Ha (wt% H) with time t at 573 K in 12 bar H2 at n = 1–4 for Mg + YSZ + Ni + graphene.
| n | 2.5 min | 5 min | 10 min | 30 min | 60 min |
|---|---|---|---|---|---|
| n = 1 | 4.32 | 5.44 | 6.46 | 6.97 | 7.11 |
| n = 2 | 4.29 | 5.31 | 6.20 | 6.43 | 6.62 |
| n = 3 | 4.39 | 5.42 | 5.89 | 6.07 | 6.12 |
| n = 4 | 4.48 | 5.27 | 5.55 | 5.69 | 5.74 |
Table 2.
Variations in Hd (wt% H) with t at 573 K in 1.0 bar H2 at n = 1–4 for Mg + YSZ + Ni + graphene.
Table 2.
Variations in Hd (wt% H) with t at 573 K in 1.0 bar H2 at n = 1–4 for Mg + YSZ + Ni + graphene.
| n | 2.5 min | 5 min | 10 min | 30 min | 60 min |
|---|---|---|---|---|---|
| n = 1 | 0.44 | 0.86 | 1.65 | 4.02 | 5.02 |
| n = 2 | 0.49 | 0.96 | 1.89 | 4.39 | 4.99 |
| n = 3 | 0.54 | 1.03 | 1.99 | 4.32 | 4.74 |
| n = 4 | 0.49 | 0.91 | 1.77 | 3.73 | 4.27 |
© 2019 by the authors. Licensee MDPI, Basel, Switzerland. This article is an open access article distributed under the terms and conditions of the Creative Commons Attribution (CC BY) license (http://creativecommons.org/licenses/by/4.0/).
Share and Cite
MDPI and ACS Style
Song, M.Y.; Choi, E.; Kwak, Y.J. Nickel, Graphene, and Yttria-Stabilized Zirconia (YSZ)-Added Mg by Grinding in Hydrogen Atmosphere for Hydrogen Storage. Metals 2019, 9, 1347. https://doi.org/10.3390/met9121347
AMA Style
Song MY, Choi E, Kwak YJ. Nickel, Graphene, and Yttria-Stabilized Zirconia (YSZ)-Added Mg by Grinding in Hydrogen Atmosphere for Hydrogen Storage. Metals. 2019; 9(12):1347. https://doi.org/10.3390/met9121347
Chicago/Turabian StyleSong, Myoung Youp, Eunho Choi, and Young Jun Kwak. 2019. "Nickel, Graphene, and Yttria-Stabilized Zirconia (YSZ)-Added Mg by Grinding in Hydrogen Atmosphere for Hydrogen Storage" Metals 9, no. 12: 1347. https://doi.org/10.3390/met9121347
Note that from the first issue of 2016, this journal uses article numbers instead of page numbers. See further details here.