Thermal Fatigue Characteristics of Type 309 Austenitic Stainless Steel for Automotive Manifolds


1
Materials Genome Institute, Shanghai University, Shanghai 200444, China
2
Institute of Materials, School of Materials Science and Engineering, Shanghai University, Shanghai 200072, China
3
Research Institute, Baoshan Iron & Steel Co., Ltd., Shanghai 200431, China
*
Author to whom correspondence should be addressed.
Metals 2019, 9(2), 129; https://doi.org/10.3390/met9020129
Submission received: 24 December 2018
/
Revised: 22 January 2019
/
Accepted: 23 January 2019
/
Published: 26 January 2019
Abstract
:The thermal fatigue behavior of type 309 austenitic stainless steel was investigated by cyclic tests ranged from 100 °C to the maximum temperatures 800 and 900 °C. The microstructures of the specimens were characterized by optical microscope, scanning electron microscope and X-ray diffraction. With changing the maximum temperature from 800 to 900 °C, the stainless steel exhibits much lower strength, higher elongation and a decrease of fatigue life about 56.6%. After the thermal fatigue failure, the specimens show micro-void coalescence fractures caused by the creep during the holding period at the maximum temperatures, and the quasi-cleavage feature also appears in the case of the maximum temperature 800 °C. During the thermal fatigue processes, the cavities usually form at the grain and twin boundaries, facilitating the initiation and growth of cracks. Furthermore, the high-temperature oxidation produces oxides on the specimen surfaces and in the cracks, deteriorating thermal fatigue properties. With an increase in the maximum temperature, the enhanced synergetic effect of strength, grain size, creep and oxidation is responsible for the accelerated fatigue failure of 309 stainless steel during the thermal cycles.
1. Introduction
To reduce the impact of exhaust emissions on the environment, the thermal efficiency of fuel oil in automotive engines needs to be greatly improved through increasing the combustion temperature over 1000 °C [1]. Obviously, there will be a deteriorative thermal effect on the service life of the exhaust components, such as manifolds [2,3]. In recent years, stainless steels (SSs) have been widely adopted in automobile exhaust systems to meet the requirement extended life. For example, exhaust manifolds are usually manufactured with austenitic SSs (e.g., AISI 304 and 309) and ferritic SSs (e.g., AISI 441 and 444) [4]. In recent years, austenitic SSs have been used for various engineering components in automobile industries because of their high strength, corrosion resistance, and ductility.
During a thermal fatigue test, the deformation and failure mechanisms are very complicated for exhaust components exposed to high temperatures. The primary failure mechanisms of metals are originated from fatigue, environmental, and creep damages [5]. These damages may act alone or synergistically on the basis of operating conditions, such as temperature interval, strain rate, and strain range. In the absence of a significant hold time, crack initiation and growth are fatigue dominated, but the creep damage was dominated at longer holding times. Dewa and Su [6,7] noticed that the creep-fatigue life in base metal was continually decreased by increasing the holding time. Holdsworth [8] found that the creep ductility is influential in determining the extent of creep-fatigue interaction. Liu et al. proposed an explicit model [9] and a unified equation about creep-fatigue [10]. Furthermore, Sarkar et al. [11] found that increasing average stress leads to the change of creep fracture mode from fatigue failure to creep failure. Kang et al. [12] noticed that the dislocation configurations evolve from low energy dislocation lines to high energy dislocation tangle and dislocation cells during the creep process. Otherwise, the intensified stress amplitude and reduced strain rates enhance fatigue damage [13,14]. In addition, the role of environmental degradation is important in the thermal fatigue of a component. Oxide cracking can result in crack initiation and shortens the fatigue life of alloys at elevated temperatures [15]. There are two important mechanisms for the high-temperature oxidation to enhance the crack propagation, i.e., the stress assisted grain boundary oxidation [16] and the dynamic embrittlement [17].
Nowadays type 309 austenitic SS is used for manifolds, but there is limited information on its thermal fatigue characteristics at high service temperatures. Laurent et al. [18] found that austenitic SSs reached higher strengths and resistance to creep at high temperature than ferritic grade. Wei et al. [19] found that the thermal fatigue of 309 SS is slightly higher than that of 321 SS but far lower than that 441 SS. In this work, the thermal fatigue behavior was studied with cyclic tests at different temperatures. The effect of creep and oxidation was observed on crack initiation and propagation. The purposes are to understand the role of the maximum service temperature in the thermal fatigue performance of the 309 SS and provide fundamental information for the application of SSs in automotive manifolds.
2. Materials and Methods
A commercial type 309 austenitic stainless steel plate with a thickness of 2 mm was used as the experimental material. Its chemical composition is given in Table 1. Specimens with the geometry in Figure 1a are machined from the as-received steel plates according to the standard [20]. Before the experiment, the surface was polished with 2000 grit emery papers and cleaned by distilled water and ethanol.
The thermal fatigue test is carried out on the device as shown in Figure 1b according to the literature [21]. The device uses a DC power supply to heat the specimen and a thermocouple to monitor the temperature in real time. The specimen is clamped at both ends with a restraint ratio of 1. This test exerts a thermal cycle on the specimen through alternate resistance heating and forced air-cooling. The typical cycle is composed of 1 min-heating from the minimum temperature (Tmin) 100 °C to the maximum temperature (Tmax) 800 or 900 °C, 1 min-holding at Tmax and then 1 min-cooling from Tmax to Tmin. The temperature differences (ΔT) are 700 and 800 °C, respectively, as measured in Figure 2. Before the fracture failure, the number of cycles is recorded as the thermal fatigue life during the test. The average value of thermal fatigue life for specimens was obtained from three parallel tests with the standard deviation less than 10%. It is apparent that this test simply simulates the conditions of the thermal fatigue process of exhaust manifolds and may rapidly evaluate the failure performance.
The high-temperature tensile test is carried out according to EN ISO 6892-2 standard on an INSTRON 5982 machine (Instron Corporation, Canton, MA, USA) with a 1200 °C-resistance furnace. The tensile test is performed at a displacement rate of 1.5 mm·min−1.
After the cyclic test, the fracture surface and crack morphology of specimens were observed with a scanning electron microscope (SEM, Carl Zeiss Microscopy GmbH, Göttingen, Germany). The surface oxide film was analyzed with X-ray diffraction (XRD, 18 kWD/MAX2500V, Rigaku Corporation, Tokyo, Japan). The microstructures in the vicinity of the fracture surface were observed on an optical microscope (OM, VHX-100, Keyence Co. Ltd., Osaka, Japan) after etching in aqua regia.
3. Results
3.1. High Temperature Strength and Thermal Fatigue Properties
Figure 3 shows the stress–strain curves obtained at different temperatures for 309 SS. It can be obtained that, as the temperature increases from 25 to 800 and 900 °C, the yield strength changes noticeably from 353 to 146 and 109 MPa, and the tensile strength also changes markedly from 617 to 204 and 127 MPa, respectively. The total elongation increases slightly from 43.2% to 55.1% and 59.3%. So Tmax changes from 800 to 900 °C, the high-temperature yield strength and tensile strength of 309 SS decrease greatly, with the reduction of about 37.7% and 25.3%, respectively. It is clear that, under higher temperature conditions, both 309 SS shows much lower yield and tensile strengths and a slightly larger elongation. Moreover, 309 SS is softened significantly at the high temperatures.
The thermal fatigue average lives obtained from the cyclic tests are approximately 345 ± 9 and 150 ± 8 cycles for 309 SS under Tmax conditions of 800 and 900 °C, respectively. The thermal fatigue life decreases about 56.6% when Tmax changes from 800 to 900 °C. This is similar to the results obtained in the literature with the V-shaped specimens [18].
3.2. Microstructure Evolutions
Figure 4 shows the optical microstructures of 309 SS before and after the thermal fatigue tests. The observation was performed on the cross section with a distance of about 2 mm from the fracture surface. It is seen that the grain size and twins of specimens have great changes during the thermal cycles. The grain size becomes larger, and the twins become thicker with an increase of Tmax from 800 to 900 °C. It is measured by the straight-line intersection method that the grain size values are about 24.3, 64.5, and 92.3 μm for the as-received steel and the failure specimens under Tmax equal to 800 and 900 °C conditions, respectively. The grains grow noticeably under the high-temperature conditions.
3.3. Fractographic Appearances
Figure 5 shows fractographic appearances of the failure specimens after the thermal fatigue tests with Tmax = 800 and 900 °C. There are obvious features from the plastic deformation occurred before fracture. Owing to the effect of high-temperature oxidation, an oxide layer is formed on the fracture surface. So it is difficult to observe the density of cracks, fatigue striations, and other related information on fracture surfaces. Some tearing dimples appear on the fracture surfaces which are covered by oxide layers. At Tmax = 800 °C, a few river patterns and tearing ridges appear in a few locations, which are characteristics of quasi-cleavage fracture. It can be inferred that the thermal fatigue failure of specimens involves both quasi-cleavage and micro-void coalescence mechanisms. At Tmax = 900 °C, the fatigue failure mainly shows micro-void coalescence feature on the fracture surface.
3.4. High Temperature Oxidation
To identify the crystalline phases, Figure 6 gives XRD patterns for the oxide layers on the specimen surfaces after the thermal fatigue tests with different Tmax values. The surface oxide layers mainly consist of Cr2O3, Fe2O3, and Mn1.5Cr1.5O4. As Tmax increases from 800 to 900 °C, the oxide peaks have stronger responses. This indicates that the oxide layer may become thicker after the thermal fatigue failure under Tmax = 900 °C condition.
Figure 7 shows SEM images of the specimen cross-sections after the thermal fatigue tests. The oxide layers formed during thermal fatigue are uneven and non-continuous, as observed in the literature [22]. These must result from the cyclic thermal stress and deformation in both the oxide layer and underlying steel. In the process of thermal fatigue test, both ends of the specimen are clamped. The compressive stress is produced in the heating stage due to the specimen expansion, whereas the tensile stress is produced in the cooling stage due to the shrinkage. A large change in the temperature must result in the high tension and compression stresses during thermal cycles. In the repeated tension–compression process, the specimen is prone to the mechanical deformation and ensued cyclic softening. These give rise to the formation of defective oxide layers with many cracks and pores, which poorly suppress the high-temperature oxidation processes [23]. Overall, the oxide layer for Tmax = 900 °C is thicker than that for 800 °C though the former experienced a shorter oxidation time, i.e., less thermal cycles. So the oxidation resistance of specimens changes markedly with Tmax in the thermal fatigue processes.
3.5. SEM Surface Morphologies
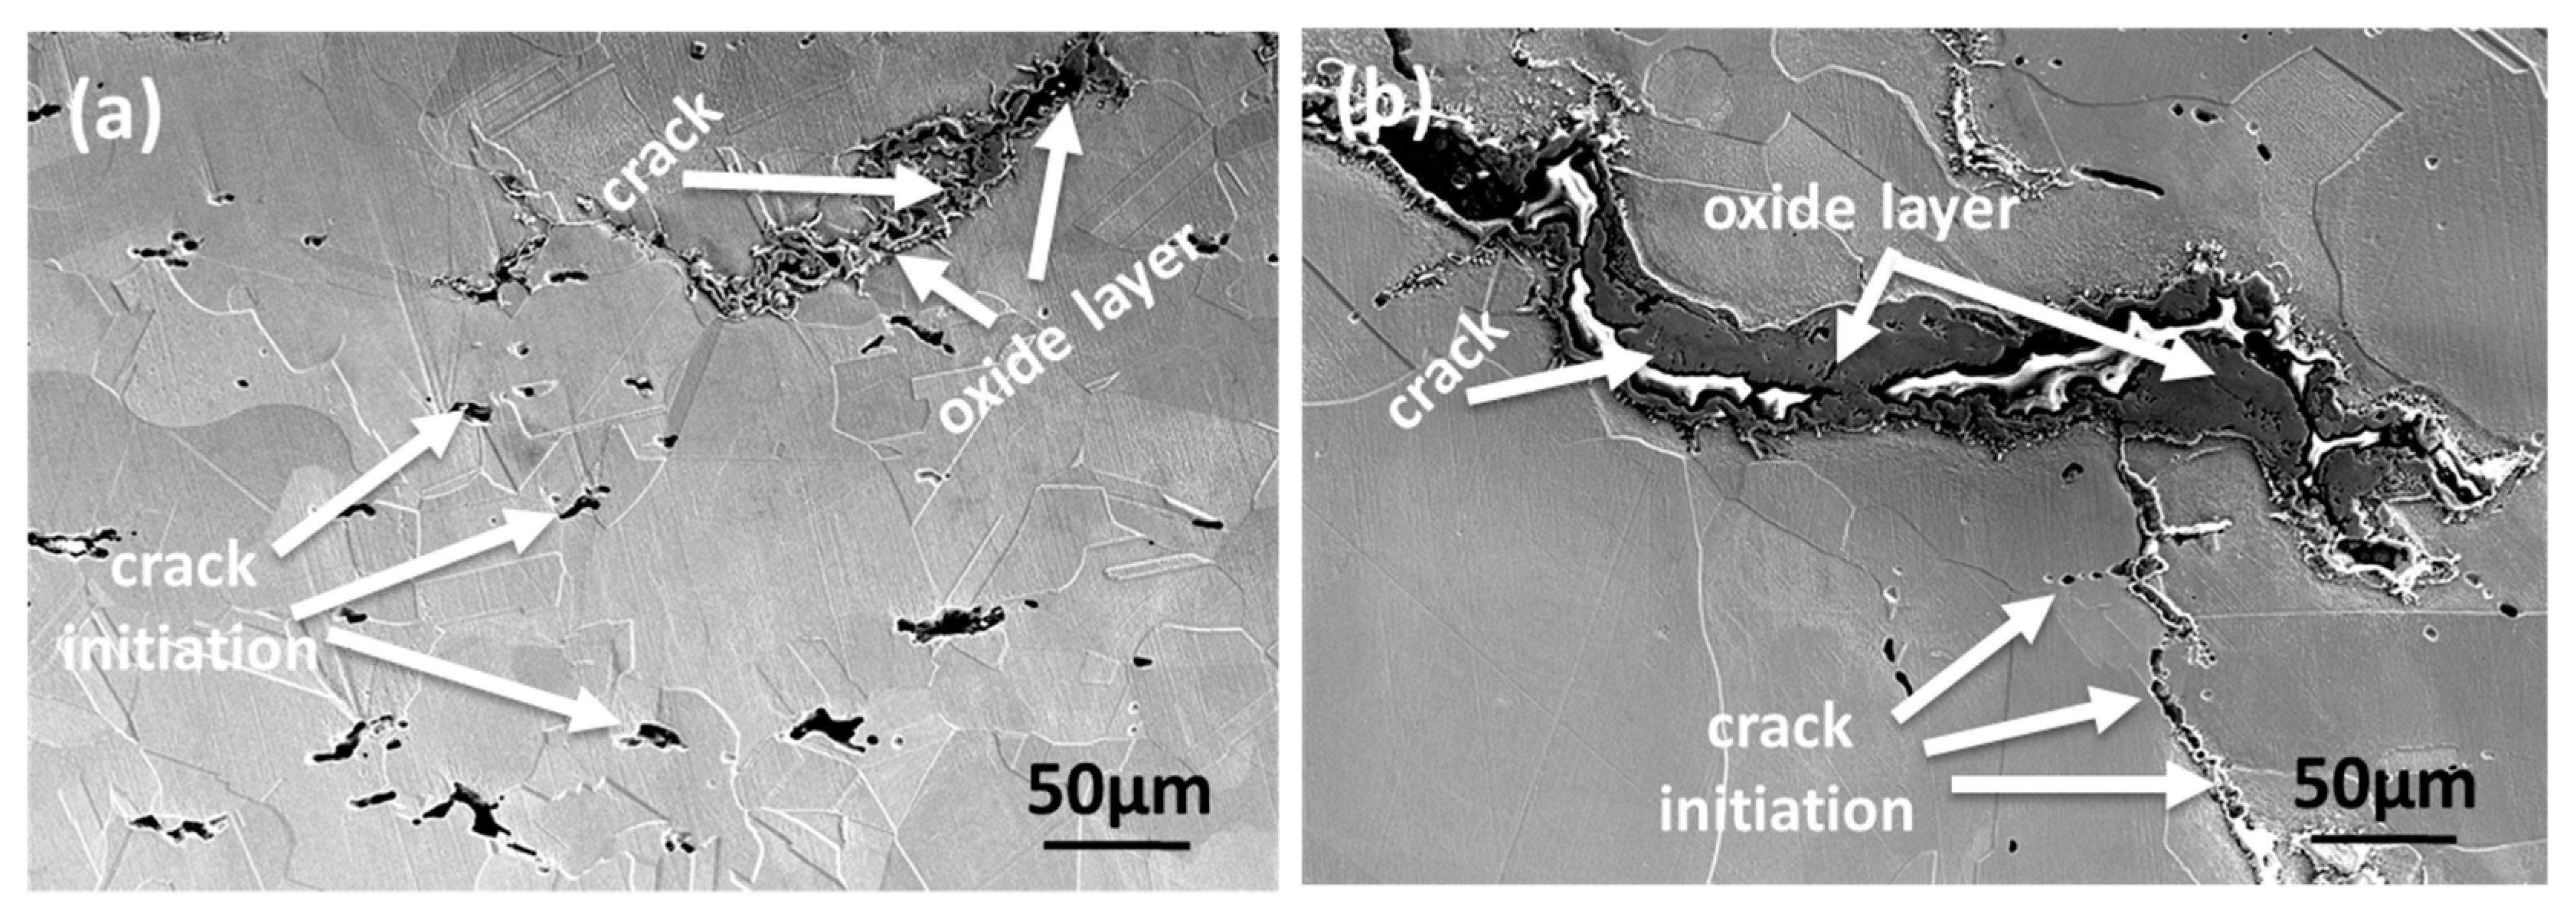
Figure 8 shows the surface morphologies of the specimens after the thermal fatigue failure under different Tmax conditions and etching in aqua regia. A large number of cavities can be found on the specimen surfaces as marked by white arrows. These cavities mainly distribute along the grain and twin boundaries. It is observed that the size and number of cavities decrease with increasing Tmax from 800 to 900 °C. It is clear that the cracks are uneven and show the intergranular growth feature. The cracks are filled with defective oxide layers. More oxides form in the cracks under higher Tmax condition.
4. Discussion
4.1. Crack Initiation and Propagation
According to the literature [23,24], creep deformation must occur with the dislocation pile-up and the ensuing stress concentration near the boundary regions in the cyclic Tmax-holding processes. In the thermal fatigue tests, the local stress concentration will gradually accumulate to promote the grain boundary sliding and the subsequent formation of cavities along the grain and twin boundaries in the failure specimens (Figure 8). It is apparent that the cracks mainly initiate from the cavities as the stress concentration values exceed the yield strengths of the boundaries. This is similar to the observation of the coarse-grained austenitic SSs [25].
As shown in Figure 8, the cracks will propagate along the boundary regions. The formation and coalescence of cavities must facilitate the crack propagation during the thermal fatigue processes. This is also confirmed by the appearance of many dimples on the fracture surfaces in Figure 5. At the same time, unlike Tmax = 900 °C, the fatigue failure under Tmax = 800 °C condition involves a quasi-cleavage process due to the relatively weaker cyclic softening.
In addition, the high-temperature oxidation produces some oxides in the fatigue cracks. The oxide layers are fragile and vulnerable to cracking by the thermal stress, especially around the fatigue crack tips. The cracks formed in the oxide layers can favor the growth of the fatigue cracks [26]. Meanwhile, these oxides are assumed to have a wedge effect on the crack propagation in the thermal cycles to a certain extent. It is clear that the high-temperature creep and oxidation act in a synergetic way to promote the propagation of the thermal fatigue cracks.
4.2. Effect of Tmax on the Thermal Fatigue Life
The change of Tmax from 800 to 900 °C results in a great decrease of about 56.6% of the thermal fatigue lives. Tmax plays a crucial role in the thermal fatigue failure of 309 SS. This may be related to the following features. First, the tensile strength reduces about 37.9% with the change of Tmax in Figure 3. At the same time, the grain size becomes larger in the thermal fatigue process with higher Tmax (Figure 4). According to the crack nucleation expansion model proposed by Smith [27], the grain size d is inversely proportional to the fracture strength of the material, as given below Equation (1):
where is the fracture strength, is the effective fracture surface energy, is Poisson’s ratio, E is elastic modulus, is the maximum orientation factor. It is apparent that the fracture strength of the specimens must decrease with the growth of grain size and the higher Tmax the lower . In addition, the thicker twins under Tmax = 900 °C conditions may also lead to lower tensile strength. Overall, the weakening strength of the specimens will deteriorate the thermal fatigue resistance [28].
Second, the value of temperature difference ΔT = Tmax − Tmin enlarges 100 °C for the cyclic tests under the two Tmax conditions. The larger ΔT must produce higher thermal stress inside the specimen in the cyclic process, which is favourable for the initiation and propagation of the fatigue cracks.
Third, the high-temperature oxidation and creep should be accelerated markedly with the increase of Tmax from 800 to 900 °C. In addition, it is difficult to form protective oxide layers on the surfaces of the specimen and cracks due to the occurrence of cyclic thermal stress and deformation. These may enhance the aforementioned oxide effect on the thermal fatigue process.
It is clear that the creep–fatigue–oxidation interactions must become stronger under higher Tmax condition. The synergetic effect of high-temperature strength, grain growth, creep deformation and oxidation is important for the fatigue failure of 309 SS during the thermal cycles.
5. Conclusions
Through the high temperature tensile and thermal fatigue tests of type 309 austenitic SS, the following conclusions can be drawn:
- (1)
- As Tmax changes from 800 to 900 °C, the high-temperature tensile strength and thermal fatigue life of 309 SS decrease greatly, with a reduction of about 37.7% and 56.6%, respectively.
- (2)
- After the thermal fatigue tests, the failure specimens show the micro-voids coalescence fracture caused by the creep in the Tmax-holding processes, and the quasi-cleavage feature appears as Tmax decreases from 900 to 800 °C.
- (3)
- The fatigue cracks mainly initiate and propagate along the grain boundary regions with the formation of cavities. The defective oxide layers formed in the cracks will facilitate the propagation during the thermal cycles.
- (4)
- With the increase of Tmax from 800 to 900 °C in the cyclic tests, the effects of high-temperature strength, grain growth, creep and oxidation are enhanced together, resulting in the accelerated thermal fatigue failure of 309 SS.
- (5)
- As far as the higher maximum service temperature of automotive manifolds is concerned, it is an important direction to improve the thermal fatigue lives of stainless steels by increasing their high-temperature strength and oxidation resistance.
Author Contributions
Conceptualization, validation, formal analysis, J.Z. and M.L.; Investigation and writing—original draft preparation, J.Z.; Resources, J.H. and B.H.; Supervision and writing—review and editing, M.L., Q.L. and H.G.
Funding
This research was funded by National Natural Science Foundation of China and Baowu Steel Group Co., Ltd., grant number U1660205 and 51571139.
Acknowledgments
M.L. thanks Jianian Shen (Shanghai University) for useful discussions.
Conflicts of Interest
The authors declare no conflict of interest.
References
- Liu, T.; Chen, L.; Bi, H.; Che, X. Effect of Mo on high-temperature fatigue behavior of 15CrNbTi ferritic stainless steel. Acta Metall. Sin. 2014, 27, 452–456. [Google Scholar] [CrossRef]
- Shelef, M.; McCabe, R.W. Twenty-five years after introduction of automotive catalysts: What next? Catal. Today 2000, 62, 35–50. [Google Scholar] [CrossRef]
- Ota, H.; Nakamura, T.; Maruyama, K. Effect of solute atoms on thermal fatigue properties in ferritic stainless steels. Mater. Sci. Eng. A 2013, 586, 133–141. [Google Scholar] [CrossRef]
- You, X.M.; Jiang, Z.H.; Li, H.B. Ultra-Pure Ferritic Stainless Steels—Grade, Refining Operation, and Application. J. Iron Steel Res. Int. 2007, 14, 24–30. [Google Scholar] [CrossRef]
- Ramesh, M.; Leber, H.J.; Janssens, K.G.; Diener, M.; Spolenak, R. Thermomechanical and isothermal fatigue behavior of 347 and 316L austenitic stainless tube and pipe steels. Int. J. Fatigue 2011, 33, 683–691. [Google Scholar] [CrossRef]
- Dewa, R.T.; Park, J.H.; Kim, S.J.; Lee, S.Y. High-Temperature Creep-Fatigue Behavior of Alloy 617. Metals 2018, 8, 103. [Google Scholar] [CrossRef]
- Su, C.Y.; Zhou, C.Y.; Lu, L.; Li, J.; Sun, P.Y.; He, X.H. Effect of Temperature and Dwell Time on Fatigue Crack Growth Behavior of CP-Ti. Metals 2018, 8, 1031. [Google Scholar] [CrossRef]
- Holdsworth, S. Creep-fatigue failure diagnosis. Materials 2015, 8, 7757–7769. [Google Scholar] [CrossRef]
- Liu, D.; Pons, D. An Explicit Creep-Fatigue Model for Engineering Design Purposes. Metals 2018, 8, 853. [Google Scholar] [CrossRef]
- Liu, D.; Pons, D.J.; Wong, E.H. The unified creep-fatigue equation for stainless steel 316. Metals 2016, 6, 219. [Google Scholar] [CrossRef]
- Sarkar, A.; Nagesha, A.; Parameswaran, P.; Sandhya, R.; Mathew, M.D. Transition in failure mechanism under cyclic creep in 316LN austenitic stainless steel. Metall. Mater. Trans. A 2014, 45, 2931–2937. [Google Scholar] [CrossRef]
- Kang, G.; Dong, Y.; Wang, H.; Liu, Y.; Cheng, X. Dislocation evolution in 316L stainless steel subjected to uniaxial ratchetting deformation. Mater. Sci. Eng. A 2010, 527, 5952–5961. [Google Scholar] [CrossRef]
- Fatemi, A.; Yang, L. Cumulative fatigue damage and life prediction theories: A survey of the state of the art for homogeneous materials. Int. J. Fatigue 1998, 20, 9–34. [Google Scholar] [CrossRef]
- Pegues, J.W.; Shao, S.; Shamsaei, N.; Schneider, J.A.; Moser, R.D. Cyclic strain rate effect on martensitic transformation and fatigue behaviour of an austenitic stainless steel. Fatigue Fract. Eng. Mater. Struct. 2017, 40, 2080–2091. [Google Scholar] [CrossRef]
- Cruchley, S.; Li, H.Y.; Evans, H.E.; Bowen, P.; Child, D.J.; Hardy, M.C. The role of oxidation damage in fatigue crack initiation of an advanced Ni-based superalloy. Int. J. Fatigue 2015, 81, 265–274. [Google Scholar] [CrossRef]
- Kitaguchi, H.S.; Li, H.Y.; Evans, H.E.; Ding, R.G.; Jones, I.P.; Baxter, G.; Bowen, P. Oxidation ahead of a crack tip in an advanced Ni-based superalloy. Acta Mater. 2013, 61, 1968–1981. [Google Scholar] [CrossRef]
- Pfaendtner, J.A.; McMahon Jr, C.J. Oxygen-induced intergranular cracking of a Ni-base alloy at elevated temperatures—An example of dynamic embrittlement. Acta Mater. 2001, 49, 3369–3377. [Google Scholar] [CrossRef]
- Faivre, L.; Santacreu, P.O.; Acher, A. A new ferritic stainless steel with improved thermo-mechanical fatigue resistance for exhaust parts. Mater. High Temp. 2013, 30, 36–42. [Google Scholar] [CrossRef]
- Wei, Z.; Konson, D.; Yang, F.; Luo, L.; Lin, B.; Ellinghaus, K.; Pieszkalla, M. Thermal fatigue resistance characterization and ranking of materials using the V-shape specimen testing method. Fatigue Fract. Eng. Mater. Struct. 2014, 37, 897–908. [Google Scholar] [CrossRef]
- Avery, K.; Pan, J.; Engler-Pinto, C.C.; Wei, Z.; Yang, F.; Lin, S.; Konson, D. Fatigue Behavior of Stainless Steel Sheet Specimens at Extremely High Temperatures. SAE Int. J. Mater. Manuf. 2014, 7, 560–566. [Google Scholar] [CrossRef]
- Chinouilh, G.; Santacreu, P.O.; Herbelin, J.M. Thermal Fatigue Design of Stainless Steel Exhaust Manifolds; SAE Technical Paper; SAE International: Troy, MI, USA, 2007. [Google Scholar]
- Yu, H.Y.; Lee, S.M.; Nam, J.H.; Lee, S.J.; Fabrègue, D.; Park, M.H.; Lee, Y.K. Post-uniform elongation and tensile fracture mechanisms of Fe-18Mn-0.6C-xAl twinning-induced plasticity steels. Acta Mater. 2017, 131, 435–444. [Google Scholar] [CrossRef]
- Shankar, V.; Yadav, S.D.; Mariappan, K. Influence of W and effect of loading mode on the substructural evolution of reduced activation ferritic/martensitic (RAFM) steels. Mater. Lett. 2019, 234, 257–260. [Google Scholar] [CrossRef]
- Smith, E.; Barnby, J.T. Nucleation of grain-boundary cavities during high-temperature creep. Met. Sci. J. 1967, 1, 1–4. [Google Scholar] [CrossRef]
- Lindstedt, U.; Karlsson, B.; Nystr, M. Small fatigue cracks in an austenitic stainless steel. Fatigue Fract. Eng. Mater. Struct. 1998, 21, 85–98. [Google Scholar] [CrossRef]
- Jiang, Q.C.; Sui, H.L.; Guan, Q.F. Thermal fatigue behavior of new type high-Cr cast hot work die steel. ISIJ Int. 2004, 44, 1103–1107. [Google Scholar] [CrossRef]
- Smith, E. The formation of a cleavage crack in a crystalline solid—I. Acta Metall. 1966, 14, 985–989. [Google Scholar] [CrossRef]
- Fujita, N.; Ohmura, K.; Yamamoto, A. Changes of microstructures and high temperature properties during high temperature service of Niobium added ferritic stainless steels. Mater. Sci. Eng. A 2003, 351, 272–281. [Google Scholar] [CrossRef]
Figure 1.
Geometry of thermal fatigue specimen (all units in mm) (a) and the test configuration (b).
Figure 1.
Geometry of thermal fatigue specimen (all units in mm) (a) and the test configuration (b).
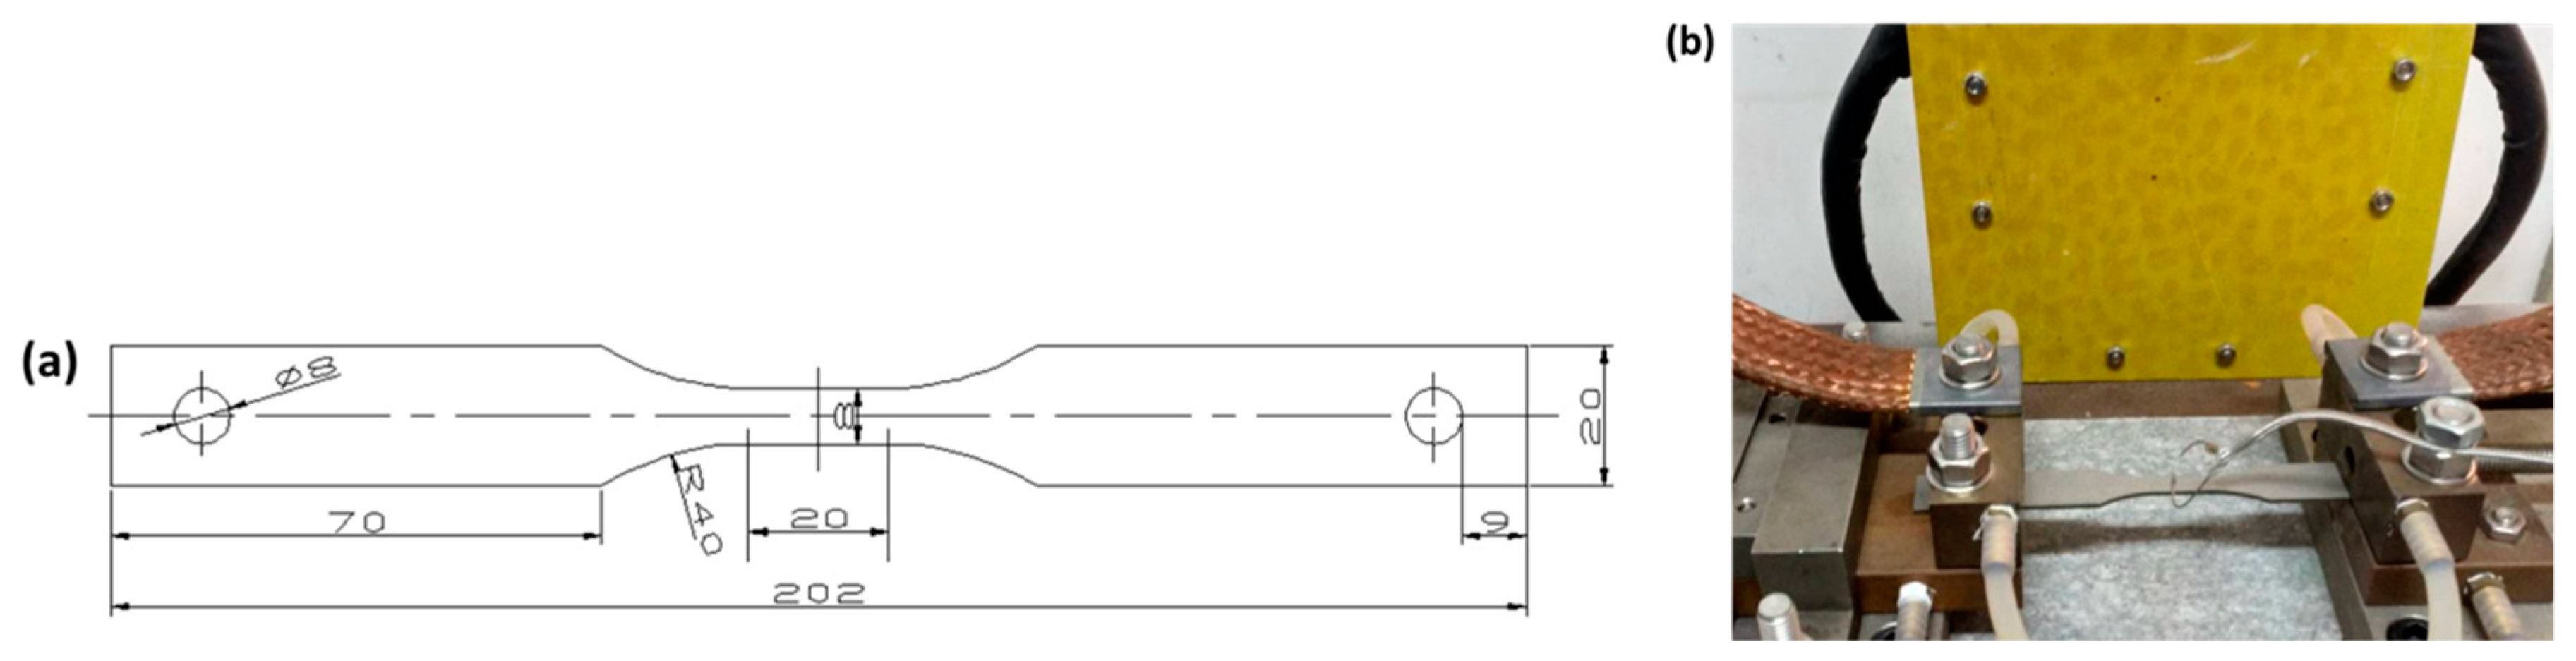
Figure 2.
Time dependence of temperature of thermal fatigue cycles test with different Tmax: (a) 800 °C and (b) 900 °C.
Figure 2.
Time dependence of temperature of thermal fatigue cycles test with different Tmax: (a) 800 °C and (b) 900 °C.

Figure 3.
Typical tensile stress–strain curves of 309 SS at different temperatures.

Figure 4.
Optical microstructures of 309 SS (a) before and after thermal fatigue tests under different Tmax conditions: (b) 800 °C and (c) 900 °C.
Figure 4.
Optical microstructures of 309 SS (a) before and after thermal fatigue tests under different Tmax conditions: (b) 800 °C and (c) 900 °C.

Figure 5.
The fractographic appearances of the failure specimens under different Tmax conditions: (a) 800 °C and (c) 900 °C. (b,d) are the magnified images of the parts outlined by circles in (a,c).
Figure 5.
The fractographic appearances of the failure specimens under different Tmax conditions: (a) 800 °C and (c) 900 °C. (b,d) are the magnified images of the parts outlined by circles in (a,c).
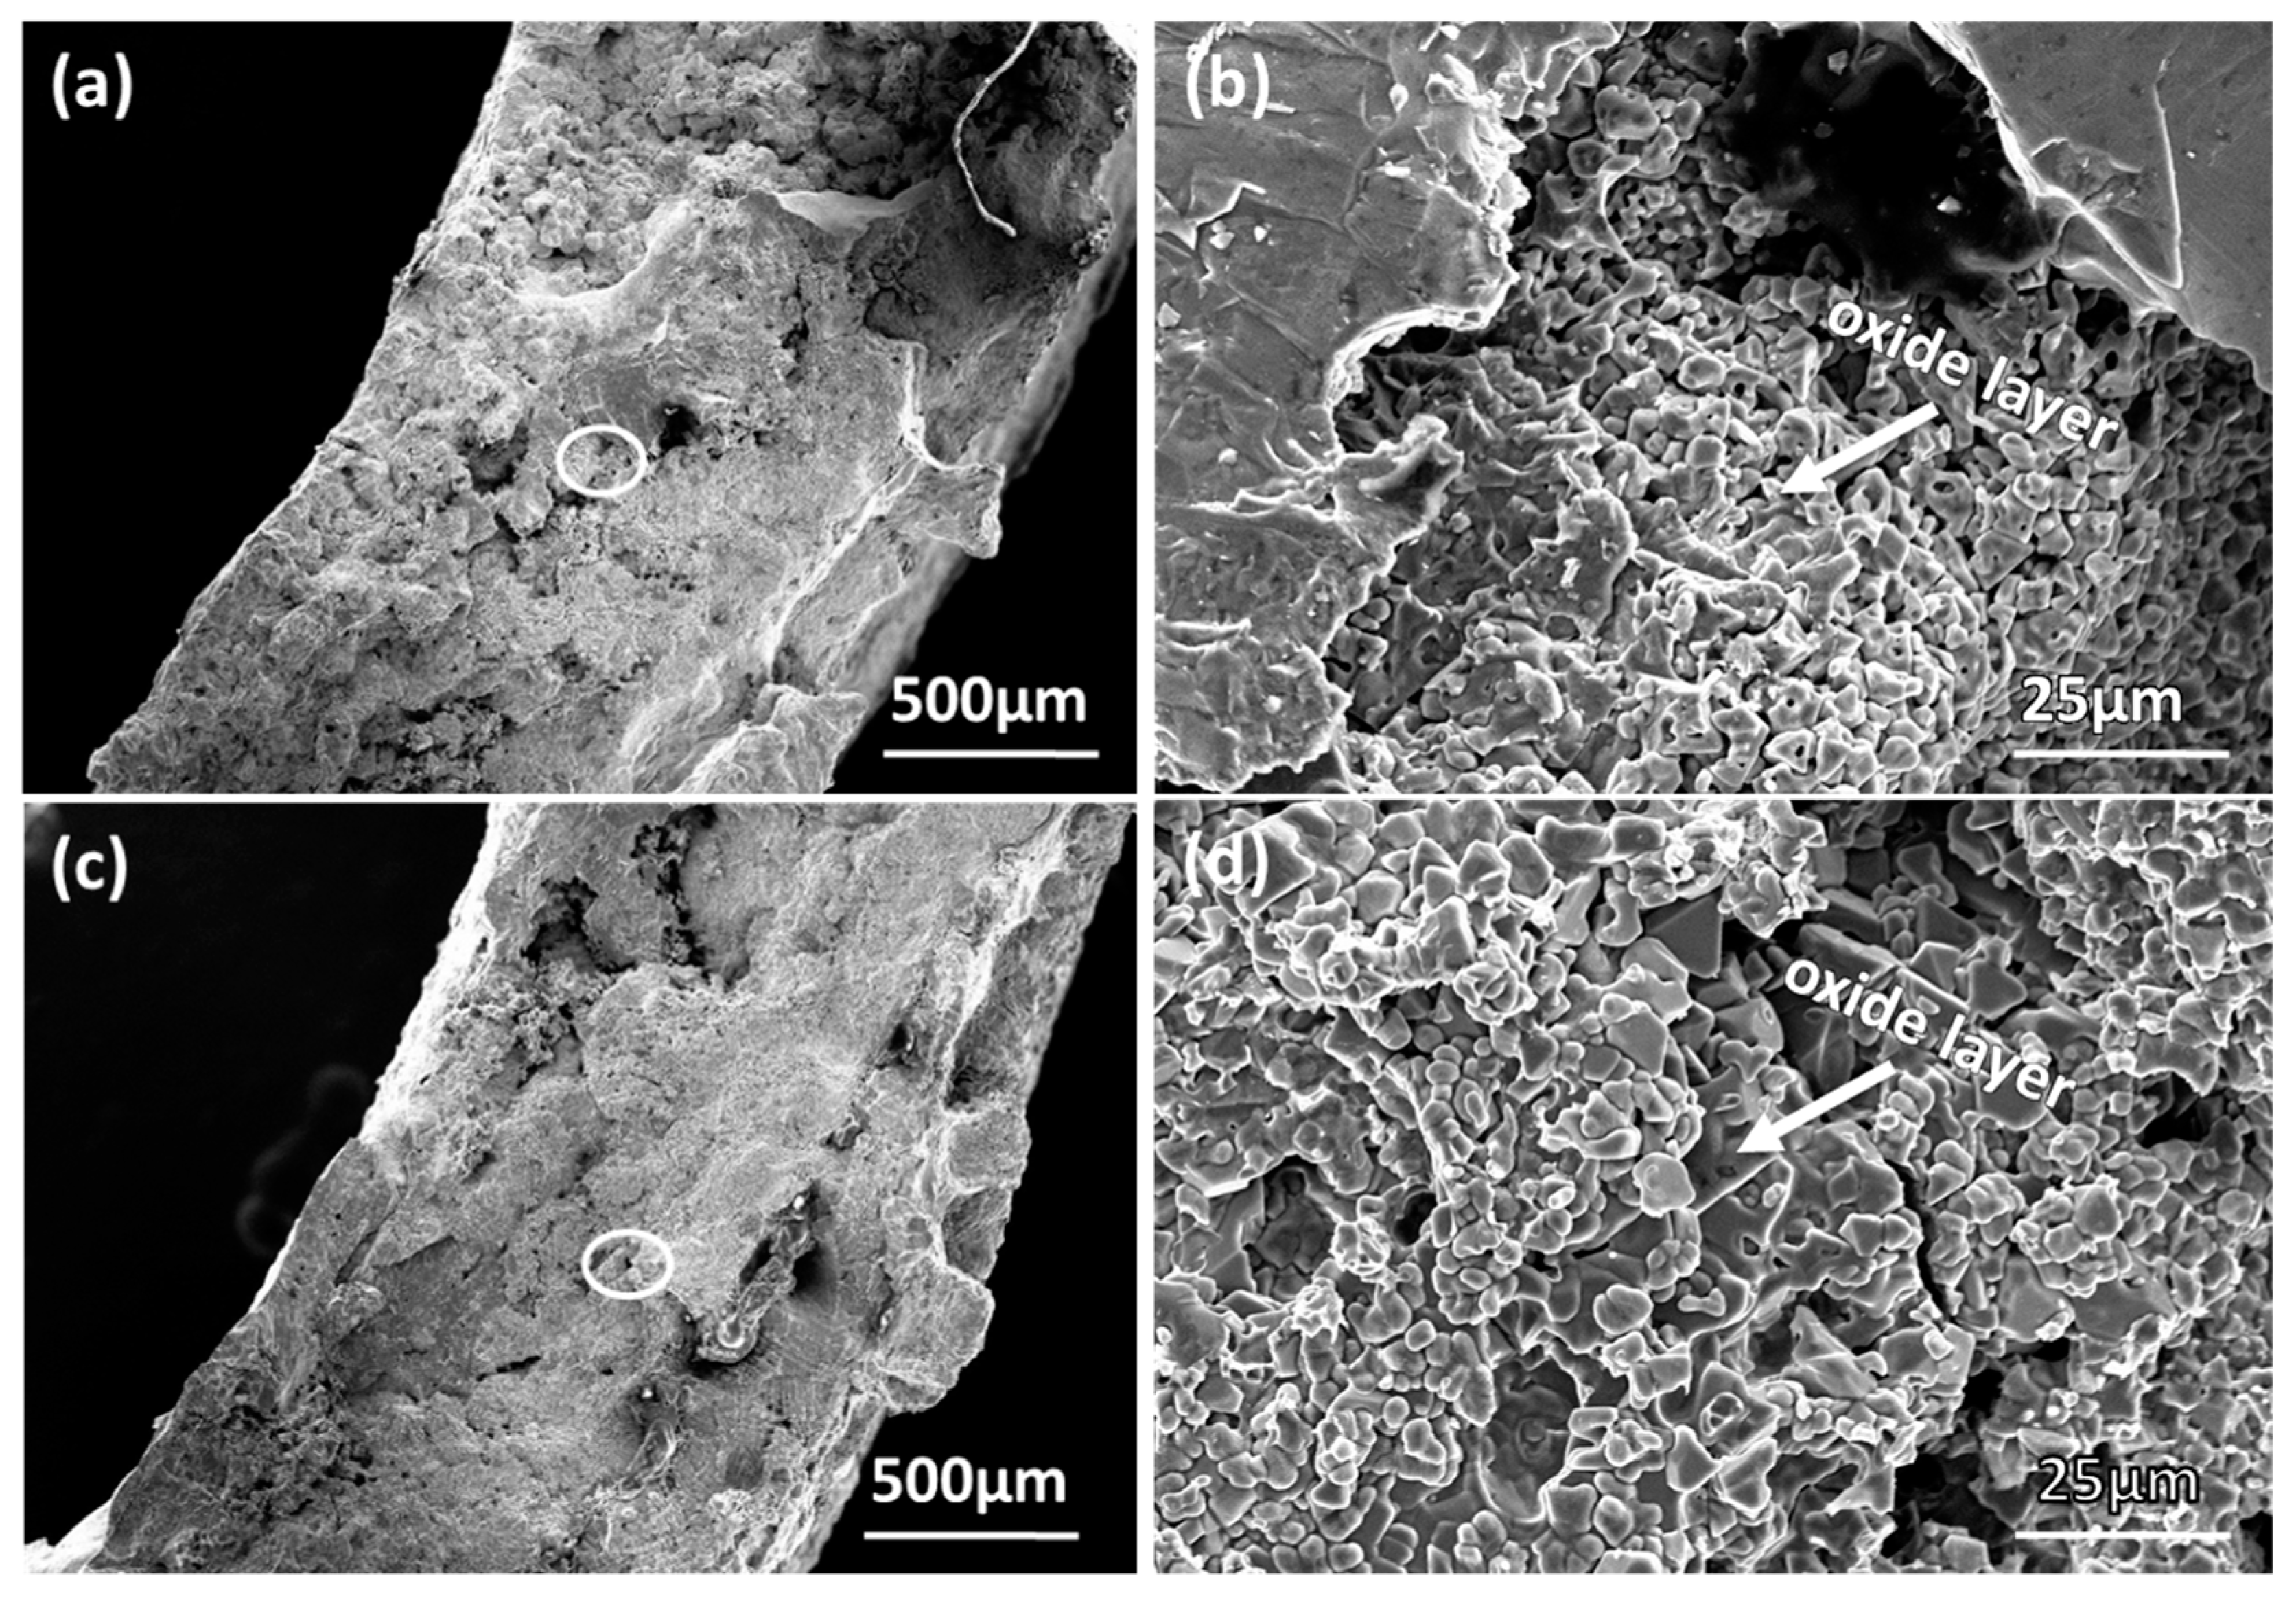
Figure 6.
X-ray diffraction (XRD) patterns of oxidation film on the specimen surfaces after the thermal fatigue tests under different Tmax conditions: 800 and 900 °C.
Figure 6.
X-ray diffraction (XRD) patterns of oxidation film on the specimen surfaces after the thermal fatigue tests under different Tmax conditions: 800 and 900 °C.

Figure 7.
The cross-sectional morphologies of the specimens after the thermal fatigue tests under different Tmax conditions: (a) 800 °C and (b) 900 °C.
Figure 7.
The cross-sectional morphologies of the specimens after the thermal fatigue tests under different Tmax conditions: (a) 800 °C and (b) 900 °C.
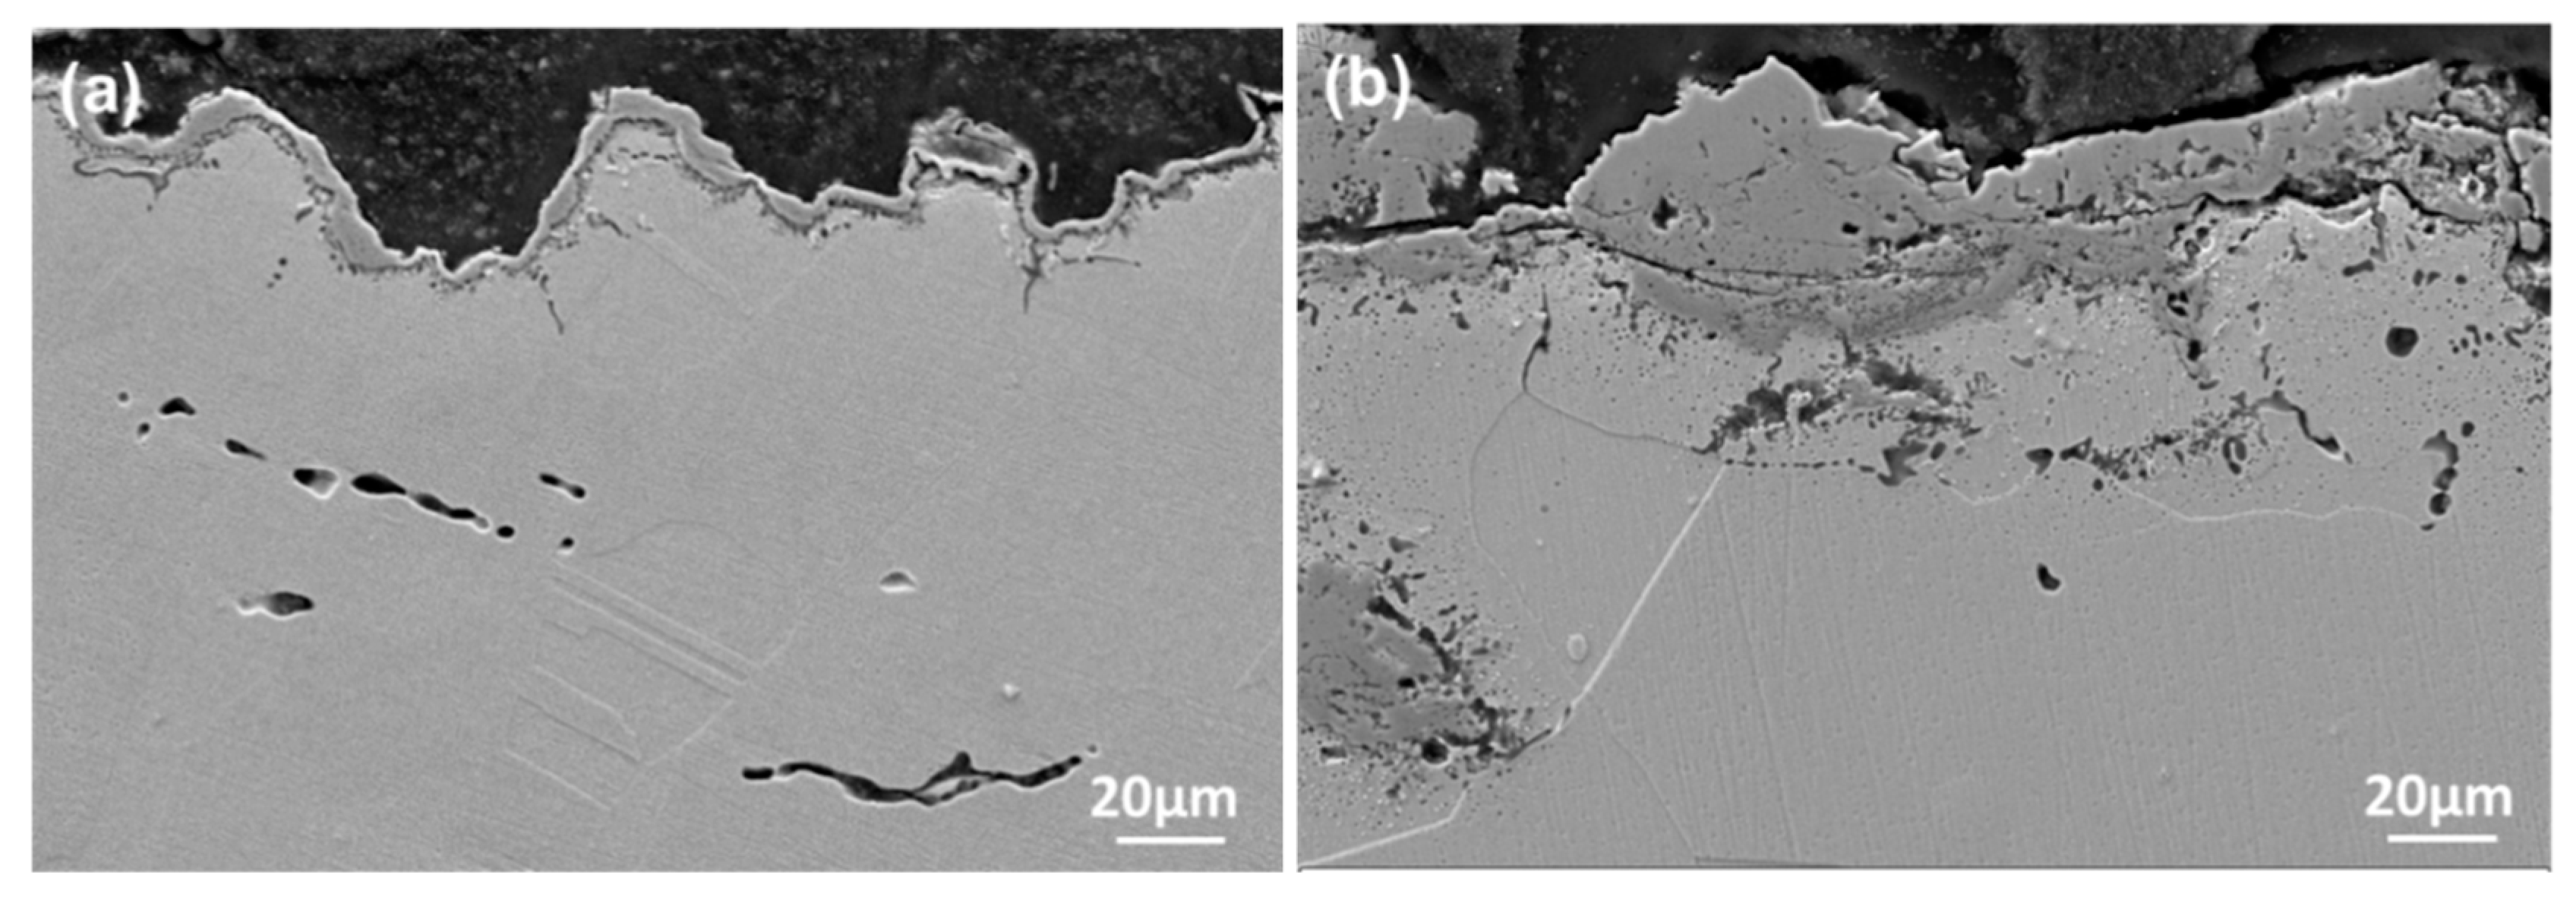
Figure 8.
Surface morphologies of the specimens after thermal fatigue tests under different Tmax conditions: (a) 800 °C and (b) 900 °C.
Figure 8.
Surface morphologies of the specimens after thermal fatigue tests under different Tmax conditions: (a) 800 °C and (b) 900 °C.

Table 1.
Chemical composition of type 309 austenitic stainless steel (wt.%).
| C | Si | Mn | P | Cr | Ni | Cu | Mo | Nb | N | Fe |
|---|---|---|---|---|---|---|---|---|---|---|
| 0.068 | 1.65 | 1.27 | 0.02 | 20.54 | 11.34 | 0.02 | 0.04 | 0.021 | 0.0646 | Balance |
© 2019 by the authors. Licensee MDPI, Basel, Switzerland. This article is an open access article distributed under the terms and conditions of the Creative Commons Attribution (CC BY) license (http://creativecommons.org/licenses/by/4.0/).
Share and Cite
MDPI and ACS Style
Zhan, J.; Li, M.; Huang, J.; Bi, H.; Li, Q.; Gu, H. Thermal Fatigue Characteristics of Type 309 Austenitic Stainless Steel for Automotive Manifolds. Metals 2019, 9, 129. https://doi.org/10.3390/met9020129
AMA Style
Zhan J, Li M, Huang J, Bi H, Li Q, Gu H. Thermal Fatigue Characteristics of Type 309 Austenitic Stainless Steel for Automotive Manifolds. Metals. 2019; 9(2):129. https://doi.org/10.3390/met9020129
Chicago/Turabian StyleZhan, Jianming, Moucheng Li, Junxia Huang, Hongyun Bi, Qian Li, and Hui Gu. 2019. "Thermal Fatigue Characteristics of Type 309 Austenitic Stainless Steel for Automotive Manifolds" Metals 9, no. 2: 129. https://doi.org/10.3390/met9020129
Note that from the first issue of 2016, this journal uses article numbers instead of page numbers. See further details here.