Numerical Computation of Material Properties of Nanocrystalline Materials Utilizing Three-Dimensional Voronoi Models

Laboratory of Technology & Strength of Materials, Department of Mechanical Engineering & Aeronautics, University of Patras, 26500 Patras, Greece
*
Author to whom correspondence should be addressed.
Metals 2019, 9(2), 202; https://doi.org/10.3390/met9020202
Submission received: 15 January 2019
/
Revised: 30 January 2019
/
Accepted: 3 February 2019
/
Published: 8 February 2019
(This article belongs to the Special Issue Failure Mechanisms in Alloys)
Abstract
:Nanocrystalline metals have been the cause of substantial intrigue over the past two decades due to their high strength, which is highly sensitive to their microstructure. The aim of the present project is to develop a finite element two-phase model that is able to predict the elastic moduli and the yield strength of nanostructured material as functions of their microstructure. The numerical methodology uses representative volume elements (RVEs) in which the material microstructure, i.e., the grains and grain boundaries, is presented utilizing the three-dimensional (3D) Voronoi algorithm. The implementation of the 3D Voronoi particles was performed on the nanostructure investigation of ultrafine materials by SEM and TEM. Proper material properties for the grain interiors (GI) and grain boundaries (GB) were computed using the Hall-Petch equation and a dislocation-based analytical approach, respectively. The numerical outcomes show that the Young’s Modulus of nanostructured copper increased by increasing the crystallite volume fraction, while the yield strength increased by decreasing the grain size. The numerical predictions were strongly confirmed in opposition to finite element outcomes, experimental results from the open literature, and predictions from the rule of mixtures and the Mori-Tanaka analytical models.
1. Introduction
Nanostructured (NS) metals have developed significant intrigue over the past twenty years due to their distinctive material properties [1]. Among the most investigated feature of the NS materials is their mechanical behavior [2]. It is generally well-known that along with their microcrystalline materials, NS materials are characterized by enhanced values in terms of yield stress, ultimate tensile strength (UTS), and hardness, while their plastic behavior and fracture toughness usually seem to have decreased values [3]. Due to several issues demonstrated throughout their production (for example, the thermodynamic instability because of the Gibbs free energy monotonic reduction), it is evidently accepted that experimental test campaigns for the investigation of mechanical properties of NS materials is a very tough task due to the inadequacy associated with the research community in providing sufficient quantities of material with regard to test specimens. Nonetheless, the aforementioned production obstacles are also the driving force for the implementation of numerical models suitable for associating the material microstructure (grain size, volume fraction of each phase, etc.) with the mechanical properties of nanostructured materials.
Kim et al. [4] applied the plastic strain of nanostructured metals using constitutive expression based on the dislocation density evolution along with diffusion controlled plastic flow. Estrin et al. [5] introduced a new model with crystal plasticity that incorporated terms with consideration to the fact that double-slip geometry has a diffusional behavior. Wei et al. [6] utilized the cohesive behavior of elements on the grain boundaries (GB) in order to model a GB slip mechanism. The aforementioned elements have progressive equations that utilize the slip and separation effects between adjoining grains, simulating the reversible elastic and inelastic responses. The grain interiors (GI) were defined with the approach of the single crystallite plasticity. Wei et al. [6] utilized a numerical approach to the investigation of nanostructured nickel and compared it with the experimental results of the aforementioned nanocrystalline material. It was shown that dislocation density in nickel GIs after plastic strain presented a declining trend, indicating that annihilation might be accommodated at the GB area. They detected that the non-linear response was mainly because of the elasto-plastic behavior of the GB phase. The mechanism of plasticity of GIs was infrequently detected previous to GB cracking.
Fu et al. [7] utilized, via a numerical approach, a model in which the grain of a nanocrystalline copper consisted of two phases—a GB with a definite thickness and the grain interior (GI). Typically, it has a non-linear relationship with the crystallite diameter. A number of two dimensional (2D) elements of grain sizes varying from 26 to 100 nanometers were subjected to compression. The crystal morphology continued to be constant, thus the GB thickness ratio to the grain diameter was liable for the deformation variations. The aforementioned approach investigated several grain sizes varied by ratios between GB and bulk dimensions.
Four distinctive models with differing numerical approaches and employed GI and GB phases were examined. In the first investigation [8], the GIs referred to one crystallographic orientation related to three different types of hardness orientation. The GIs were modeled isotropic and associated with the indicative stress-strain curve utilizing the experimental outcomes acquired from Diehl [9] and Suzuki et al. [10]. The GBs were modeled with perfectly plastic behavior.
A more recent work [11] used a numerical methodology by applying the separated crystallite plasticity for the GI and the Voce equation in order to simulate the hardening behavior of the GBs. In [11], the approach of separated crystallite plasticity for the GI and GB was used. The grain interior and grain boundary acquired different hardening properties. This numerical approach shows the localization evolution, which happened via the work hardening effect. In [11], another numerical methodology is presented that replaced the separate GI and GB model with a hardening approach that correlated to the evolution of dislocations. The aforementioned phenomenon is controlled by the orientation variation of maximum shear planar stress, which is calculated by the angle of shear stress.
The computations were performed with a multiphase Eulerian analytical implementation [12]. Apart from the highest strain values (which were substantially higher than experimental results), the strains were lower than the Lagrangian computations. The analytical formulas profitably predicted the Hall-Petch effect; however, the fluctuation in the experimental results was noticeable. Considering the aforementioned obstacle, it would be impossible to tune the aforementioned analytical and numerical methodologies.
GB slip was examined by taking into account the restrictive examples of perfect bonding and the ideally frictionless GB slip mechanism [8]. The limitation of ideal GB bonding increased the yield strength compared to ideal slip by 200 MPa at a proportional plastic strain of 0.2, which was close enough for the models to start acting in an almost perfectly plastic way.
It is evident from the above that the study of the material properties of nanocrystalline metals is at early stage—with upward trends—due to enhanced mechanical properties relative to commercial metallic materials and their recyclability relative to composite materials. Furthermore, it is common knowledge that there is currently an inability within the scientific and industrial communities to produce sufficient quantities of nanocrystalline that are thermodynamically stable in order to sustain their superior mechanical properties while also dealing with their low plasticity.
In the current project, a numerical methodology for predicting the mechanical properties of nanocrystalline materials utilizing a sophisticated 3D Finite Element FE model is shown. The scope combines a multidisciplinary study of nanocrystal characterization using SEM-TEM scans and the development of a numerical methodology using a representative volume element (RVE) for predicting the material properties of NS materials. For simplicity’s sake, we selected the numerical implementation of cubic volume element (RVE), as it is the smallest volume in which a sampling of all microstructural heterogeneities can be considered for the investigation of macroscopic mechanical responses on the condition that it remains small enough to be considered a volume element of continuum mechanics. Thus, the indirect scope of the present thesis is to extend the scientific effort for the prediction of nanocrystalline mechanical properties from 2D models to three dimensional (3D) models by utilizing a sophisticated 3D Voronoi tessellation algorithm accompanied with a numerical work-flow, which implements only the basic mechanical properties of pure materials by combining the Hall-Petch (H-P) effect. The results of 3D models are more reliable than 2D models due to their realistic microstructure. This way, the FE approach may become a useful tool, and could become the keystone for evaluating the adequacy of nanocrystalline metals by making their implementation in the aerospace sector feasible.
This paper is an extension of a conference proceeding of the same mentioned authors of the existing paper [13]. The conference proceeding was focused on the elastic properties of nanostructured materials. In the present study, the above authors extended their investigation of plastic properties (yield strength) and the general elastoplastic response of nanocrystalline materials under tensile loading conditions.
2. The Analytical Approach
2.1. Rule of Mixtures Approach
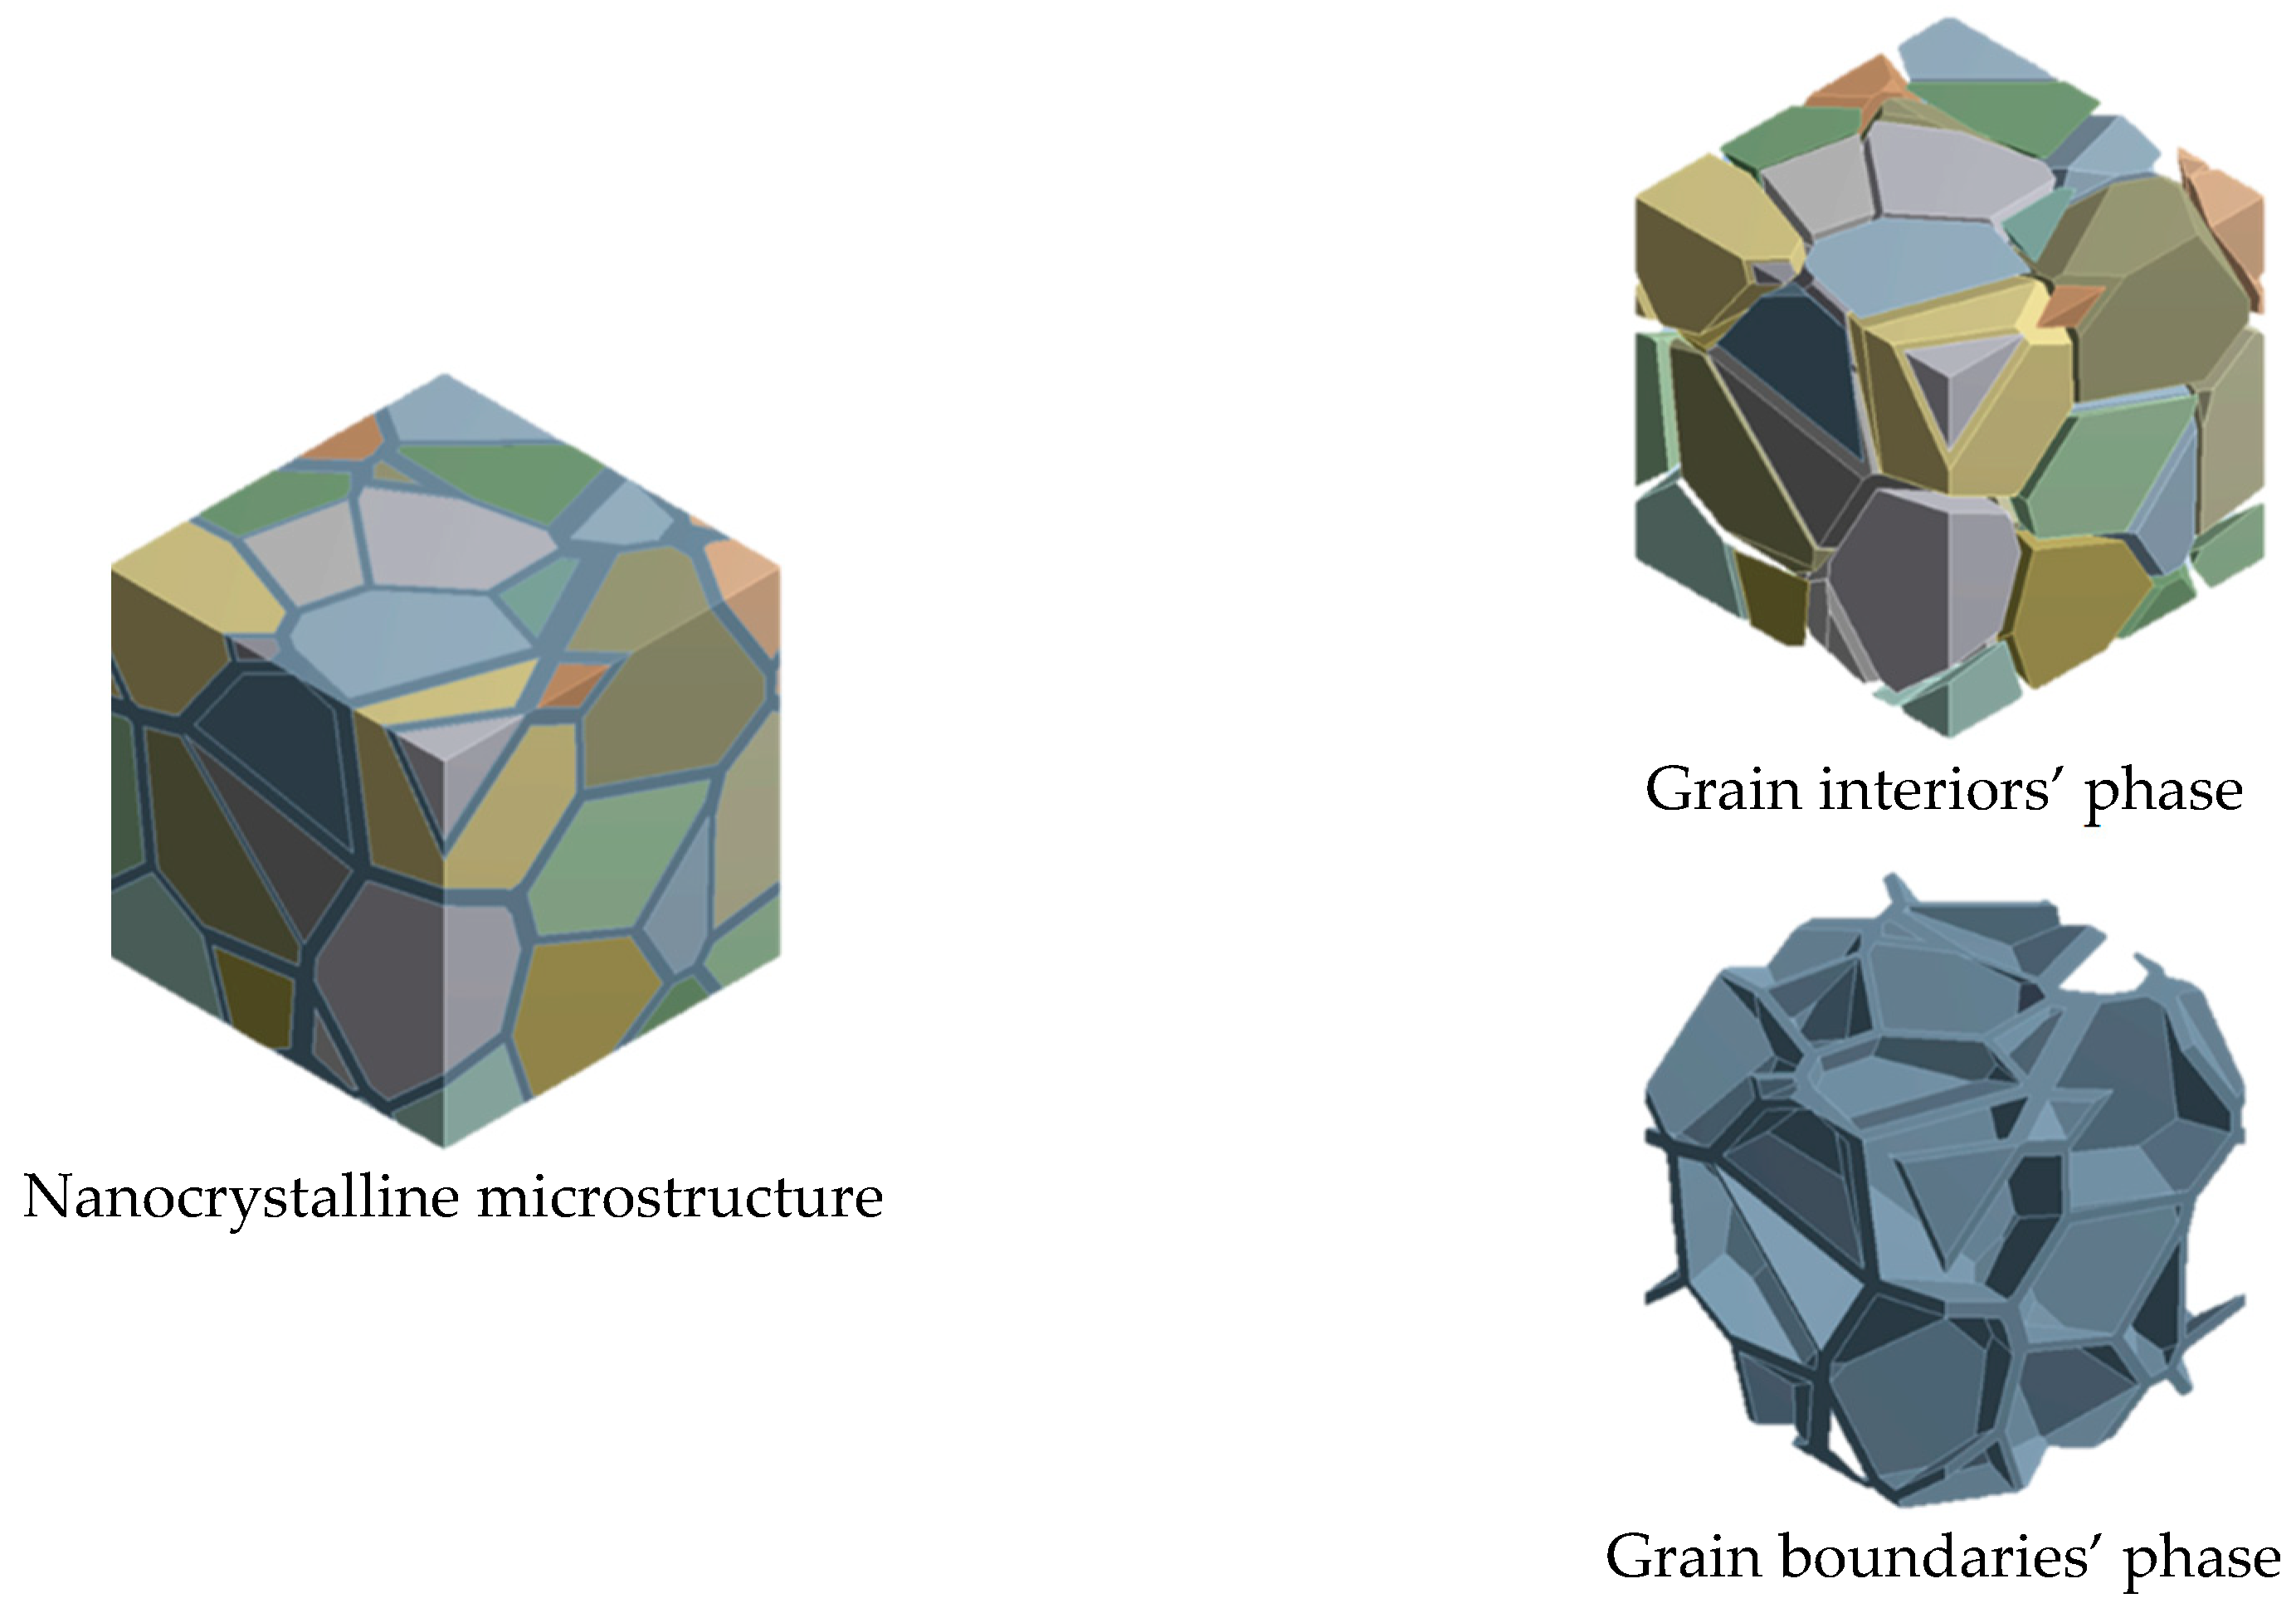
The rule of mixtures (RoM) approach is described in its approximate configuration. The idea (Figure 1) regarding the basic approach considers that NS microstructure is a new composite-like material made of two definite phases—the GIs and the GBs. Additionally, an ideal bonding connecting the two different components is considered. In order to make the analysis less complex, triple junctions (TJs) were included in the GBs in relation to the computed volume fraction (VF). This reduction of the RoM phases to the two basic definite phases (GB and GI) should not have a considerable impact on the analytical outcomes for NS metals with a GI diameter higher of 10 nanometers because of the volume.
Nanocrystalline materials commonly refer to the category of metals whose mean GI diameter is below 100 nanometers. Considering that many atoms settle in the GB areas, the VF of the GB component is not zero. As far as the GI diameter d and GB thickness t are concerned, the VF of the crystallites can be closed by:
as well as that of the GB phase. Furthermore, the GI phase is likewise assumed homogeneous. In a microcrystalline metal, the entire polycrystalline microstructure is filled by the crystallites, and their elastic behavior is simply the overall behavior of these grain interiors. However, for an NS metal at a grain size of 20 nanometers and grain boundary thickness equal to 1 nm, for example, the VF of the GB component is close to 14% and its contribution to the comprehensive elastic response presents some variations.
Figure 1 demonstrates a graphic of the RoM approach in an NS metal. The cubic volume of the NS metal is comprised of GBs and GIs as they were described above. It was indicated in [14,15] that the outcomes of the numerical computation plastic strain in NS metals are not precisely equal to those acquired utilizing the RoM approach. As a consequence, in this project, the subsequent simple RoM methodology based on the VFs of the two phases was utilized for the investigation of deformation response:
where the indices gi and gb correspond to grain interiors and grain boundary phase, respectively. The stress of the aforementioned definite phases of the NS material is measured utilizing the presumption that the strains of GB and GI phases are equivalent to the macroscopic applied strain.
2.2. Mori-Tanaka Approach
As it is known, the Mori-Tanaka approach belongs to the mean-field homogenization methods (MFH). The objective of mean-field homogenization is to closely and precisely calculate computations of the mean values of the stress and strain fields at the representative volume element level and in each definite component. It is imperative to indicate that the mean-field homogenization method is not able to solve the representative volume element in detail. As a result, it is incapable of computing the stress localization in both of the definite phases.
In the present project, we investigated a composite-like material made out of a matrix material filled with a definite number of inclusions (I) and holding identical material properties, elliptical morphology, and orientation. We implemented subscripts 0 for the matrix phase and 1 for the inclusions component. The VFs in the two definite components reflect this. Typically, the average strain fields over the RVE, the GB phase (matrix), and the GI phase (inclusions) are associated as follows [16]:
This identity contains any stress or strain field. Any mean-field homogenization method can be described by strain concentration tensors like that of [16]:
The average strains over all grain interiors are identified with the average strains over the grain boundary phase by means of the primary tensor. The average deformation over the whole representative volume element is identified through the secondary tensor. The two deformation concentration tensors do not behave autonomously. In fact, the secondary term can be estimated from the primary term [16]:
These outcomes are acceptable for any numerical methodology for either component. For any MFH approach described by a deformation concentration tensor, the stiffness of the RVE is:
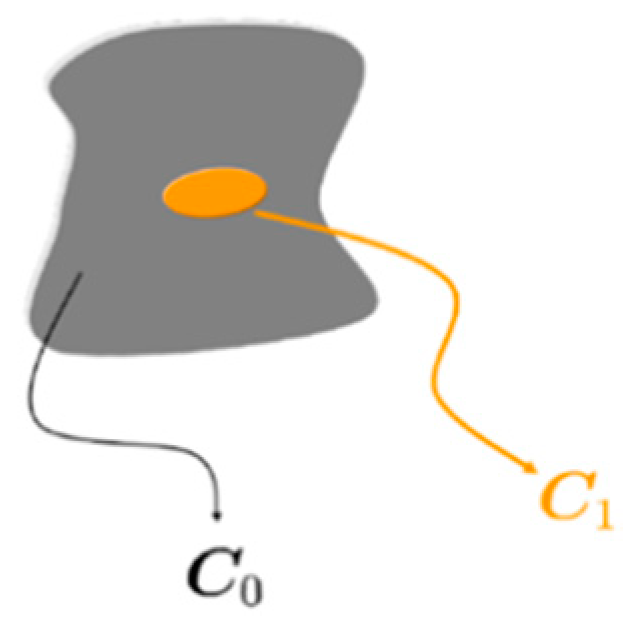
An infinite part is exposed to linear displacements on its boundary, which corresponds to a uniform remote strain ε. The body consists of a GB phase (matrix) of uniform stiffness C0 in which there is embedded an ellipsoidal inclusion (I) of uniform stiffness C1 (Figure 2).
Applying the solution proposed by Eshelby [17], the aforementioned issue can be figured out in closed form. It was proven that the deformation into the inclusion (I) is uniform and associated with the remote strain as follows:
where
is the specific (I) strain concentration tensor [17], described as follows:
One more tensor that performs a noteworthy purpose is Hill’s tensor, defined as:
The solution of the specific (I) issue is the cornerstone of commonly known MFH models.
The model of Mori-Tanaka [16] was proposed to solve the aforementioned analytical problem. The derivation was adapted from the implementation of the solution proposed by Eshelby [17]. It was proven that the deformation concentration tensor related to the overall deformation and inclusions to the overall matrix deformation is specified by:
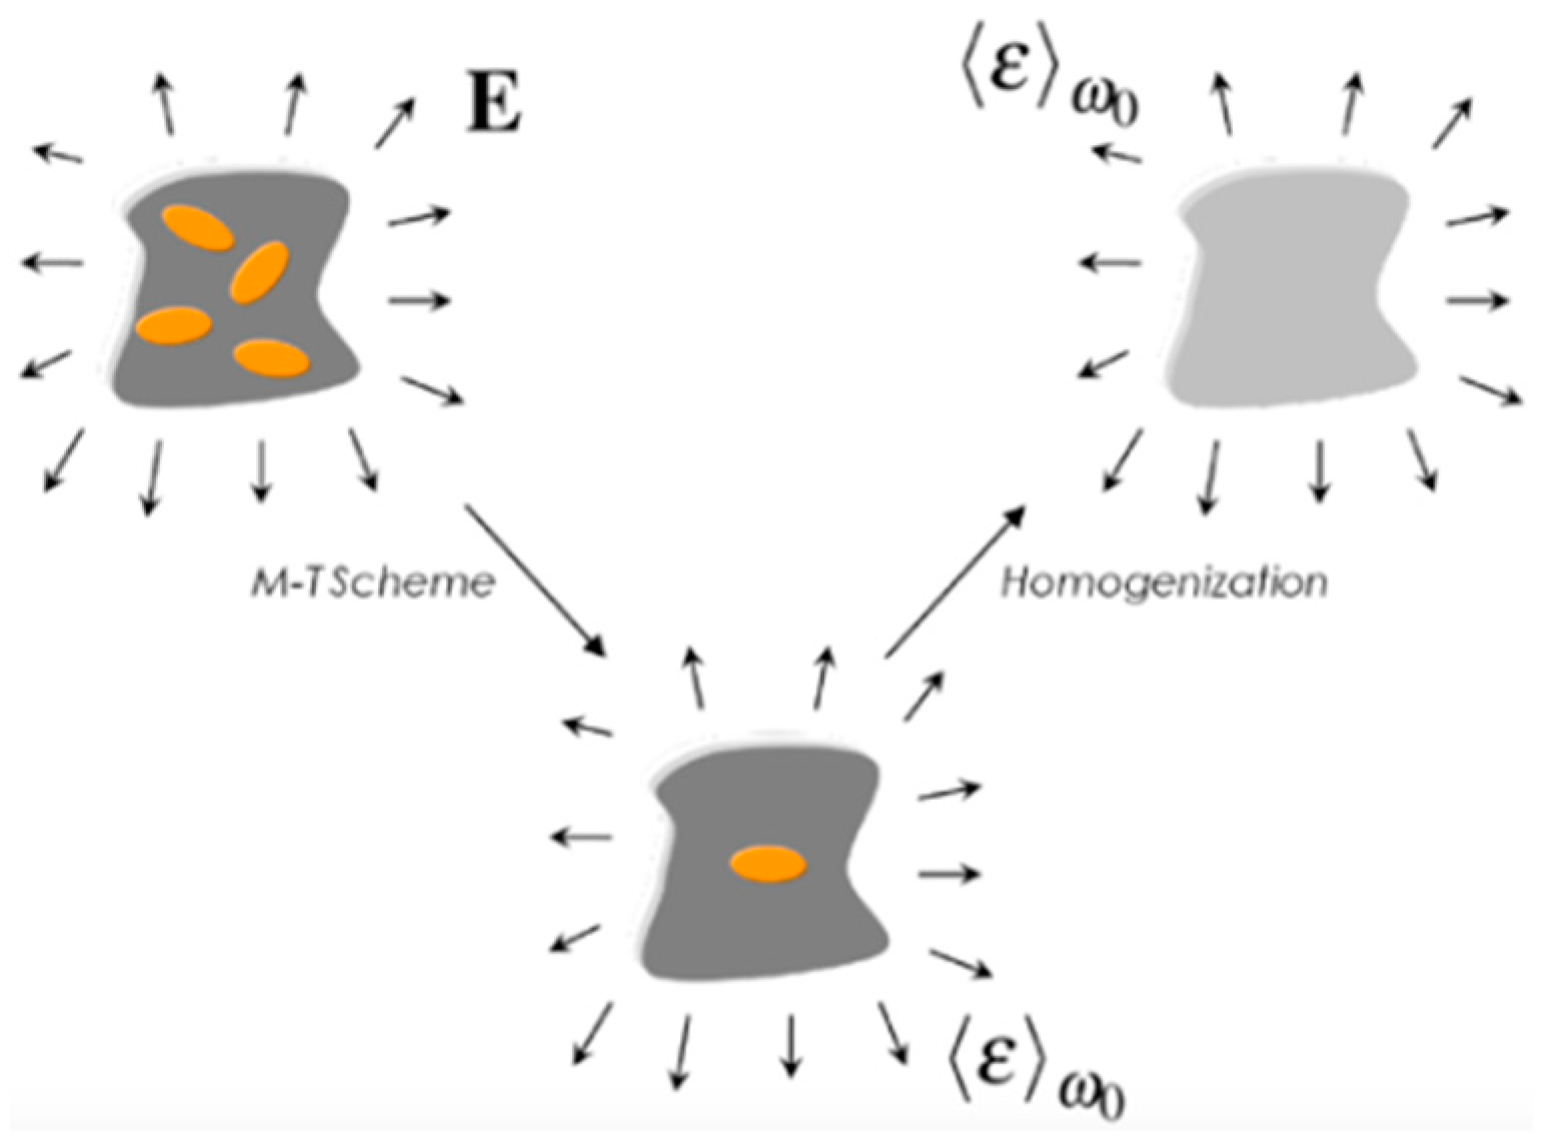
which is definitely the deformation concentration tensor of the single (I) problem. Benveniste [18] used the aforementioned mathematical expression in order to provide the subsequent understanding of the Mori-Tanaka (M-T) methodology. Each of the inclusions in the real representative volume element acted as if it was isolated within the real matrix. The body was infinite and exposed to the mean deformations in the real representative volume element as the far remote field deformation. This is depicted in Figure 3. Typically, the Mori-Tanaka formula is very efficient in predicting the effective material properties of composite-like materials. In principle, it truly is limited to average VF of inclusions (less than 25%), but from a practical point of view, it can provide very satisfactory predictions well beyond this particular range.
3. The Finite Element Approach
Atomistic simulation approaches give notable understanding to the microstructural behavior of nanocrystalline materials. Be that as it may, their use for foreseeing the corresponding material properties is very problematic because of fundamental limitations of the techniques. Hence, the implementation of a finite element methodology for NS materials is focused on providing an important tool for the design-by-analysis of the fundamental NS material morphologic characteristics so as to acquire the required mechanical response.
For the purpose of the tensile simulation of NS material, an FE-based model was utilized. The recommended numerical methodology was utilized in the implementation of RVEs of the NS metal. As is commonly known, RVE is the smallest numerical volume for any material in which a macro-mechanical material property can be evaluated through a multi-scale modeling approach. Due to the microscopic size of RVEs, detailed morphology of a material’s microstructural characteristics applying different algorithms can be modeled.
3.1. The Representative Volume Element
The analysis objective was focused on the development of a numerical procedure via the parametric interaction representing the geometrical characteristics of nanostructured metals. The presumptions used in the present work are described extensively here.
Investigation of NS materials SEM/TEM photographs (Figure 4) from [19] showed that NS metals are made of randomly distributed polyhedral-shaped grains. For the purpose of the realistic morphology of NS metals into representative volume element, the microstructure numerical morphology was made utilizing the commonly known Voronoi algorithm. The Voronoi algorithm is a semi-analytical methodology of plane partition to multiple definite regions using the distance between points in an explicit plane subset. The aforementioned set of points is clearly defined beforehand, and for each point, there is a related area made of all points closer to that particular seed than to any other. These areas are named Voronoi cells.
Authors utilized the next assumptions for the numerical generation of the polycrystalline aggregate:
- Crystallite generation starts at all points (pi) in a finite set of nuclei (point seed) at the same time (T0). The nuclei are fixed at their randomly spatial positions during the growth process; as a result, they are not able to move.
- The velocity of the crystallite generation (following the parabolic plane curve) is assumed to be equal in all grains and all directions leading to the isotropic and uniform grain creation.
- Crystallite growth in a direction stops as two grain boundaries contact each other. The grain overlapping is not allowed. The growth process stops when there is no further grain growth in any direction in any grain. The entire volume has been filled with grains; as a result, there are no voids.
The Voronoi method further takes for granted that there may not be more than one nucleus within each sphere of radius rmin (Figure 5). This is equivalent to requiring:
‖pi − pj‖2 > rmin ∀ pi, pj ∈ S: pi /= pj.
Regarding the issue of periodicity for the numerical microstructure, Voronoi tessellation models can be periodized using their initial periodic geometry as input data. Utilizing the cell multiplication function, the final unit cell can be constructed as is illustrated in the 2D plane in Figure 6.
A detailed step-by-step procedure of the proposed meshing algorithm is shown below.
- Create point seed S.
- Compute Voronoi tessellation.
- Intersect Voronoi cells with unit cell (generate input geometry).
- Separate geometric master and slave entities.
- Create surface mesh with constraint boundary nodes (2D meshing).
- Surface periodic mesh: copy mesh from master to slave surfaces.
- Create volume mesh with constraint boundary nodes (3D meshing).
- Refine volume mesh with constraint boundary nodes.
- Create input file for ANSYS APDL computation (scripting).
The recommended meshing procedure was used with the DIGIMAT© software, which generated an ultra-fine meshed model. After the mesh generation, the model was imported to ANSYS APDL using its superior computational performance.
Initially, the point seed was generated by a Poisson process. N indicates the number of nuclei that performed in RVE. In a Poisson process, each point pi (i = 1,…N) is given an x-, y-, and z-coordinate through random variables Xi, Yi, Zi, which are uniformly distributed around the origin at (0,0,0) with:
where and h are the width, depth, and height of the cuboid volume element, respectively. For the Voronoi tessellation, all points pj with:
are removed from the point seed, and new points are added. The aforementioned procedure was repeated until the number of points satisfying the prescribed radius was obtained. The computation of Voronoi tessellation consisted of a set of vertices (P) and a list of corner vertices for each Voronoi cell. Therefore, the determination of the intersection of the Voronoi cells with the bounding box was necessary. In this work, we applied the fast and robust algorithm described in Figure 7 for the identification of such an interior point.
‖pi − pj‖2 ≤ rmin (j > i)
In each RVE, a comprehensive 3D model of the GI and GB phases as randomly-distributed sub-volumes was developed (Figure 8). As referenced above, the VF of GI and GB phases play a significant role on the calculated mechanical response of the RVE. These VFs could be parametrically defined in the NS model.
The thickness (t) of GBs was equal for nanocrystalline NC metals and coarse-grained metals [20], and it was kept at t = 1 nm in the numerical case studies shown below. The difference from the VF of GBs was important only in the case of NS metals. For the simulations, the VF of the grain interior phase was defined by Equation (1).
The representative volume element was meshed utilizing tetrahedral finite elements (Figure 9). Appropriate mechanical properties at each component were given, and the representative volume elements were subjected to representative loading conditions.
The material properties employed for the numerical investigation of the mechanical response of the nanocrystalline copper were established through the open literature review [21,22,23] of bilinear stress-strain curves, defined by values of yield stresses. The aforementioned material properties presumed in the simulations are presented in Table 1.
The value of σ0 in the H-P equation was 33 MPa, and the value of ky was 0.135 MPa m1/2. The previously mentioned values are demonstrative for copper. The nanocrystalline copper with a grain size of about 10 nanometers led to the identical value of macroscopic flow stress.
The Young’s modulus of elasticity for the GB component, Egb, was 20% lower than the value for the GI, EGI. The supposition of the reduced value of the GB elastic constant was based on the outcomes of ab initio calculations founded in [8] and experimental findings reported in [9]. The yield stress of the GB phase was constantly equal to 861 MPa due to the pile-up breakdown effect. The cause behind the aforementioned effect relies on the Hall–Petch phenomenon. As the GI diameter diminished, the number of dislocations accumulated contrary to a GB phase reduced because this number was a relationship between the applied stress and the distance to the source. On the contrary, an upward stress value was required to come up with the identical number of dislocations at the pile-up. At an essential crystallite size, we could no longer utilize the approach of a pile-up mechanism in order to define the plastic flow. As the GI size decreased to the NC regime, the number of dislocations at the pile-up decreased to one after some time (see Figure 10). For even more decreased values of the GB yield stresses, total plastic strain was accommodated at the GB phase, and these stresses defined the comprehensive yield stress of the nanocrystalline aggregate. Wadsworth and Nieh and Wadsworth [24] foretold the critical GI size in several metals in which the H–P effect would collapse by considering that there is a critical value at which crystallite in a nanocrystalline specimen can no longer be adequate to hold more than one dislocation.
where G, b, dcr, and v are the shear modulus, the Burger’s vector, the critical grain size, and Poisson’s ratio, respectively.
Ιt was assumed that grain boundaries and grain interiors exhibit the elastic–plastic properties described by the following relationships:
where e0 is the elastic strain at the yield point, E is the Young’s modulus, and h is the work-hardening coefficient. The plasticity of grain boundaries was approached based on the Hill criterion [25], which (in general) accounts for differences in the yield strength in orthogonal directions. The equivalent stress can be described as:
where [M] is a matrix of yield stress variations with orientation and {L} describes the difference between tension and compression of yield strengths:
where and are tensile and compressive yield strengths in the direction j, j = x, y, z, xy, yz, xz.
Numerical analyses were executed utilizing ANSYS software with SOLID 185 type of elements. Such 3D elements allow non-linear elastoplastic, anisotropic features using large deformations. In the analyses, it was considered that the numerical model was loaded under tensile forces. The force was conducted by the surface-boundary of the RVE in order to compute the macroscopic stress, σm.
Furthermore, the consequential displacement at the surface of the RVE was conducted by its length in the vertical direction to acquire the macroscopic deformation, em. In a numerical analysis under uniaxial tensile condition, boundary conditions (BC) utilized for the RVE are shown in Figure 11.
The Young’s Moduli of Elasticity, Shear Moduli, and yield strength of the nanocrystalline metal can be numerically predicted. This led us to pass over the commonly known fabrication issue of nanocrystalline materials at sufficient quantities in order to execute a considerable mechanical test campaign. Considering the aforementioned proposed numerical methodology, a reduced number of specimens for experimental tests was required for validation purposes. The implemented numerical analysis can provide the necessary tools for creating the essential nanocrystalline microstructure based on the appropriate mechanical properties.
3.2. Validation of the Proposed Numerical Approach with Experimental Tensile Test
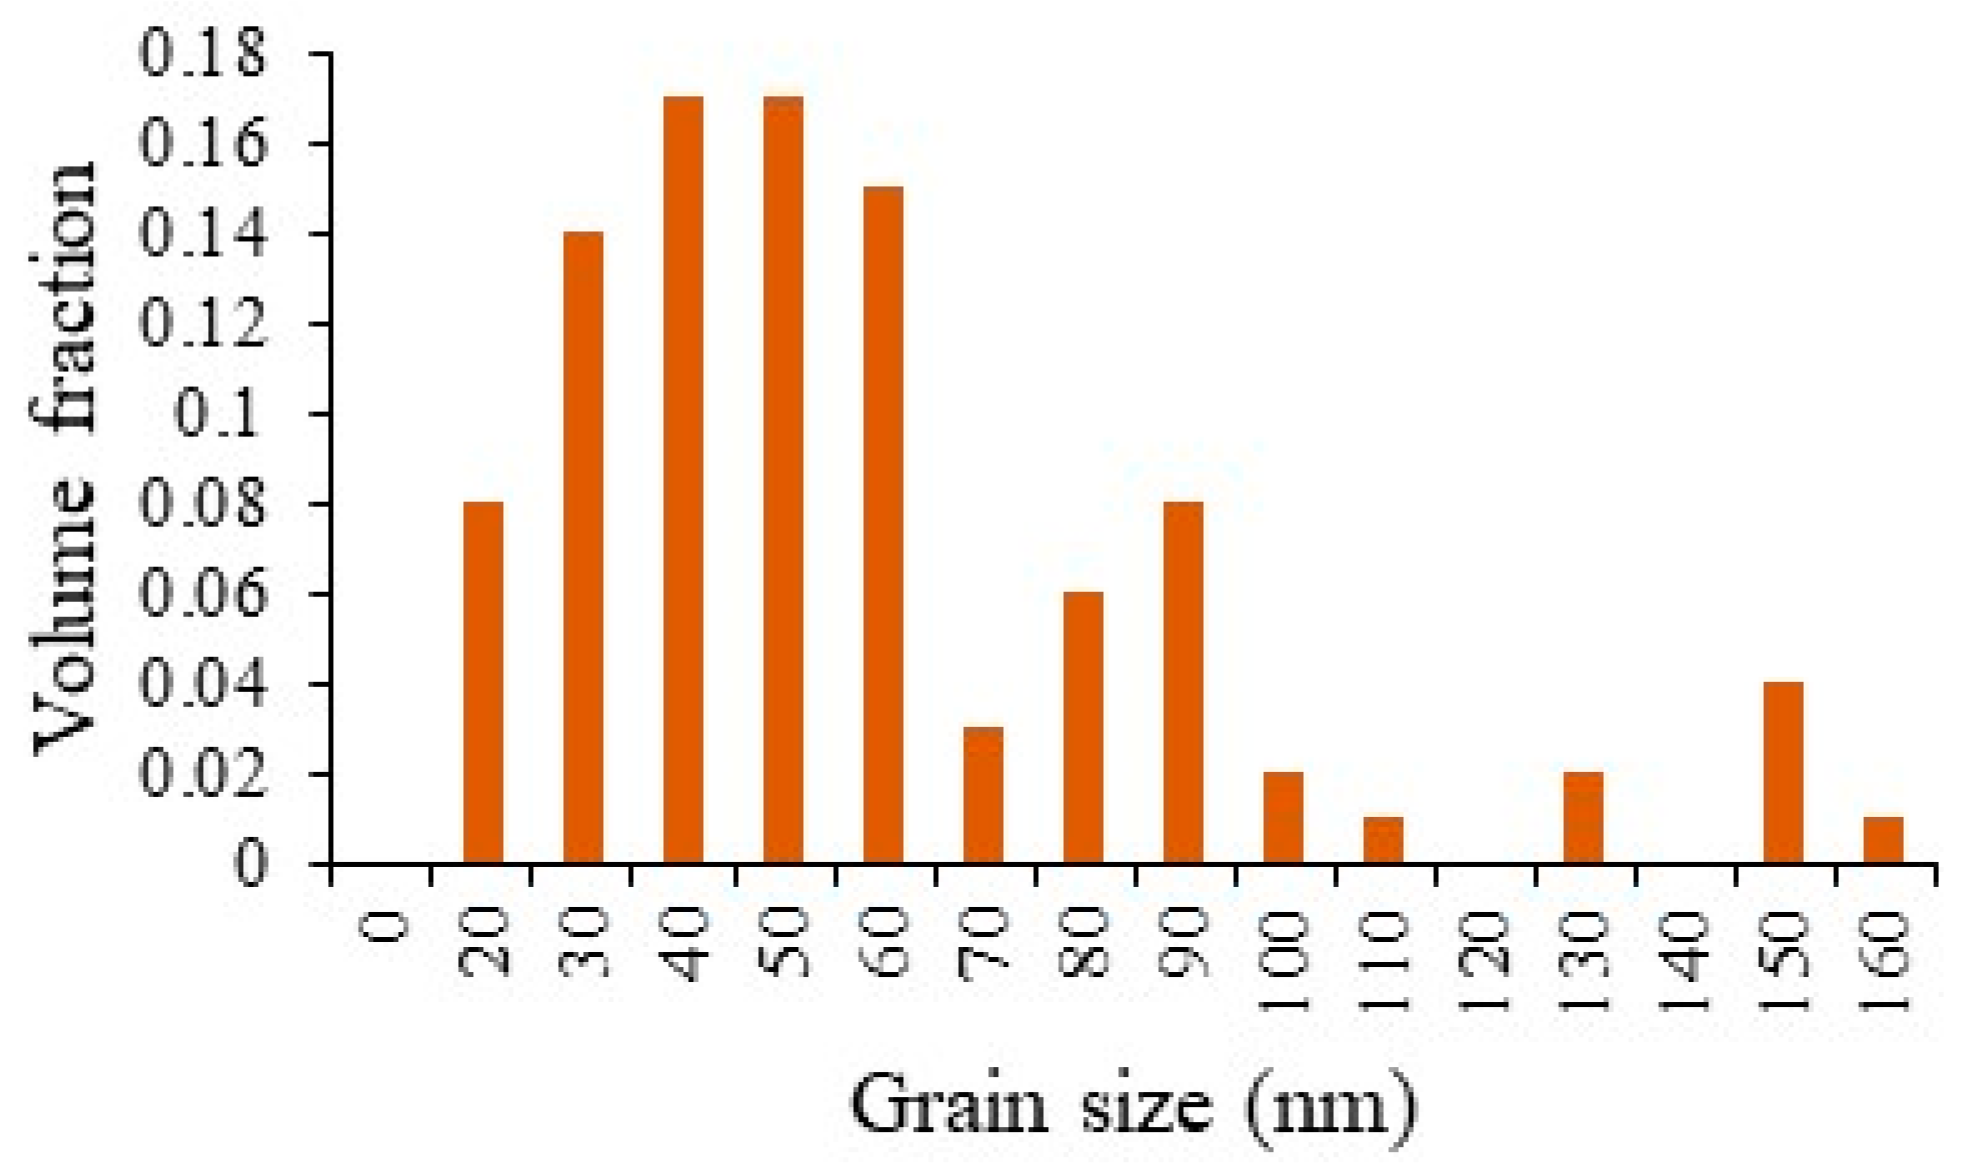
Utilizing the Finite Element model, the overall mechanical response of the RVE was simulated for the case study of nanocrystalline copper with GI size and GB thickness equal to 54 nm and 1 nm, respectively. Figure 12 shows compares the indicative stress-strain response derived from the RVE with the experimental curve obtained from the tension test on nanocrystalline copper [26] with a grain size distribution shown in Figure 13.
3.3. Numerical Parametric Study on Mechanical Behavior of Nanocrystalline Copper
3D Voronoi inclusion-reinforced models were randomly generated by applying the Christoffersen formula [10]. In the present work, several numerical cases were executed so as to define the importance of the size of the Voronoi inclusion on the mechanical response of these composite-like metals (NS materials) and the importance of GB thickness.
3.3.1. Young’s and Shear Moduli
The numerical outcomes indicated that the importance of the Voronoi inclusion sizes on the effective mechanical behavior was trivial in the elastic regime. Considering the aforementioned fact and utilizing several numerical analyses by varying the Voronoi inclusion sizes, the effective mechanical properties of these composite-like structures were calculated for up to 95% volume fractions.
The outcomes of the proposed finite element methodology were associated with various analytical approaches, such as M-T and RoM. A few numerical analyses were also executed so as to define the importance of the GB thickness on the effective mechanical properties of nanocrystalline materials.
Several case studies were utilized in order to define the effect of the Voronoi particle sizes on effective mechanical properties of these nanocrystalline metals in each of the three material directions. Figure 14 depicts the effect of the Voronoi inclusion size on the mechanical properties. In our numerical case, we retained the GB thickness constant by varying the particle size. Effective mechanical properties were calculated at the range of 83–95% volume fraction. From Figure 14, it can be noted that there were inconsequential fluctuations on the effective mechanical properties by changing the particle size.
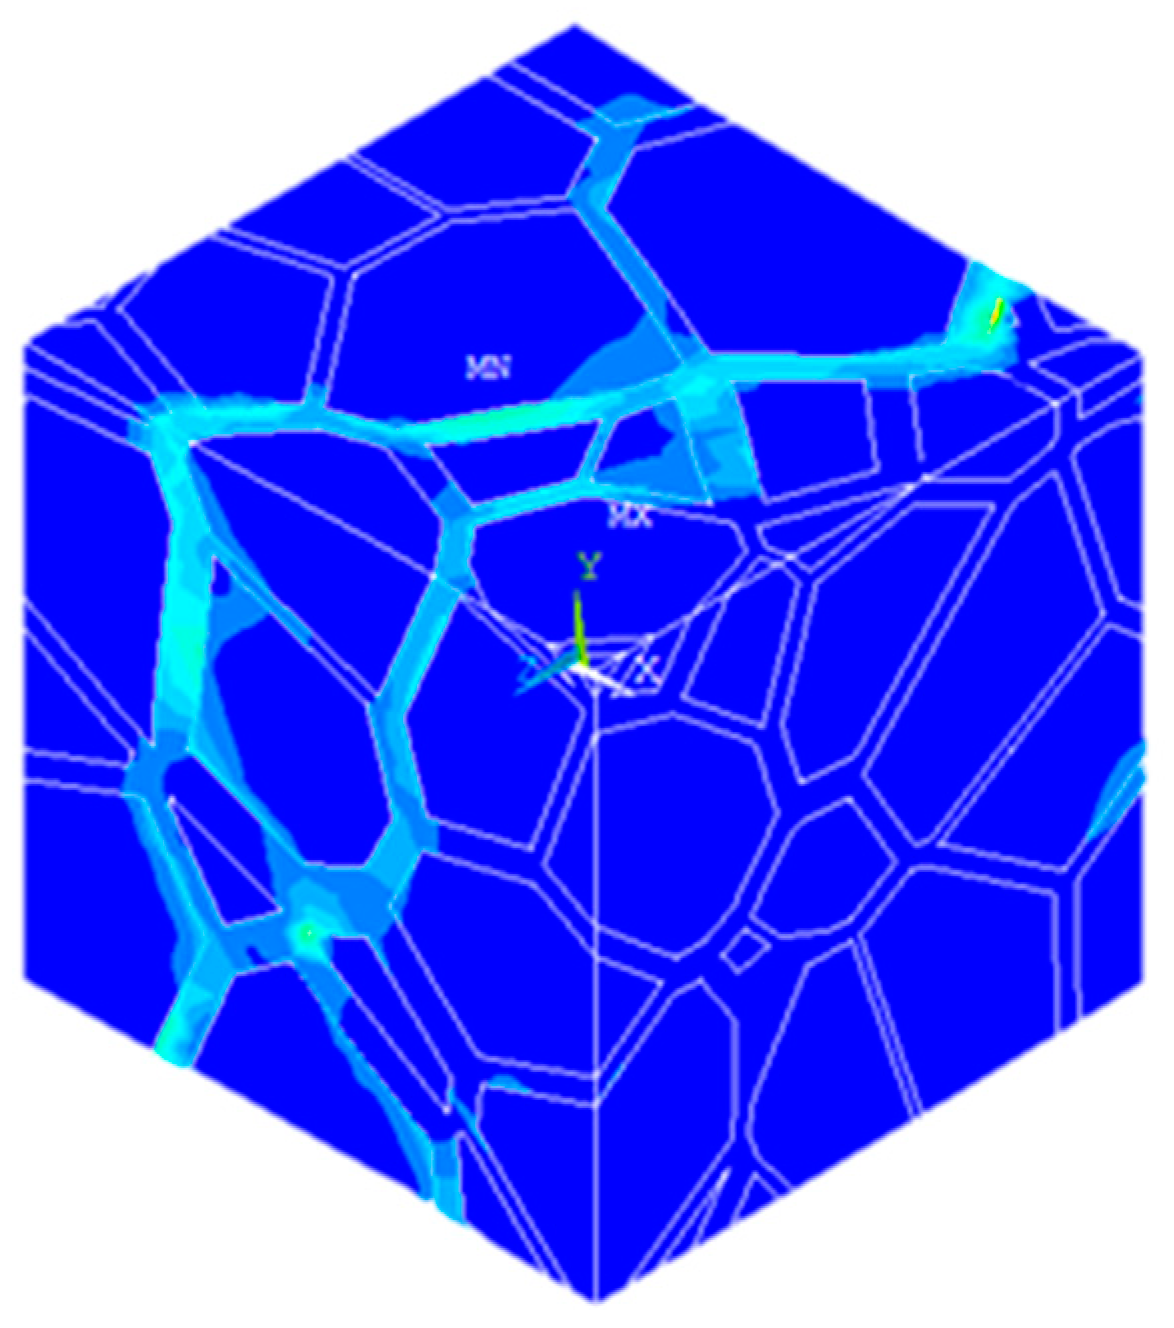
Figure 14 also presents the correlation between the calculated mechanical properties of the finite element technique and M-T approaches using the presumption that inclusions were modeled like spherical inclusions. Moreover, the outcomes of RoM approaches appeared with the previously mentioned examination; however, this analytical approach did not investigate the shape of the RVE inclusions. From the aforementioned cases, it can be noted that the mechanical response of the Voronoi two-component materials relied only on the volume fraction of the Voronoi inclusions. The particle sizes had a minor effect on the effective material properties in the elastic regime. The aforementioned FE results and analytical outcomes are in compliance with the FE outcomes of [21], which are referenced in Figure 14 as “Reference Paper”. In addition, Figure 15 depicts the indicative strain distribution in RVE, which was accommodated in the grain boundary phase. The strain distribution accumulated at the intergranular area because the boundary phase possessed a lower value of yield strength. In case of a numerical investigation of a more brittle material with trans-granular fracture, the grains (Voronoi-shaped inclusions) will be modeled with a higher value of yield strength than those of the grain boundaries phase, strictly following the aforementioned analytical expressions of Hall-Petch for the grain phase and the Wadsworth and Nieh expression for the grain boundary phase.
3.3.2. Yield Strength
According to the investigation of the effective yield stress, it should be noted that this stress drops at the GB phase, which is more deformable than the GI phase. Thus, plastic deformation is ideally absorbed at the GB phase.
Taking into consideration one crystallite with its adjacent GB phase, the mean yield stress for an RVE can be calculated depending on the crystallite size (d), the yield stress of the crystallite (σi), the GB definite thickness (t), and its yield stress (σgb).
By varying d, we change the value of σcr; despite this, the other related material parameters, t (grain boundary thickness) and σgb, continue being constant. The proposed parameter definition leads to the crystallite size dependency of macroscopic stress, as discussed extensively below.
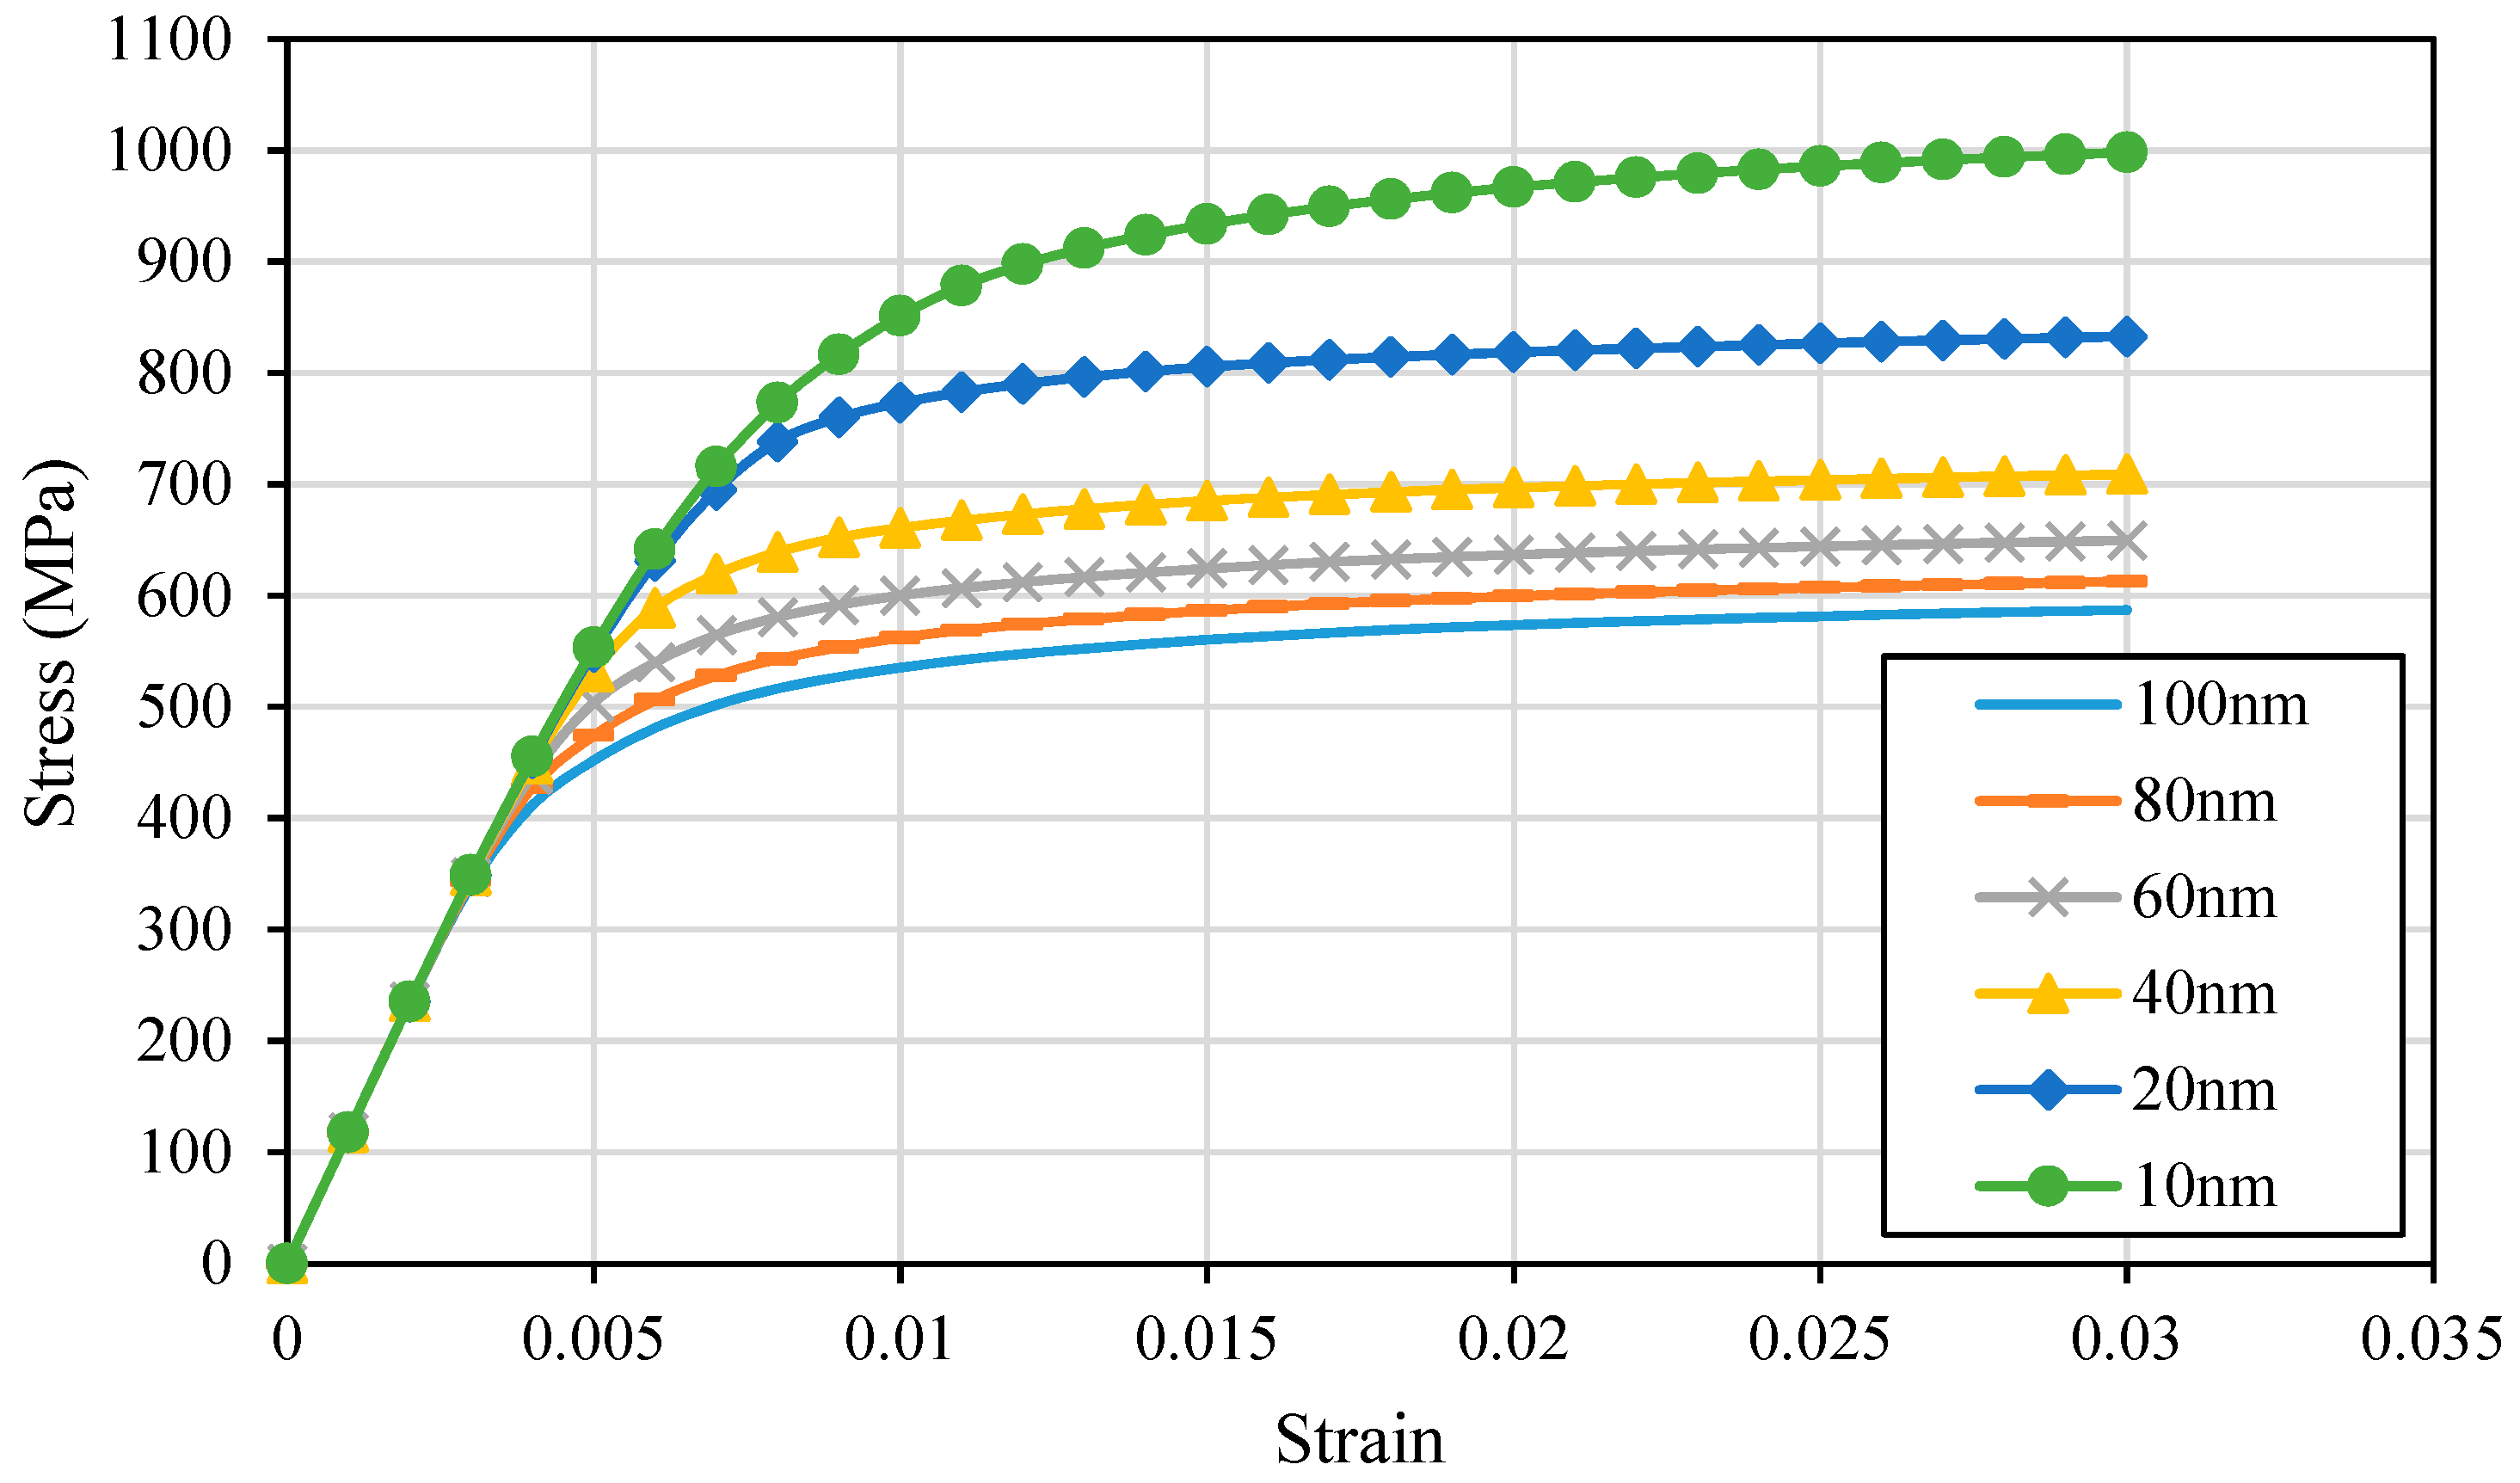
The indicative macroscopic stress–strain curves calculated from various mean grain sizes are shown in Figure 16. With regard to the above mentioned, these curves precisely revealed familiar properties of continuously yielding metals. The numerical results of parametric study are summarized in the Table 2. Furthermore, Figure 17 shows the yield strength in terms of the grain size dependency, taking into account the stress-strain curves of Figure 16. The values of yield stresses were significantly lower for crystallites following the grain size effect due to the smaller value of k in the Hall-Petch mathematical expression. A convincing relationship of the crystallite diameter was also shown, as expected for crystallite diameters varying from 10 to 60 nanometers. Outcomes received from the numerical analyses are presented in Figure 17 in the form of H-P plots. In the case of m = 1/2, the calculated values of the yield stress for mean crystallite size >20 nm depended linearly on d1/2. Moreover, this was not a simple effect of the d1/2 parameter of the H-P expression governing yield stress of single crystallites. The computed k value for nanocrystalline aggregates was smaller than the one presumed for crystallites (k = 0.135 MPa m^1/2). Outcomes shown in this numerical methodology clearly depicted the influence of crystallite size on the yield stress of nanocrystalline metals.
It should be noted that the model utilized in the current numerical investigation precisely estimated the mechanical properties of NS metals. Specifically, the crystallite size phenomenon and the Hall–Petch effect were clearly evident, which were results of the macroscopic deformation being preferentially aggregated at the GB phase.
This strain aggregate at grain boundaries is intrinsic to numerical models that consist of two phases assuming a composite-like microstructure of nanocrystalline metals. In view of this methodology, this kind of material can be presented as a system with a high volume fraction of inclusions—more accurately, as an arrangement of particles with strength, which is varied by changing the definite thin GB layer. The reaction of such an arrangement to load in the plastic deformation regime cannot be evaluated by a straightforward averaging of the reaction of its constituents due to the strain partitioning.
Consequently, a presumption of the H-P effect for the yield stress of GI phase does not require the H–P expression be applied to the accumulation. This is shown by the minor presence of critical crystallite size, underneath which one can notice the crystallite size softening.
4. Conclusions
The finite element homogenization methodology was utilized for the investigation of the overall mechanical properties of composite-like materials with Voronoi-reinforced inclusions. The elastic moduli of these composite-like materials were acquired by utilizing these tools in comparison to the outcomes of different analytical approaches. Our finite element predictions were closely associated with the M-T results and RoM estimations. A few case studies were examined in order to define the importance of the Voronoi inclusion size on the overall mechanical properties. The outcomes revealed that the general mechanical properties depend mainly on the volume fraction. There were minor variations in regard to the change in size of the Voronoi particles. This explanation is valid for elastic regime for the estimation of the effective mechanical properties only. There might be some impact on plastic case and damage predictions.
Further case studies need to be done in order to define the impact of the Voronoi particle size on the elastic-plastic response of NS materials at a macro-level. This can be done by investigating different numerical approaches. A generalized numerical methodology was utilized in order to compute various effective material parameters for all required volume fractions using DIGIMAT © and an estimation on the yield strength by changing the grain size on ANSYS APDL. This numerical homogenization approach diminishes the workload and can be utilized as a principle for computing the effective material properties of composite-like materials with randomly distributed Voronoi-shaped reinforced inclusions.
Author Contributions
S.P. and K.T. planned the project, the main conceptual ideas and proof outline, while P.B. worked out the technical details, and performed the numerical analysis for the suggested material.
Funding
This research was funded by ICARUS, grant agreement No. 713514. A European Union’s Horizon 2020 research and innovation programme.
Conflicts of Interest
The authors declare no conflict of interest.
References
- Kumar, K.; Van Swygenhoven, H.; Suresh, S. Mechanical behavior of nanocrystalline metals and alloys. The Golden Jubilee Issue—Selected topics in Materials Science and Engineering: Past, Present and Future, edited by S. Suresh. Acta Mater. 2003, 51, 5743–5774. [Google Scholar] [CrossRef]
- Meyers, M.; Mishra, A.; Benson, D. Mechanical properties of nanocrystalline materials. Progress Mater. Sci. 2006, 51, 427–556. [Google Scholar] [CrossRef]
- Pachla, W.; Kulczyk, M.; Smalc-Koziorowska, J.; Wróblewska, M.; Skiba, J.; Przybysz, S.; Przybysz, M. Mechanical properties and microstructure of ultrafine grained commercial purity aluminium prepared by cryo-hydrostatic extrusion. Mater. Sci. Eng. A 2017, 695, 178–192. [Google Scholar] [CrossRef]
- Kim, H.; Estrin, Y.; Bush, M. Plastic deformation behaviour of fine-grained materials. Acta Mater. 2000, 48, 493–504. [Google Scholar] [CrossRef]
- Estrin, Y.; Gottstein, G.; Shvindlerman, L. Diffusion controlled creep in nanocrystalline materials under grain growth. Scr. Mater. 2004, 50, 993–997. [Google Scholar] [CrossRef]
- Wei, Y.; Anand, L. Grain-boundary sliding and separation in polycrystalline metals: Application to nanocrystalline fcc metals. J. Mech. Phys. Solids 2004, 52, 2587–2616. [Google Scholar] [CrossRef]
- Fu, H.; Benson, D.; Meyers, M. Analytical and computational description of effect of grain size on yield stress of metals. Acta Mater. 2001, 49, 2567–2582. [Google Scholar] [CrossRef]
- Volpp, T.; Göring, E.; Kuschke, W.; Arzt, E. Grain size determination and limits to Hall-Petch behavior in nanocrystalline NiAl powders. Nanostruct. Mater. 1997, 8, 855–865. [Google Scholar] [CrossRef]
- Diehl, J. Verfestigungskurven und Oberflächenerscheinungen. Z. Met. 1956, 47, 331–343. [Google Scholar]
- Suzuki, H.; Ikeda, S.; Takeuchi, S. Deformation of Thin Copper Crystals. J. Phys. Soc. Jpn. 1956, 11, 382–393. [Google Scholar] [CrossRef]
- Fu, H.; Benson, D.; André Meyers, M. Computational description of nanocrystalline deformation based on crystal plasticity. Acta Mater. 2004, 52, 4413–4425. [Google Scholar] [CrossRef]
- Benson, D. Computational methods in Lagrangian and Eulerian hydrocodes. Comput. Methods Appl. Mech. Eng. 1992, 99, 235–394. [Google Scholar] [CrossRef]
- Bazios, P.; Tserpes, K.; Pantelakis, S. Computation of elastic moduli of nanocrystalline materials using Voronoi models of representative volume elements. MATEC Web Conf. 2018, 188, 02006. [Google Scholar] [CrossRef]
- Kim, H.; Estrin, Y.; Bush, M. Constitutive modelling of strength and plasticity of nanocrystalline metallic materials. Mater. Sci. Eng. A 2001, 316, 195–199. [Google Scholar] [CrossRef]
- Kim, H.; Suryanarayana, C.; Kim, S.; Chun, B. Numerical Investigation of Mechanical Behaviour of Nanocrystalline Copper. Powder Metall. 1998, 41, 217–220. [Google Scholar] [CrossRef]
- Mori, T.; Tanaka, K. Average stress in matrix and average elastic energy of materials with misfitting inclusions. Acta Metall. 1973, 21, 571–574. [Google Scholar] [CrossRef]
- Eshelby, J. The determination of the elastic field of an ellipsoidal inclusion, and related problems. Proc. R. Soc. London. Ser. A Math. Phys. Sci. 1957, 241, 376–396. [Google Scholar]
- Benveniste, Y. A new approach to the application of Mori-Tanaka’s theory in composite materials. Mech. Mater. 1987, 6, 147–157. [Google Scholar] [CrossRef]
- Hu, J.; Han, S.; Sun, G.; Sun, S.; Jiang, Z.; Wang, G.; Lian, J. Effect of strain rate on tensile properties of electric brush-plated nanocrystalline copper. Mater. Sci. Eng. A 2014, 618, 621–628. [Google Scholar] [CrossRef]
- Van Swygenhoven, H.; Farkas, D.; Caro, A. Grain-boundary structures in polycrystalline metals at the nanoscale. Phys. Rev. B 2000, 62, 831–838. [Google Scholar] [CrossRef]
- Dobosz, R.; Lewandowska, M.; Kurzydlowski, K. The effect of grain size diversity on the flow stress of nanocrystalline metals by finite-element modelling. Scr. Mater. 2012, 67, 408–411. [Google Scholar] [CrossRef]
- Online Materials Information Resource-MatWeb. Available online: http://www.matweb.com/ (accessed on 23 October 2018).
- Callister, W.; Rethwisch, D. Materials Science and Engineering; John Wiley & Sons: Hoboken, NJ, USA, 2012. [Google Scholar]
- Nieh, T.; Wadsworth, J. Hall-petch relation in nanocrystalline solids. Scr. Metall. Mater. 1991, 25, 955–958. [Google Scholar] [CrossRef]
- Hill, R. A theory of the yielding and plastic flow of anisotropic metals. Proc. R. Soc. London. Ser. A Math. Phys. Sci. 1948, 193, 281–297. [Google Scholar]
- Cheng, S.; Ma, E.; Wang, Y.; Kecskes, L.; Youssef, K.; Koch, C.; Trociewitz, U.; Han, K. Tensile properties of in situ consolidated nanocrystalline Cu. Acta Mater. 2005, 53, 1521–1533. [Google Scholar] [CrossRef]
Figure 1.
Representation of rule of mixtures (RoM) approach.

Figure 2.
Illustration demonstrating an inclusion embedded in an infinite body.

Figure 3.
Representation of the Mori-Tanaka (M-T) analytical approach.

Figure 4.
A TEM illustration of the nanocrystalline Copper.

Figure 5.
Implementation of point seeders.

Figure 6.
Creation of a periodic set of Voronoi vertices for implication of a periodic microstructure.
Figure 6.
Creation of a periodic set of Voronoi vertices for implication of a periodic microstructure.

Figure 7.
Algorithm for intersecting a Voronoi cell (VC) and the unit cell (UC).

Figure 8.
Voronoi unit cell.

Figure 9.
Meshed Voronoi unit cell.

Figure 10.
Breakdown of pile up mechanism: (a) microcrystalline level and (b) nanocrystalline level.
Figure 10.
Breakdown of pile up mechanism: (a) microcrystalline level and (b) nanocrystalline level.

Figure 11.
Applied boundary conditions (BCs) in the tensile numerical analysis.

Figure 12.
Comparison of the experimental and numerical outcomes of nanocrystalline copper with a grain size of 54 nm under tensile testing.
Figure 12.
Comparison of the experimental and numerical outcomes of nanocrystalline copper with a grain size of 54 nm under tensile testing.

Figure 13.
Grain size distribution of nanocrystalline copper used in the experimental test.

Figure 14.
Comparison of FE and analytical outcomes of nanostructured materials for (a) Young’s modulus of elasticity and (b) Shear modulus in each of three material directions, applying a constant value of 1 nm for the GB thickness.
Figure 14.
Comparison of FE and analytical outcomes of nanostructured materials for (a) Young’s modulus of elasticity and (b) Shear modulus in each of three material directions, applying a constant value of 1 nm for the GB thickness.

Figure 15.
Illustration of strain distribution into representative volume element (RVE) subjected to uniaxial tensile loading.
Figure 15.
Illustration of strain distribution into representative volume element (RVE) subjected to uniaxial tensile loading.

Figure 16.
The numerical outcomes of nanocrystalline NC copper for the investigation of the elastoplastic behavior by varying the grain size from 100 nm to 10 nm.
Figure 16.
The numerical outcomes of nanocrystalline NC copper for the investigation of the elastoplastic behavior by varying the grain size from 100 nm to 10 nm.

Figure 17.
The numerical results of NC copper presenting the crystallite size dependency on the yield strength.
Figure 17.
The numerical results of NC copper presenting the crystallite size dependency on the yield strength.


Table 1.
Material properties used in the simulations.
| Phases | Young Modulus [GPa] | Yield Stress (MPa) | Poisson Ratio | Work Hardening Coefficient (MPa) | |
|---|---|---|---|---|---|
| Grains | 120 | σ10 nm = 1385 | σ60 nm = 584 | 0.336 | 315 |
| σ20 nm = 988 | σ80 nm = 510 | ||||
| σ40 nm = 708 | σ100 nm = 460 | ||||
| Grain Boundaries | 96 | - | 0.336 | 315 | |
Table 2.
Numerical findings of parametric study.
| Grain Size (nm) | Young’s Modulus (GPa) | Yield Strength (MPa) | Ultimate Tensile Strength (MPa) |
|---|---|---|---|
| 100 | 119.6 | 390 | 580 |
| 80 | 119.2 | 455 | 612 |
| 60 | 118.8 | 503 | 649 |
| 40 | 118.1 | 588 | 709 |
| 20 | 116.5 | 694 | 832 |
| 10 | 115.8 | 816 | 998 |
© 2019 by the authors. Licensee MDPI, Basel, Switzerland. This article is an open access article distributed under the terms and conditions of the Creative Commons Attribution (CC BY) license (http://creativecommons.org/licenses/by/4.0/).
Share and Cite
MDPI and ACS Style
Bazios, P.; Tserpes, K.; Pantelakis, S. Numerical Computation of Material Properties of Nanocrystalline Materials Utilizing Three-Dimensional Voronoi Models. Metals 2019, 9, 202. https://doi.org/10.3390/met9020202
AMA Style
Bazios P, Tserpes K, Pantelakis S. Numerical Computation of Material Properties of Nanocrystalline Materials Utilizing Three-Dimensional Voronoi Models. Metals. 2019; 9(2):202. https://doi.org/10.3390/met9020202
Chicago/Turabian StyleBazios, Panagiotis, Konstantinos Tserpes, and Spiros Pantelakis. 2019. "Numerical Computation of Material Properties of Nanocrystalline Materials Utilizing Three-Dimensional Voronoi Models" Metals 9, no. 2: 202. https://doi.org/10.3390/met9020202
Note that from the first issue of 2016, this journal uses article numbers instead of page numbers. See further details here.