Dynamic Recrystallization and Hot-Working Characteristics of Ni-Based Alloy with Different Tungsten Content


1
College of Materials and Metallurgy, Inner Mongolia University of Science & Technology, Baotou 014010, China
2
Institute for Special Steels, Central Iron and Steel Research Institute, Beijing 100081, China
*
Author to whom correspondence should be addressed.
Metals 2019, 9(3), 298; https://doi.org/10.3390/met9030298
Submission received: 27 January 2019
/
Revised: 18 February 2019
/
Accepted: 1 March 2019
/
Published: 6 March 2019
(This article belongs to the Special Issue Alloys for High-Temperature Applications)
Abstract
:The hot deformation behavior of the GY200 Ni-based alloys with different tungsten (W) content were investigated by means of hot compression tests, microscopic observations, and processing maps at temperatures between 950 °C and 1200 °C, strain rate between 0.01 s−1 and 10 s−1 with strain of 0.9. The hyperbolic-sine type constitutive equations were established between peaks tress and deformation conditions through Z parameters, and for alloys with higher W content results in higher activation energy and complete recrystallization temperature. The hot-working maps were exploited based on the experimental data. The hot-working maps showed that the instability zone extended with increasing W content. The stable domain of alloys are located in the temperature range between 1025 °C and 1200 °C and strain rate range between 0.01 s−1 and 1 s−1, dominated by the dynamic recrystallization (DRX) microstructural evolution, suited for hot deformation. The cracking on the surface of the sample compressed at 950 °C was resulted from the tensile stress, while the fracture of the sample compressed at 1200 °C was triggered by the melting of grain boundaries.
1. Introduction
To reduce CO2 emissions, advanced ultra-supercritical technology (A-USC) has been developed in recent years to improve the steam parameters and pulverized coal-fired efficiency [1,2,3]. A-USC yields a maximum steam temperature of 700 °C or above. However, the creep rupture strength of conventional heat-resistant steels is inadequate for boiler and steam turbine components [4]. Nickel (Ni)-based alloys possess higher creep rupture strength than heat-resistant steels, which have been produced primarily for use in the main steam pipes and turbine rotors in A-USC power plants [5,6,7]. The precipitation-strengthened forged Ni-based alloy is commonly used for aircraft and gas turbine components [8,9] (e.g., blades sand disks). Owing to their high melting points, tungsten (W) and molybdenum (Mo) are commonly occurring elements in Ni-based alloys. W has a larger atomic radius than Mo and, hence, may result in greater matrix lattice expansion and higher yield strength of the alloy [10,11]. In the present work, W was used to replace partial Mo with the aim of obtaining excellent creep rupture strength of the Waspaloy Ni-based alloy to acquire a new alloy which was referred to as GY200 [12,13]. However the hot workability of the new alloys is affected to some extent when superabundant W is added. In order to explain the mechanisms of hot deformation and correlate the flow stress and microstructure evolution, hot deformation constitutive equations were invented to describe the hot deformation behaviors of the GY200 super alloys. Constitutive equations of the alloys with different W content are established based on the stress-strain curves obtained by compression at different temperatures and deformation rates. The hot deformation of super alloys is very complex including work hardening (WH), dynamic recovery (DRV) and dynamic recrystallization (DRX) [14]. The effect of W addition on WH, DRV and DRX is studied by analysing the microstructure evolution in this paper. Moreover, the hot-working maps, which are based on the dynamic materials model (DMM) [15], have proven an excellent response of the processing optimization and an excellent tool for monitoring the microstructural evolution of a material. The optimum thermal deformation parameters are worked out based on the hot-working maps and the microstructure.
2. Experimental Material and Procedures
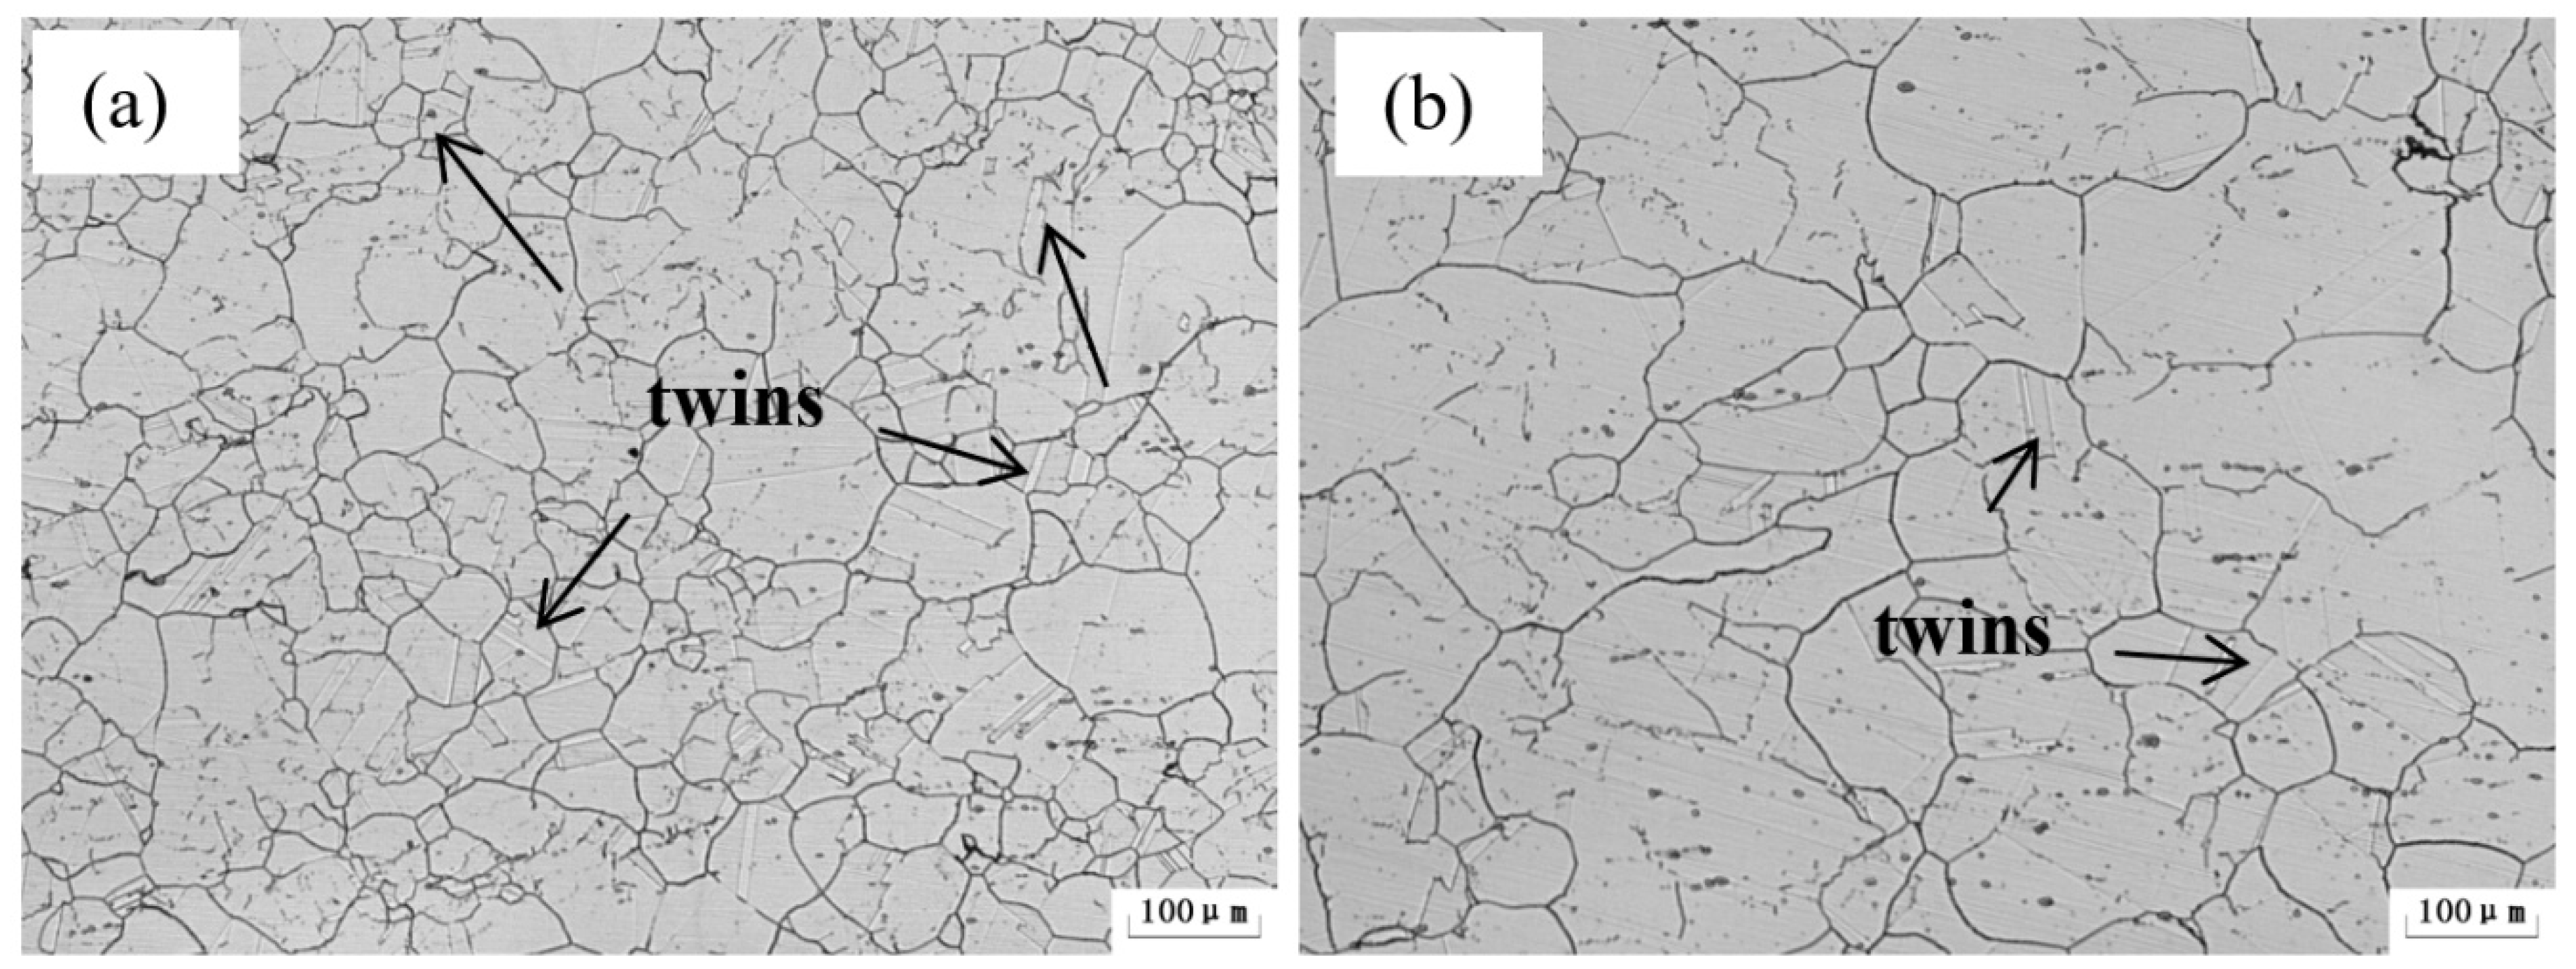
Two GY200 Ni-based alloys with different W content were melted via vacuum induction, poured into 25 kg ingots, and subsequently forged into a rod (diameter: 16 mm; See Table 1 for the chemical compositions). These alloys were subjected to solution heat treatment with an aging heat treatment performed as a series of sequential heating steps, namely: 1080 °C for 4 h (oil cooling), 845 °C for 24 h (air cooling), and 760 °C for 16 h (air cooling). Figure 1 shows the optical microstructure (OM) images of the solution-annealed and aged experimental alloys with different W contents (2W: the W content of the alloy is 2%; 4W: the W content of the alloy is 4%). Figure 1a,b shows that the microstructure consists of equiaxed grains with some annealing twins which have been marked with arrows.
The evolution of the stress–strain curves of alloys subjected to different deformation temperatures and deformation rates has been investigated via hot compression testing (Gleeble-3800, Dynamic Systems Inc., New York, NY, USA). Samples for this testing were processed into cylindrical rods (diameter: 8 mm, height: 15 mm). Tantalum flakes were used as a lubricant on both ends of the samples to reduce the friction during deformation. The test samples were all heated to 1200 °C at a heating rate of 10 °C/s, cooled to distortion temperatures at a rate of 5 °C/s, and kept warm for 10 min to ensure temperature uniformity prior to compression. The sample was deformed to a true strain of 0.9 at strain rates of 0.01 s−1, 0.1 s−1, 1 s−1, and 10 s−1 and deformation temperatures of 950 °C, 1000 °C, 1050 °C, 1100 °C, 1150 °C, and 1200 °C, the standard of ASTM E209-2000(2010) was used for testing. After the deformation, the samples were quenched in water. Similarly, after compression, the samples were segmented along the reduction axis at the middle diameter using a wire cutting method. These samples were then polished with a solution of 200 mL HCl, 10 g CuCl2, and 200 mL ethanol. The microstructures of the polished alloys were observed via optical microscope. The microstructures of dynamic recovery and dynamic recrystallized grains were observed using a transmission electron microscope (TEM Jeol-2100, JEOL Ltd, Tokyo, Japan).
EBSD (Electron Back-Scattered Diffraction) samples were prepared by mechanical polishing and electropolishing sequentially, and electro polishing was executed in a 10% perchloric acid ethanol solution at 15 V for 12 s and at room temperature. The EBSD analysis was executed by a FEI(Field Electron and Ion Co.,) Quanta 650 scanning electron microscope (SEM, FEI, Hillsboro Oregon, OR, USA) at 25 kV, and the sample scans were executed at an area of 301 μm × 301 μm with a step size of 0.7 to 1.0 μm, a hit ratio greater than 90% and a single FCC phase. The acquired EBSD documents were analyzed by Tango program in the Channel 5 software, and the data obtained from EBSD analysis include band contrast (CB) maps, grain boundaries (GBs) misorientation distribution and the recrystallized fraction.
The grain boundaries can be defined as low-angle grain boundaries (LAGBs) (the misorientations of angle θ in the range of 0–15°) and high-angle grain boundaries (HAGBs) (with misorientations of angle θ > 15°) [16], EBSD has been used to obtain the data of GB misorientations distribution in this paper .
3. Results and Discussion
3.1. True Stress–True Strain Curves
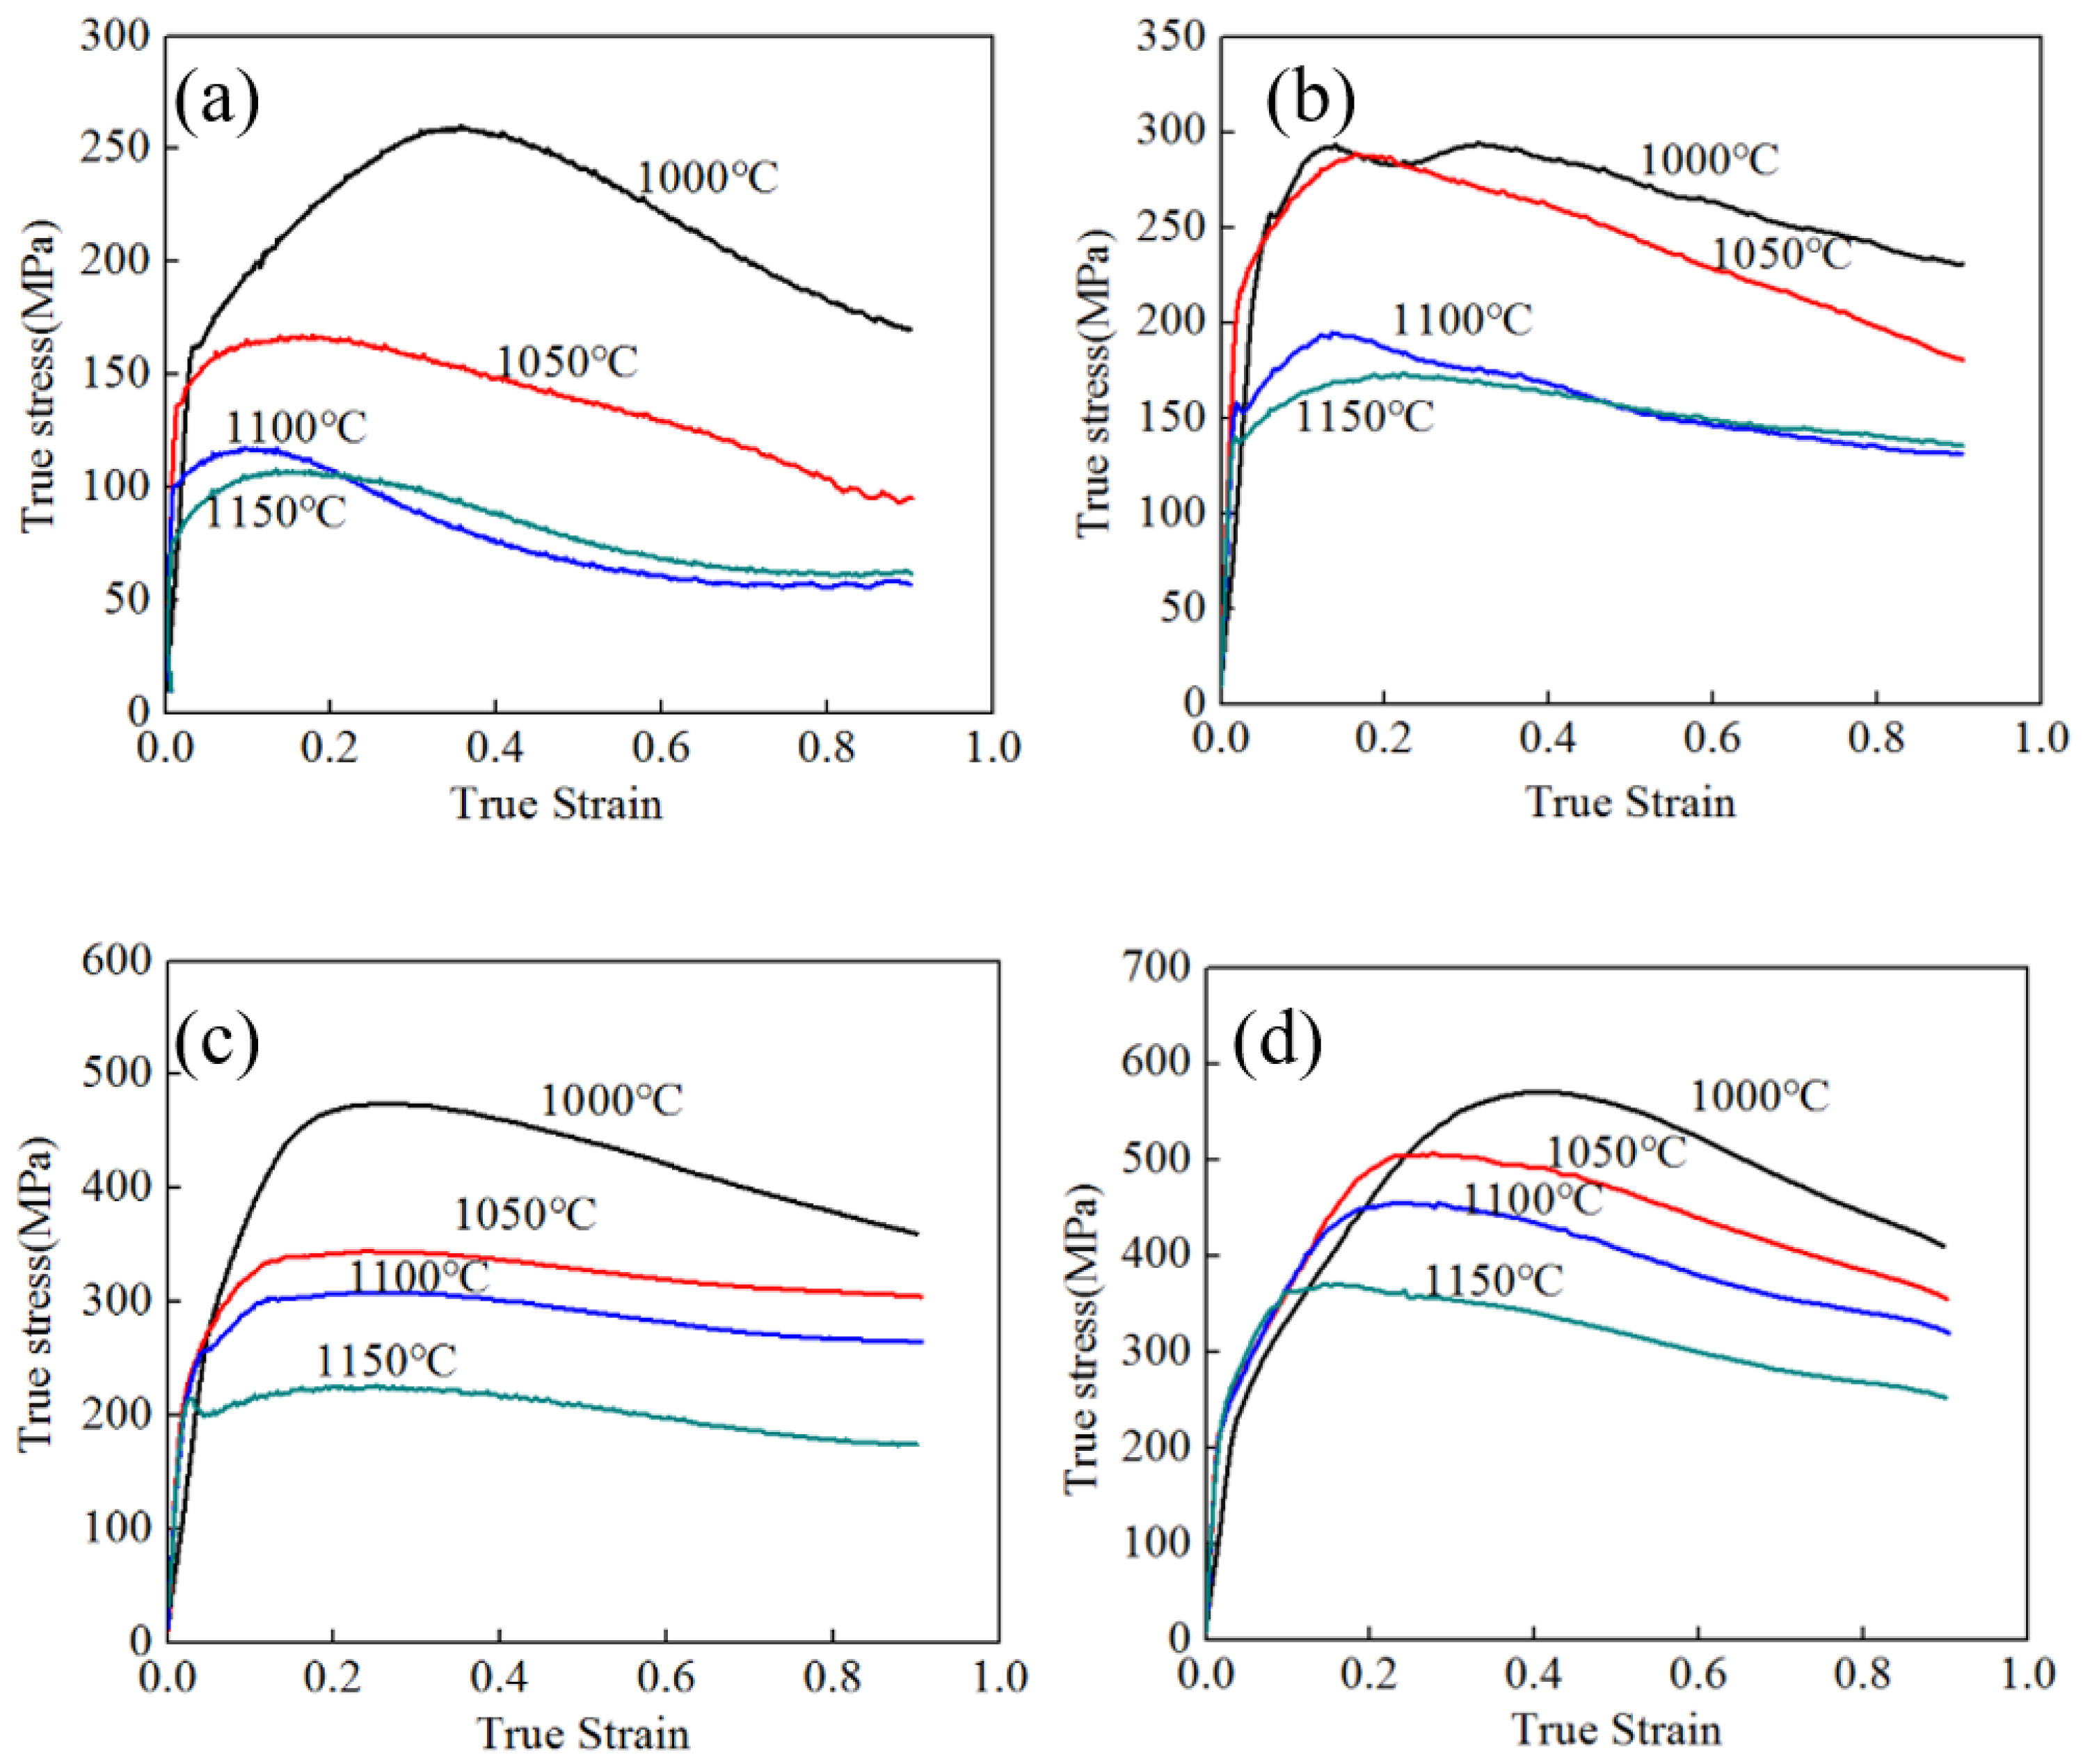
The true strain–true stress curves of Ni-based alloys with different W contents under several compression temperatures are shown in Figure 2 and Figure 3. The strain curves show the typical two-stage process. In the first stage, the work-hardening effect is larger than the softening effect and is accompanied by an increase in the dislocation density; this combination results in a rapid increase in the flow stress (until a maximum value is reached), with increasing true strain. The true stress decreases slowly during the second stage. In this stage, dynamic recovery (DRV) and dynamic recrystallization (DRX) have occurred during the compression process, and work-hardening is simultaneously balanced by softening [17]. The peak strain increases (in general) with increasing strain rate and decreasing deformation temperature, as shown in Figure 2 and Figure 3. A previous study showed that DRX occurred more easily at higher strain rates and lower deformation temperatures (than at lower rates and higher temperatures) and was, therefore, the primary softening mechanism in Ni-based alloy [18,19]. The stress curves of the alloy corresponding to deformation at 1000 °C and 0.01 s−1 (2W) and at 1000 °C and 0.1 s−1 (2W) fluctuated significantly, owing to fluctuations in the measurements; and at 1000 °C and 0.1 s−1 (4W) is correct.
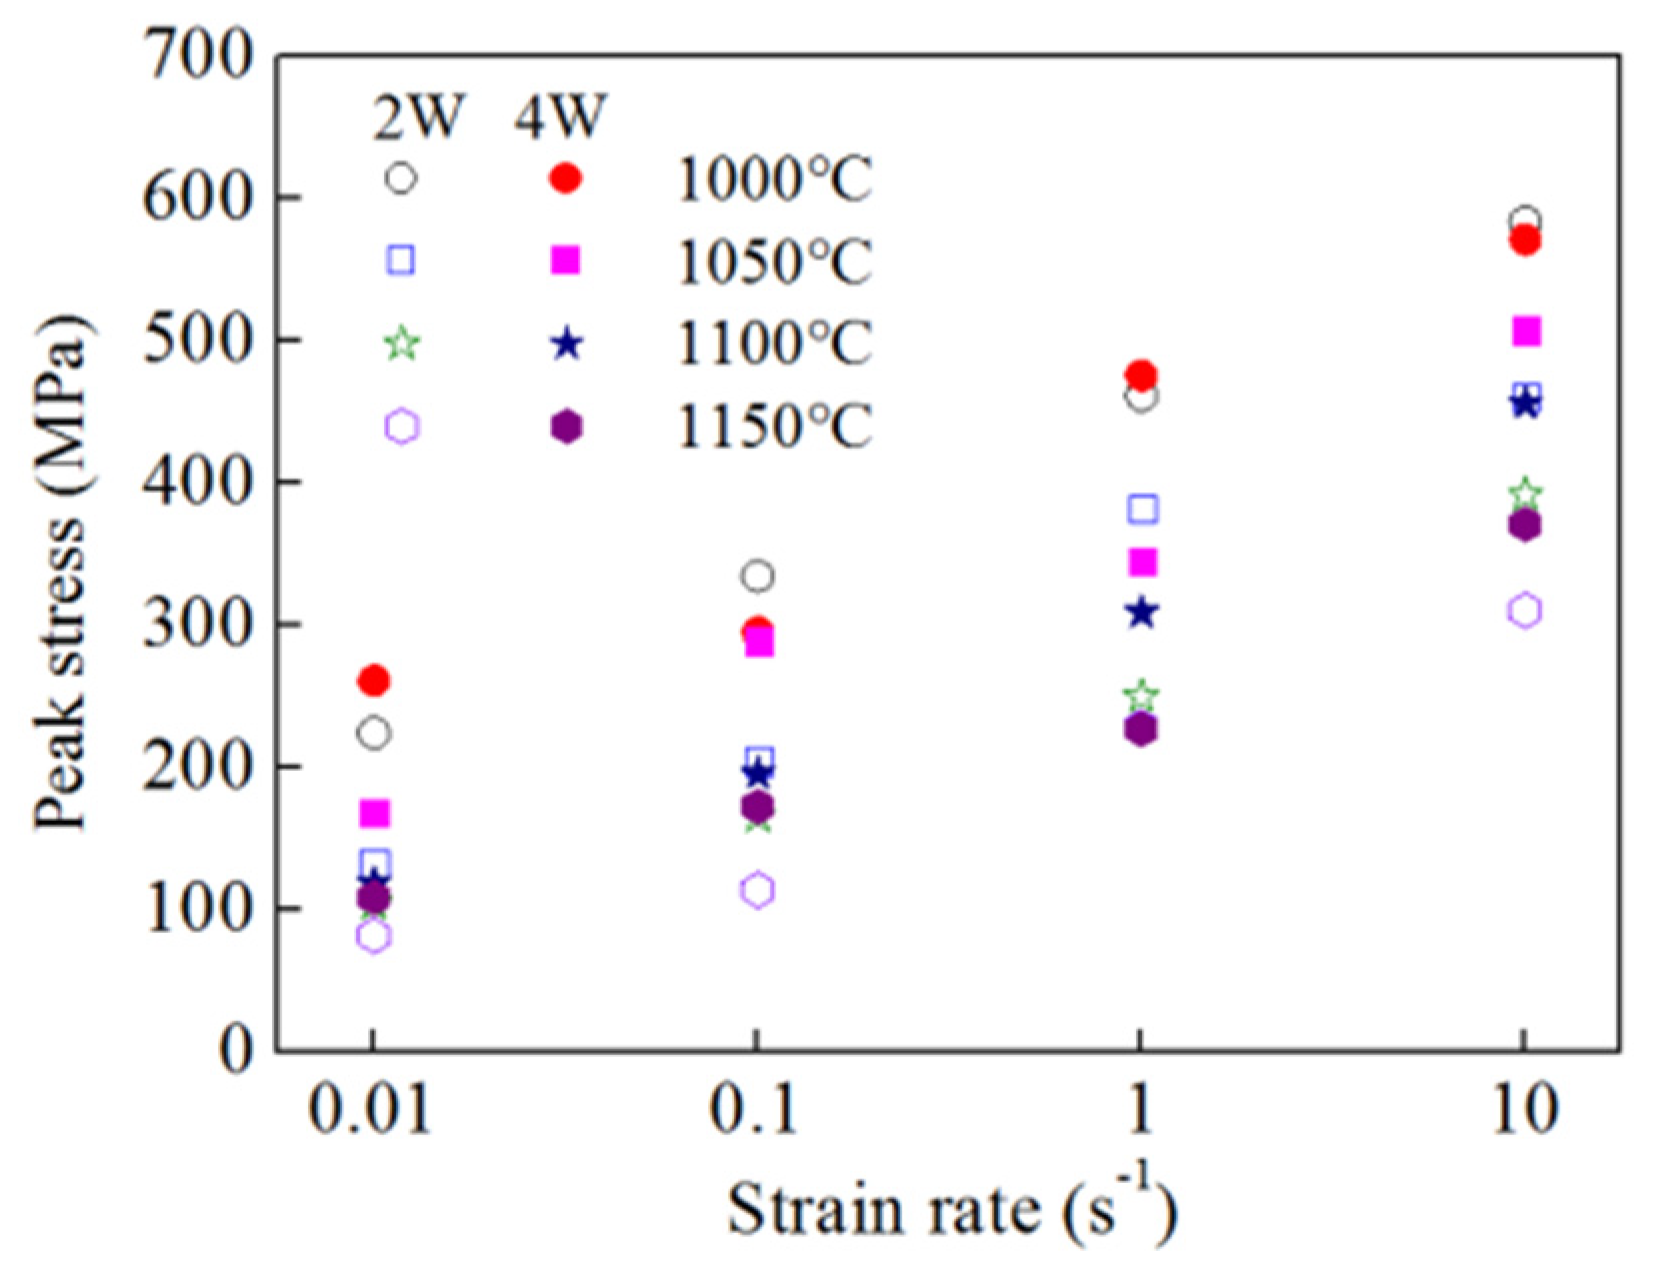
The peak stresses and peak strains are shown in Figure 4. The peak stress is inversely proportional to the strain rate at specific de-formation temperatures or the temperature at a specific strain rate. This results mainly from the fact that DRX is a thermally activated process. The DRX process could be activated at a relatively high deformation strain rate and deformation temperature. In general, the peak stress of 4W was higher than that of 2W, owing to the higher W content, which increased the solid solution strengthening effect and the deformation resistance. From the experimental data, it could be found that the peak stresses for 2W at 1000 °C at 1 s−1 and 1050 °C at 0.1 s−1 are higher than that of 4W. The probable reason for this is that the GY200 Ni-based alloys contain some strengthening phases such as TiC, M23C6 and γ′ phases [20]; these precipitated phases could not resolve completely during heating before hot compression, and thus the peak stress decreases due to the reduction of soluble atoms that hindered dislocation movement. Moreover, the non-uniform microstructure and different lubrication in experiments would affect the peak stress as well.
3.2. The Constitutive Equations
For reducing the defect density of alloys during forging or rolling in industrial processing, the deformation temperature and deformation rate are commonly calculated by empirical formulas. According to previous studies [21,22], the relationship among the peak stress, deformation temperature, and strain rate can be described by a universal hyperbolic sine function, which is given as follows:
where : strain rate; : peak stress; Q is the activation energy of deformation; R: gas constant (8.314 J/(mol·K); A: material constant; and T: deformation temperature. α is a constant and can be defined by α = β/n′, at constant temperature, β and n′ can be expressed by Equations (2) and (3), respectively. The detailed solutions refer to reference [23,24].
In Equation (1), n is the stress exponent, which is determined from:
If the strain rate is constant, the activation energy Q can be expressed as follows:
The value of the stress exponent, n, is then related to ln[sinh(ασp)] and ln, and which can be obtained by Equation (4), and the relationship between ln[sinh(α)] and 104/T is usually expressed in K; the activation energy Q can then be described by following equation:
Q = RnK
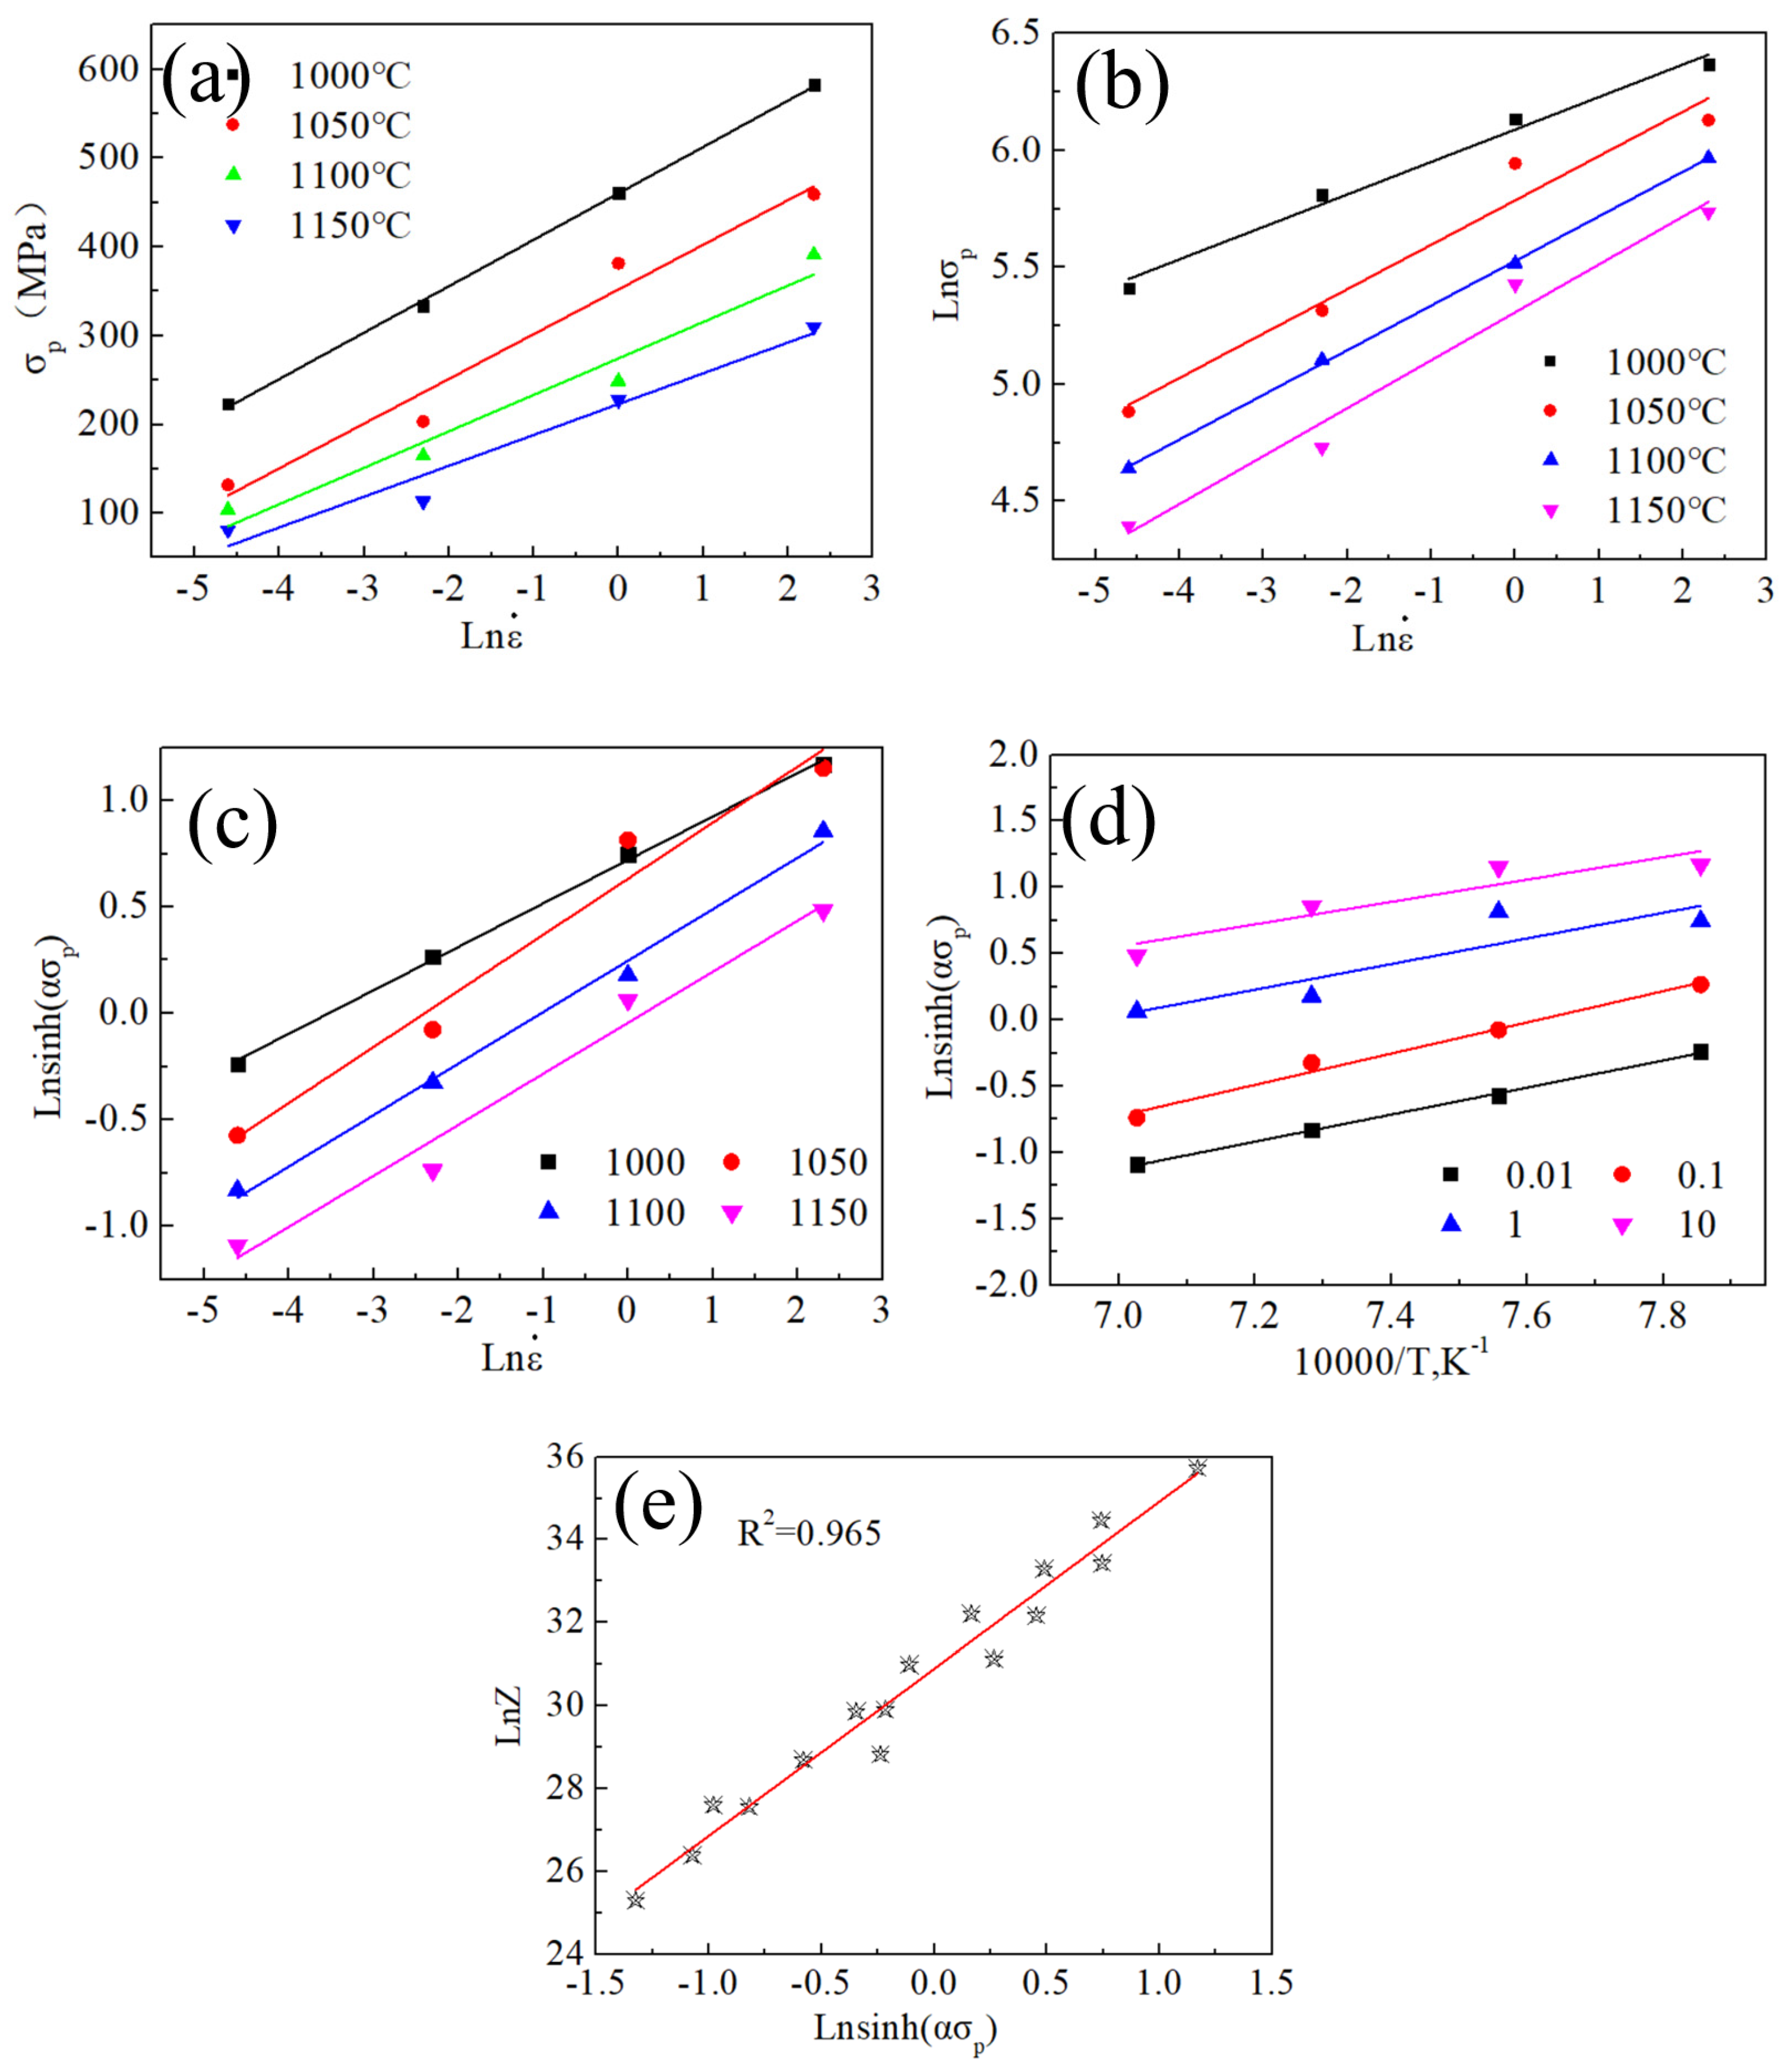
From Equations (2) and (3), the average values of β and n′ can be obtained from the linear slope of the of and −, respectively. Then, the parameter α of 2W is 0.00424 (β = 0.023, n′ = 5.425) (see Figure 5a,b).
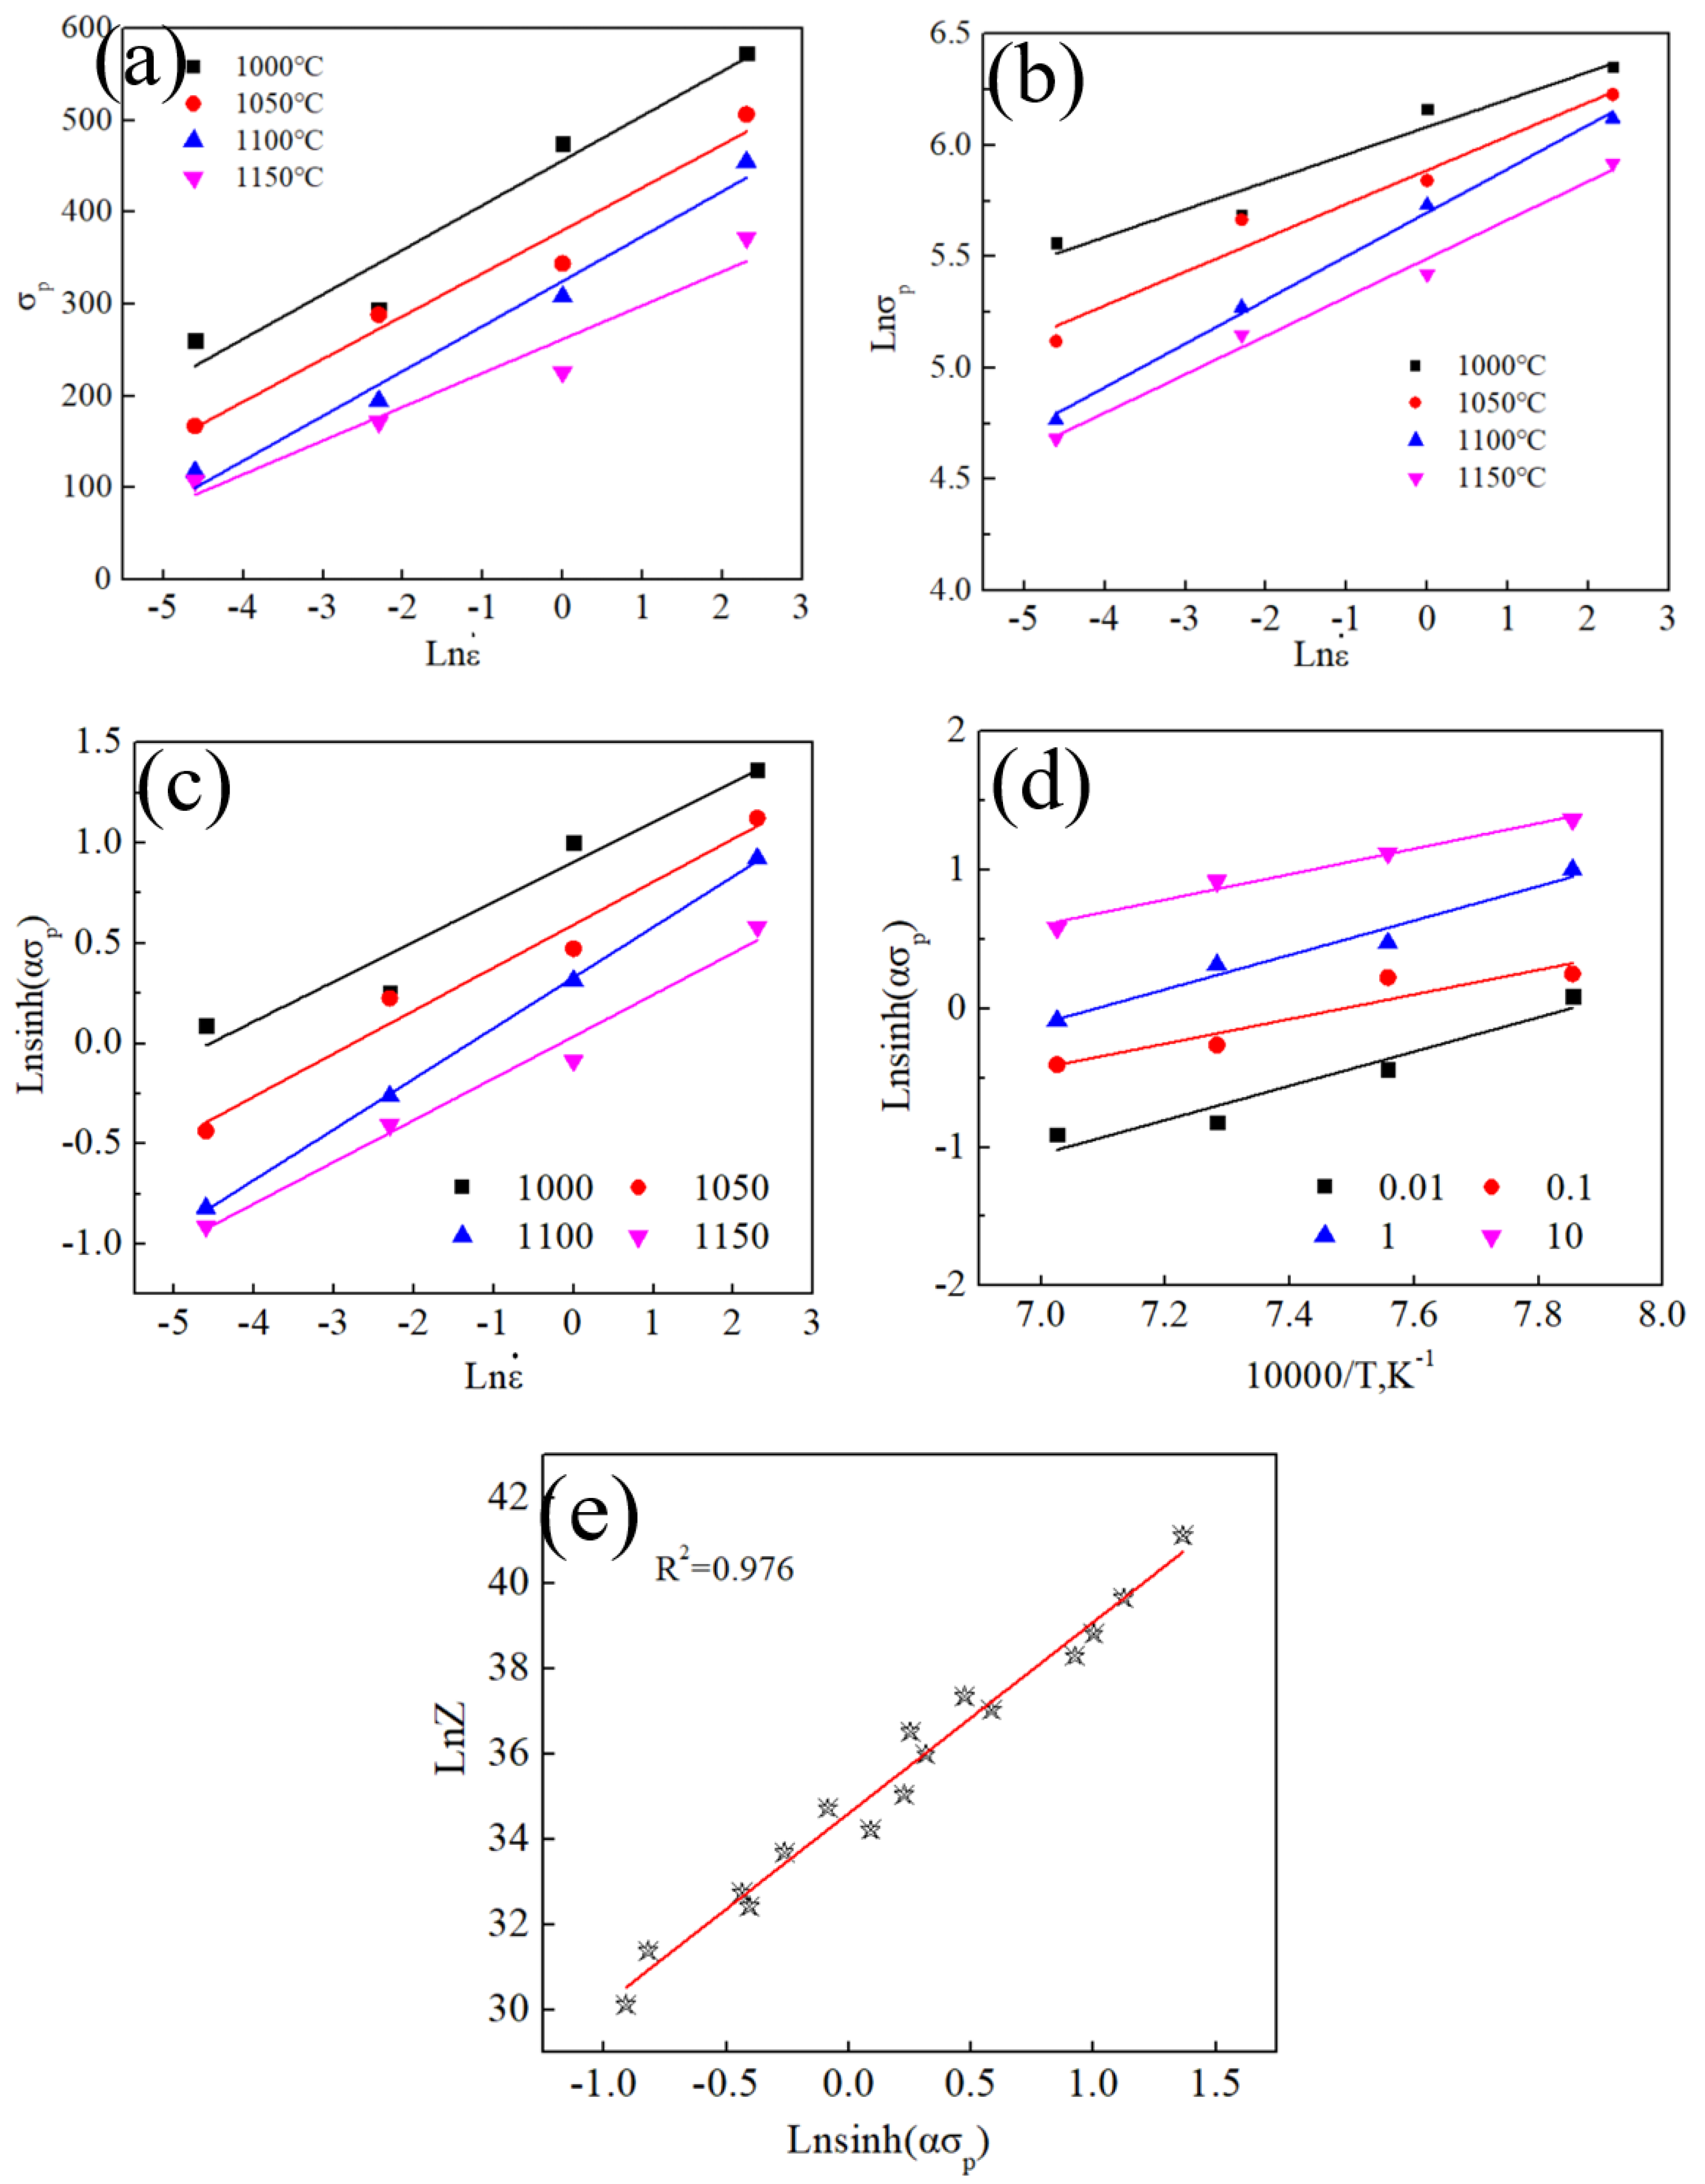
The plots of ln[sinh()] vs. and ln[sinh()] vs. 104/T of 2W are shown in Figure 5c,d. The average linear slope of ln[sinh()] vs. and ln[sinh()] vs. 104/T are 1/n and K, respectively, yielding n = 4.249 and K = 1.0015. Equation (6) yields a Q value of 353.792 kJ/mol for 2W. The Q of 4W is 410.9 kJ/mol, as determined using a least squares method (see Figure 6).The adjusted coefficients of determination for the linear regression are 0.965 and 0.976, as shown in Figure 5e and Figure 6e, respectively. Therefore, using material constants to describe the flow stress yields values close to the actual value.
From the plots in Figure 5 and Figure 6, the activity energy Q of 4W is higher than that of 2W; the higher W content results in a larger thermal activation energy, enhancing both the hardening and the softening levels [17]. This indicates that the recrystallization activation process of the alloy with higher activation energy is quite difficult. Therefore, compared with those required for recrystallization nucleation in the alloy with lower activation energy, a higher temperature and a larger deformation are required for recrystallization nucleation in the higher activation energy alloy.
The constitutive equations are expressed as follows:
3.3. Effect of Temperature on Microstructure and Recrystallization Evolution
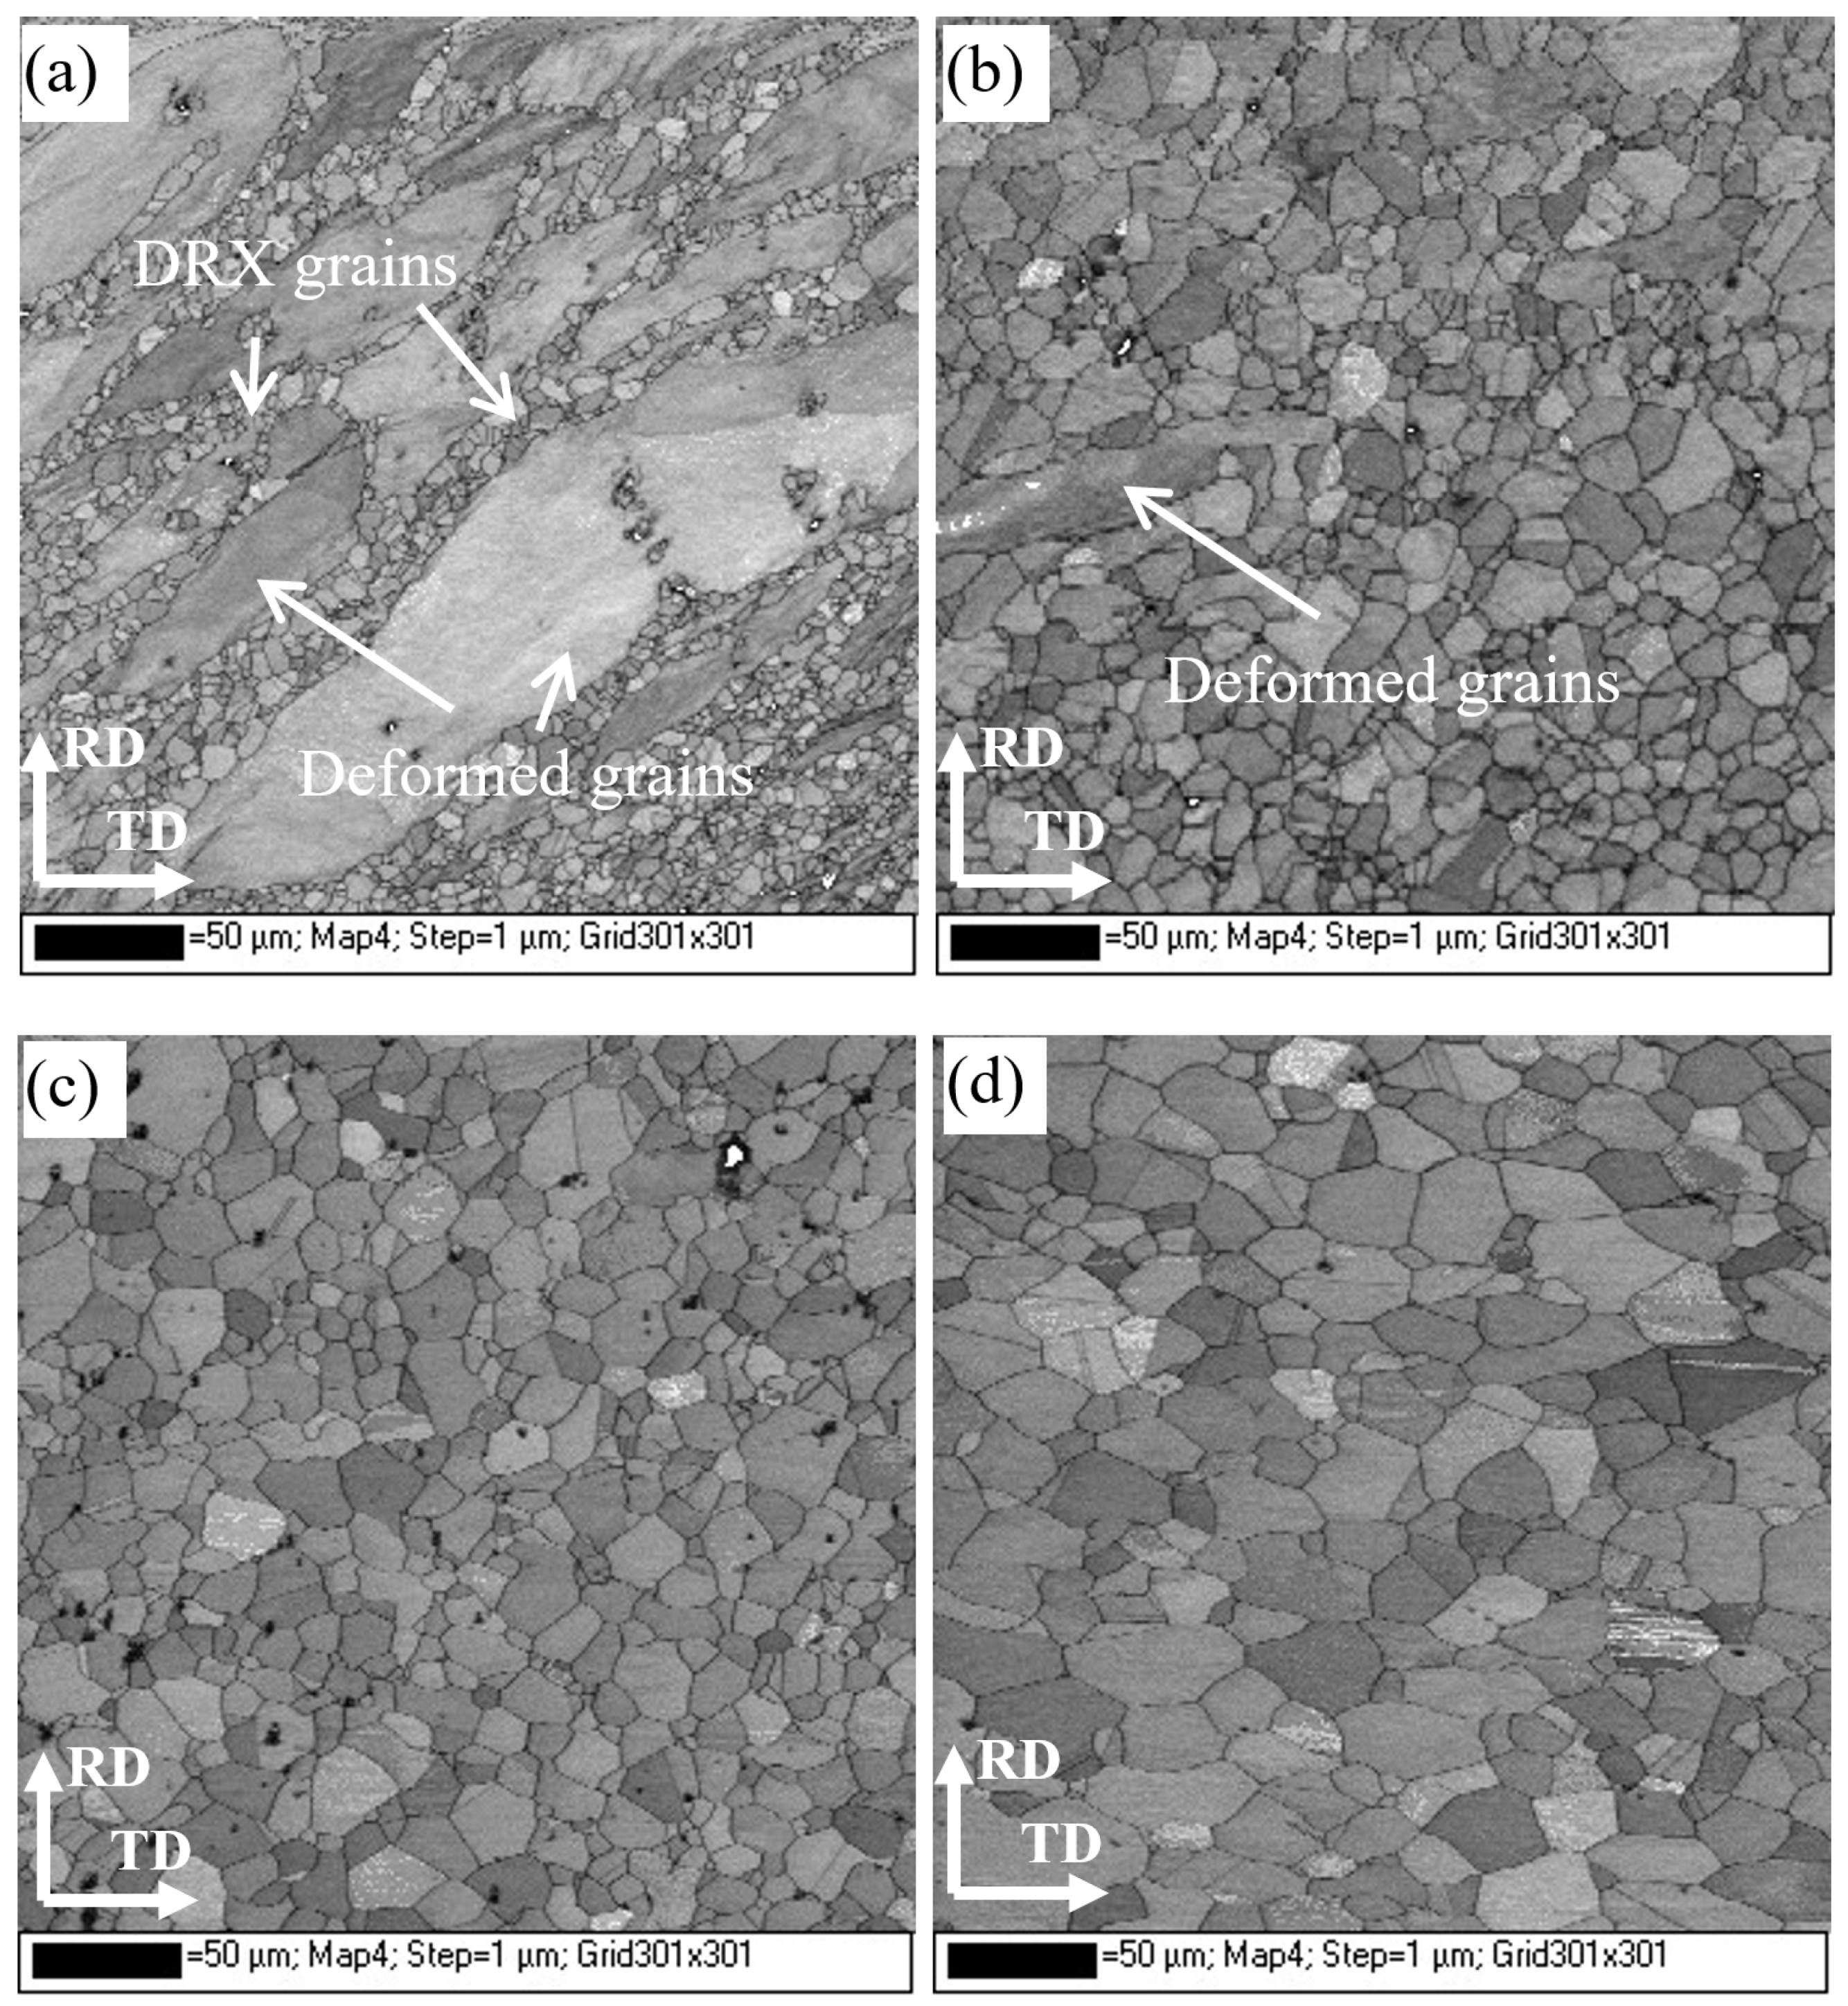
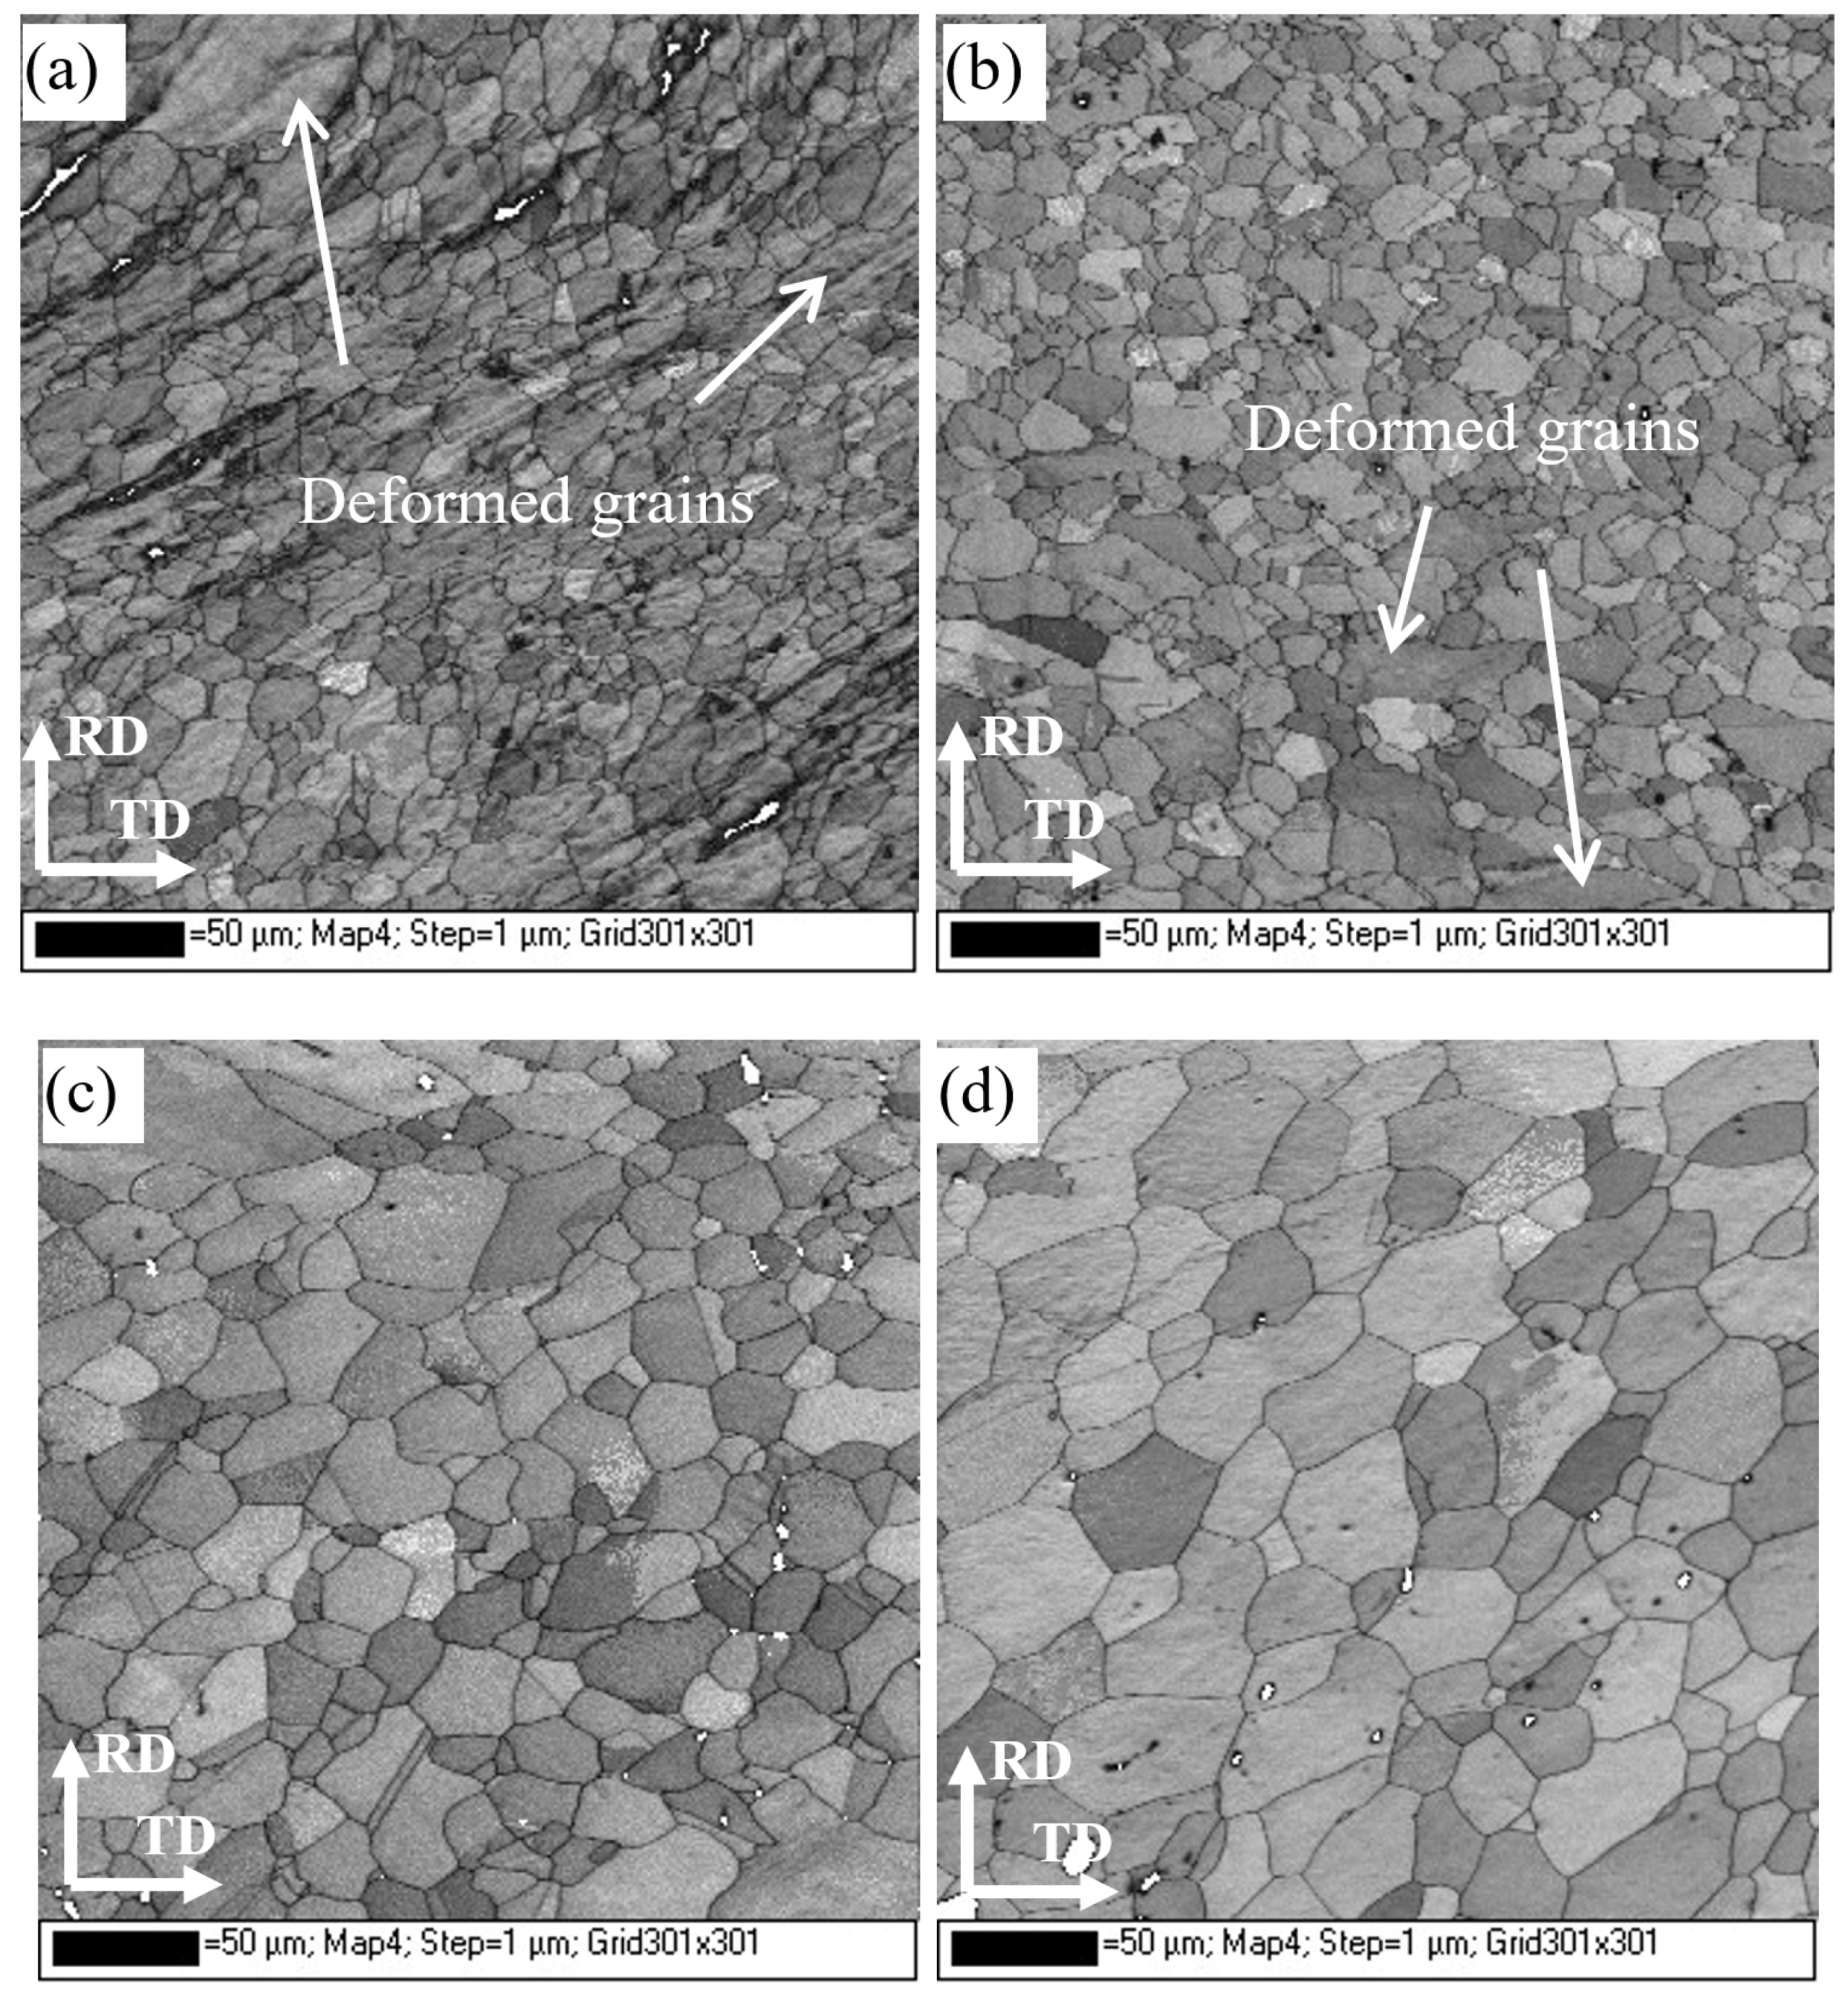
The band contrast maps obtained from the EBSD of 2W subjected to compression at 1000 to 1150 °C and a strain rate of 1 s−1 are shown in Figure 7, the maps of which that we are looking at are vertical to compression direction, which is mandatory for all EBSD maps presentations in the manuscript. As Figure 7a shows, many DRX grains are distributed in chains along the initial grain boundaries after deforming at 1000 °C, although the representative microstructure is dominated by some deformed grains. The volume fraction of DRX grains increases significantly with increasing deformation temperature, and full isometric DRX grains are obtained after deforming at 1100 °C; the size of the equiaxed DRX grains was approximately in the range of 15–80 μm after deforming at 1150 °C, as shown in Figure 7b–d.
Figure 8 shows the band contrast maps of 4W alloy subjected to deformation at temperature of 1050 to 1200 °C and a strain rate of 1 s−1. As Figure 8a shows, after deforming at 1050 °C, the recrystallized grains constitute a large fraction (>50%) of the microstructure and only a small amount of deformed grains exist in the matrix. Figure 8b shows that, in the microstructure of the sample deformed at 1100 °C, there are still a few deformed grains. Fully DRX grains could be obtained by increasing the deformation temperatures to 1150 and 1200 °C, as shown in Figure 8c,d. The recrystallized grains grow up rapidly after deforming at 1200 °C and obtain a size in the range of 25–100 μm.
Comparing the microstructures of Figure 7 and Figure 8, it can be found that DRX can be observed at different deformation temperatures, which are consistent with the trends observed in the strain-stress curves (see Figure 2 and Figure 3). Meanwhile, the temperature of complete recrystallization of 4W is higher than that of 2W. The microstructure would become more inhomogeneous when deformed at lower temperature or higher strain rate.
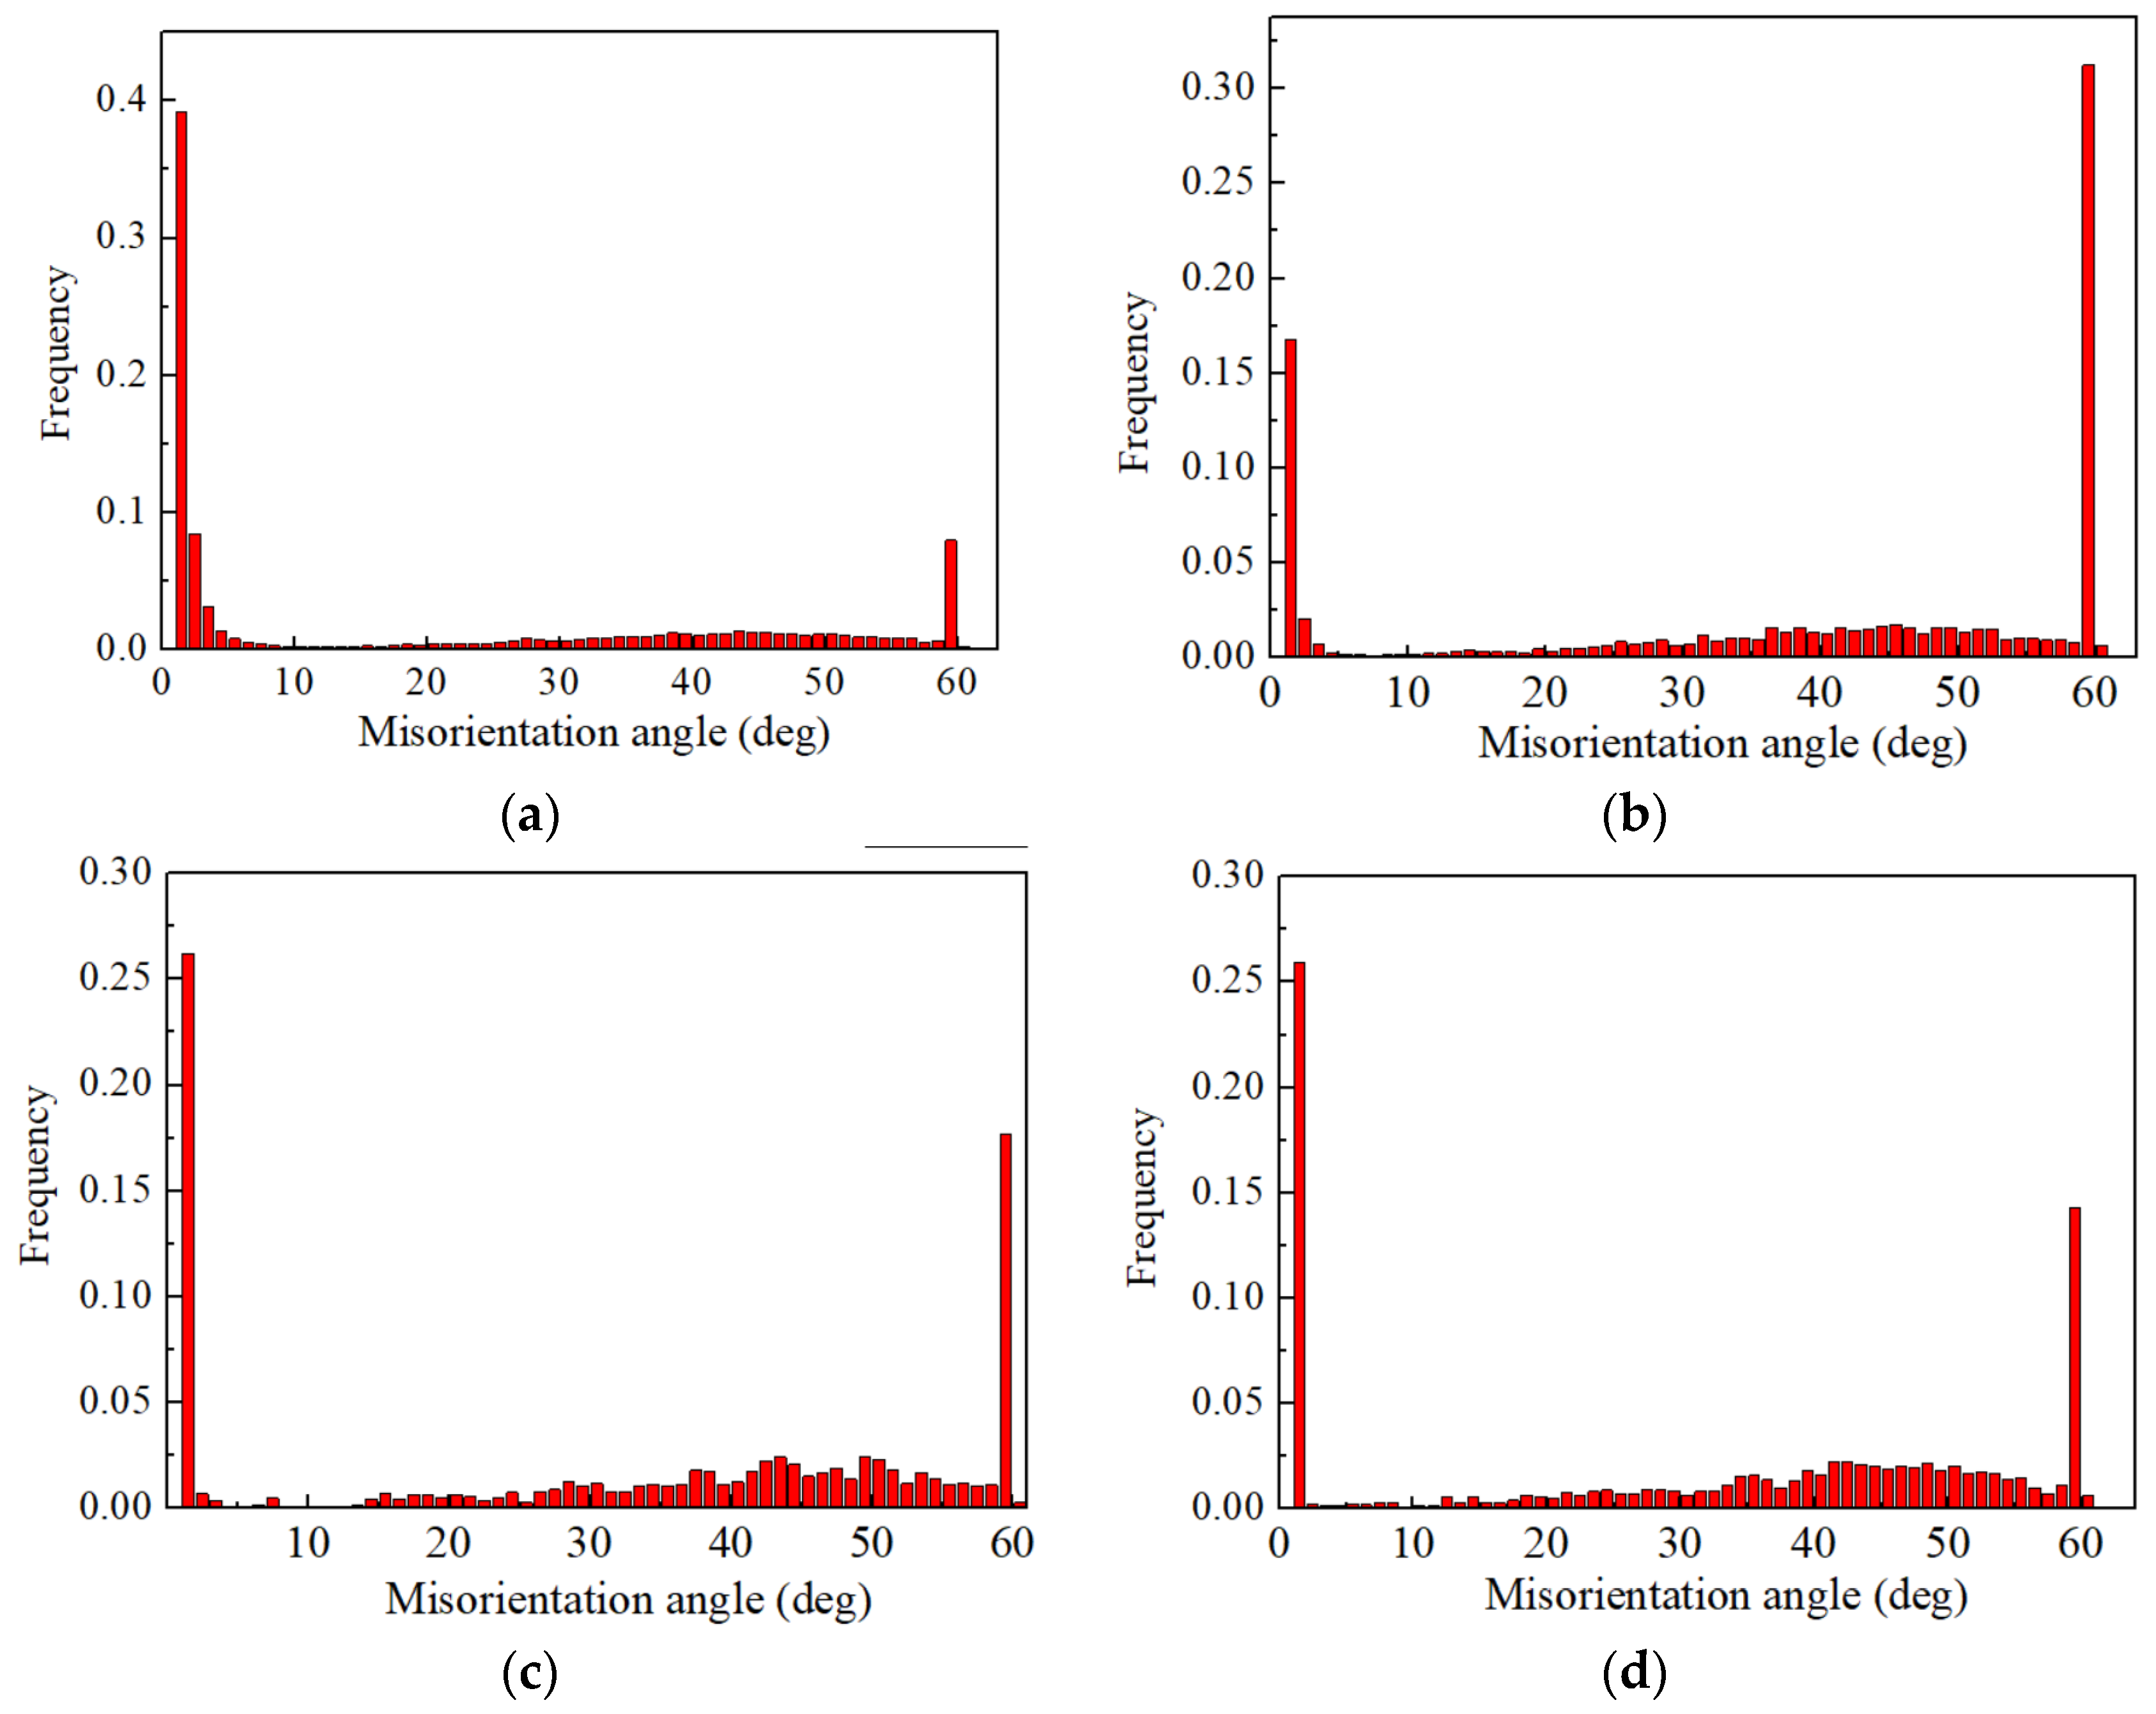
Figure 9 shows the misorientations of the angle distribution of grain boundaries of 2W duing deforming at 1000–1150 °C with a strain rate of 1 s−1. As shown in Figure 9a and Table 2, when deformed at 1000 °C, the major grain boundaries of 2W are LAGBs (θ < 5°) accounting for about 53%. The data statistics shows that the proportion of LAGBs with θ in the range of 0–15° decreases sharply from 53% to 20% when the deformation temperature increases from 1000 to 1050 °C and remains unchanged at 1100–1150 °C. It is noteworthy that the proportion of LAGBs with misorientations angles of 5–15° is rather low and only accounts for about 3% after deformation at various temperatures. The proportion of HAGBs with misorientations angle 30° > θ > 15° and 50° > θ > 30° increases slowly with increasing deformation temperature. The research shows that the grain boundary energy (GBE) has a close relationship with the misorientation angle and the GBs have a low energy when the grains misorientation angle is small [25]. The LAGBs has the characteristics of low GBE and stable interface structure, which makes it difficult for them to migrate during deformation, while the grains with a misorientation of 0–5° can subsist steadily during hot compression at various deformation temperatures, indicating that recrystallization nucleation occurs continuously. Some misorientations angle θ > 50° occuerd in Figure 9a–d, the reports showed that grain boundaries with misorientation angles of 60° > θ > 50° are twins, as twins have a lower interface energy, which is accompanied with the formation of twins during DRX [26].
The frequencies of the misorentation angles at different deformed temperatures for 2W and 4W are shown in Table 2. From a comparison of the data, it can be found that the frequency of the LAGBs of 4W is higher than that of 2W after being deformed at 1050 °C; inversely, the frequencies of the misorientation angle of 4W is lower than that of 2W in both LAGBs and HAGBs under other deformation temperatures.
DRX is intensely dependent on deformation degree, strain rate and temperature during hot deformation [14]; the recrystallization nuclei initially form in a local region (deformation band, grain boundary and near inclusion) with a high deformation degree. Two classical dynamic recrystallization nucleation theories, the DBs bulging mechanism and sub-grains rotation mechanism, are widely accepted by scholars [27,28]. The frequencies of LAGBs with θ in the range of 0–5° have larger value when deformed at 1000 °C of 2W and 1050 °C of 4W, and the probable reason is that some deformed grains with a lot of deformed bands and sub-grains, which are dominated by LAGBs, are retained in the microstructure( see Figure 7a, Figure 8a and Figure 13). The sub-grains with LAGB have a lower GB migration rate, and thus two adjacent sub-grains with low misorientation merge to form a new DRX grain with large misorientation by rotation; the public sub-GB disappearing and new GB forming during the grain merging are all executed by dislocations slipping and climbing. The frequency of HAGBs increased with increasing deformation temperature, the main reason being that the rate of atom diffusion and dislocation movement accelerated with increasing deformation temperatures, which results in the DRX grain growth and misorientation increase. For higher W content, the amount of W atoms in 4W is more than that of 2W, hence, atoms diffusion and dislocations movement in 4W are more difficult, resulting in the HAGBs frequency of 4W being lower than that of 2W.
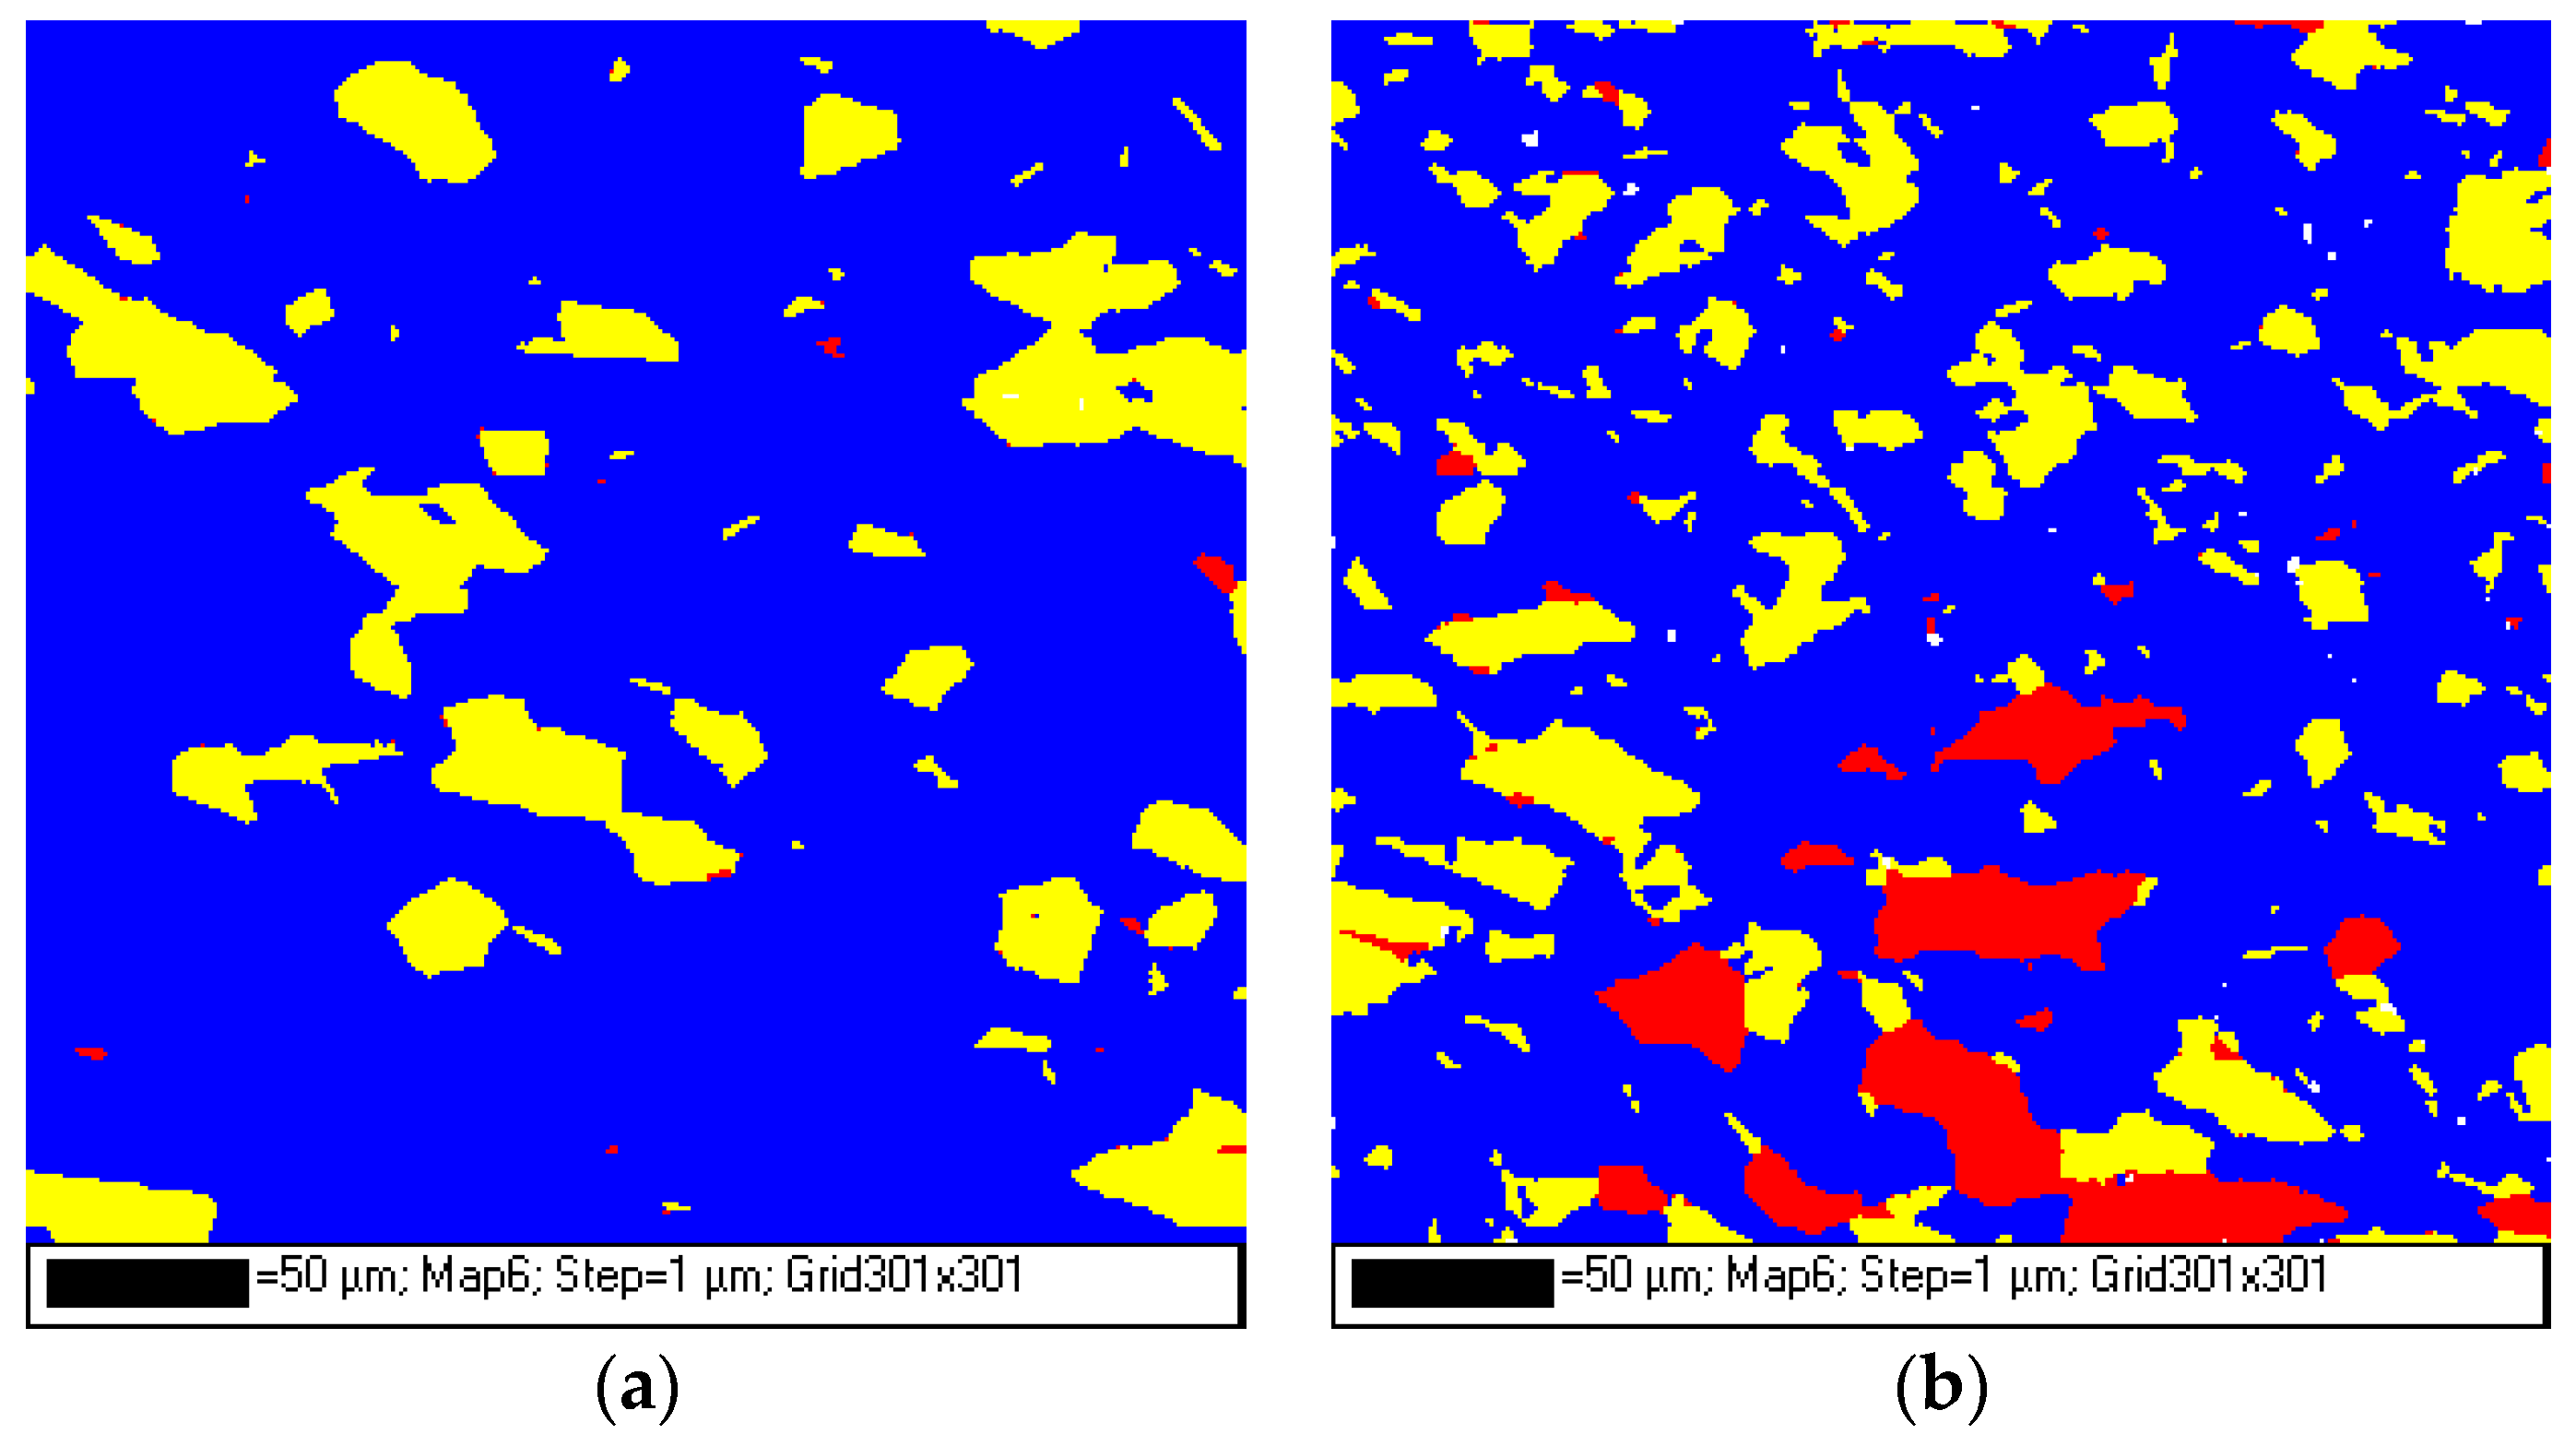
The DRX distribution maps (the criteria employed for differentiating grains is GOS (Grain Orientation Spread) values) of two different W content alloys which were deformed at 1100 °C and 1 s−1 are show in Figure 10. The blue, yellow and red areas represent fully complete recrystallization, sub-recrystallization and dynamic recovery, respectively. It can be observed that, during this deformation condition, the alloy 2W is nearly recrystallized completely; however the alloy 4W still retains a small amount of dynamic recovery.
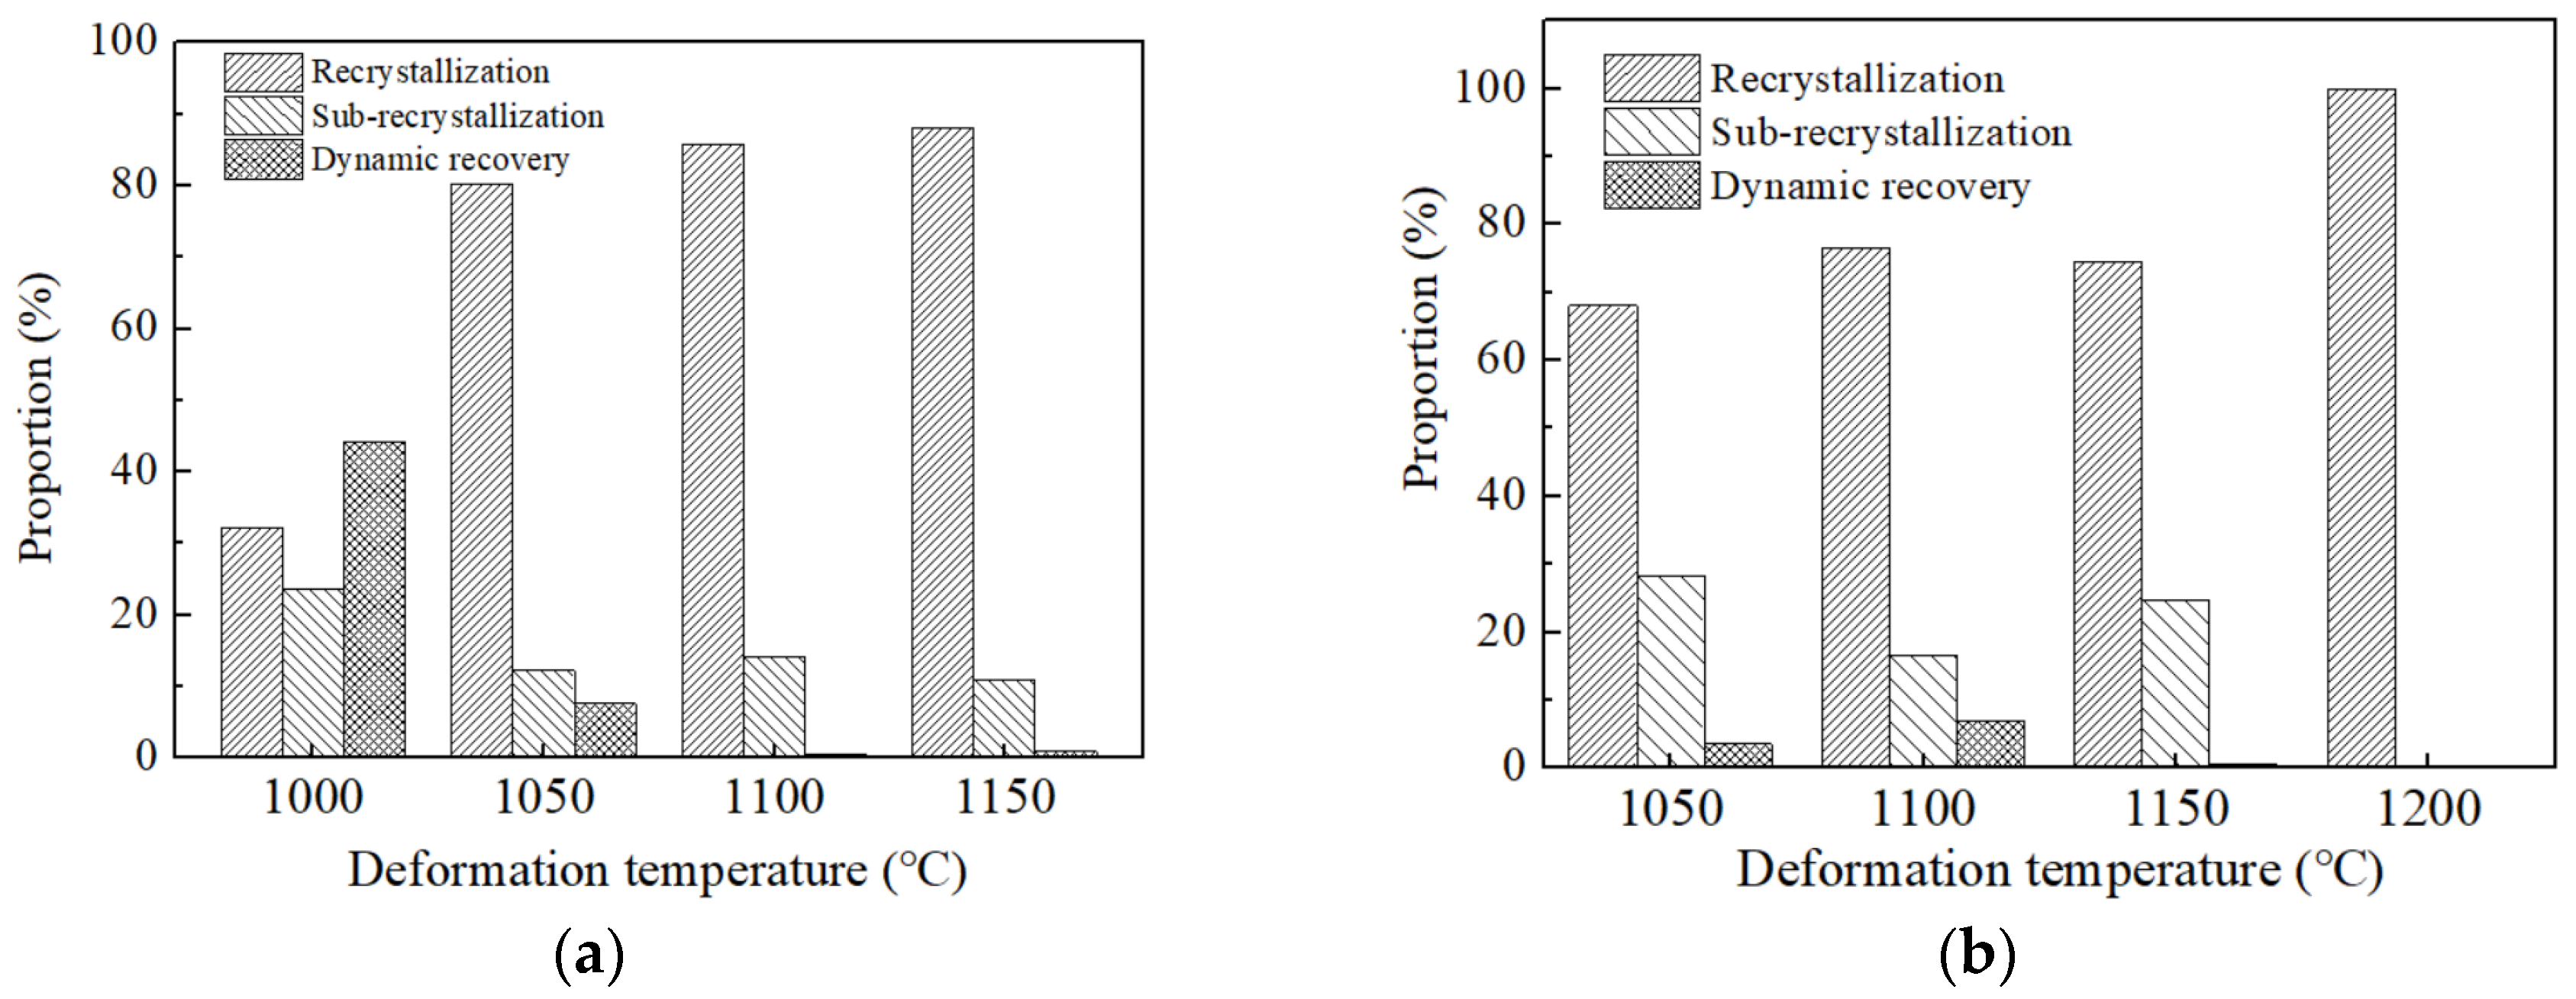
Figure 11 shows the proportion of dynamic recrystallization of two alloys deformed at 1000–1200 °C and 1 s−1. Figure 11a shows that the proportion of the dynamic recrystallization of 2W increases with increasing deformation temperature, and the values of dynamic recrystallization are 32.2%, 80.2%, 85.7% and 88.1% at deformation temperature of 1000, 1050, 1100 and 1150 °C, respectively; the dynamic recovery decreases radically with increasing deformation temperature and completely disappears at 1100 °C. The proportions of dynamic recrystallization of 4W are 68%, 76.6%, 74.6% and 100% at deformation temperatures of 1050, 1100, 1150 and 1200 °C respectively. The dynamic recovery completely disappears at 1150 °C. The comparison of Figure 11a,b shows that the alloy with a higher W content has lower DRX percentage and higher fully DRX temperature. The mainly reason is that the refractory element W has a larger atom radius and reduces the effective diffusion rate in the lattice [19], the activation energy for element diffusion is increased with more W addition, and then the DRX is delayed.
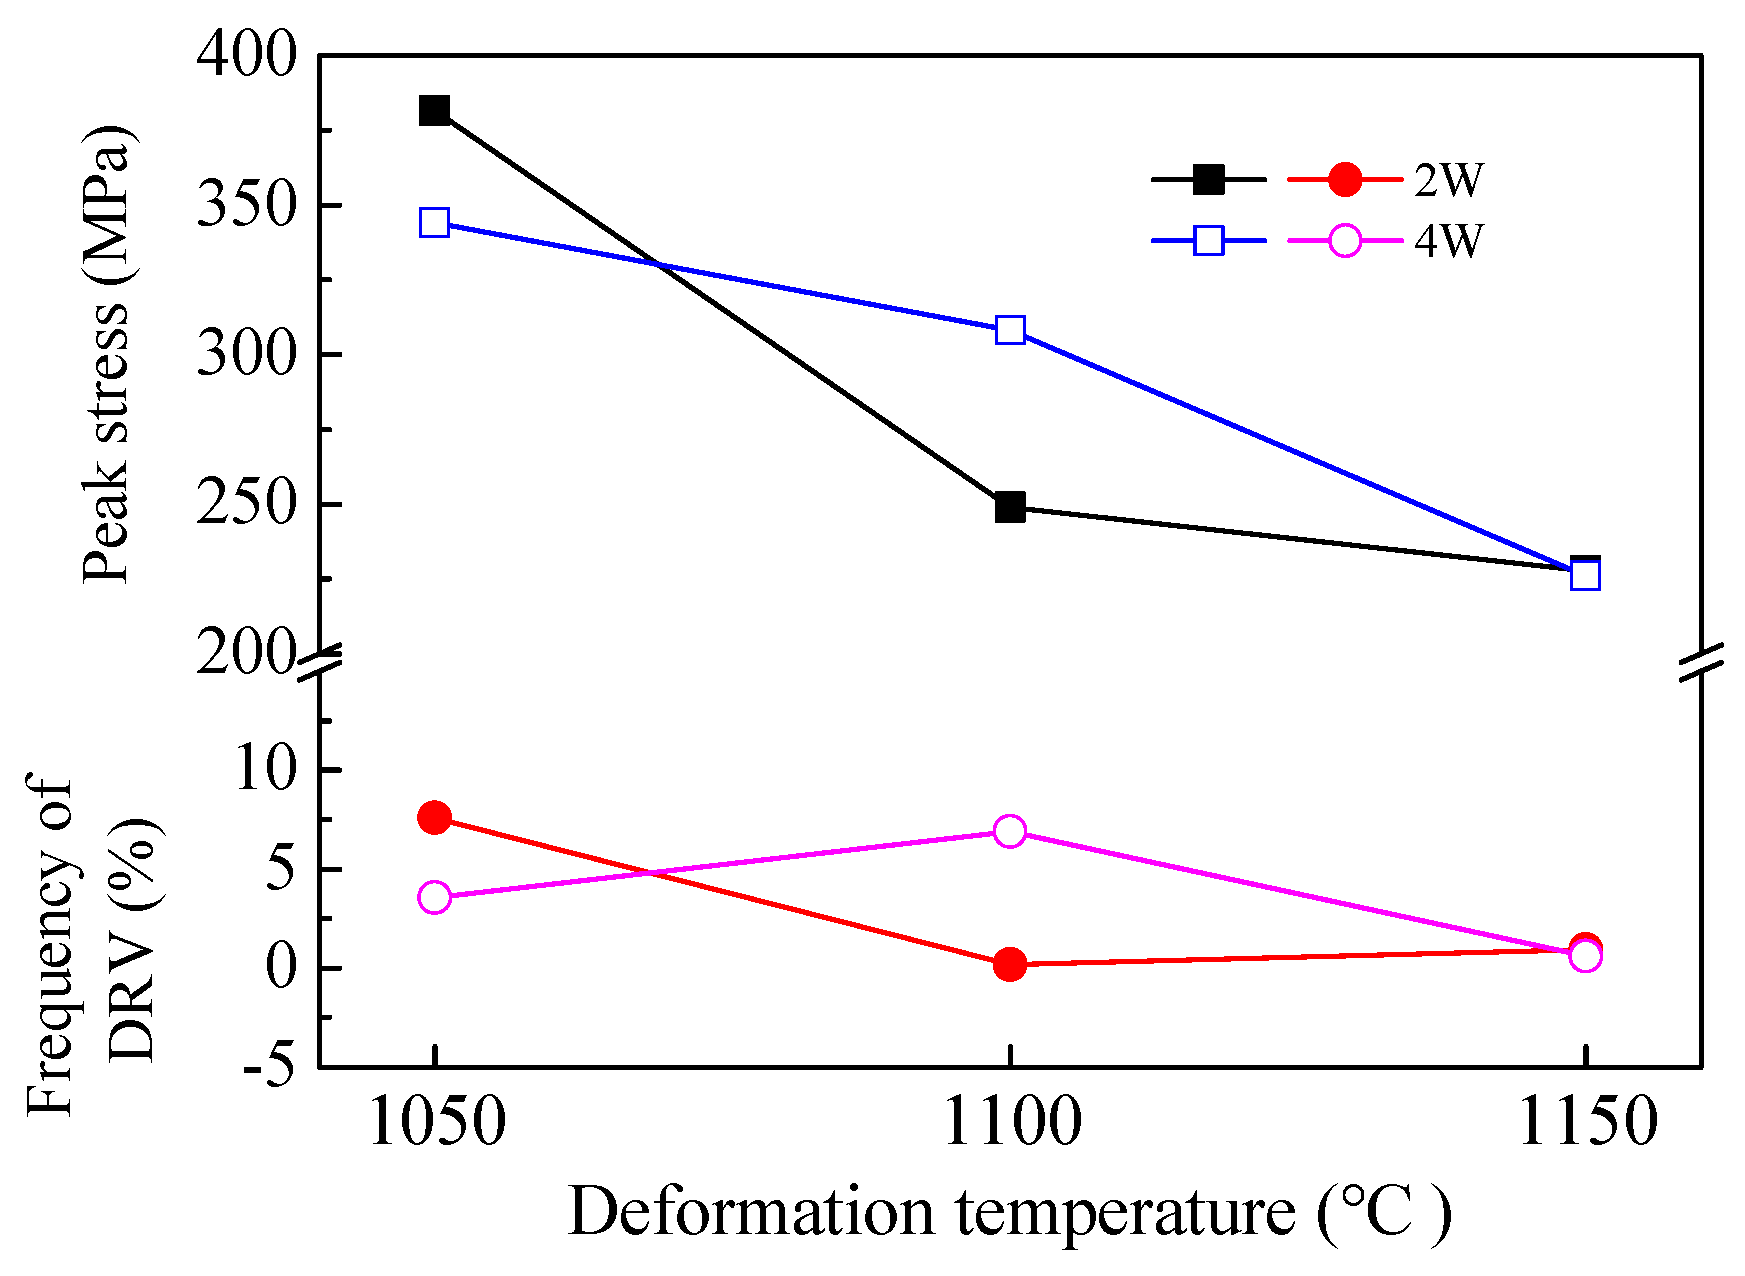
Figure 12 shows the correlation between the peak stress and DRV fraction of 2W and 4W after deformed at 1050, 1100 and 1150 °C at a strain rate of 1 s−1. The alloy with a higher peak stress has a higher DRV frequency at similar deformation conditions; although the peak stress of 2W is higher than that of 4W at 1050 °C has been considered as an abnormal phenomenon.
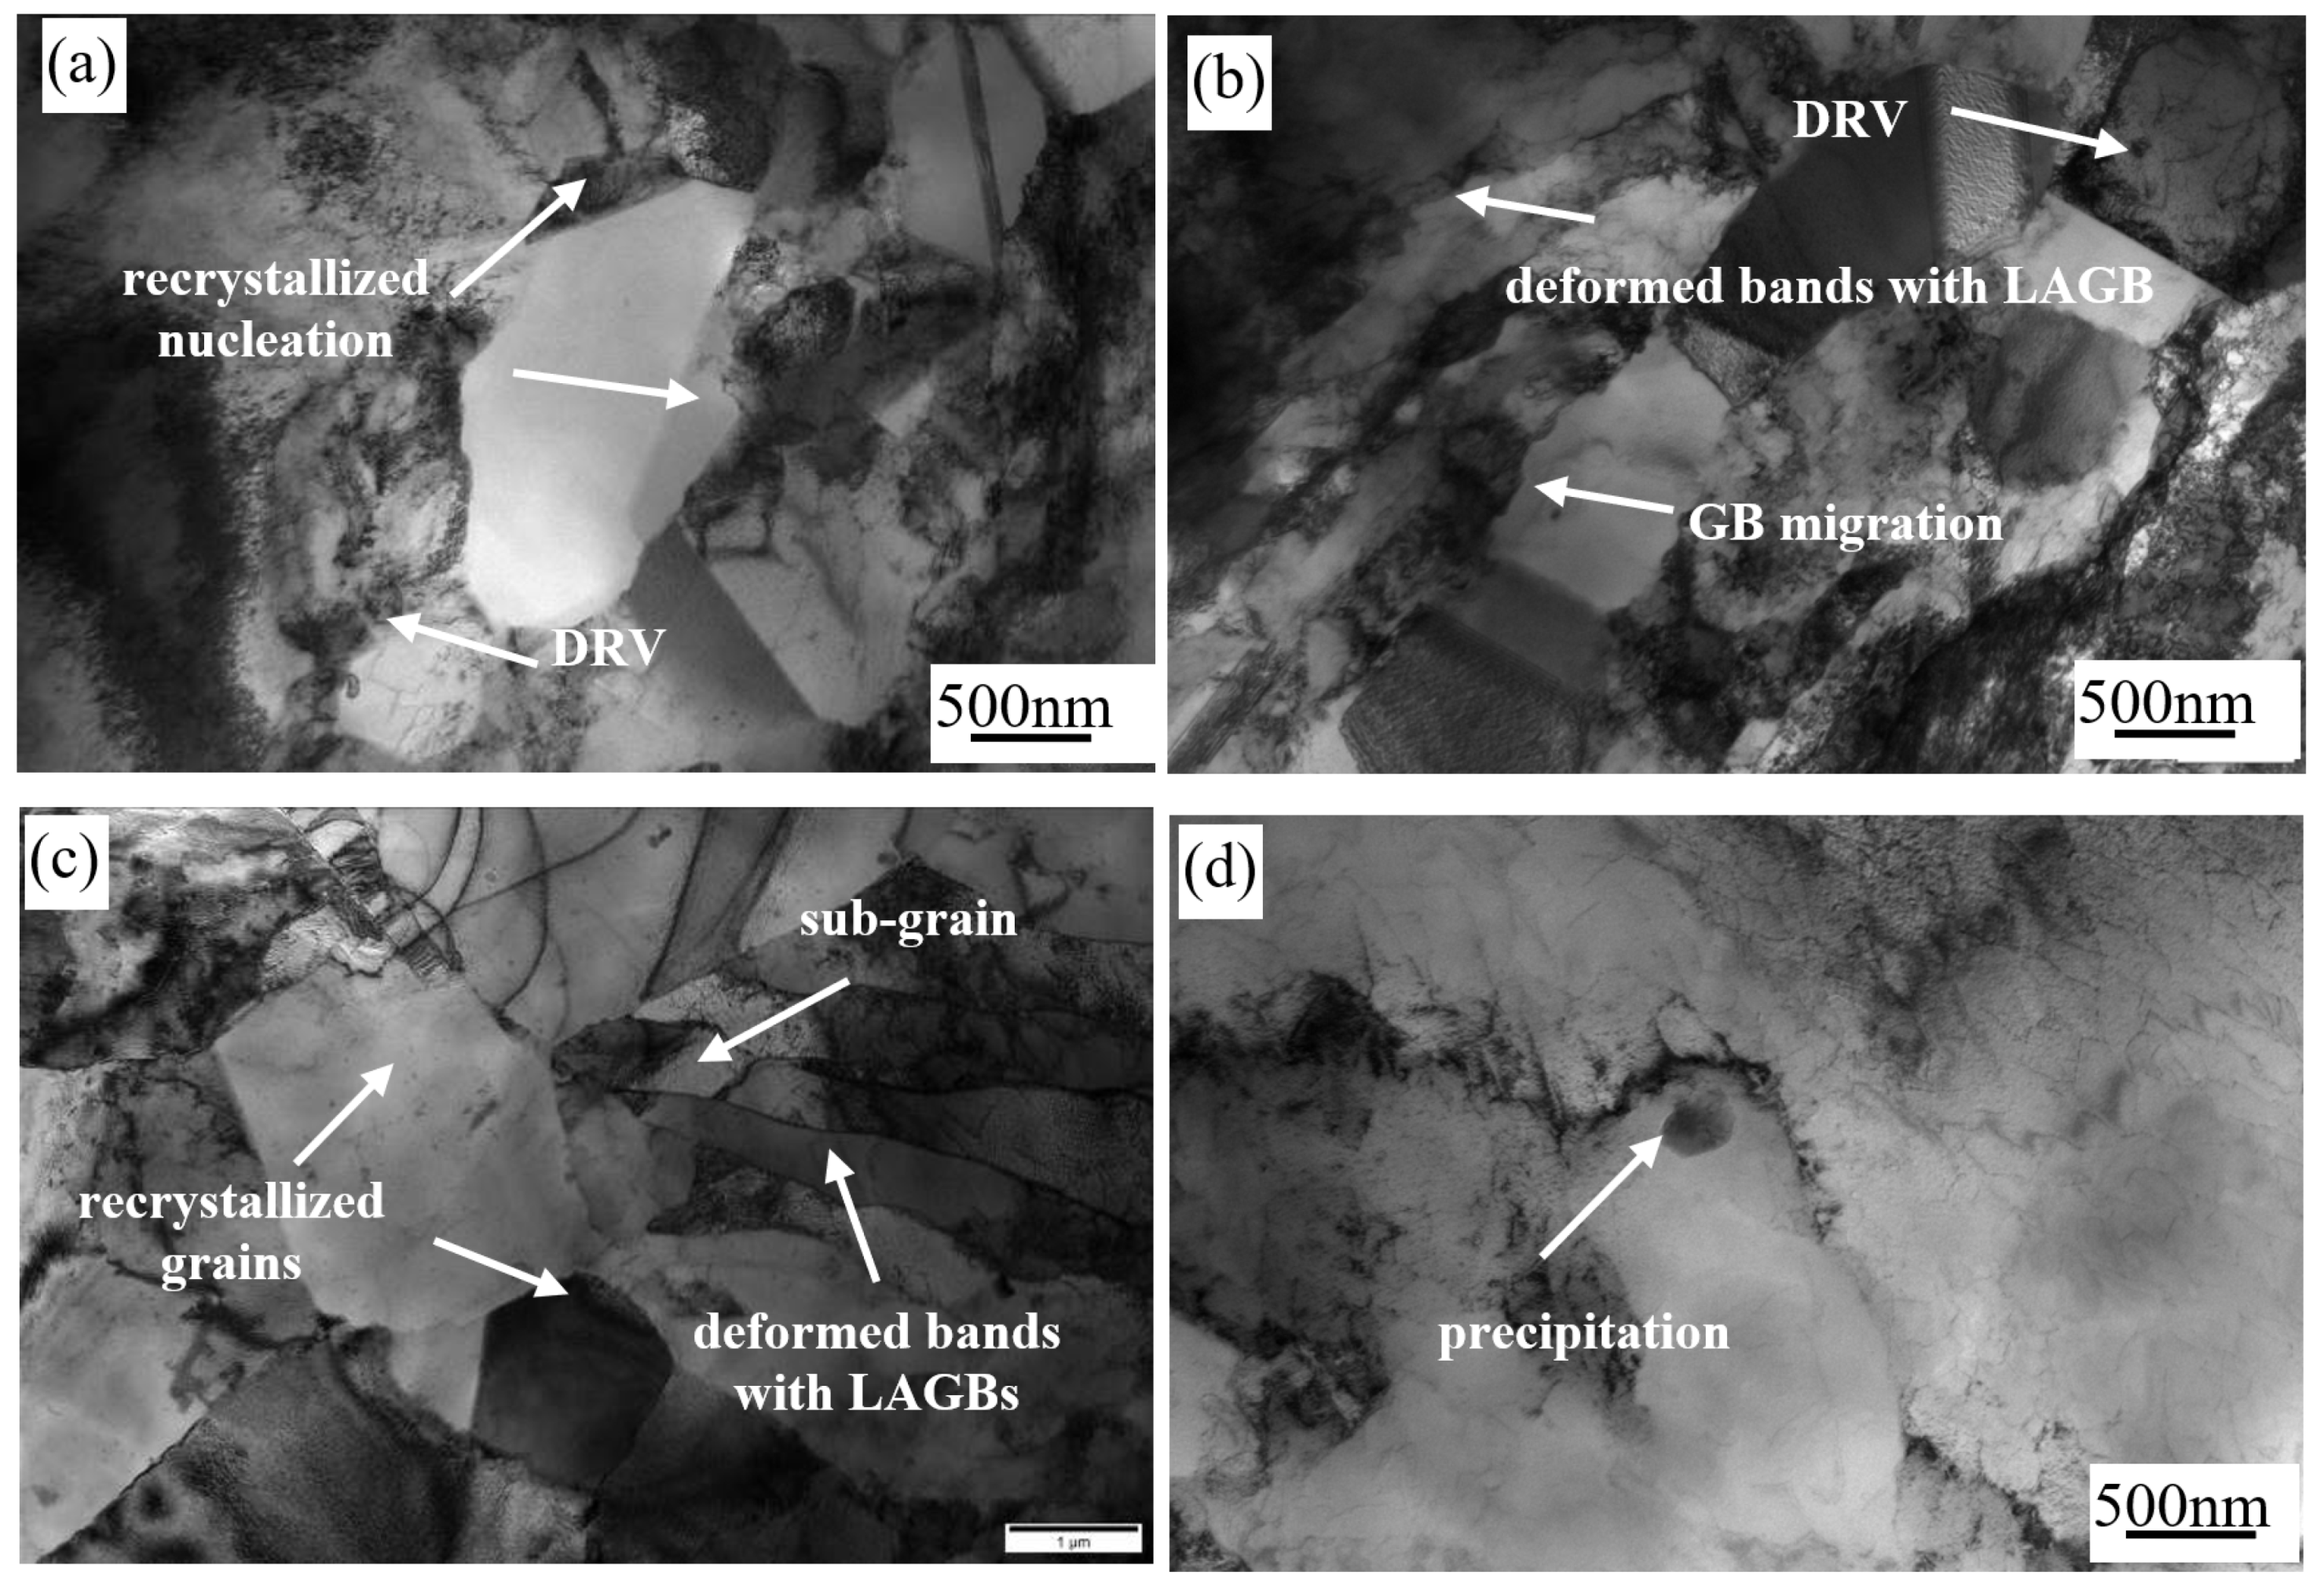
Dark-field TEM images of 2W compressed at different deformation temperature are used to observe the microstructure evolution of DRX and DRV during compressing, as shown in Figure 13. Figure 13a shows that a new recrystallized grain was formed during compression, while two new recrystallized nuclei are distributed around the new recrystallized grain, revealing that the new recrystallized nuclei are twinned with the recrystallized grain, and the cell structure can be observed in the lower right corner of the recrystallized grain, indicating that DRV has occurred. Figure 13b shows that DRV (low density of dislocations intertwined in the grain and accumulated at GBs) and DRX (equiaxed grains) both occurred during deformation; a band-shaped tissue is segmented by some suspected recrystallized nuclei, and few deformed bands with LAGB are parallel to it. Besides this, GBs migration has been observed from the image and conforms to the GBs bulging mechanism. Figure 13c shows that two recrystallized grains with lower density dislocation appeared and some deformed bands with LAGBs appeared around them, and it can be found that a deformed band is segmented and that part of it forms a sub-grain. Meanwhile, different densities of dislocation are shown in deformed bands, meaning that the dislocation movement in this region is more active. Research has shown that the dislocations on adjacent sub-grain boundaries are accumulated to the surrounding grain boundaries by sliding and other motion mechanisms, resulting in the disappearance of the original sub-grain boundaries; these sub-grain orientations are eventually aligned and become recrystallized nuclei by atom diffusion and dislocation adjustment. This process can be as the role of the sub-grain merging nucleation mechanism [27]. Figure 13d shows a granular precipitation appears near the grain boundary, resulting in grain boundary bending, meaning that the movement of GB is hindered by the precipitation, so the DRX can be restrained by precipitated phases.
3.4. Cracking during Compression
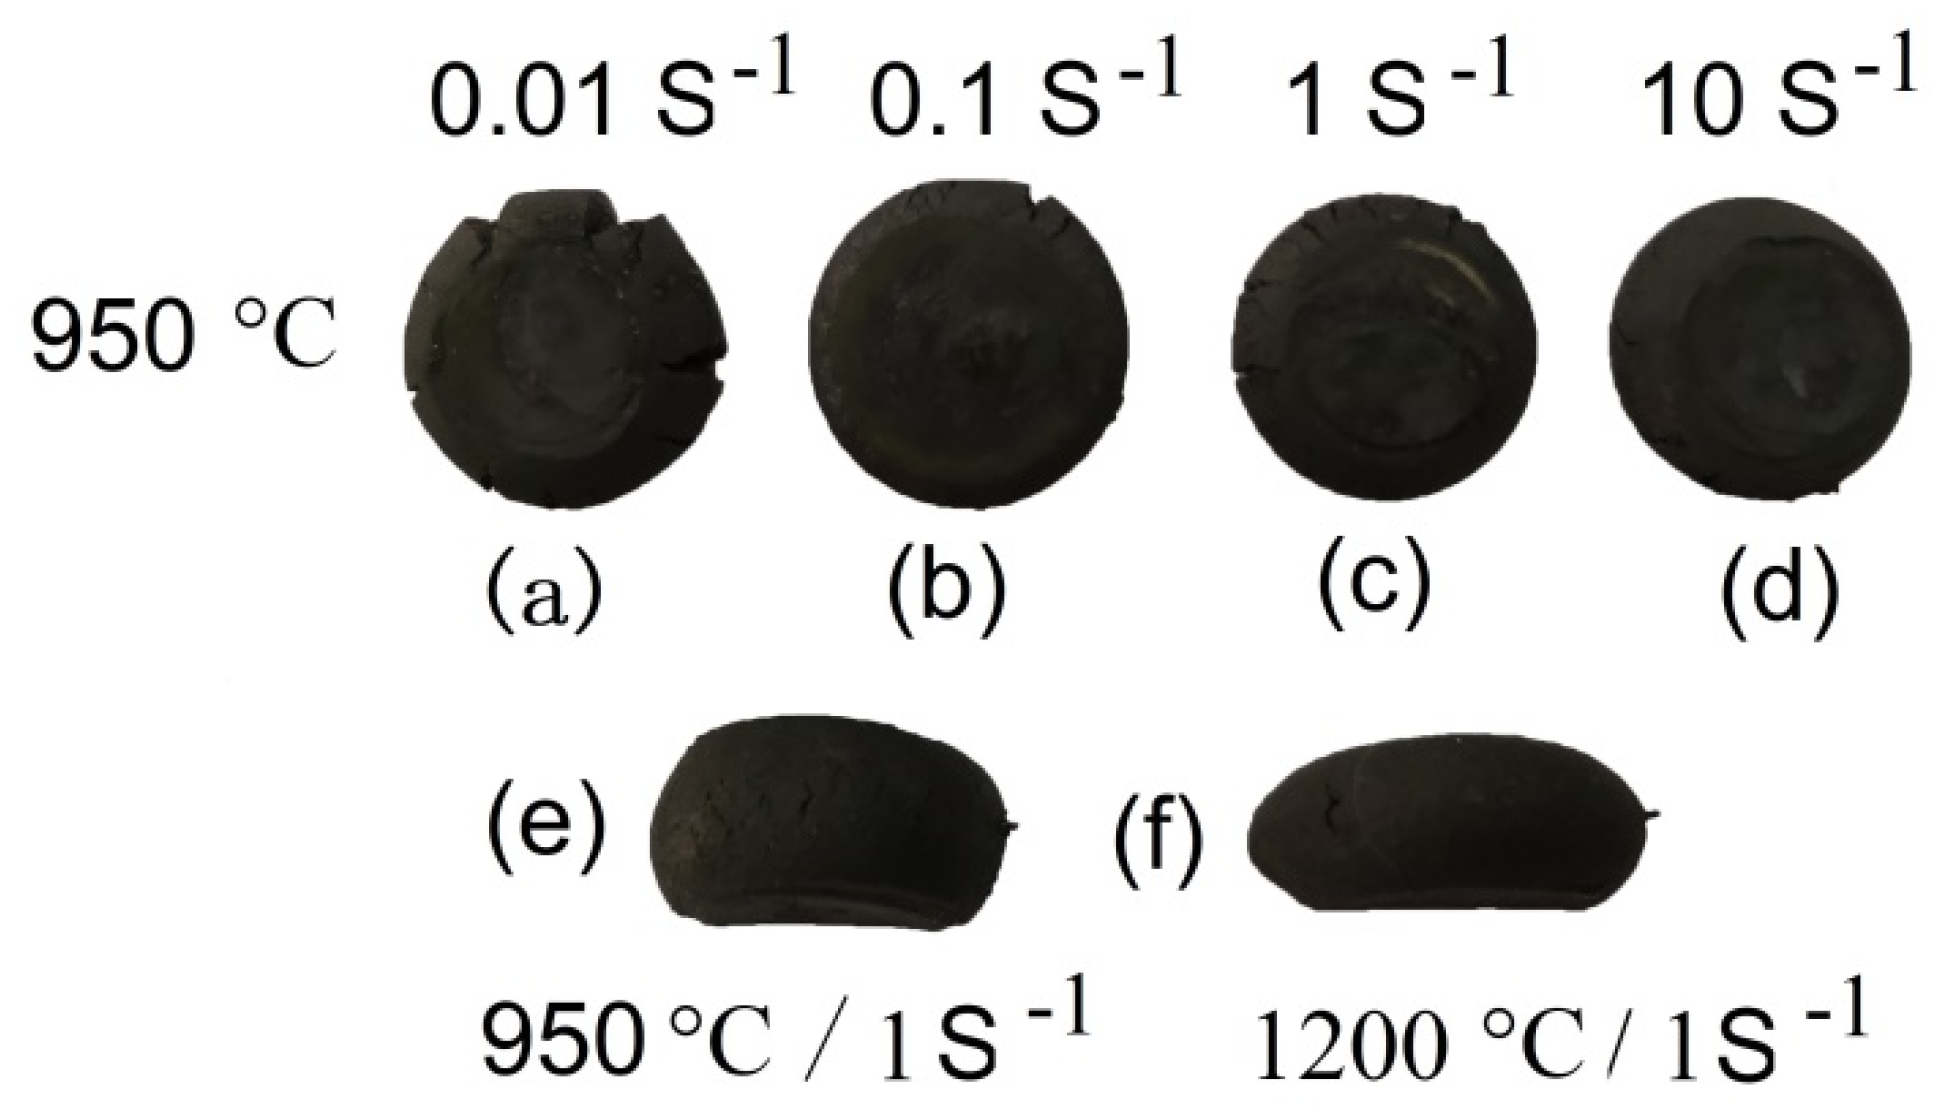
The samples of 2W were cracked on the surface when compressed at 950 °C, while they were cracked on the surface and grain boundary when compressed at 1200 °C; the various morphologies of cracks have shown in Figure 14. Pictures taken by the camera showed that at a low strain rate, the cracks on the surface were large and deep. This phenomenon could be illustrated by the fact that during the compression process, the surface of the sample is in two tensile stress states. Hence, the cracks originated from the surface. There is sufficient time for these to extend and grow when compression at a lower deformed strain rate.
Figure 15a shows the micrographs of cracks with compressing at 950 °C and 1 s−1. The cracks are initiated from grain boundaries (GBs) and propagated along GBs. It is worth noting that the ends of cracks are sharp and induced by stress. Figure 15b shows the micrographs of cracks in the sample compressed at 1200 °C and 1 s−1, where the ends of the cracks are smooth and arc-shaped, which resulted from melting of the grain boundaries.
3.5. Establishment of Hot-Processing Map
The processing map was developed based on the principle of the DMM. According to this model, a hot-processing map is used to provide optimum processing parameters under hot deformation. In recent years, several plastic instability criteria for improving the theoretical basis and methods of processing maps have been reported.
The efficiency η can be used to represent the power dissipated through microstructural variations occurring during the hot-deformation process. This parameter can be expressed as a function of the strain rate sensitivity (m) as follows:
η = 2m/(m + 1)
This value (i.e., η) [31] indicates the energy-contribution ratio for microstructural evolution during the deformation process and the hot workability of the alloy (i.e., high η: good workability). The parameter m, which is the strain rate sensitivity of flow stress, is given as follows:
The numbers in the processing map show the efficiency of power dissipation. In addition, the shaded region corresponding to the flow instability zone, which is described by the instability criterion (ξ) [32], is shown in Equation (9).
where, ξ is the instability parameter, which depends on both the deformation temperature and deformation strain rate.
In this study, the hot working maps of alloys with different W content were obtained at true strain values of 0.2, 0.4, 0.6, and 0.8, as shown in Figure 16 and Figure 17.
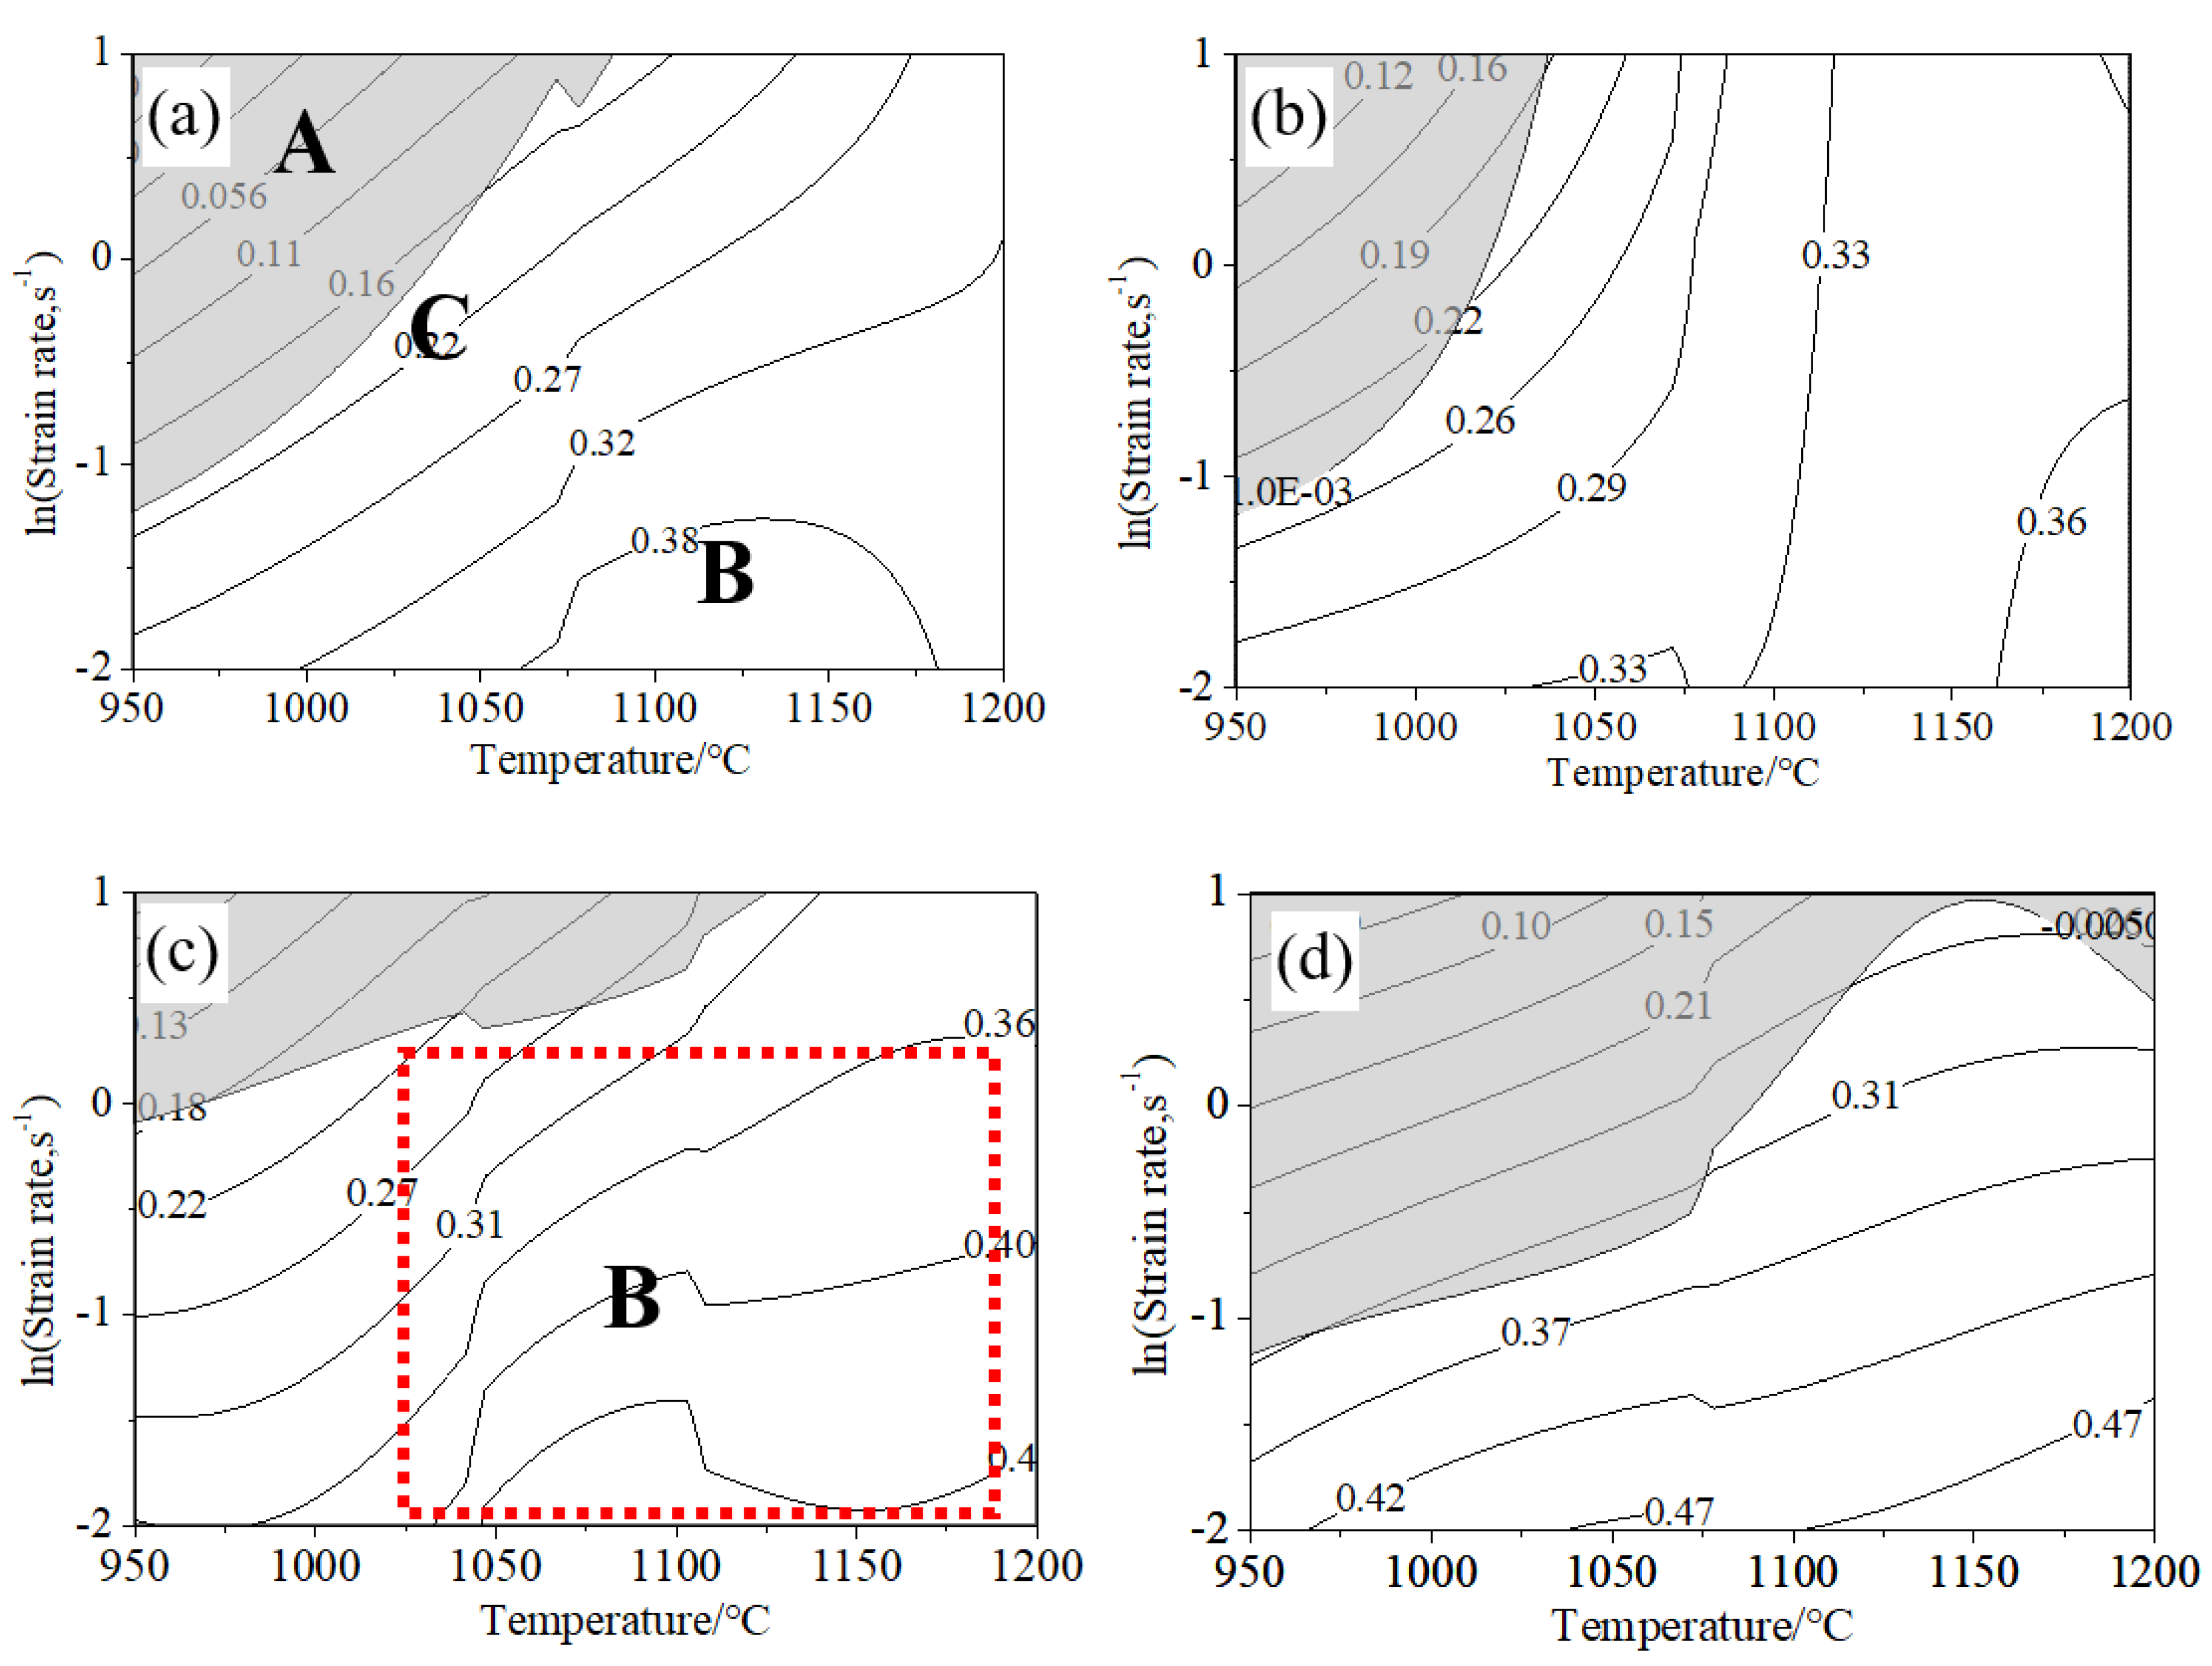
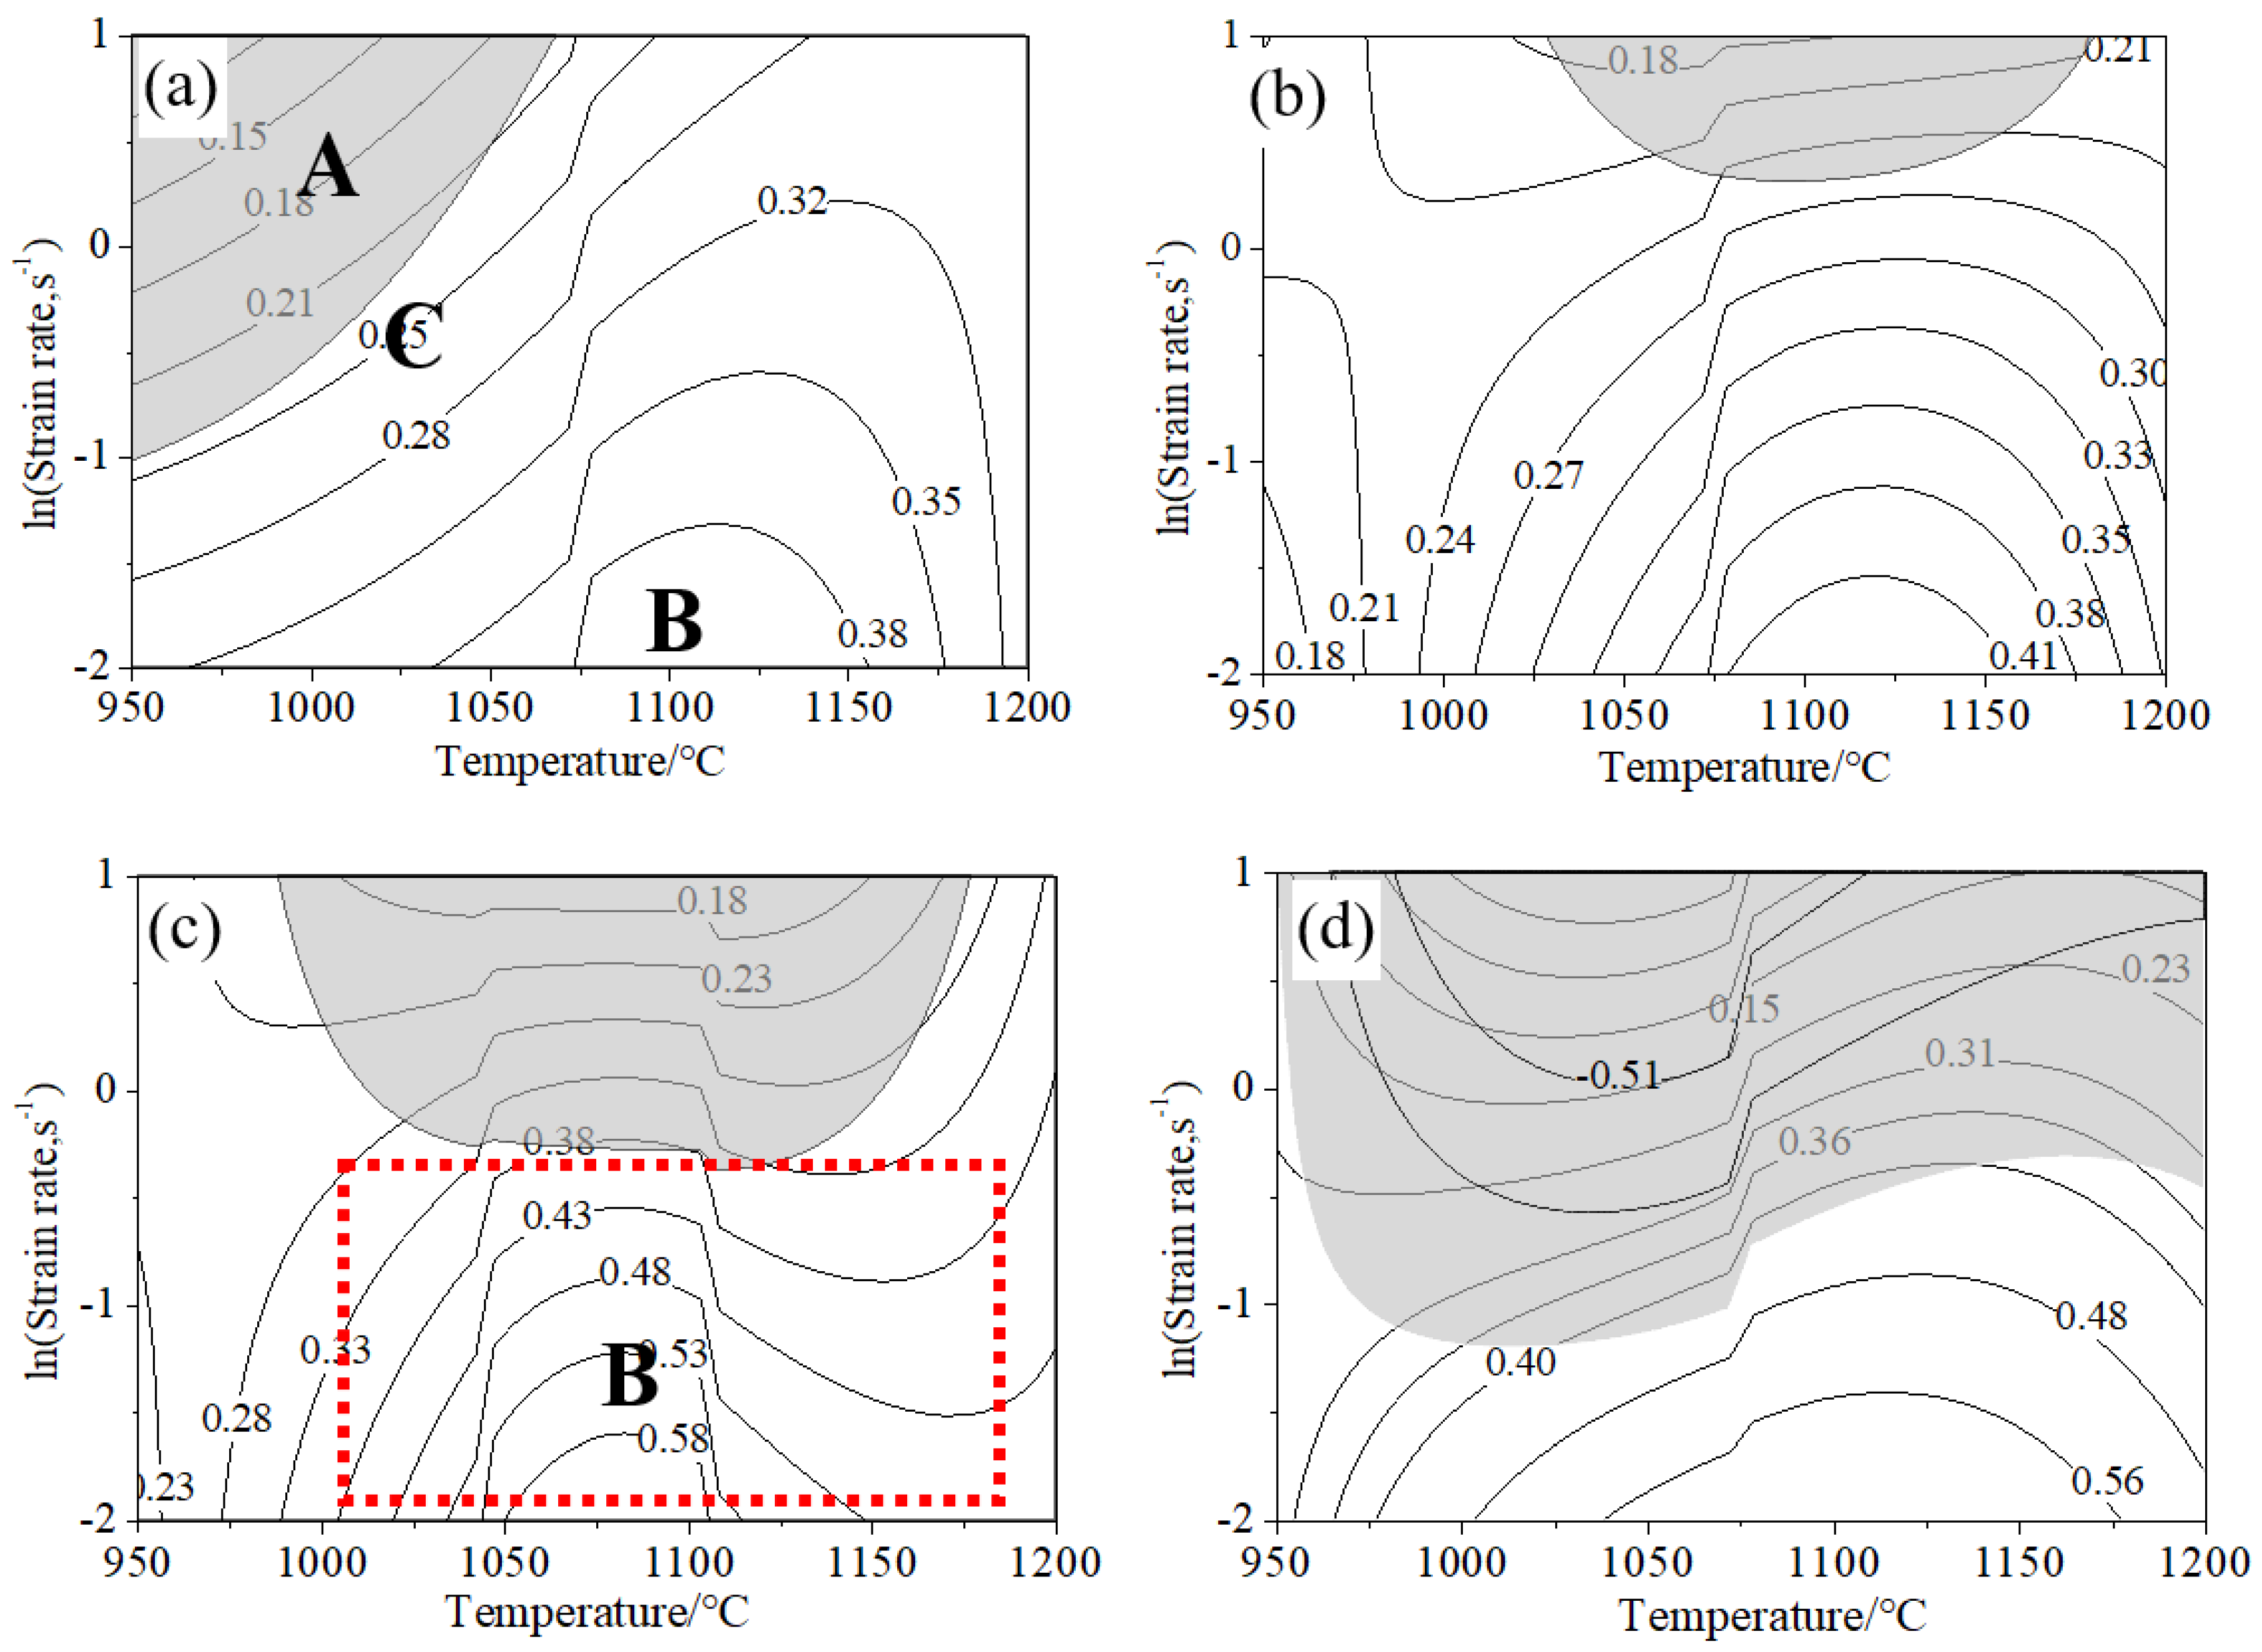
The domains and the numbers in the hot-working maps represent different microstructural mechanisms and the power dissipation efficiency during deformation, respectively. The processing map consists of three domains. Domain A (the shadow area) is the instability area, which is relatively low. Moreover, microstructural evolution occurred mainly via DRV for deformation temperatures or strain rates lying within this regime. Domain B (η > 0.3) is the stability area, where microstructural evolution occurred mainly via DRX for deformation performed in this zone. Domain C is a metastable zone located between domains A and B. In this zone, DRV and DRX both played a key role during deformation, thereby resulting in a mixed microstructure.
Figure 16 shows the hot-working maps of the 2% W alloy exposed to different amounts of true strain. The unstable deformation area (domain A) occurred at temperatures, strain rates, and true strain of 950–1100 °C, 0.1–10.0 s−1, and <0.6, respectively. For the same range of strain rates, and a true strain values of 0.8, this zone occurred at temperatures ranging from 950 to 1200 °C. At a strain of 0.6, domain B occurred at temperatures ranging from 1025 to 1200 °C and strain rates ranging from 0.01 to 1 s−1. The power dissipation efficiency is higher than 0.3 and a peak efficiency of 0.47 was realized at 1060 °C and 0.01 s−1.
Figure 17 shows the hot-working maps of the 4% W alloy exposed to different amounts of true strain. For strain rates ranging from 0.1 to 10.0 s−1: (i) domain A occurred at temperatures of 950–1050 °C and a true strain of 0.2; (ii) the shadow zone occurred at temperatures of 1000–1150 °C and true strain values of 0.2 and 0.4; and (iii) at a true strain of 0.8, the unstable zone extended to temperatures ranging from 950 to 1200 °C. At a strain of 0.6, domain B occurred at temperatures and strain rates ranging from 1025 to 1200 °C and 0.01 to 0.1 s−1, respectively, with the peak efficiency of 0.58 occurring at 1100 °C and 0.01 s−1.
A comparison of Figure 16 and Figure 17, revealed similar trends for processing maps corresponding to strains of 0.2, 0.4, 0.6, and 0.8, where the size of the unstable area increased with increasing true strain. The deformation resistance and, hence, the probability of crack and (other defect) formation would increase with increasing amount of deformation. In this work, true strain values of 0.6 and lower were found to be appropriate for hot deformation of the alloys. The solution strength of the alloy increased with increasing W content, leading to high deformation resistance. Therefore, the unstable area of the alloy with higher W content is larger than that of the alloy with lower W content.
Studies have shown that the highest efficiency of power dissipation for deformation ranges from 0.3 to 0.5, consistent with the occurrence of dynamic recrystallization in Ni-based alloys [16]. This indicates that dynamic recrystallization is the dominant mechanism of microstructural evolution in Domain B.
4. Conclusions
The dynamic recrystallization and hot-working characteristics of two Ni-based alloys with different W content were investi-gated via compression tests. These tests were performed at temperatures ranging from 950 to 1200 °C, strain rates of 0.01 to 10 s−1, and a true strain of 0.9. The major conclusions of this study are summarized as follows:
(1) Using the flow stress–strain curves, apparent activation energy values of 353.8 and 410.9 kJ/mol were obtained for the GY200 Ni-based alloys with different W content. The Zener–Hollomon parameters and the hot deformation equations were obtained.
(2) The hot working maps showed that the instability zone expands with increasing W content. At a strain of 0.6, domain B occurred at temperatures of 1025–1200 °C and strain rates of 0.01–1 s−1 in alloys with W content of 2% and 4%. Furthermore, at a strain rate of 0.01 s−1, peak efficiencies of 0.47 at 1060 °C and 0.58 at 1100 °C were obtained for the 2% W and 4% W alloys, respectively.
(3) Dynamic recrystallization of GY200 alloys occurred in the temperature range and strain rates employed during testing. Completely recrystallized microstructures of 2W and 4W were obtained at deformation temperatures of 1100 and 1150 °C, respectively. The fraction of DRX increased with increasing deformation temperature and decreasing deformation strain rate.
(4) The cracking on the surface of the sample compressed at 950 °C resulted from the tensile stress, while the fracture of the sample compressed at 1200 °C was triggered by the melting of grain boundaries.
Author Contributions
Conceptualization, Z.G. and G.Y.; methodology, H.B.; software, validation, formal analysis, resources, and investigation data curation, Z.G.; writing—original draft preparation, writing—review and editing, Z.G. and G.Y.; supervision, project administration, and funding acquisition, H.B.
Funding
This research was funded by the National Key Research and Develop program, China, grant number 2017YFB0305203.
Acknowledgments
The authors acknowledge the support from the National Key Research and Develop program, China (No. 2016YFB0300203), the Inner Mongolia Natural Science Foundation (No.2018LH05025), and thanks MDPI for editing this manuscript.
Conflicts of Interest
The authors declare no conflict of interest.
References
- Abe, F.; Kutsumi, H.; Haruyama, H.; Okubo, H. Improvement of oxidation resistance of 9 mass% chromium steel for advanced-ultra supercritical power plant boilers by pre-oxidation treatmentOriginal Research Article. Corros. Sci. 2017, 114, 1–9. [Google Scholar]
- Agarwal, D.C.; Gehrmann, B. Nickel Alloys for High Efficiency Fossil Power Plants. In Proceedings of the 5th International Conference in Materials Technology for Fossil Power Plants, Marco Island, FL, USA, 3–5 October 2007; pp. 271–280. [Google Scholar]
- Fukuda, Y. Development of Advanced Ultra Supercritical Fossil Power Plants in Japan. Mater. High Temp. Corr. Prop. Mater. Sci. Forum 2011, 696, 236–241. [Google Scholar]
- Ma, L.-T.; Wang, L.-M.; Liu, Z.-D. Hot Deformation Behavior of F6NM Stainless Steel. J. Iron Steel Res. Int. 2014, 21, 1035–1041. [Google Scholar] [CrossRef]
- Yamamoto, R.; Kadoya, Y.; Nakano, T. Development of Ni-based superalloy for advanced 700 °C-class steam turbines. In Proceedings of the Fifth International Conference on Advances in Materials Technology for Fossil Power Plant, Marco Island, FL, USA, 3–5 October 2007; Volume 434. [Google Scholar]
- Lasalmonie, A. Why is it so difficult to introduce them in gas turbine engines? Intermetallics 2006, 14, 1123–1129. [Google Scholar] [CrossRef]
- Kermanpur, A. Improvement of grain structure and mechanical properties of a land based gas turbine blade directionally solidified with liquid metal cooling process. Mater. Sci. Technol. 2008, 24, 100–106. [Google Scholar] [CrossRef]
- Bugge, J.; Kjær, S.; Blum, R. High-efficiency Coal-fired Power Plants Development and Perspectives. Energy 2006, 31, 1437–1445. [Google Scholar] [CrossRef]
- Abe, F.; Kern, K.U.; Viswanathan, R. Creep-Resistant Steels; CRC Press: Boca Raton, FL, USA, 2008; Volume 12. [Google Scholar]
- Robin, S.; Chen, S.; Monica, S. New materials enable unprecedented improvement in turbine performance. Adv. Mater. Process. 2013, 171, 18–22. [Google Scholar]
- Kamoshida, H.; Imano, S.; Saito, E.; Uehara, T.; Toga, T.; Nonomura, T. Advances in Materials Technology for Fossil Power Plants, Proceedings from the Sixth International Conference; Electric Power Research Institute: Albuquerque, NM, USA, 2011; pp. 373–385. [Google Scholar]
- Sun, W.; Qin, X.; Guo, J.; Lou, L.; Zhou, L. Thermal stability of primary MC carbide and its influence on the performance of cast Ni-base superalloys. Mater. Des. 2015, 69, 81–88. [Google Scholar] [CrossRef]
- Li, H.; Yea, F.; Zhao, J.; Cao, T.; Xu, F.; Xua, Q.; Wang, Y.; Cheng, C.; Min, X. Grain boundary migration-induced directional coarsening of the γ′ phase in advanced ultra-supercritical superalloy. Mater. Sci. Eng. A 2018, 714, 172–178. [Google Scholar] [CrossRef]
- Dudova, N.; Belyakov, A.; Sakai, T.; Kaibyshev, R. Dynamic recrystallization mechanisms operating in a Ni–20% Cr alloy under hot-to-warm working. Acta Mater. 2010, 8, 3624–3632. [Google Scholar] [CrossRef]
- el Mehtedi, M.; Gabrielli, F.; Spigarelli, S. Hot workability in process modeling of a bearing steel by using combined constitutive equations and dynamic material model. Mater. Des. 2014, 53, 398–404. [Google Scholar] [CrossRef]
- Wang, J.; Dong, J.; Zhang, M.; Xie, X. Hot working characteristics of nickel-base super alloy 740H during compression. Mater. Sci. Eng. A 2013, 566, 61–70. [Google Scholar] [CrossRef]
- Zhang, C.; Zhang, L.; Shen, W.; Liu, C.; Xia, Y.; Li, R. Study on constitutivemodeling and processingmaps for hot deformation of medium carbon Cr–Ni–Mo alloyed steel. Mater. Des. 2016, 90, 804–814. [Google Scholar] [CrossRef]
- Wang, L.; Liu, F.; Zuo, Q.; Cheng, J.J.; Chen, C.F. Processing Map and Mechanism of Hot Deformation of a Corrosion-Resistant Nickel-Based Alloy. J. Mater. Eng. Perform. 2017, 26, 392–406. [Google Scholar] [CrossRef]
- Lin, Y.C.; Chen, X.-M. A critical review of experimental results and constitutive descriptions for metals and alloys in hot working. Mater. Des. 2011, 32, 1733–1759. [Google Scholar] [CrossRef]
- Gong, Z.-H.; Yang, G.; Ma, L.-T.; Ding, W. Precipitation behavior of carbides in GY200 Ni-based alloy for blade with different W and Mo contents. Trans. Mater. Heat Treat. 2017, 38, 83–88. (In Chinese) [Google Scholar]
- Prasad, Y.V.R.K.; Sasidhara, S. A Compendium of Processing Maps; ASM International: Novelty, OH, USA, 1997. [Google Scholar]
- Prasad, Y.V.R.K. Processing maps: A status report. J. Mater. Eng. Perform. 2003, 12, 638–645. [Google Scholar] [CrossRef]
- Pu, E.X.; Zheng, W.J.; Xiang, J.Z.; Song, Z.G.; Li, J. Hot deformation characteristic and processing map of super austenitic stainless steel S32654. Mater. Sci. Eng. A 2014, 598, 174–182. [Google Scholar] [CrossRef]
- Chiba, A.; Lee, Sa.; Matsumoto, H.; Nakamura, M. Construction of processing map for biomedical Co–28Cr–6Mo–0.16N alloy by studying its hot deformation behavior using compression tests. Mater. Sci. Eng. A 2009, 513–514, 286–293. [Google Scholar] [CrossRef]
- Ikuhara, Y.; Shibata, N.; Watanabe, T.; Oba, F.; Yamamoto, T.; Sakuma, T. Grain boundary characters and structures in structural ceramics. Chim. Sci. Mater. 2002, S27, 21–30. [Google Scholar]
- Gourdet, S.; Montheillet, F. A model of continuous dynamic recrystallization. Acta Mater. 2003, 51, 2685–2699. [Google Scholar] [CrossRef]
- Prased, Y.V.R.K. Author’s reply: Dynamic materials model: Base and principles. Metall. Mater. Trans. A 1996, 27, 235–236. [Google Scholar] [CrossRef]
- Babu, K.A.; Mandal, S.; Kumar, A.; Athreya, C.N.; Boer, B.D.; Sarma, V.S. Characterization of hot deformation behavior of alloy 617 through kinetic analysis, dynamic material modeling and microstructural studies. Mater. Sci. Eng. A 2016, 664, 177–187. [Google Scholar] [CrossRef]
- Liu, Y.H.; Ning, Y.Q.; Yang, X.M.; Yao, Z.K.; Guo, H.Z. Effect of temperature and strain rate on the workability of FGH4096 superalloy in hot deformation. Mater. Des. 2016, 95, 669–676. [Google Scholar] [CrossRef]
- Sun, Y.; Hu, L.X.; Ren, J.S. Investigation on the hot deformation behavior of powder metallurgy TiAl-based alloy using 3D processing map. Mater. Charact. 2015, 100, 163–169. [Google Scholar] [CrossRef]
- Guo, S.G.; Li, D.F.; Guo, Q.M.; Wu, Z.G.; Peng, H.J.; Hu, J. Investigation on hot workability characteristics of Inconel 625 superalloy using processing maps. J. Mater. Sci. 2012, 47, 5867–5878. [Google Scholar] [CrossRef]
- Sui, F.L.; Xu, L.X.; Chen, L.Q.; Liu, X.H. Processing map for hot working of Inconel 718 alloy. J. Mater. Process. Technol. 2011, 211, 433–440. [Google Scholar] [CrossRef]
Figure 1.
Micrographs before test (a) 2W (b) 4W.

Figure 2.
True strain–true stress curves of 2W; (a) = 0.01 s−1; (b) = 0.1 s−1; (c) = 1 s−1; (d) = 10 s−1.
Figure 2.
True strain–true stress curves of 2W; (a) = 0.01 s−1; (b) = 0.1 s−1; (c) = 1 s−1; (d) = 10 s−1.
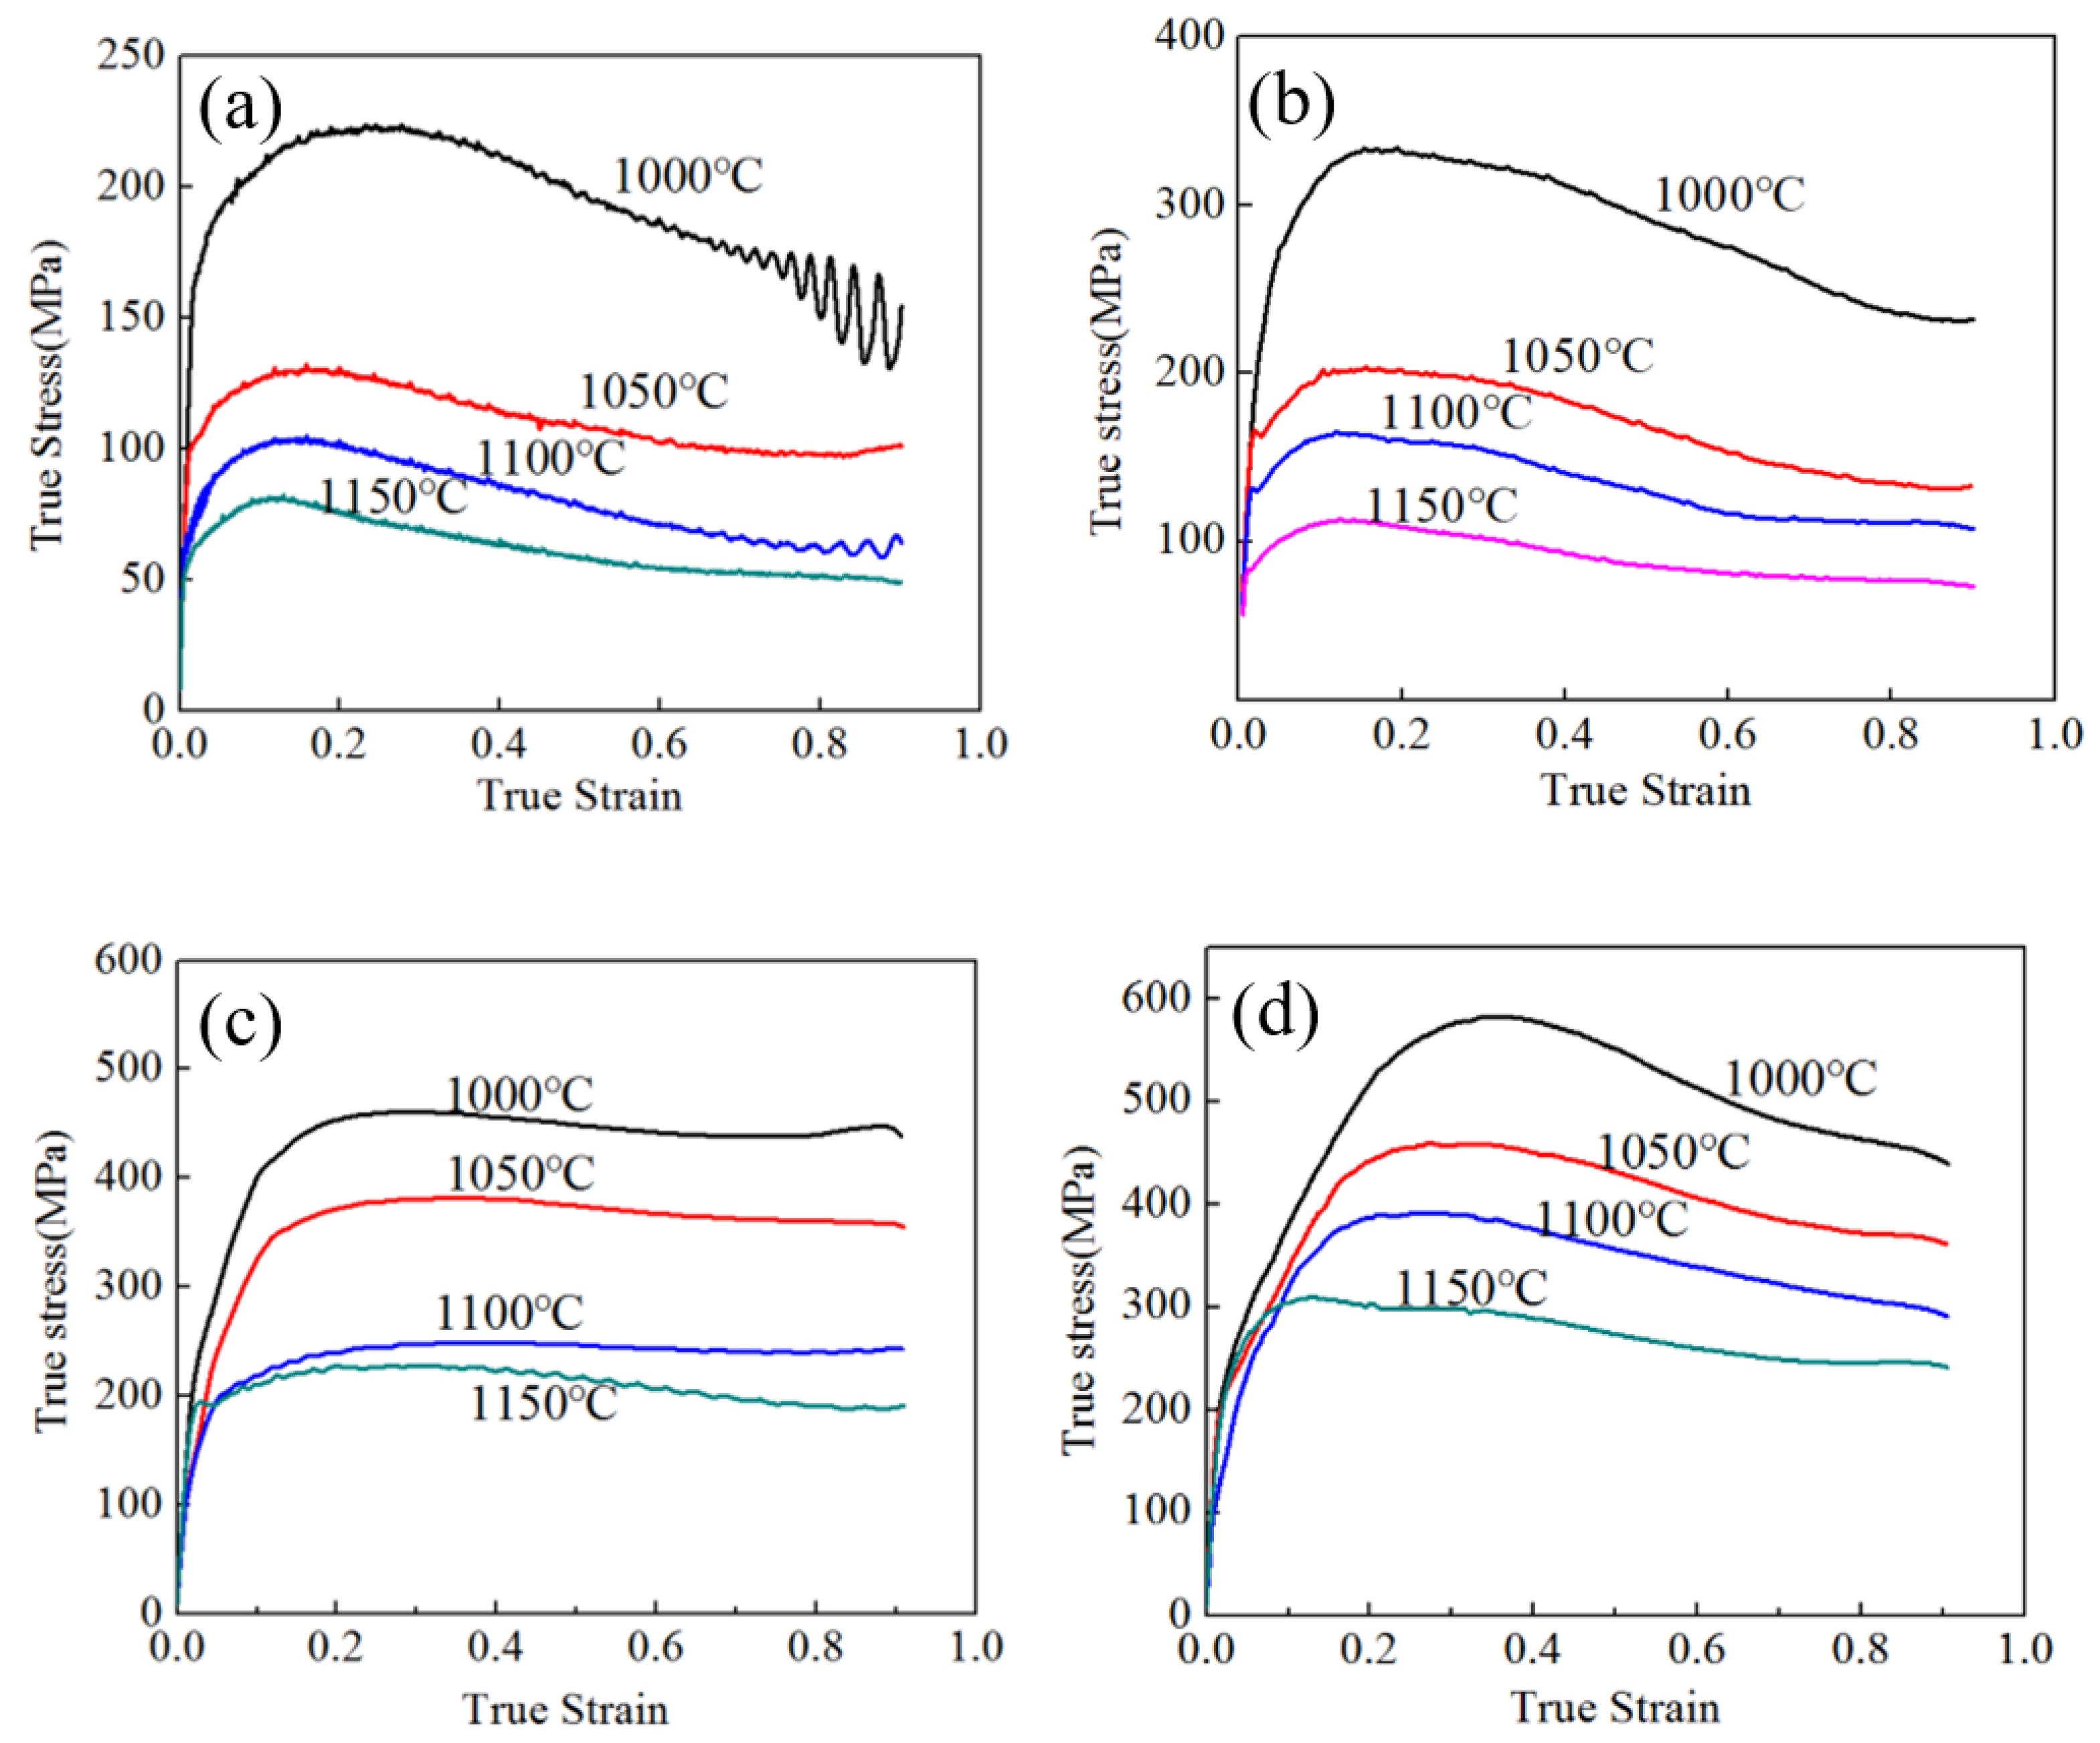
Figure 3.
True strain–true stress curves of 4W; (a) = 0.01 s−1; (b) = 0.1 s−1; (c) = 1 s−1; (d) = 10 s−1.
Figure 3.
True strain–true stress curves of 4W; (a) = 0.01 s−1; (b) = 0.1 s−1; (c) = 1 s−1; (d) = 10 s−1.

Figure 4.
Peak stress at different strain rates.

Figure 5.
Linear relationships of (a) ln vs. ; (b) ln vs. ln; (c) ln[sinh()] vs. ln; (d) ln[sinh()] vs. 10000/T; (e) lnZ vs. ln[sinh()] of 2W.
Figure 5.
Linear relationships of (a) ln vs. ; (b) ln vs. ln; (c) ln[sinh()] vs. ln; (d) ln[sinh()] vs. 10000/T; (e) lnZ vs. ln[sinh()] of 2W.

Figure 6.
Linear relationships of (a) ln vs. ; (b) ln vs. ln; (c) ln[sinh()] vs. ln; (d) ln[sinh()] vs. 10000/T; (e) lnZ vs. ln[sinh()] of 4W.
Figure 6.
Linear relationships of (a) ln vs. ; (b) ln vs. ln; (c) ln[sinh()] vs. ln; (d) ln[sinh()] vs. 10000/T; (e) lnZ vs. ln[sinh()] of 4W.

Figure 7.
The band contrast maps of 2W deformed at 1050–1150 °C with a strain rate of 1 s−1; (a) 1000 °C; (b) 1050 °C; (c) 1100 °C; (d) 1150 °C.
Figure 7.
The band contrast maps of 2W deformed at 1050–1150 °C with a strain rate of 1 s−1; (a) 1000 °C; (b) 1050 °C; (c) 1100 °C; (d) 1150 °C.

Figure 8.
The band contrast maps of 4W deformed at 1050–1200 °C with a strain rate of 1 s−1; (a) 1050 °C; (b) 1100 °C; (c) 1150 °C; (d) 1200 °C.
Figure 8.
The band contrast maps of 4W deformed at 1050–1200 °C with a strain rate of 1 s−1; (a) 1050 °C; (b) 1100 °C; (c) 1150 °C; (d) 1200 °C.

Figure 9.
The misorientation distribution maps of 2W deformed at 1000–1150 °C with a strain rate of 1 s−1; (a) 1000 °C; (b) 1050 °C; (c) 1100 °C; (d) 1150 °C.
Figure 9.
The misorientation distribution maps of 2W deformed at 1000–1150 °C with a strain rate of 1 s−1; (a) 1000 °C; (b) 1050 °C; (c) 1100 °C; (d) 1150 °C.

Figure 10.
Dynamic recrystallization (DRX) distribution maps of two alloys deformed at 1100 °C and 1 s−1. (a) 2W; (b) 4W.
Figure 10.
Dynamic recrystallization (DRX) distribution maps of two alloys deformed at 1100 °C and 1 s−1. (a) 2W; (b) 4W.

Figure 11.
The proportion of recrystallization of two alloys deformed at 1000–1200 °C and 1 s−1. (a) 2W; (b) 4W.
Figure 11.
The proportion of recrystallization of two alloys deformed at 1000–1200 °C and 1 s−1. (a) 2W; (b) 4W.

Figure 12.
The correlation between the peak stress and dynamic recovery (DRV) fraction.

Figure 13.
The microscopies of 2W deformed at 950–1050 °C with a strain rate of 1 s−1; (a) 950 °C; (b) 1000 °C; (c) 1050 °C; (d) 1050 °C.
Figure 13.
The microscopies of 2W deformed at 950–1050 °C with a strain rate of 1 s−1; (a) 950 °C; (b) 1000 °C; (c) 1050 °C; (d) 1050 °C.

Figure 14.
The cracks on the surface of samples of 2W.

Figure 15.
The cracks in the depressed samples of 2W; (a) 950 °C with a strain rate of 1 s−1 (b) 1200 °C with a strain rate of 1 s−1.
Figure 15.
The cracks in the depressed samples of 2W; (a) 950 °C with a strain rate of 1 s−1 (b) 1200 °C with a strain rate of 1 s−1.
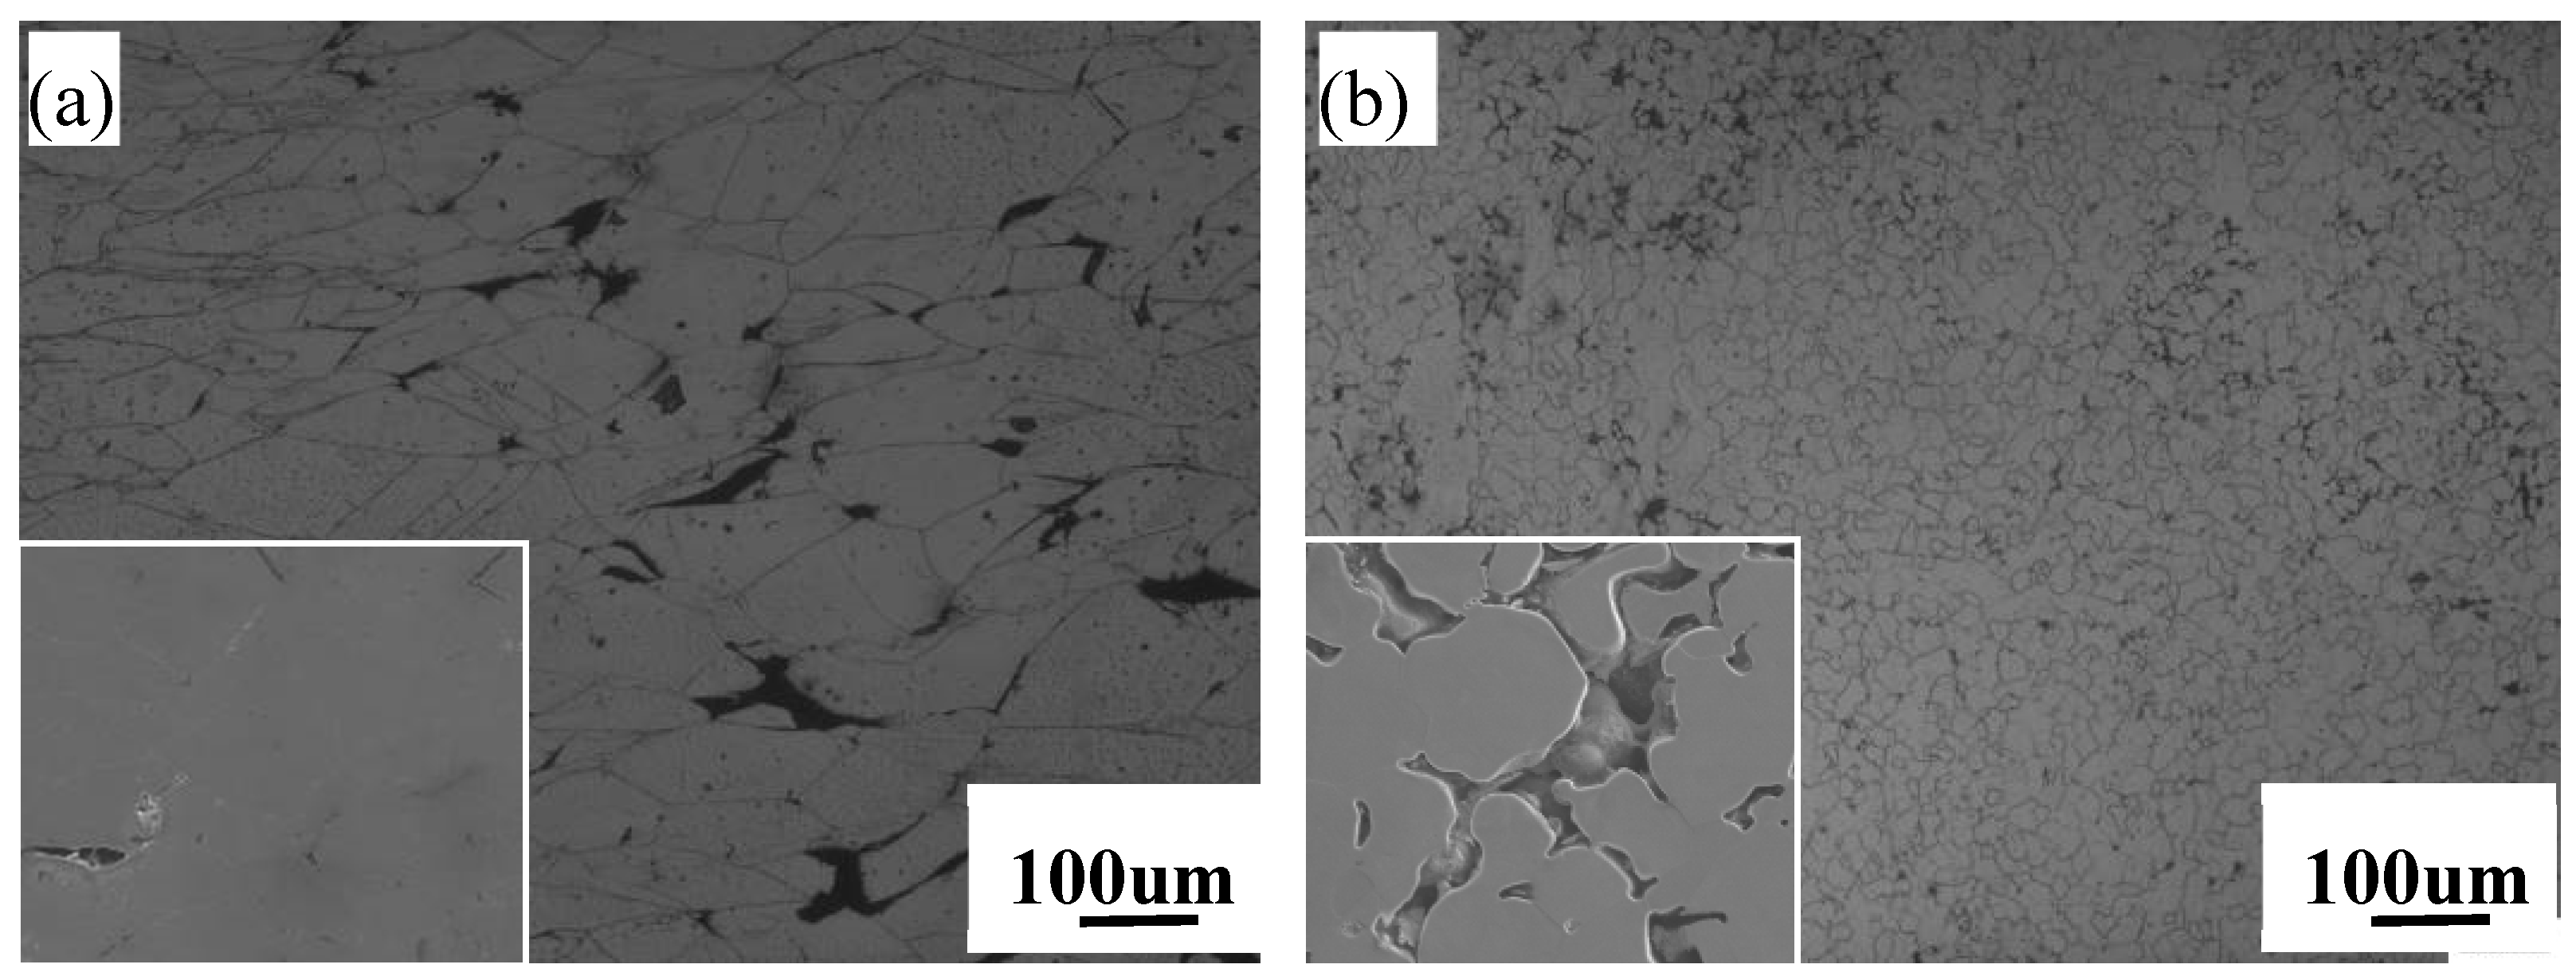
Figure 16.
Processing maps for nickel-based super-alloy of 2W at true strains of (a) 0.2, (b) 0.4, (c) 0.6, (d) 0.8. The contour values is power dissipation efficiency expressed in pct.
Figure 16.
Processing maps for nickel-based super-alloy of 2W at true strains of (a) 0.2, (b) 0.4, (c) 0.6, (d) 0.8. The contour values is power dissipation efficiency expressed in pct.

Figure 17.
Processing maps for Nickel-based super-alloy of 4W at true strains of (a) 0.2, (b) 0.4, (c) 0.6, (d) 0.8. The contour values is power dissipation efficiency expressed in pct.
Figure 17.
Processing maps for Nickel-based super-alloy of 4W at true strains of (a) 0.2, (b) 0.4, (c) 0.6, (d) 0.8. The contour values is power dissipation efficiency expressed in pct.


Table 1.
Mass percentage of the GY200 alloys.
| Chemical Element | C | Cr | Co | Al | Ti | W | Mo | Zr | B | Ni |
|---|---|---|---|---|---|---|---|---|---|---|
| 2W | 0.04 | 19.33 | 13.58 | 1.48 | 3.01 | 1.97 | 2.19 | 0.041 | ≤0.01 | Bal. |
| 4W | 0.04 | 19.35 | 13.66 | 1.51 | 2.93 | 3.94 | 2.02 | 0.066 | ≤0.01 | Bal. |
Table 2.
The frequency of misorentation angle at different deformed temperature for 2W and 4W.
| Range of Misorientation Angle(°) | 1000 °C | 1050 °C | 1100 °C | 1150 °C | |
|---|---|---|---|---|---|
| 0–5 | 2W | 0.53 | 0.20 | 0.27 | 0.267 |
| 4W | - | 0.364 | 0.173 | 0.219 | |
| 5–15 | 2W | 0.027 | 0.025 | 0.023 | 0.03 |
| 4W | - | 0.016 | 0.022 | 0.033 | |
| 15–30 | 2W | 0.078 | 0.092 | 0.111 | 0.125 |
| 4W | - | 0.07 | 0.08 | 0.103 | |
| 30–50 | 2W | 0.222 | 0.285 | 0.326 | 0.344 |
| 4W | - | 0.236 | 0.299 | 0.313 | |
© 2019 by the authors. Licensee MDPI, Basel, Switzerland. This article is an open access article distributed under the terms and conditions of the Creative Commons Attribution (CC BY) license (http://creativecommons.org/licenses/by/4.0/).
Share and Cite
MDPI and ACS Style
Gong, Z.; Bao, H.; Yang, G. Dynamic Recrystallization and Hot-Working Characteristics of Ni-Based Alloy with Different Tungsten Content. Metals 2019, 9, 298. https://doi.org/10.3390/met9030298
AMA Style
Gong Z, Bao H, Yang G. Dynamic Recrystallization and Hot-Working Characteristics of Ni-Based Alloy with Different Tungsten Content. Metals. 2019; 9(3):298. https://doi.org/10.3390/met9030298
Chicago/Turabian StyleGong, Zhihua, Hansheng Bao, and Gang Yang. 2019. "Dynamic Recrystallization and Hot-Working Characteristics of Ni-Based Alloy with Different Tungsten Content" Metals 9, no. 3: 298. https://doi.org/10.3390/met9030298
Note that from the first issue of 2016, this journal uses article numbers instead of page numbers. See further details here.