1. Introduction
Recent years have seen a growth in popularity of the concept of architectured materials, which makes potential breakthroughs in materials science a realistic possibility [
1,
2,
3,
4]. This has prompted innovative developments in various areas of materials engineering and design [
4]. In particular, the emerged paradigm of architectured materials offered an invigorating stimulus to the area of severe plastic deformation (SPD) technologies [
5,
6]. Not only can these technologies produce a submicron scale grain structure that provides metals and alloys with exceptional mechanical performance, but they can also be used to form various inner architectures of a workpiece at а mesoscopic and macroscopic scale [
7,
8,
9,
10,
11]. In this regard, the SPD methods involving plastic torsion, such as high pressure torsion (HPT) [
12,
13], incremental HPT [
14], twist extrusion [
15], shear extrusion [
16], high pressure torsion extrusion (HPTE) [
17,
18], torsion extrusion [
19], three roll planetary milling [
20], spiral equal channel angular extrusion [
21], tandem process of simple shear extrusion, and twist extrusion [
22]. Along with producing a submicron scale structure in the processed materials, these methods make it possible to form a helical architecture of various inclusions or reinforcements introduced in a workpiece beforehand [
7,
8,
9,
11,
23]. These kinds of structures often occur in nature [
24], which suggests that they may be very beneficial and promising in materials engineering as well. In particular, ultrafine-grained (UFG) materials with helical inner architecture offer themselves for applications of magnesium, aluminium, and titanium alloys in lightweight structures with high specific strength [
9].
Multi-scale structures produced by SPD techniques are controlled by deformation processes. Therefore, for obtaining submicron structured architectured materials with desired characteristics, specific parameters of the SPD process need to be established. In some cases, the deformation of a sample can be effectively controlled through the appropriate choice of the tool geometry and/or the regime of the sample motion. The major problem is that the SPD processes mentioned above are not controllable in this way. Undesirable slippage of the sample at the contact surface with the container may cause non-steadiness of these processes, thus making them ill-controlled. For example, slippage during HPT causes a decrease in strain and its non-uniform distribution over the sample thickness [
25,
26]. A mathematical model [
27] that accounts for slippage makes it possible to predict such effects and design the process accordingly.
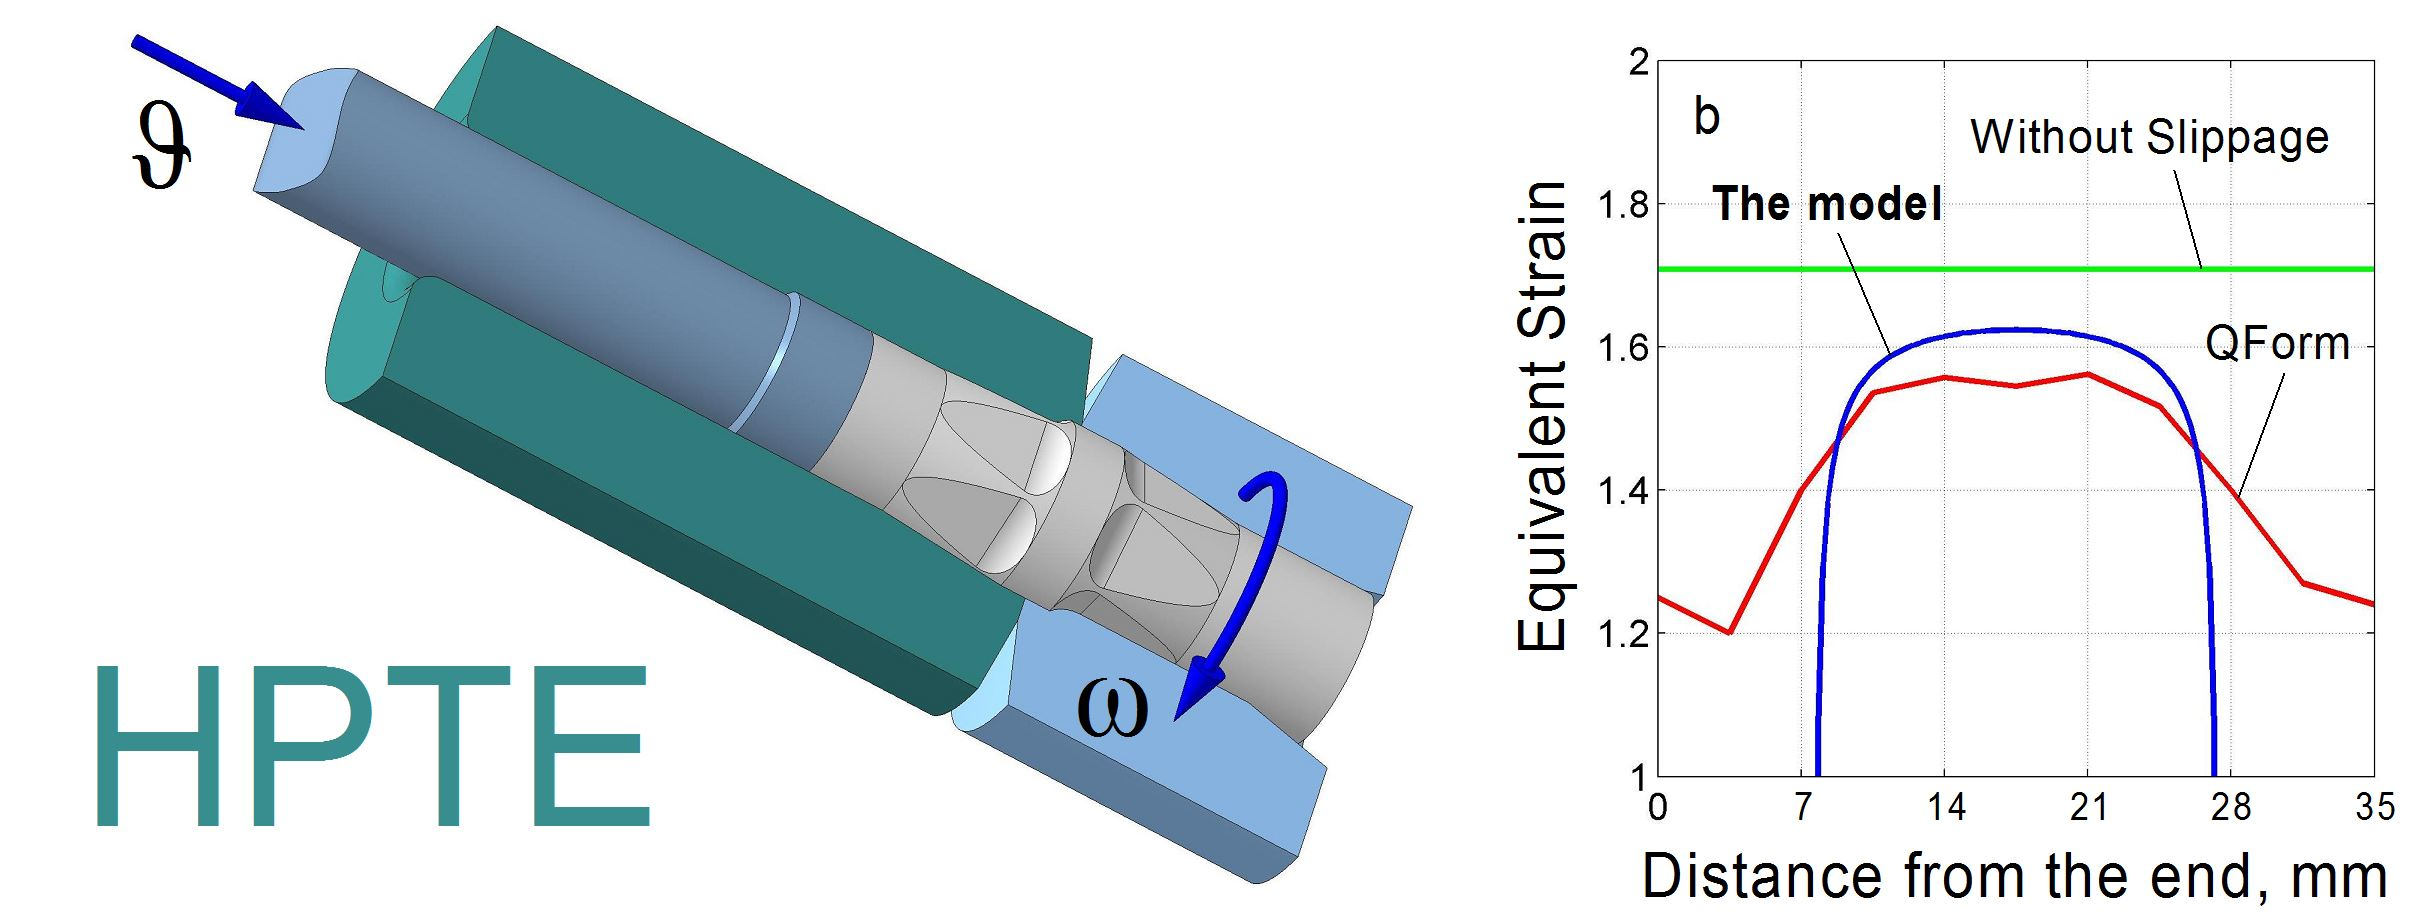
A detrimental effect of slippage also occurs during HPTE. In essence, in this process a cylindrical sample is moved through two joined coaxial containers, one of which is stationary and the other is rotated about its axis [
17]. The contact friction force in the second container produces rotation of the sample, which is opposed by the friction force in the first one. For sufficiently long portions of the sample in each of the two containers, these forces are large enough to produce a torque that is necessary for plastic deformation of the material. When these portions are not long enough, the sample slips in the tangential direction, the character of the process becomes non-steady and the equivalent von Mises strain at its initial and final stages is reduced.
HPTE combines the benefits of HPT with the ability to process long samples in a semi-continuous way—a quality the conventional HPT does not possess. This makes HPTE interesting for industrial scale applications. For better control of the HPTE process, a container design with special holding elements was suggested [
18]. For sufficiently large dimensions, this design ensures full suppression of sample slippage. However, long holding elements increase the non-uniformity of deformation of the end parts of the sample, which is undesirable. Thus, one is faced with the problem of finding a reasonable compromise between the conflicting requirements of maximizing the friction forces and minimizing the proportion of the non-uniformly deformed portion of the sample length.
Another crucial aspect of design of the HPTE process is ensuring that simple shear deformation occurs in a thin layer of the sample [
28,
29,
30]. To solve these problems, we propose a simple mathematical model that makes it possible to calculate the optimal parameters of the HPTE process. The model is presented in the subsequent sections.
2. The Model
The principal features of the НРТЕ process are schematically illustrated in
Figure 1, which also defines the quantities used in the calculations of the process.
In
Figure 1c, the plane where the two joined containers (not shown in the drawing) meet is denoted by
S. A cylindrical part of height
H indicates a zone in which the holding elements are located. We assume that at any time the sample consists of two stiff blocks: block 1 sitting in the stationary upper container and block 2 residing in the lower container that is rotated with an angular velocity ω. Owing to tangential slippage of the sample relative to the walls of the containers, the angular velocities ω
1 and ω
2 of the rotation of the blocks differ from those of the containers. The sample is translated downwards with a speed ϑ, so that the length of the first block is decreased and that of the second block is increased. The lengths of the parts of blocks 1 and 2 that lie outside of the holding elements are denoted
L1 and
L2, respectively. Obviously, they are related through
L1 +
L2 =
L −
H, where
L is the total sample length. The kinematics of the HPTE thus defined imposes rotation of blocks 1 and 2 with angular velocities ω
1 and ω
2. These are the quantities we set out to calculate.
Friction between the sample and the container walls gives rise to a stress τ =
mk, where
k is the shear yield stress of the material and
m is the coefficient of plastic friction. The plastic friction is assumed since large pressures are required to obtain high quality submicron microstructures, in which case such a model is more consistent with experiment than the classical Coulomb friction law [
31].
The material of the sample is assumed to be rigid-plastic and non-strain hardening. These assumptions are in keeping with the velocity field that experiences a discontinuity postulated below. We note that a strain hardening material does not allow for discontinuities. As was shown earlier (see, e.g., [
31]), these assumptions yield meaningful estimates of the equivalent strain.
Expressions for the torques associated with the friction forces acting on blocks 1 and 2 can be obtained in the following way. According to solid mechanics, an elementary torque d
Mf acting on a surface area d
S of a sample is given by d
Mf =
R·τd
S·sinβ, where β is the angle between the direction of the friction force and the rotation axis and
R is the radius of the cylindrical channels of the containers. Considering that at any point on the sample surface the friction force is directed against the direction of movement of that point relative to the container surface and using sinβ as determined from
Figure 1, the friction torques
Mf1 and
Mf2 acting on blocks 1 and 2 are obtained upon integration of the elementary torques over the surfaces of the two blocks:
The torques, produced by the upper and lower holding elements,
Mh1 and
Mh2, are assumed to be equal:
Mh1 =
Mh2 =
Mh. Their magnitude
Mh is presented in the form
Mh =
CMT, where
is the torque associated with the plastic twisting of the sample [
31];
C is a proportionality coefficient.
We further assume that for a given design of the holding elements, the magnitude of the torque they exert on the sample is proportional to their combined length, that is, that the relation Mh1 = (H/H0)MT holds, where H0 is the smallest length of the holding elements with the same design, which produce the torque MT.
The torques associated with friction forces at the end faces of the sample are neglected. Under this assumption the torque on the sample is underestimated, since in the real process the friction on its end surfaces produces torques of opposite sense in the upper and lower containers. As a result, the length of the deformed part of the sample is underestimated as well.
The magnitude of the resultant torques in the upper and lower containers is given by Mf1 + Mh and Mf2 + Mh respectively.
Let us consider two possible cases: (i) ω1 = ω2 = ω0 and (ii) ω2 > ω1.
In the first case, the sample moves as a whole, meaning that no plastic deformation occurs. In the second case, the tangential component of the velocity experiences a discontinuity at the plane where the two containers meet. Plasticity theory [
31] tells us that this leads to simple shear in the material corresponding to a von Mises strain
. Here [
ϑτ] is the absolute value of the jump in the tangential component of the velocity and is the absolute value of the velocity component normal to the plane of discontinuity. In our case, the relations [
ϑτ] =
r(ω
2 – ω
1) and
ϑn =
ϑ hold. Substitution of these expression in the above formula for the von Mises equivalent strain yields
Variant (i) is realized when the torque applied to the sample is smaller than the torque associated with plastic torsion. In that case only the equality of the absolute values of the torques acting on the sample in the two containers,
Mf1 +
Mh =
Mf2 +
Mh, must hold, which can be re-written as
We now use the equality ω
1 = ω
2 = ω
0 in Equation (5) and obtain the following implicit relation for the normalized velocity
a =
ϑ/(ω
R) of the rotation of the entire sample:
where
and
.
Variant (ii) is realized if the condition
is fulfilled. In this case the angular velocities of blocks 1 and 2 can be determined from a set of two equations: the torque equilibrium equation, Equation (6), and the relation expressed by Equation (7), which, after substitution of the expressions for the torques takes the form
Equation (8) can be re-written as
where
and
. The normalized frequency
can now be found from Equation (9). By combining Equations (4) and (9) the following equation for
:
We now wish to determine the conditions for variant (ii) to apply. To that end, we analyze Equations (9) and (10).
A non-negative solution of Equation (10) reads
where the parameter
b is defined by
It should be noted that Equation (9) is reduced to Equation (10) if the following substitutions
are made. As the condition
is fulfilled, the solution of Equation (9) reads
From Equations (11) and (14) it follows that a solution exists only in the range of
As
holds, Equation (14) puts a further restriction on the parameter ξ:
This is tantamount to the inequality
Combining inequalities (15) and (17) we have
It can thus be concluded that for plastic deformation of a sample to occur, the inequality
must be satisfied, i.e., the inequality
has to hold. Finally, substitution of the expressions defining the quantities
a and
b transforms inequality (19) to
This inequality, expressed in terms of the container geometry and process parameters, is a basis for determining the conditions for plastic twisting of a sample under HPTE to occur.
3. Results and Discussion
We now analyse the model proposed for conditions close to real experiment [
18]. The holding element design employed in [
18] did ensure the occurrence of plastic torsion of samples. Let us set
H0 to be equal to the length of a holding element used in experiment (
H0 = 24 mm). The characteristic process parameters used in [
18] and summarised in
Table 1 will be adopted in the analysis to follow.
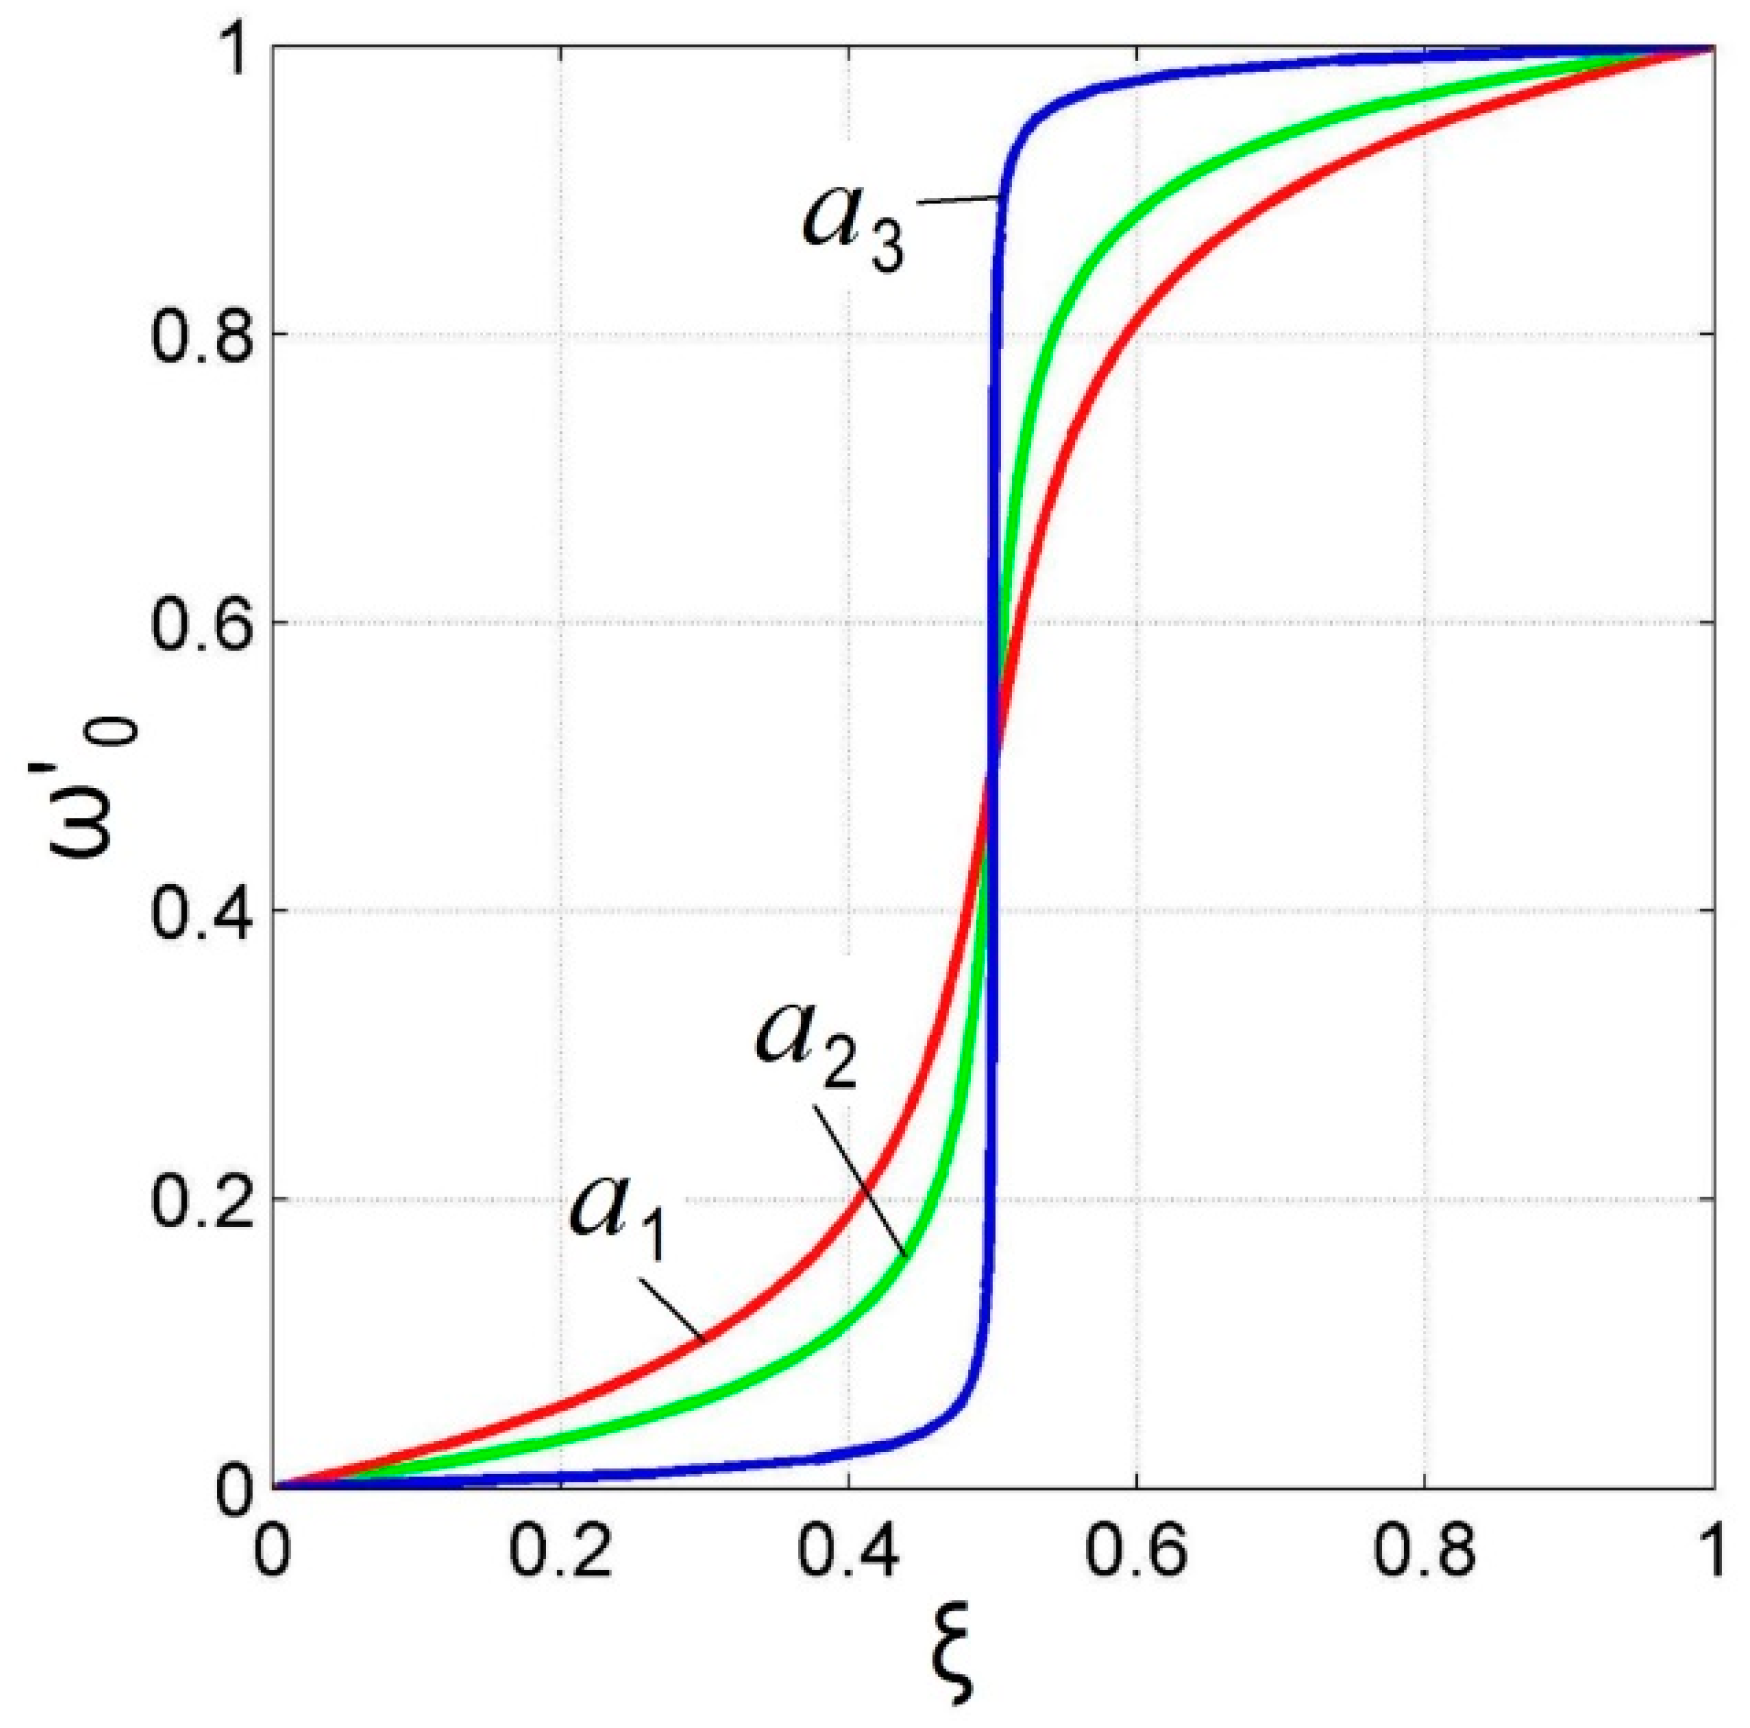
Figure 2 presents the dependence of
on ξ obtained by solving Equation (6) for three different values of the parameter
a.
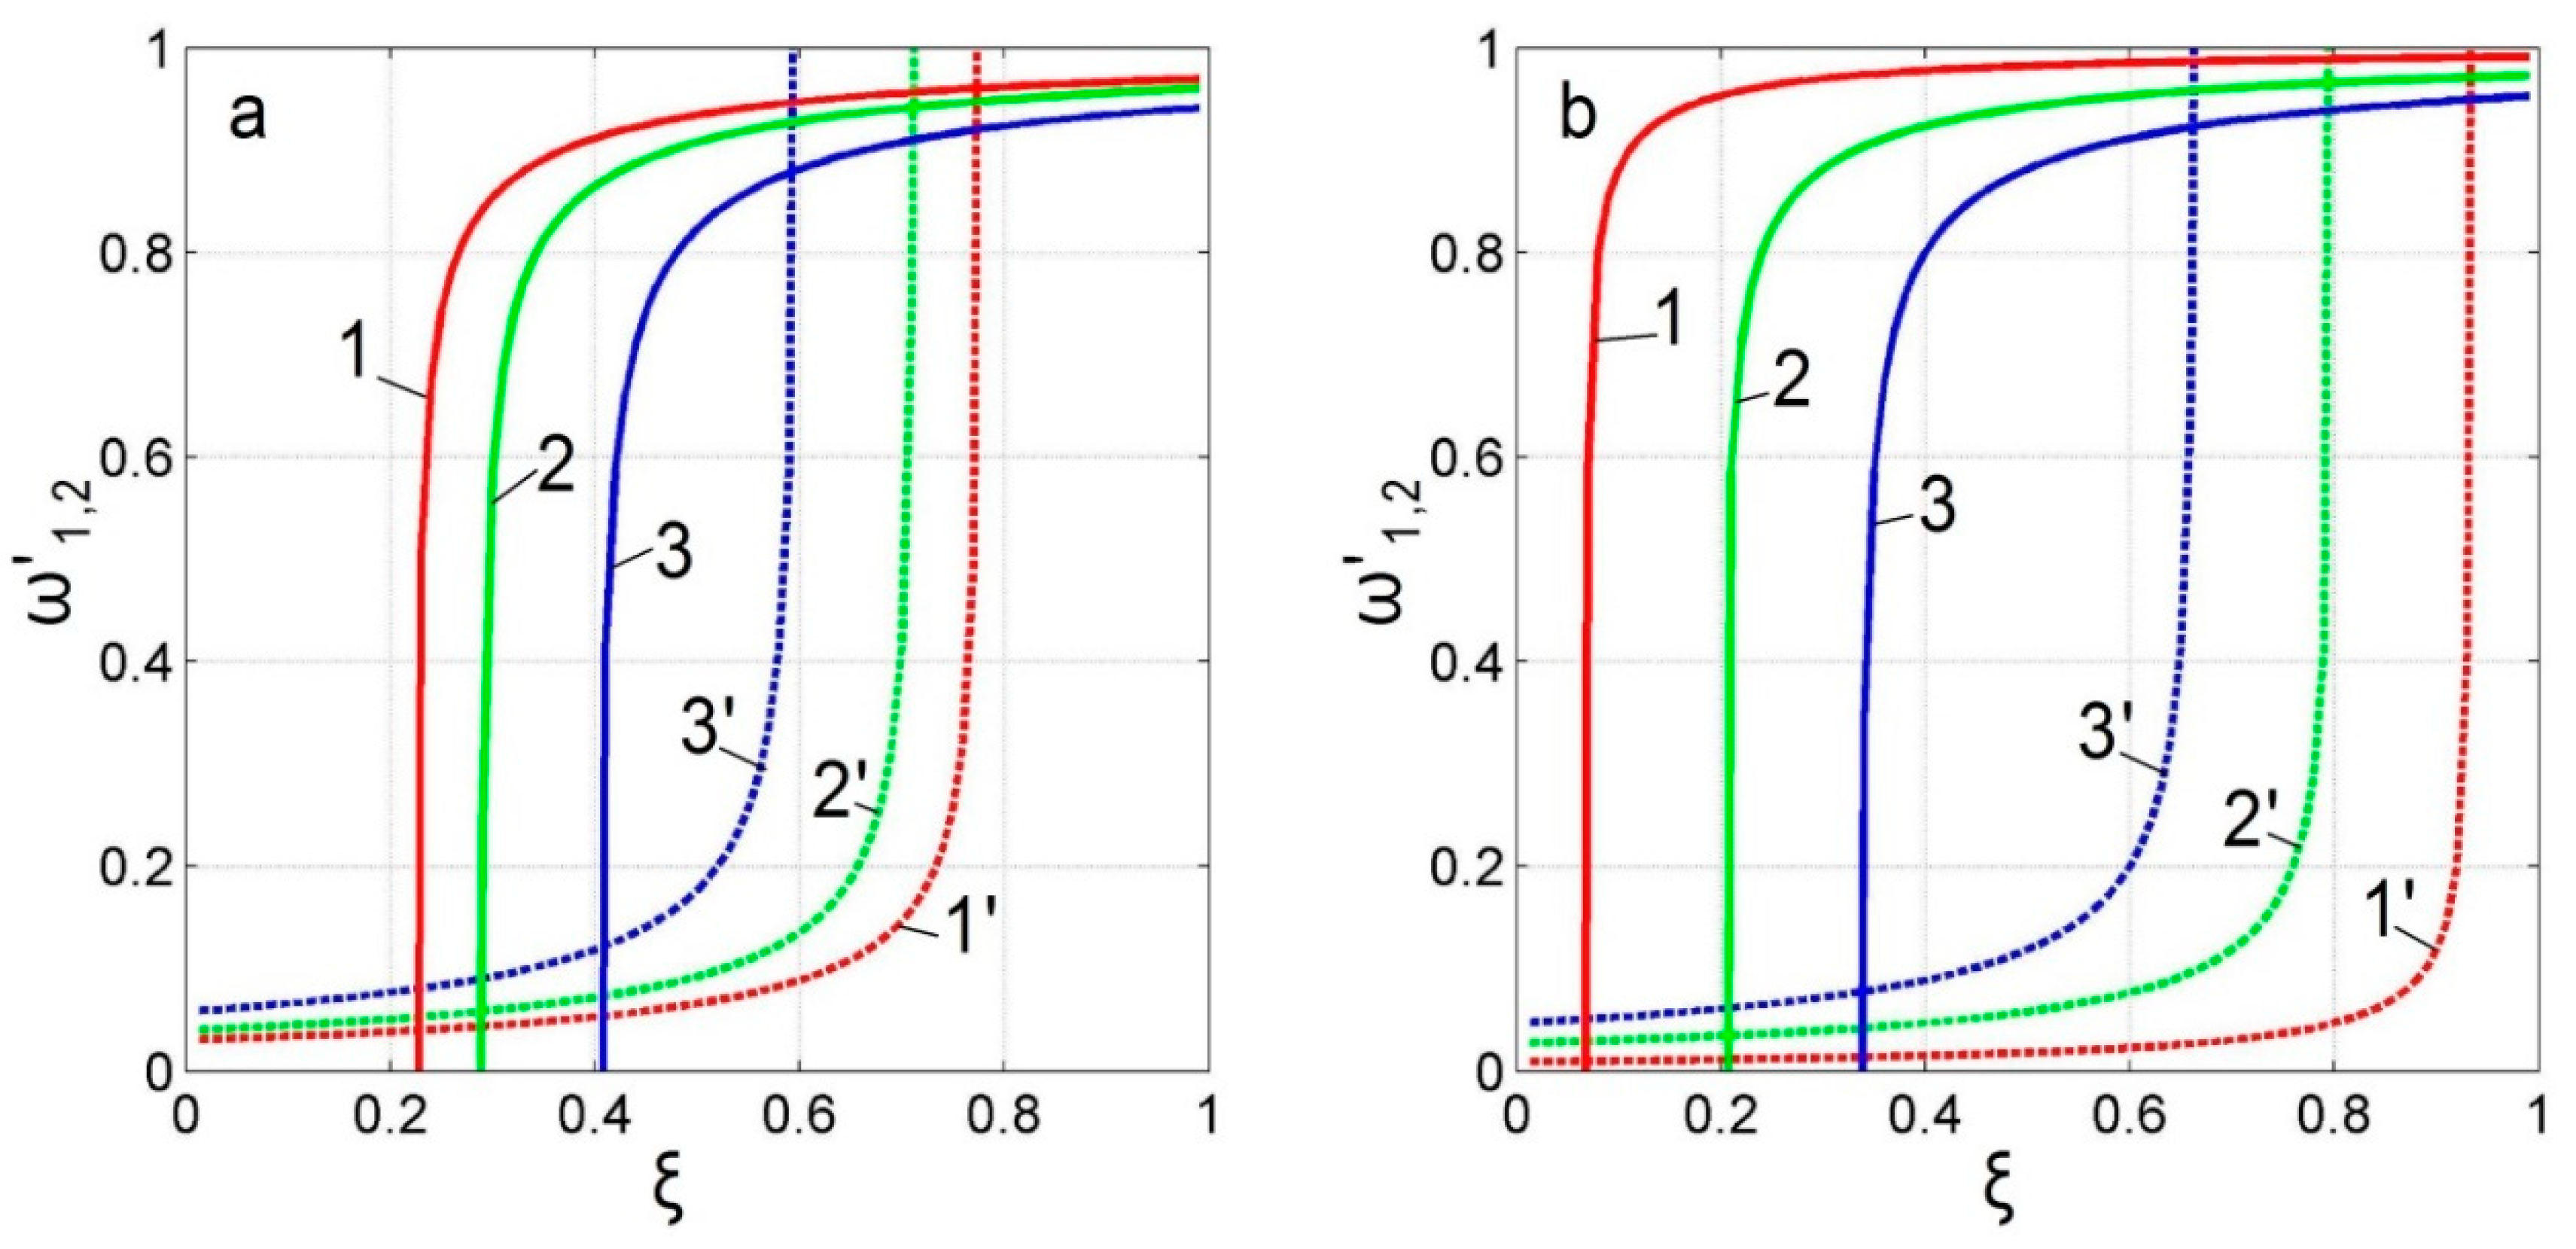
As seen from the graphs, the angular velocity of a rigid sample translated through the joint plane between the containers varies from zero (when the entire sample sits in the stationary upper container) to ω—the angular velocity of rotation of the lower container. The smaller the magnitude of the parameter a, the more precipitous is this transition from zero to ω at the point in time when the middle of the sample passes the joint plane between the two containers (ξ = 0.5).
The dependence of the angular velocities obtained by solving Equations (9) and (10) on the process parameters is presented graphically in
Figure 3, which depicts
and
vs. ξ.
As discussed above, plastic deformation of the sample only occurs for the range of parameters where the double inequality (18) is fulfilled. This corresponds to the region between the two intercepts of the curves for
and
in
Figure 3. The first intercept determines the beginning of the plastic twisting of the sample. As the sample moves through the container, the angular velocities of block 1 and block 2 rise. Initially,
grows faster, but, starting from ξ = 0.5, the growth of
becomes faster than that of
. Eventually, at the second intercept of the curves
vs. ξ and
vs. ξ, plastic twisting comes to a standstill.
Figure 3a illustrates the capacity of frictional forces with regard to the feasibility of HPTE without holding elements. For a fixed coefficient of friction (
m = 0.3) the holding elements enable a longer part of a sample to undergo deformation by simple shear, as evident from a comparison between
Figure 3a,b.
To verify the quality of the proposed mathematical model, we compare the distribution of the equivalent strain over the sample length following from Equation (5) with that calculated using the finite element software package QForm [
32]. Two variants of the computations will be considered. To do this, consider two options for calculating. The first one corresponds to a real experiment conducted on copper samples [
18]:
L = 35 mm,
H = 24 mm,
H0 = 24 mm,
R = 6 mm,
m = 0.15, ω = 1 rpm and
ϑ = 10 mm/min. In the second variant, shorter holding elements (
H = 12 mm) and a larger coefficient of friction (
m = 0.6) are employed in the calculations. Both variants were simulated using finite element method (FEM) modelling. The upper and the bottom containers as well as the punch were defined as rigid bodies, whereas the workpiece was represented by 30,000 tetragonal deformable elements. Adaptive meshing was also used for the workpiece. The material behavior was taken to be isotropic using the von Mises perfect plasticity model. Friction between the billet and the container walls was modelled by the plastic friction law.
Perfect plasticity was used both in the analytical model and in the FEM simulations. This was done to provide a common ground for both modelling approaches and enable a comparison between the predictions of the two models. Furthermore, in [
23] the authors looked into the influence of the choice of the material model on the deformation state of the workpiece and showed that the details of the constitutive law can be neglected in a first approximation. In this connection it should also be mentioned that experimental data for SPD exhibit a trend of the mechanical properties towards a steady state, thus justifying perfect plasticity as an adequate approach. One should recognise, however, that in some cases (see, e.g., [
33]) the rheology can have a strong influence on the deformation state of the workpiece leading to such effects as strain localisation. Investigations of such effects are enabled by simple rheological models, as suggested, for example, in [
34,
35]. An analysis of the role of rheology in the deformation behaviour of a workpiece under HPTE processing will be a subject of future research.
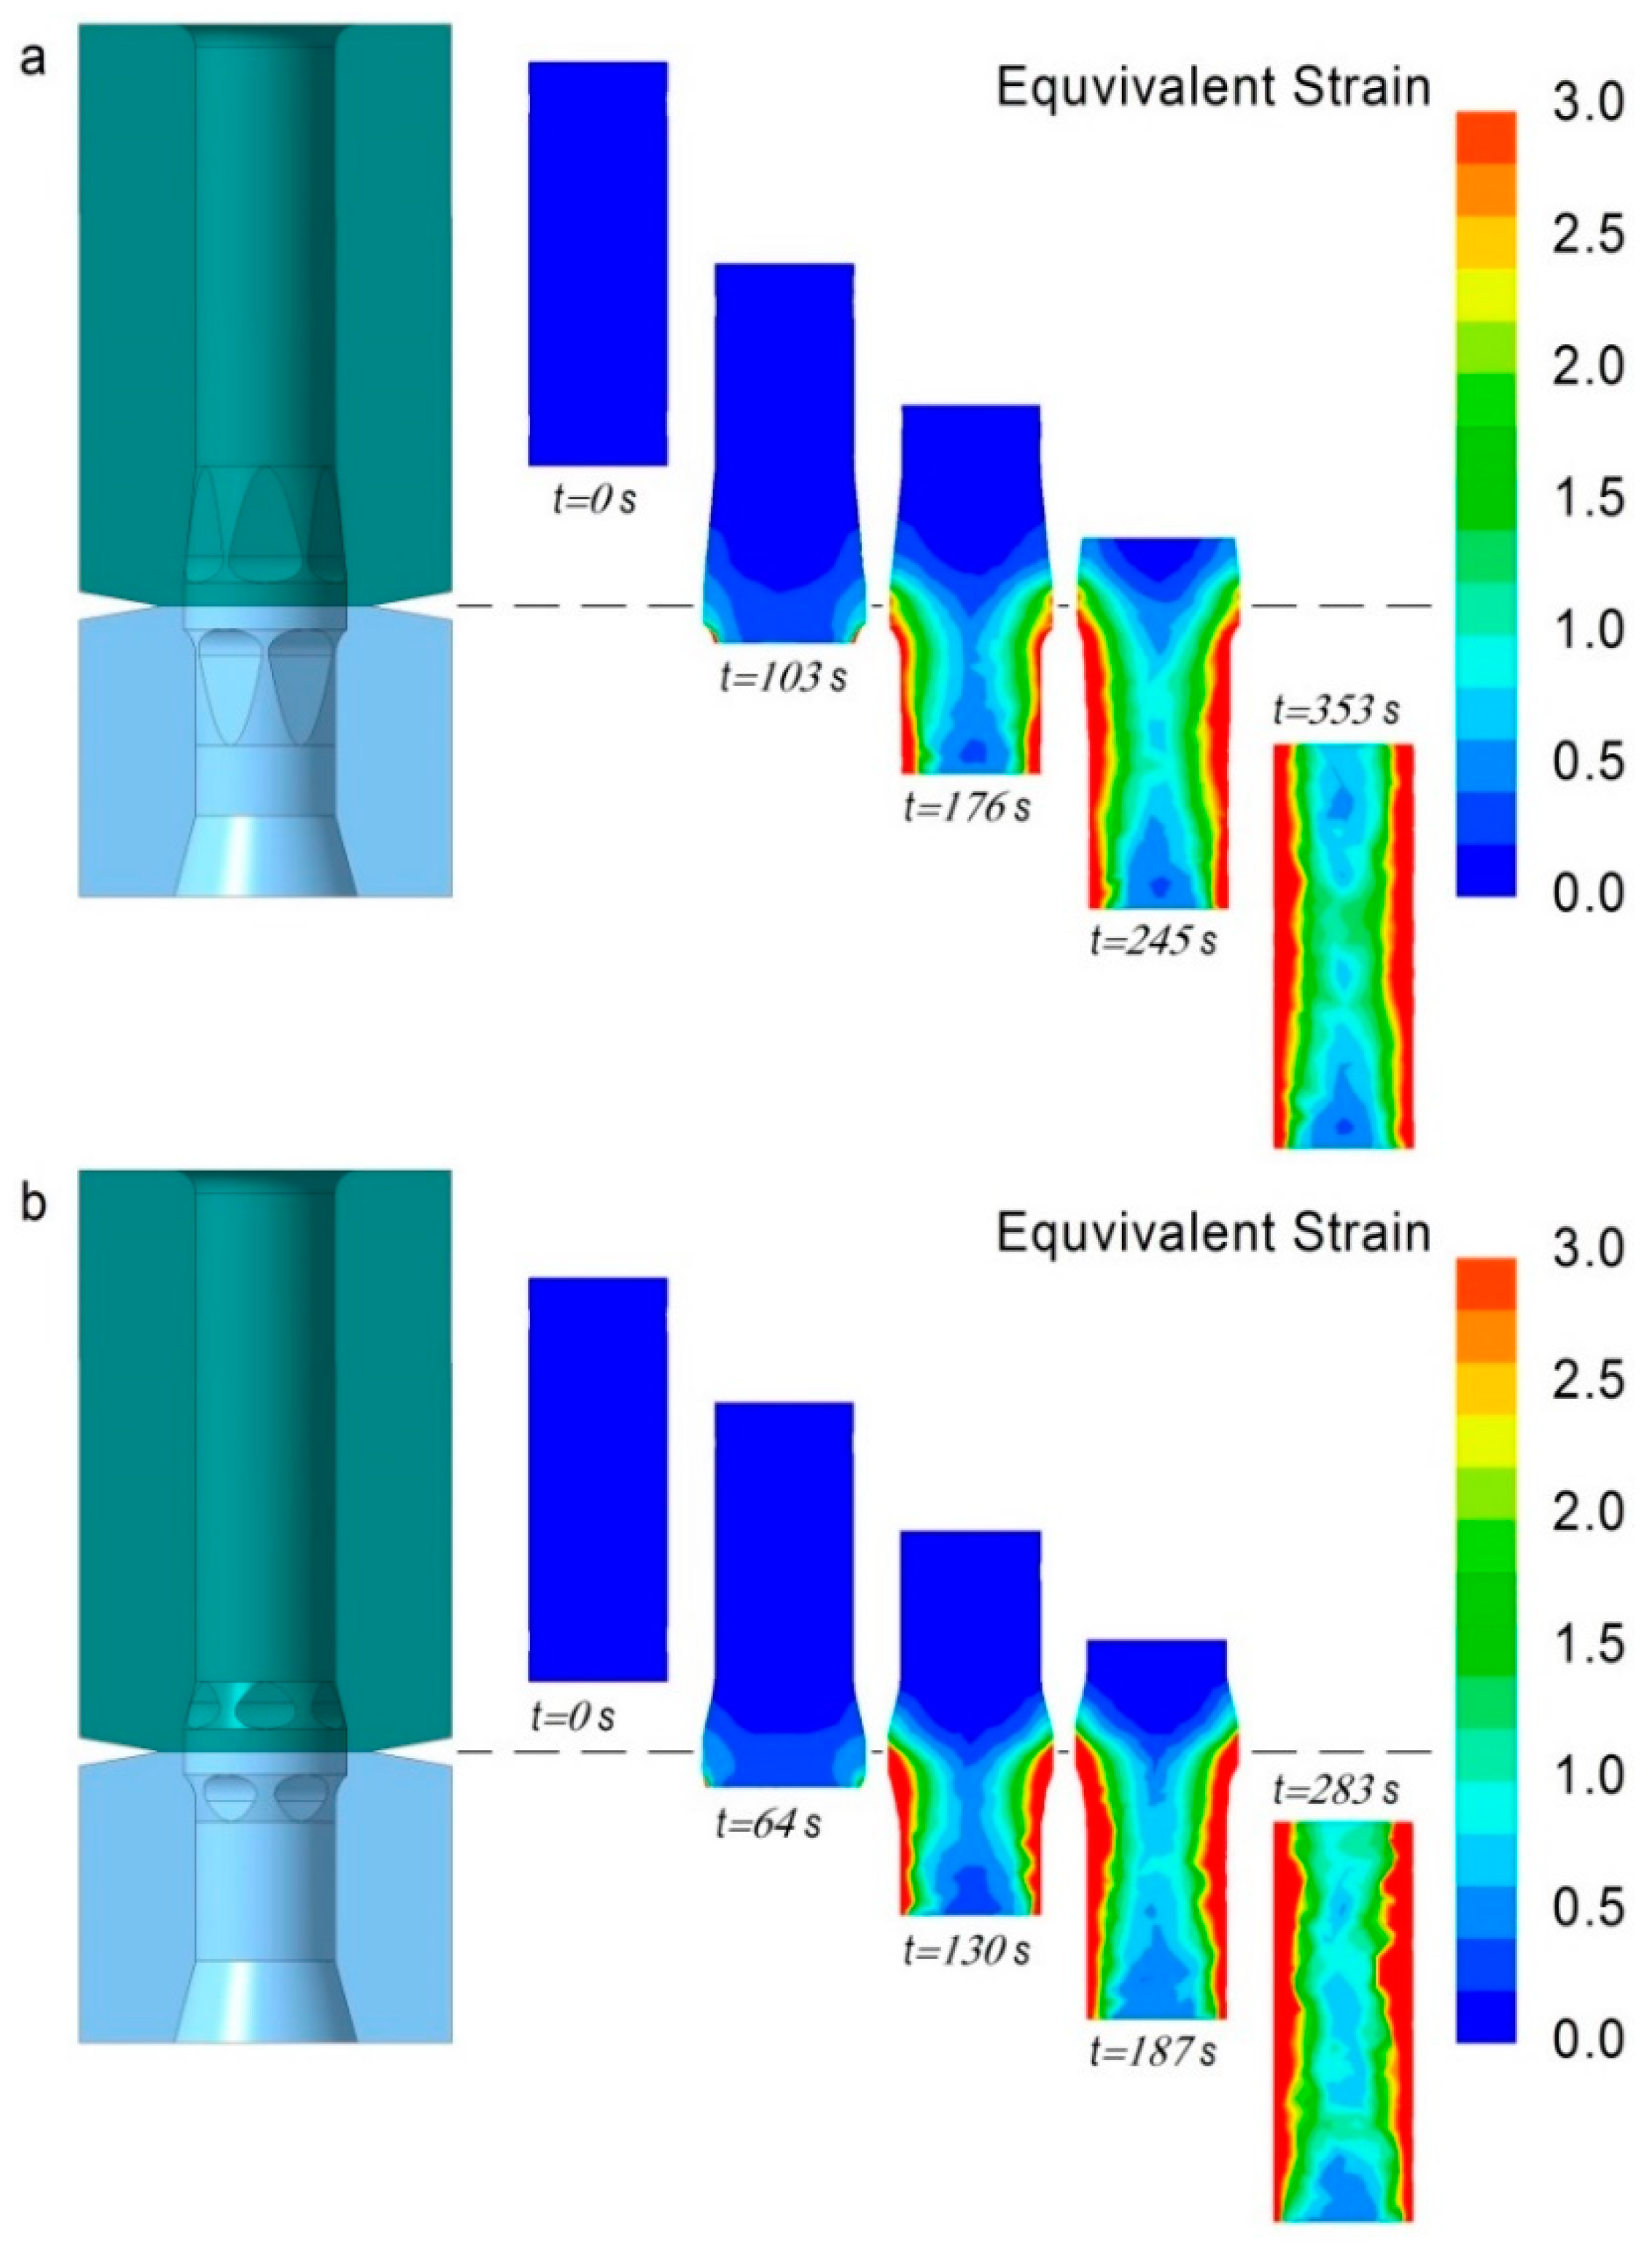
The equivalent strain distributions in the transversal cross-section through the middle of the sample for five consecutive points in time are presented in
Figure 4.
Figure 4 illustrates the accumulation of strain progressing with the movement of the sample through the holding elements. It clearly shows the non-uniformity of strain across the bulk of the sample. The dependence of the non-uniformity on the sample radius is associated with the increase of strain with the distance from the axis to the periphery of the sample, which is inherent in the torsion-based processes and is common to HPT and HPTE. Furthermore, near the surface the sample undergoes additional deformation through the cusps on the holding elements.
Non-uniformity of strain over the length of a sample is associated with a gradual increase of the counter-torque with the sample continually filling the holding elements, compounded with an insufficient capacity of the frictional forces at the beginning and the end of the process. The two variants considered differ in the contribution of these factors to the formation of the longitudinal non-uniformity. In the first variant (
Figure 4a), the holding elements provide the torque necessary for plastic twisting. This is enabled by their sufficiently large length, which leads to the relative size of the end zone being small. In the second variant (
Figure 4b), the gripping of the sample is established by a concerted action of the frictional forces and the holding elements. As their length is relatively small, the strain non-uniformity along the sample caused by the holding element size is reduced. Given the sufficiently large capacity of the frictional forces, the uniform part of the sample is large in relation to its length.
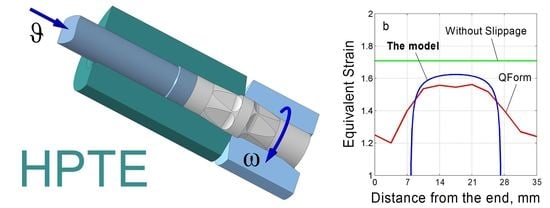
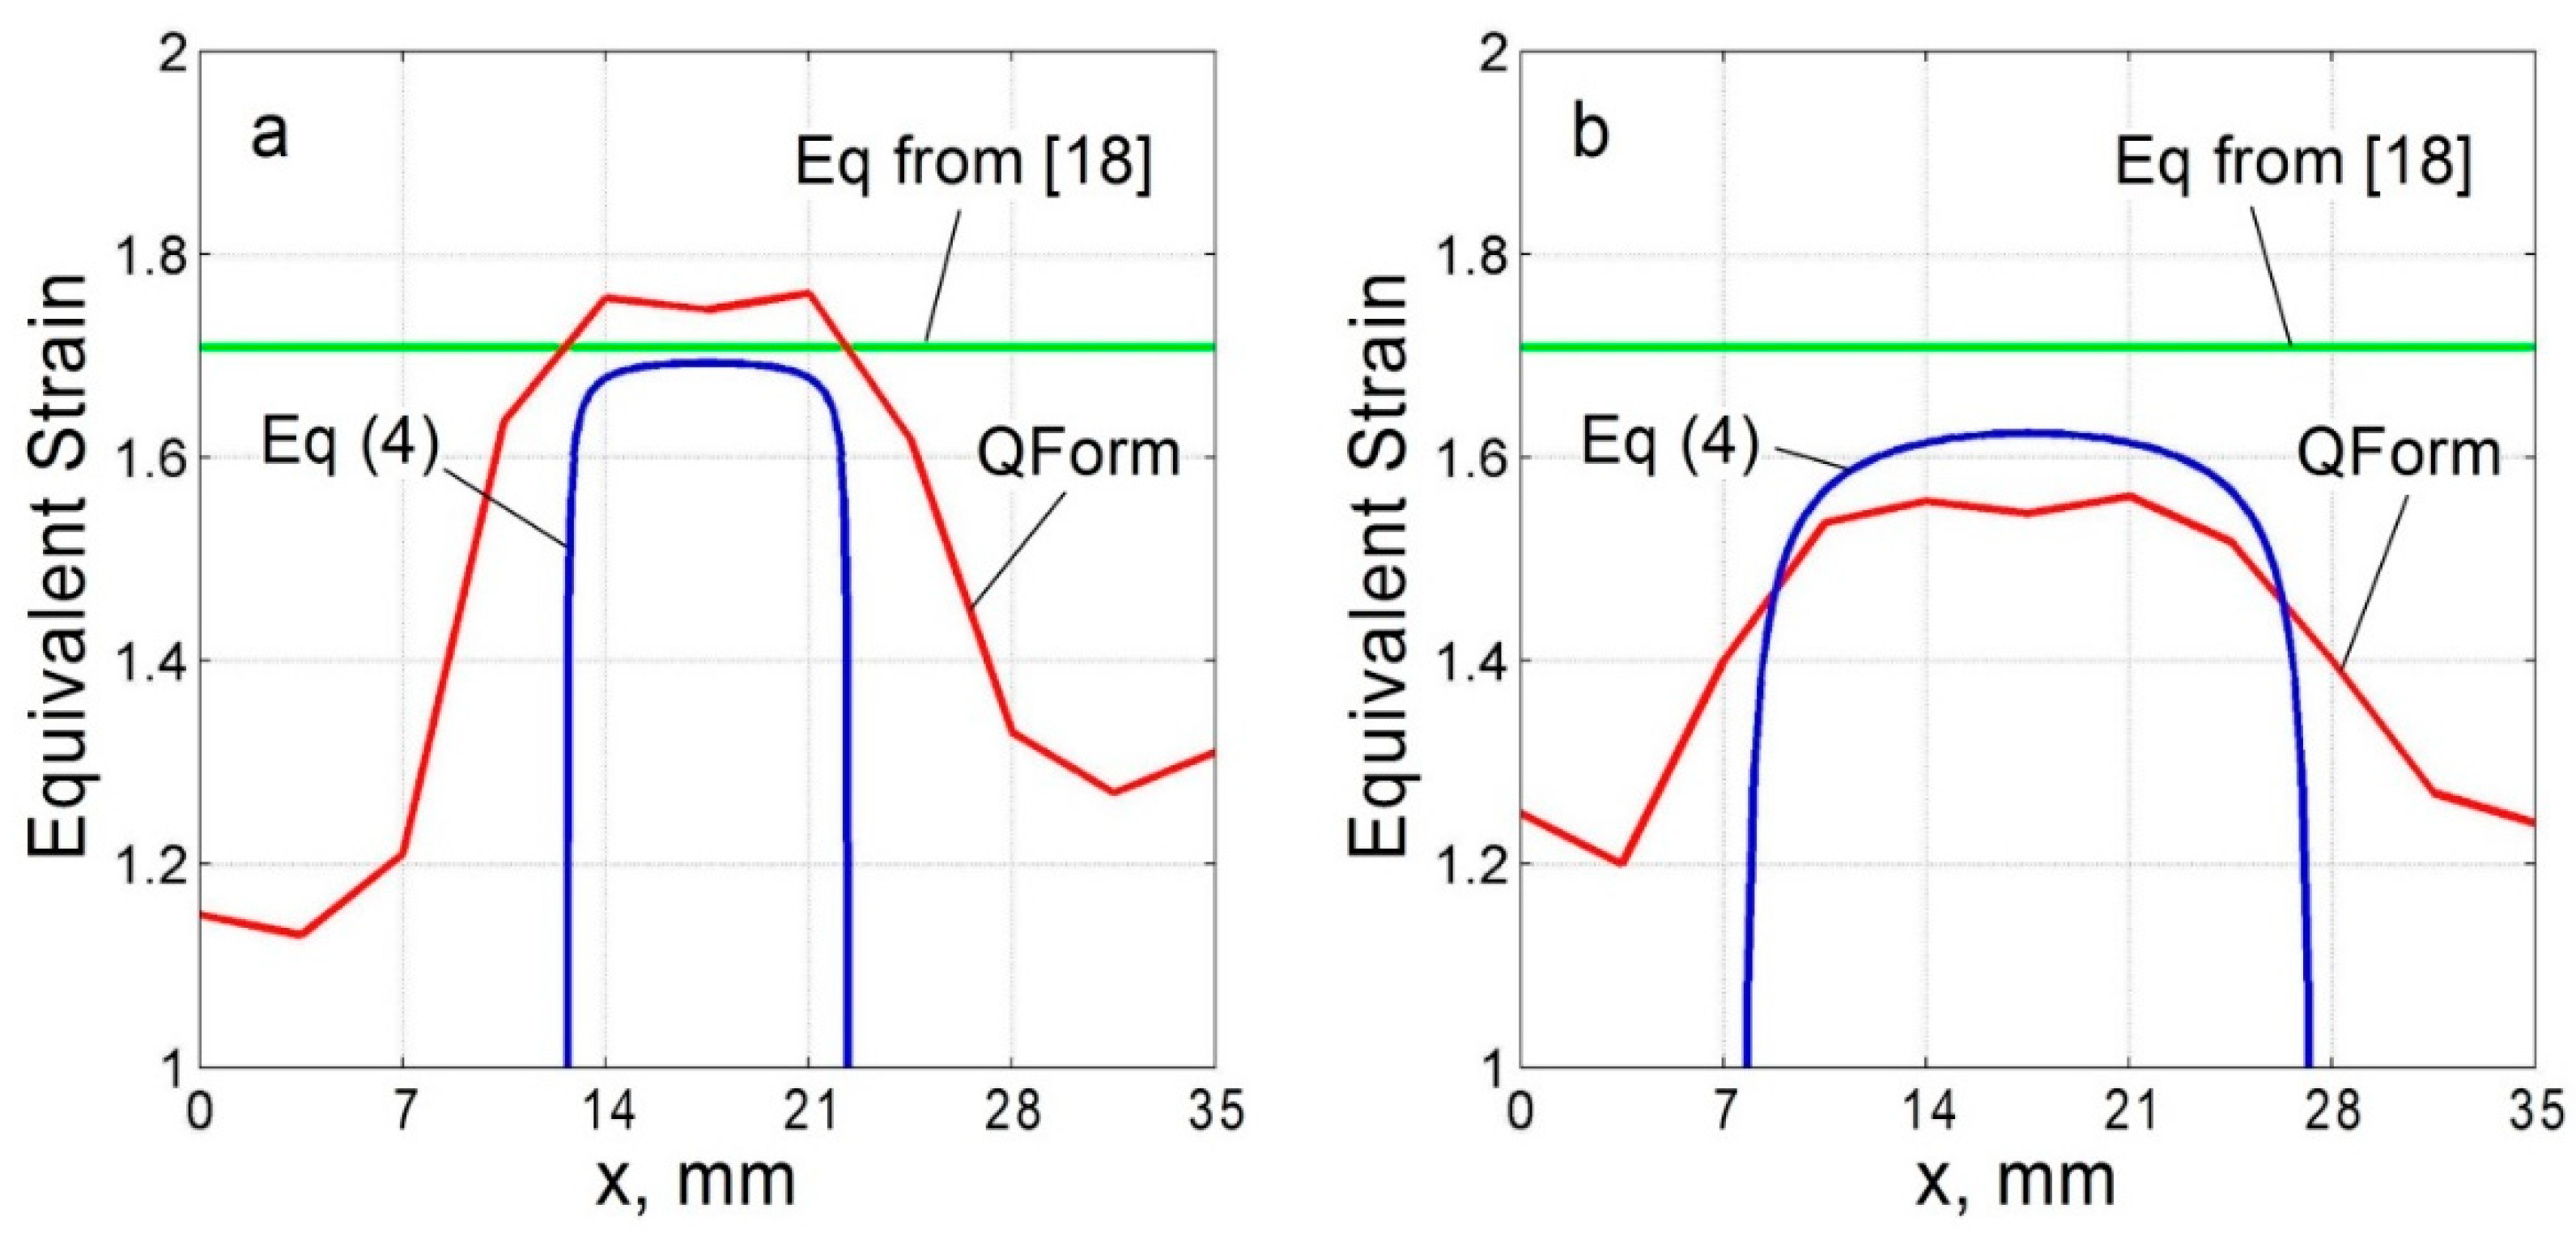
The above statements are supported by the diagrams in
Figure 5 which display equivalent strain distributions over the length of a sample at
r = 0.5
R.
As seen in
Figure 5, utilizing the friction force capacity in combination with the use of holding elements enables broadening of the uniformly deformed part of the sample. However, the magnitude of the equivalent strain in this portion of the sample is somewhat reduced. This is caused by slippage of the sample, which occurs in the case presented in
Figure 5b. In the absence of slippage, the maximum values of the equivalent strain as predicted by the analytical model coincide with those obtained from the simple relation proposed in Reference [
18] (cf.
Figure 5a). The magnitude of the maximum equivalent strain in steady state computed using QForm (Micas Simulations Limited, Oxford, UK) (also shown in
Figure 5) is somewhat larger. This is associated with some extra deformation in the sample parts contained within the holding elements.
Figure 5 also shows that the results obtained with the model outlined are in good agreement with the final element calculations, specifically those employing the QForm software. A precipitous drop of strain calculated using Equation (4) is caused by the model assumption that a holding element is to be fully filled with the deforming metal. In QForm, calculations are possible for partially filled holding elements, as well, which gives rise to descending parts of the graph.
Slippage of a sample relative to the containers leads to the emergence of a tangential near-surface flow of the metal within the holding elements. This gives rise to additional deformation with a shear plane aligned with the extrusion axis—an effect similar to the “cross flow” that occurs under Twist Extrusion [
23]. A kinematically possible velocity field suggested in this study leads to a linear variation of strain along a sample radius. As shown in Reference [
18], the strain distribution may deviate from a linear one. The current analytical modelling showed a good qualitative agreement with the results of FEM simulations with regard to the radial strain distribution, however. In addition, a good quantitative agreement was found for the regions at the periphery of a workpiece.
We consider the FEM simulation and the analytical model not as competing, but rather as being complementary to each other. The closed form analytical solution enables a large number of calculations for various combinations of the defining parameters at a low computational cost. This makes it possible to carry out initial screening as a first step in the process optimisation. This should be followed by high-precision numerical calculations as a second step of the optimisation procedure. Thus, both modelling approaches would be brought to bear in this two-step optimisation process.


