Effect of Manganese on Microstructure and Corrosion Behavior of the Mg-3Al Alloys
by
 , and
, and
Sheng Yao
1, 
Shuhong Liu
1,*,
Guang Zeng
2,
Xiaojing Li
1,
Ting Lei
1,
Yunping Li
1 and
Yong Du
1 1
National Key Laboratory of Science and Technology for National Defence on High-strength Structural Materials, Central South University, Changsha 410083, China
2
School of Materials Science and Engineering, Central South University, Changsha 410083, China
*
Author to whom correspondence should be addressed.
Metals 2019, 9(4), 460; https://doi.org/10.3390/met9040460
Submission received: 25 March 2019
/
Revised: 12 April 2019
/
Accepted: 16 April 2019
/
Published: 19 April 2019
Abstract
:Microstructure and corrosion behavior of the Mg-3Al-xMn (x = 0, 0.12, 0.21, 0.36, 0.45) (hereafter in wt.%) alloys were experimentally investigated by electron probe microanalysis (EPMA), scanning electron microscope equipped with energy dispersive X-ray spectroscopy (SEM/EDX), X-ray diffraction (XRD), electrochemical, and hydrogen evolution tests. A new self-constructed Mg-Al-Mn-Fe thermodynamic database was used to predict the solidification paths of the alloys. The addition of Mn showed no grain refinement in the cast Mg-3Al alloys. According to the microstructure observation, Al-Fe phases were observed in the non-Mn-added alloy, while Al8Mn5(LT) (Al8Mn5 in low temperature) became the main intermetallic phase in the Mn-added alloys, and the amount increased gradually with the Mn addition. The τ–Al0.89Mn1.11 phase with lower Al/(Fe + Mn) ratio was observed in the alloys with 0.36 and 0.45 wt.% Mn content. According to the electrochemical tests, all five alloys showed localized corrosion characteristics in 3.5 wt.% NaCl solution. Compared with the Mg-3Al alloy, the corrosion resistance of Mn-added alloys were significantly improved and increased gradually with the Mn addition, which was due to the variation of Al-containing intermetallic compounds. The present experimental investigations and thermodynamic calculations confirmed the mechanism that the increasing amount of Al8Mn5(LT) with Mn addition could encapsulate the B2-Al(Mn,Fe) phase with higher Fe. Therefore, it could prevent this detrimental phase from contacting magnesium matrix, thus suppressing micro-galvanic corrosion and improving corrosion resistance gradually.
1. Introduction
Magnesium alloys attract a lot of attention due to weight-sensitive applications such as automotive, aerospace, and electronics industries [1,2,3,4,5]. Corrosion performance is one of the major concerns for applications of magnesium alloys [6,7]. Influences of alloy elements such as Ce [8,9], Nd [9,10,11,12,13], Zn [14,15], Y [11,16], Ca [11,17], and Mn [9,11,15,18,19,20,21,22,23] on the corrosion behavior of magnesium alloys have been investigated widely in literature. It is widely admitted that Mn addition could combat impure Fe in Mg-Al alloys and reduce corrosion rates of the Mg-Al alloys [11,18,19]. It is reported that the Fe/Mn ratio should not exceed a threshold value. If it goes beyond the ratio, the corrosion rates would increase significantly [24]. For AM60, the ratio is 0.021, which means this alloy could tolerate Fe impurity up to 0.021 of the Mn concentration (by weight) [25,26,27,28,29,30]. This ratio should be related to the phase constitution of the alloys. Intermetallic compounds such as Al8Mn5(LT) [31,32,33,34,35,36,37,38,39,40], τ–Al0.89Mn1.11 [31,41], Al11Mn4(LT) (Al11Mn4 in low temperature) [38], and Al4Mn [42,43] have been reported in Mg alloys. Previous studies reported the correlation between amount of elements and corrosion behavior. Using calculated phase diagrams and Scheil solidification, Liu et al. [28] reported that the detrimental effect of Fe on the Mg corrosion was caused by the precipitation of the Fe-rich Bcc_B2 phase. Recently, Metalnikov et al. [19] experimentally investigated the influence of large Mn addition (0.5, 1.4, 3.1 wt.%) on microstructure and corrosion behavior of the wrought Mg-5Al alloys. The Mg-5Al-0.5Mn alloy was reported to have the best corrosion performance among the alloys in their results, and Al8Mn5(LT) and (βMn) were identified in the Mn-added alloys. The formation of the Al-Mn(-Fe) intermetallic phases with Mn addition needs systematical investigation to gain a better understanding of the mechanisms of improving corrosion resistance in Mg-Al alloys with Mn-addition. Thermodynamic calculations based on CALPHAD (calculation of phase diagram) type thermodynamic databases have proved to be effective in precipitation and corrosion of Mg alloys [28,44]. It is undisputed that the accuracy of the thermodynamic database is primarily important for the related calculations and predictions [45,46,47,48]. Al [49] and Mn [50] both were reported to improve the mechanical properties of Mg alloys. Mn and Fe have an opposite effect on the corrosion properties [51]. Fe has extremely deleterious effects on corrosion resistance due to the ability to serve as an active cathodic site [24], while Mn addition could combat this effect by forming less active Al-Mn-(Fe) particles [51]. Therefore, the Mg-Al-Mn-Fe system is of great interest, and it is worth further investigating via the thermodynamic calculations. In the past few years, the thermodynamic descriptions of some sub-binary and ternary systems of the Mg-Al-Mn-Fe system have been updated [52,53,54,55,56,57].
Therefore, this work combines microstructure observations, thermodynamic calculations, and corrosion examinations with three aims: (i) to experimentally investigate the effect of Mn addition on the microstructure of the Mg-3Al alloys, focusing on the identification of Al-containing intermetallic compounds and evolution of morphologies and chemical compositions; (ii) to investigate the influence of Mn on corrosion behavior of the Mg-3Al alloys; and (iii) to explain some microstructure observations and corrosion behavior with thermodynamic calculations based on a new self-constructed Mg-Al-Mn-Fe thermodynamic database.
2. Materials and Methods
2.1. Materials
In total, five Mg-3Al-xMn (x = 0, 0.12, 0.21, 0.36, 0.45) alloys were prepared via the approach described below. Magnesium ingots (99.95 wt.%) were heated up to be melted at 690 °C under the protection of an argon gas mixture containing SF6 and N2 in a resistance furnace. Subsequently, a certain amount of aluminum ingots (99.97 wt.%) and Mg-5Mn master alloy were added into the Mg bath, and the temperature was maintained at 690 °C for 120 min. Then, the melts were poured into a steel mold and cooled with the furnace. The chemical compositions of the alloys were determined by ICP-AES (inductively coupled plasma-atomic emission spectroscopy, ICAP 7000 type, Thermo Fisher Scientific, Waltham, MA, USA), as shown in Table 1. It should be mentioned that traces of Mn in the Mg-3Al alloy resulted from the impurity in raw materials. The samples were sectioned from the central part of the ingots and cut into 10 mm × 10 mm × 10 mm cubic by wire-cut machine (DK7720 type, Fangzheng CNC Machine Tool Co., Ltd., Taizhou, China). In order to eliminate the disturbance of the Al12Mg17 phase, the samples were held at 400 °C for 15 h in an air furnace, followed by quenching in cold water. To remove the oxidation film, the surface of samples after heat treatment were ground off before experimental tests.
2.2. Experimental Methods
In order to identify phase type, phase constitution, and morphologies of the Al-containing intermetallic particles in the Mg-3Al-xMn alloys, XRD (D8 Advance type, Bruker Company, Stuttgart, Switzerland), EPMA (JXA-8530F type, JEOL, Tokyo, Japan) and SEM/EDX (Helios NanoLab G3 UC type, FEI Company, Hillsboro, OR, USA) were performed. To identify the type of intermetallic particles, we adopted a particles extraction method [31,40,41] described below. The different alloys were immersed in acetic acid aqueous solution (9 vol.%). After the sample was dissolved, the compound powders in the solution were centrifuged, washed with pure water thrice and with ethanol twice, and then collected after being dried at 50 °C for 5 h. Phase identification of these particles was conducted by XRD. The patterns were indexed by the software Jade (Version 6, MDI, Livermore, CA, USA). The composition of the intermetallic particles was determined by EPMA, because WDS (wavelength dispersive X-ray spectroscopy, JEOL, Tokyo, Japan) is more accurate when performing quantitative analysis compared with EDX. The samples for EPMA tests were ground with SiC papers progressively up to 2000 grit, mechanically polished by 0.5 μm diamond paste, and ultrasonically cleaned with ethanol. To reveal the grain boundaries, the samples for EPMA were electrolytic polished. The mechanical polished samples were connected with the anode of the power supply and a stainless steel bar with the cathode. After being polished under 15 V direct current for about 30 s in a mixture solution (10 mL perchloric acid and 190 mL ethanol), the samples were ultrasonically cleaned in ethanol and dried in the air. In addition, SEM/EDX was applied to obtain the high magnification morphology and the elemental distribution of the intermetallic particles. The samples for SEM/EDX were mechanically polished and then etched by nitric acid ethanol solution (4 vol.%) for 10 min to reveal the 3-dimensional (3D) morphologies of the intermetallic particles.
After the characterization of the intermetallic particles, hydrogen evolution and electrochemical tests were performed to investigate the effect of Mn addition on the corrosion behavior of the Mg-3Al alloys. All of the corrosion tests were carried out in 3.5 wt.% NaCl solution with aeration at room temperature (around 25 °C), and the mechanical polished samples were adopted with 1 cm2 exposed area. The hydrogen evolution tests were performed for 3 days by an apparatus [7]. For the electrochemical tests, the samples were sealed in epoxy and connected with copper lines. A platinum plate was used as the counter electrode, and the saturated calomel electrode was used as the reference electrode. Before the tests, the samples were held in NaCl solution for 10 min to reach a stable open circuit potential (OCP). The electrochemical impedance spectrum (EIS) tests were conducted by an electrochemical workstation (PARSTAT4000 type, Ametek Company, Berwyn, PA, USA). The EIS tests were carried out in the 100 kHz to 0.01 Hz frequency range at OCP with a 5 mV amplitude of perturbation. The EIS results were fitted using the ZsimpWin software (AMETEK, Berwyn, PA, USA). Potentiodynamic polarization tests were performed by an electrochemical workstation (CHI660E type, CH Instruments, Inc., Shanghai, China). The scan rate was about 0.5 mV/s with the range from −1.7 V to −1.3 V. Considering the abnormal anodic behavior brought from negative difference effect, the corrosion current density icorr was obtained by Tafel extrapolation using the cathodic branch [58].
2.3. Thermodynamic Calculations
A new Mg-Al-Mn-Fe database was constructed based on the critical evaluation of the thermodynamic description on the binary and ternary systems by the present authors. There are six binary systems and four ternary systems in the Mg-Al-Mn-Fe system. For the Al-Mg system, the parameters were from Zhong et al. [59], who optimized the system based on their own first principles calculations and the available experimental thermodynamic and phase diagram data. The thermodynamic parameters of the Mg-Mn system was from Gröbner et al. [60], who investigated the system based on their own experimental data and available literature data. The thermodynamic description of the Mg-Fe system recorded by COST507 [61] was adopted in the present work because it was widely accepted in literature and not updated after that. The thermodynamic description of the Al-Mn system was taken from Du et al. [62], and the refinement by Zheng et al. [52] on the cubic Al8Mn5(HT) (Al8Mn5 in high temperature) phase was considered. As for the Al-Fe system, the most widely accepted evaluation is from Sundman et al. [63]. However, the description of the liquid phase was inconsistent with the experimental data on the experimental integral enthalpy of the mixing of liquid Al-Fe alloys. Therefore, the re-optimized parameters of liquid and the slightly revised parameters for the solids by Zheng et al [52] were adopted in the present work. Parameters of the Fe-Mn system from Huang et al. [64] with a minor adjustment by Djurovic et al. [65] were used in the present work. Since the work by Du et al. [62] could reproduce the experimental data in both Al-rich and Mg-rich corners well, and the liquidus projection and reaction scheme over wide temperature and composition ranges were also well established, the description for the Al-Mg-Mn system was taken the work from Du et al. [62]. The parameters of the Mg-Al-Fe ternary system were taken from the doctoral dissertation of Liu [66]. The Al-Fe-Mn ternary system was recently optimized by Zheng et al. [53]. In their work, Fe was firstly introduced into the sublattice model of Al8Mn5(LT) by considering the available experimental data [54], and they also considered the order-disorder transformation between Bcc_A2 and Bcc_B2 phases, thus their work was adopted for the description of the Al-Fe-Mn system. According to the work by Wang et al. [67], a direct extrapolation from the three binary systems can reproduce the experimental data in the Fe-Mg-Mn system well. Therefore, there is no ternary parameters for the Fe-Mg-Mn system. By considering the references above, we constructed a thermodynamic database for the Mg-Al-Mn-Fe quaternary system.
Using the obtained Mg-Al-Mn-Fe thermodynamic database, calculated phase diagrams for six binary systems and a representative isothermal section of four ternary systems are presented in Figure 1, Figure 2 and Figure 3. These diagrams show an agreement with those in literature, which support the validation of the database. Based on the database, the solidification paths of the Mg-3Al-xMn alloys were then presently performed by PANDATTM software (Version 2017, CompuTherm, Madison, WI, USA) using the Scheil solidification model.
3. Results and Discussion
3.1. Microstructure Observation
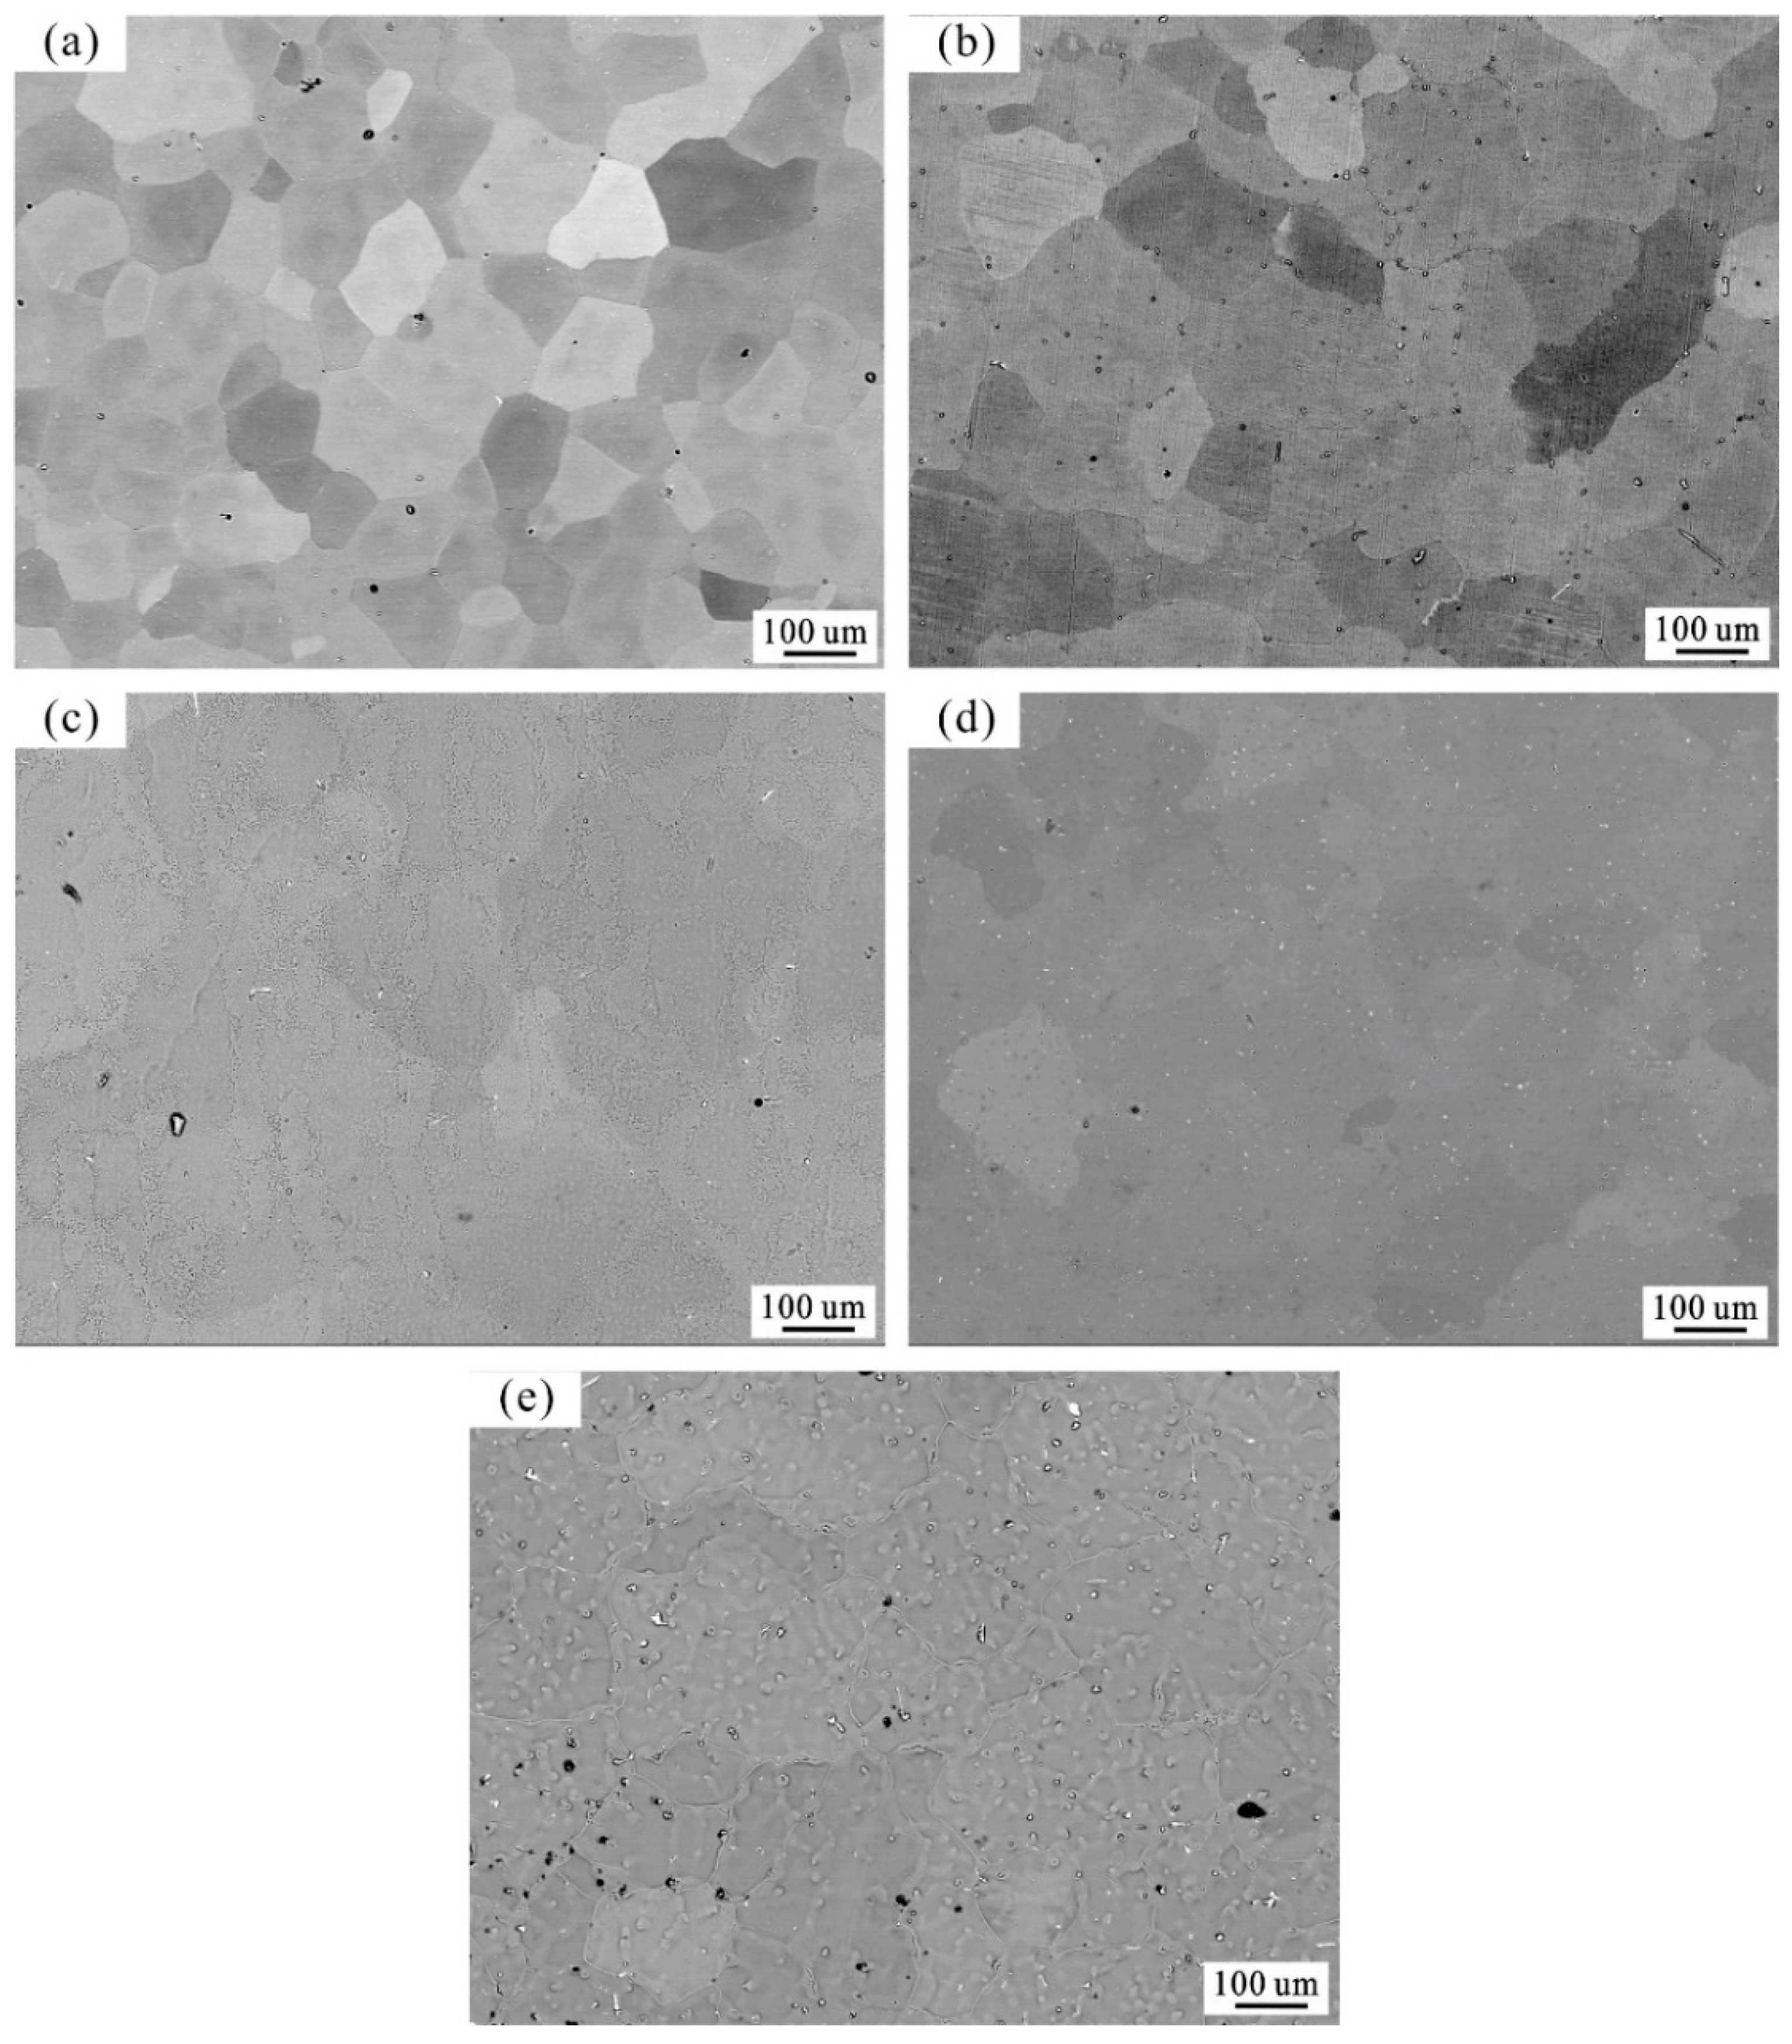
Back scattered electron (BSE) images of five electrolytic polished Mg-3Al-xMn alloys taken by EPMA are shown in Figure 4. The Mg-3Al alloy consists of (αMg) matrix and a minute quantity of white particles. In four Mn-added alloys, more white particles were observed at both (αMg) matrix and grain boundaries. The amount of these white particles increased gradually with the increase of Mn addition. The average grain size of the Mg-3Al-xMn alloys (x = 0, 0.12, 0.21, 0.36, 0.45) was measured by ImageJ software as 102 ± 35, 129 ± 48, 256 ± 75, 152 ± 37, and 205 ± 69 μm. Compared with the Mg-3Al alloy, the grain size of Mn-added alloys increased, indicating that the Mn addition had no grain refinement effect in the cast Mg-3Al alloys.
Quite a few studies have been applied to investigate the effect of Mn addition on the grain size of Mg-Al alloys. The grain refinement effect is related to the type of Al-Mn intermetallics in the alloys. Cao et al. [68] reported ε-AlMn could act as the nucleation site for (αMg) grains due to small lattice mismatch (~4% misfit) against (αMg), and Al8Mn5(LT) showed no grain refinement in their study due to the bigger lattice mismatch (~20% misfit). In addition, the grain refinement effect of Mn addition was observed in extruded or wrought Mg-Al alloys [18,19,50] and not observed in cast alloys [11,41,69]. This difference may relate to the thermal forming process. As is discussed later, the main Al-Mn intermetallic in present Mn-added alloys is Al8Mn5(LT), which cannot refine the grain. That is the reason why grain refinement effect was not observed in the present cast alloys.
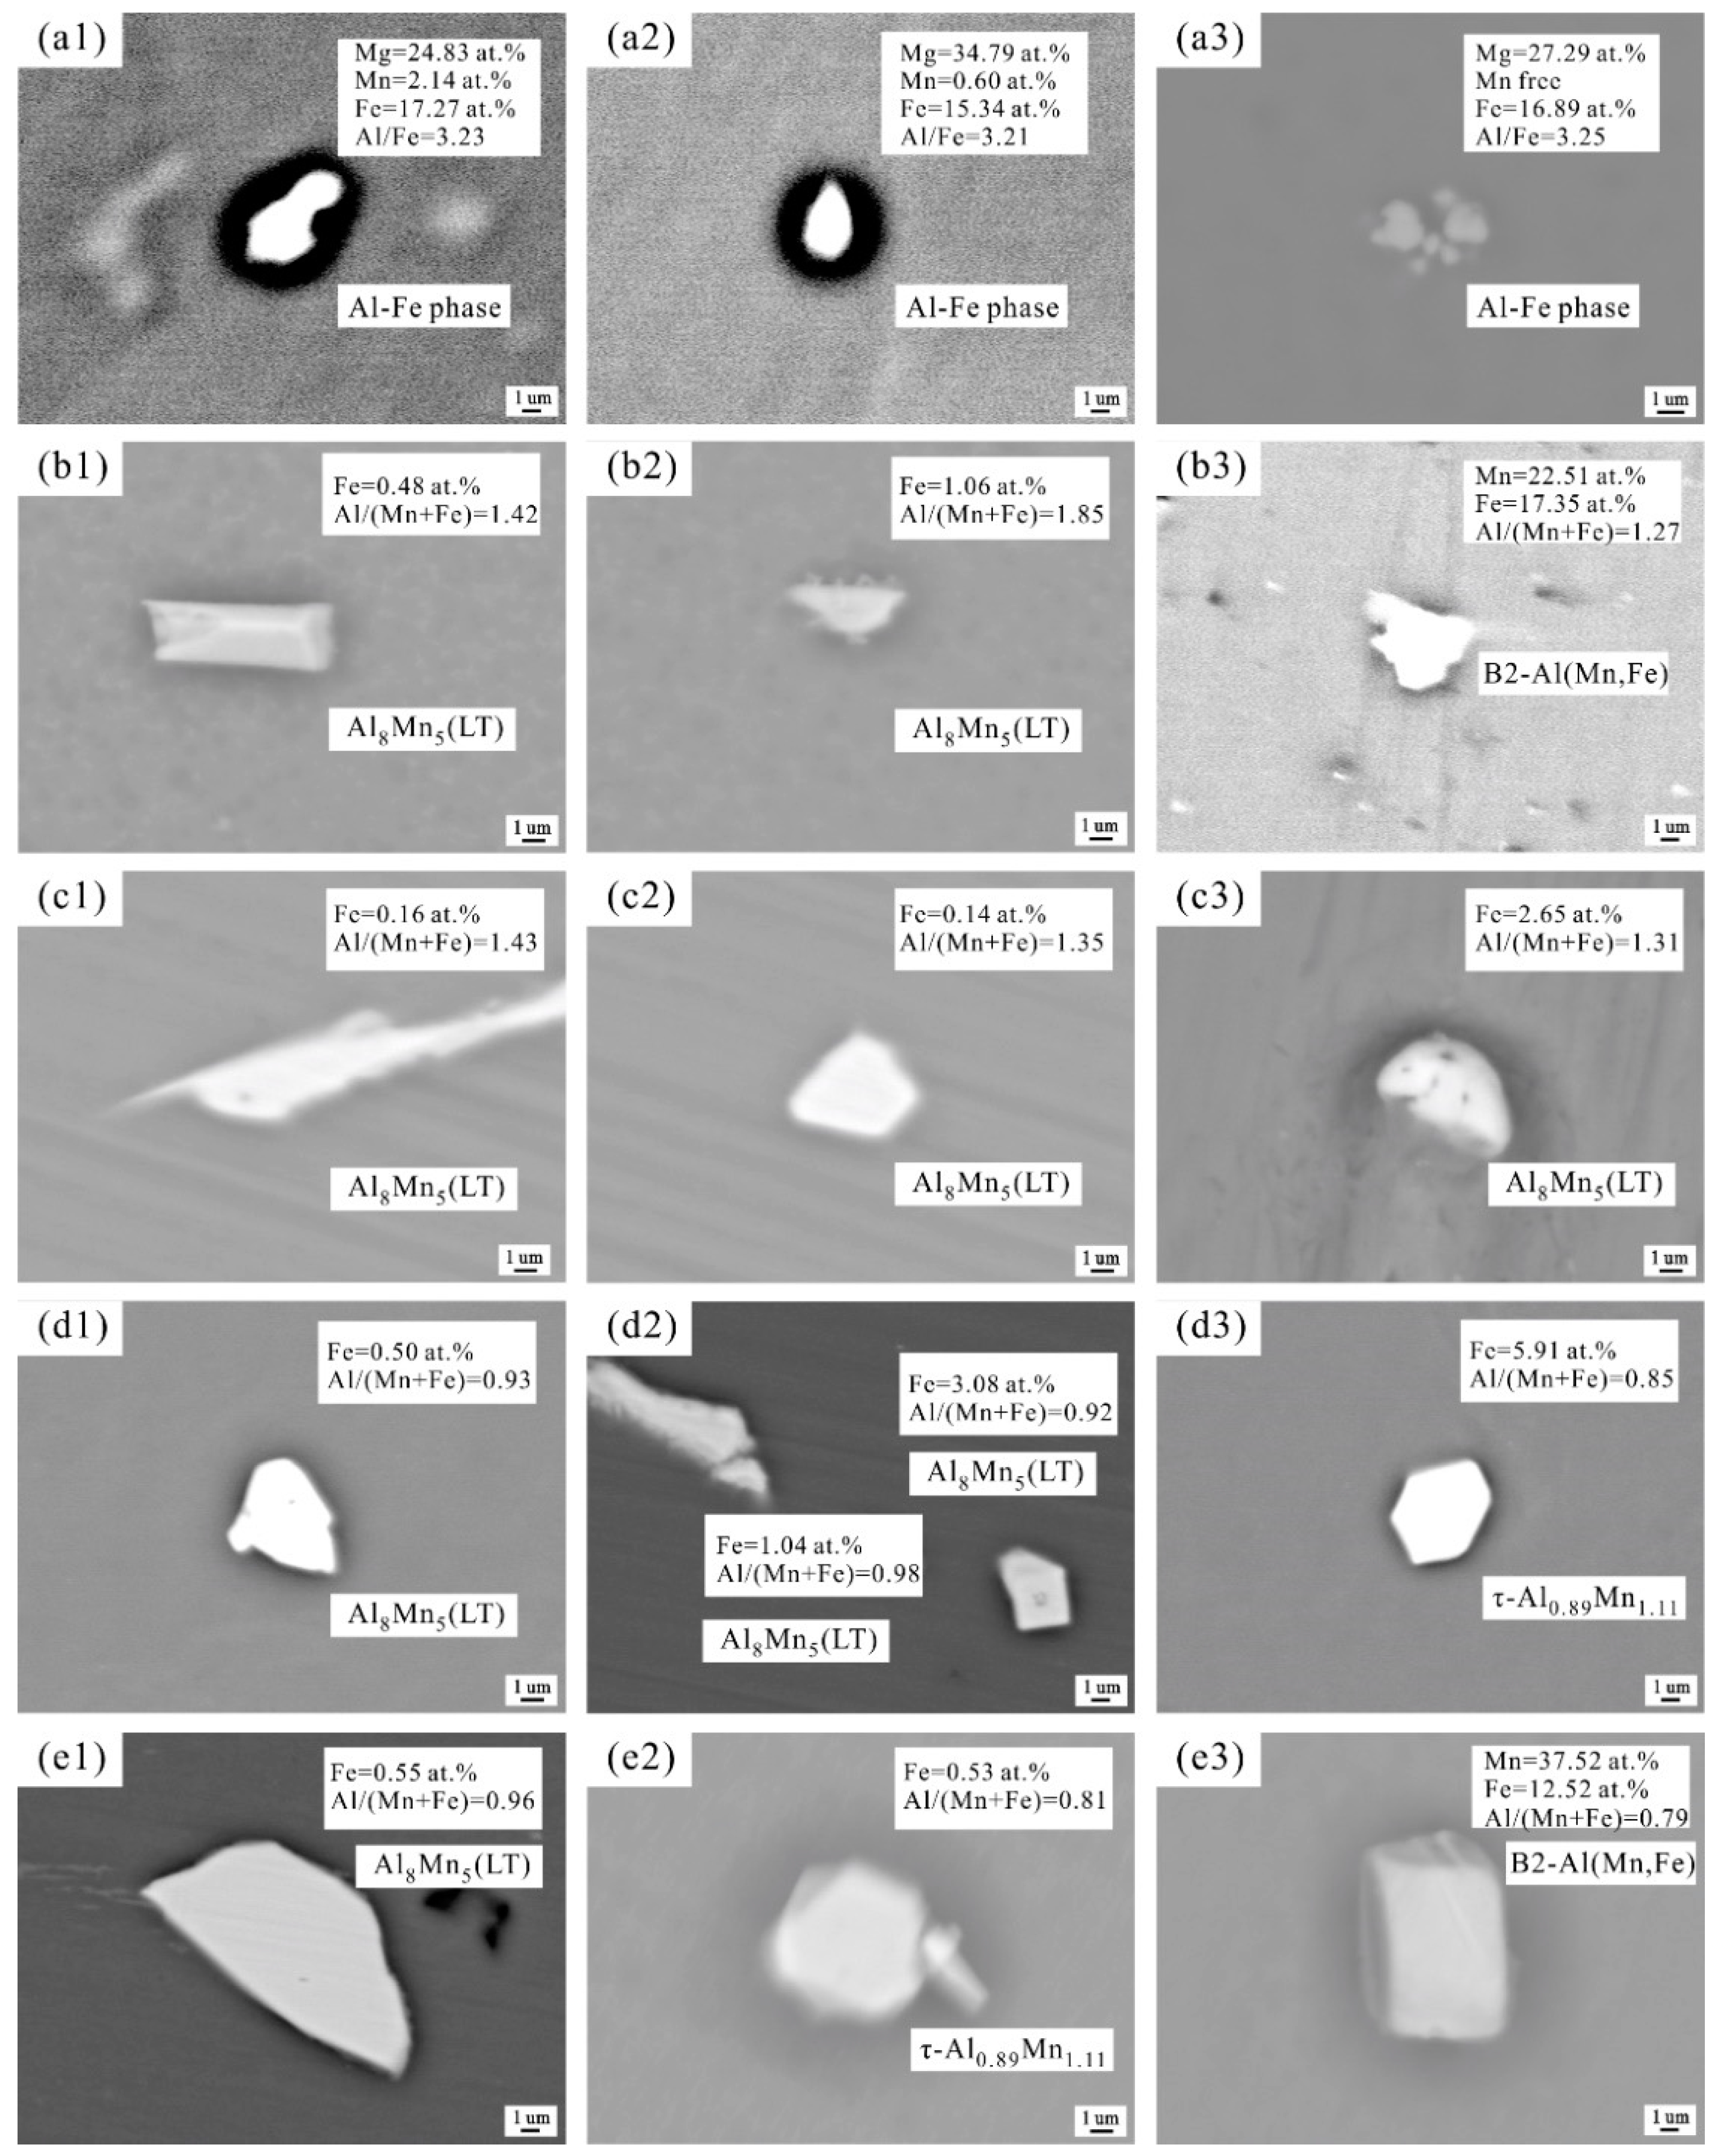
To analyze the effect of Mn addition on the microstructure, it was crucial to identify the type and investigate the composition and morphologies of particles in the alloys. Figure 5 was determined by EPMA. The samples in this figure were mechanically polished. Figure 6; Figure 7 were obtained by SEM/EDX, and the samples were subjected to mechanical polishing, then deep-etched by nitric acid ethanol solution.
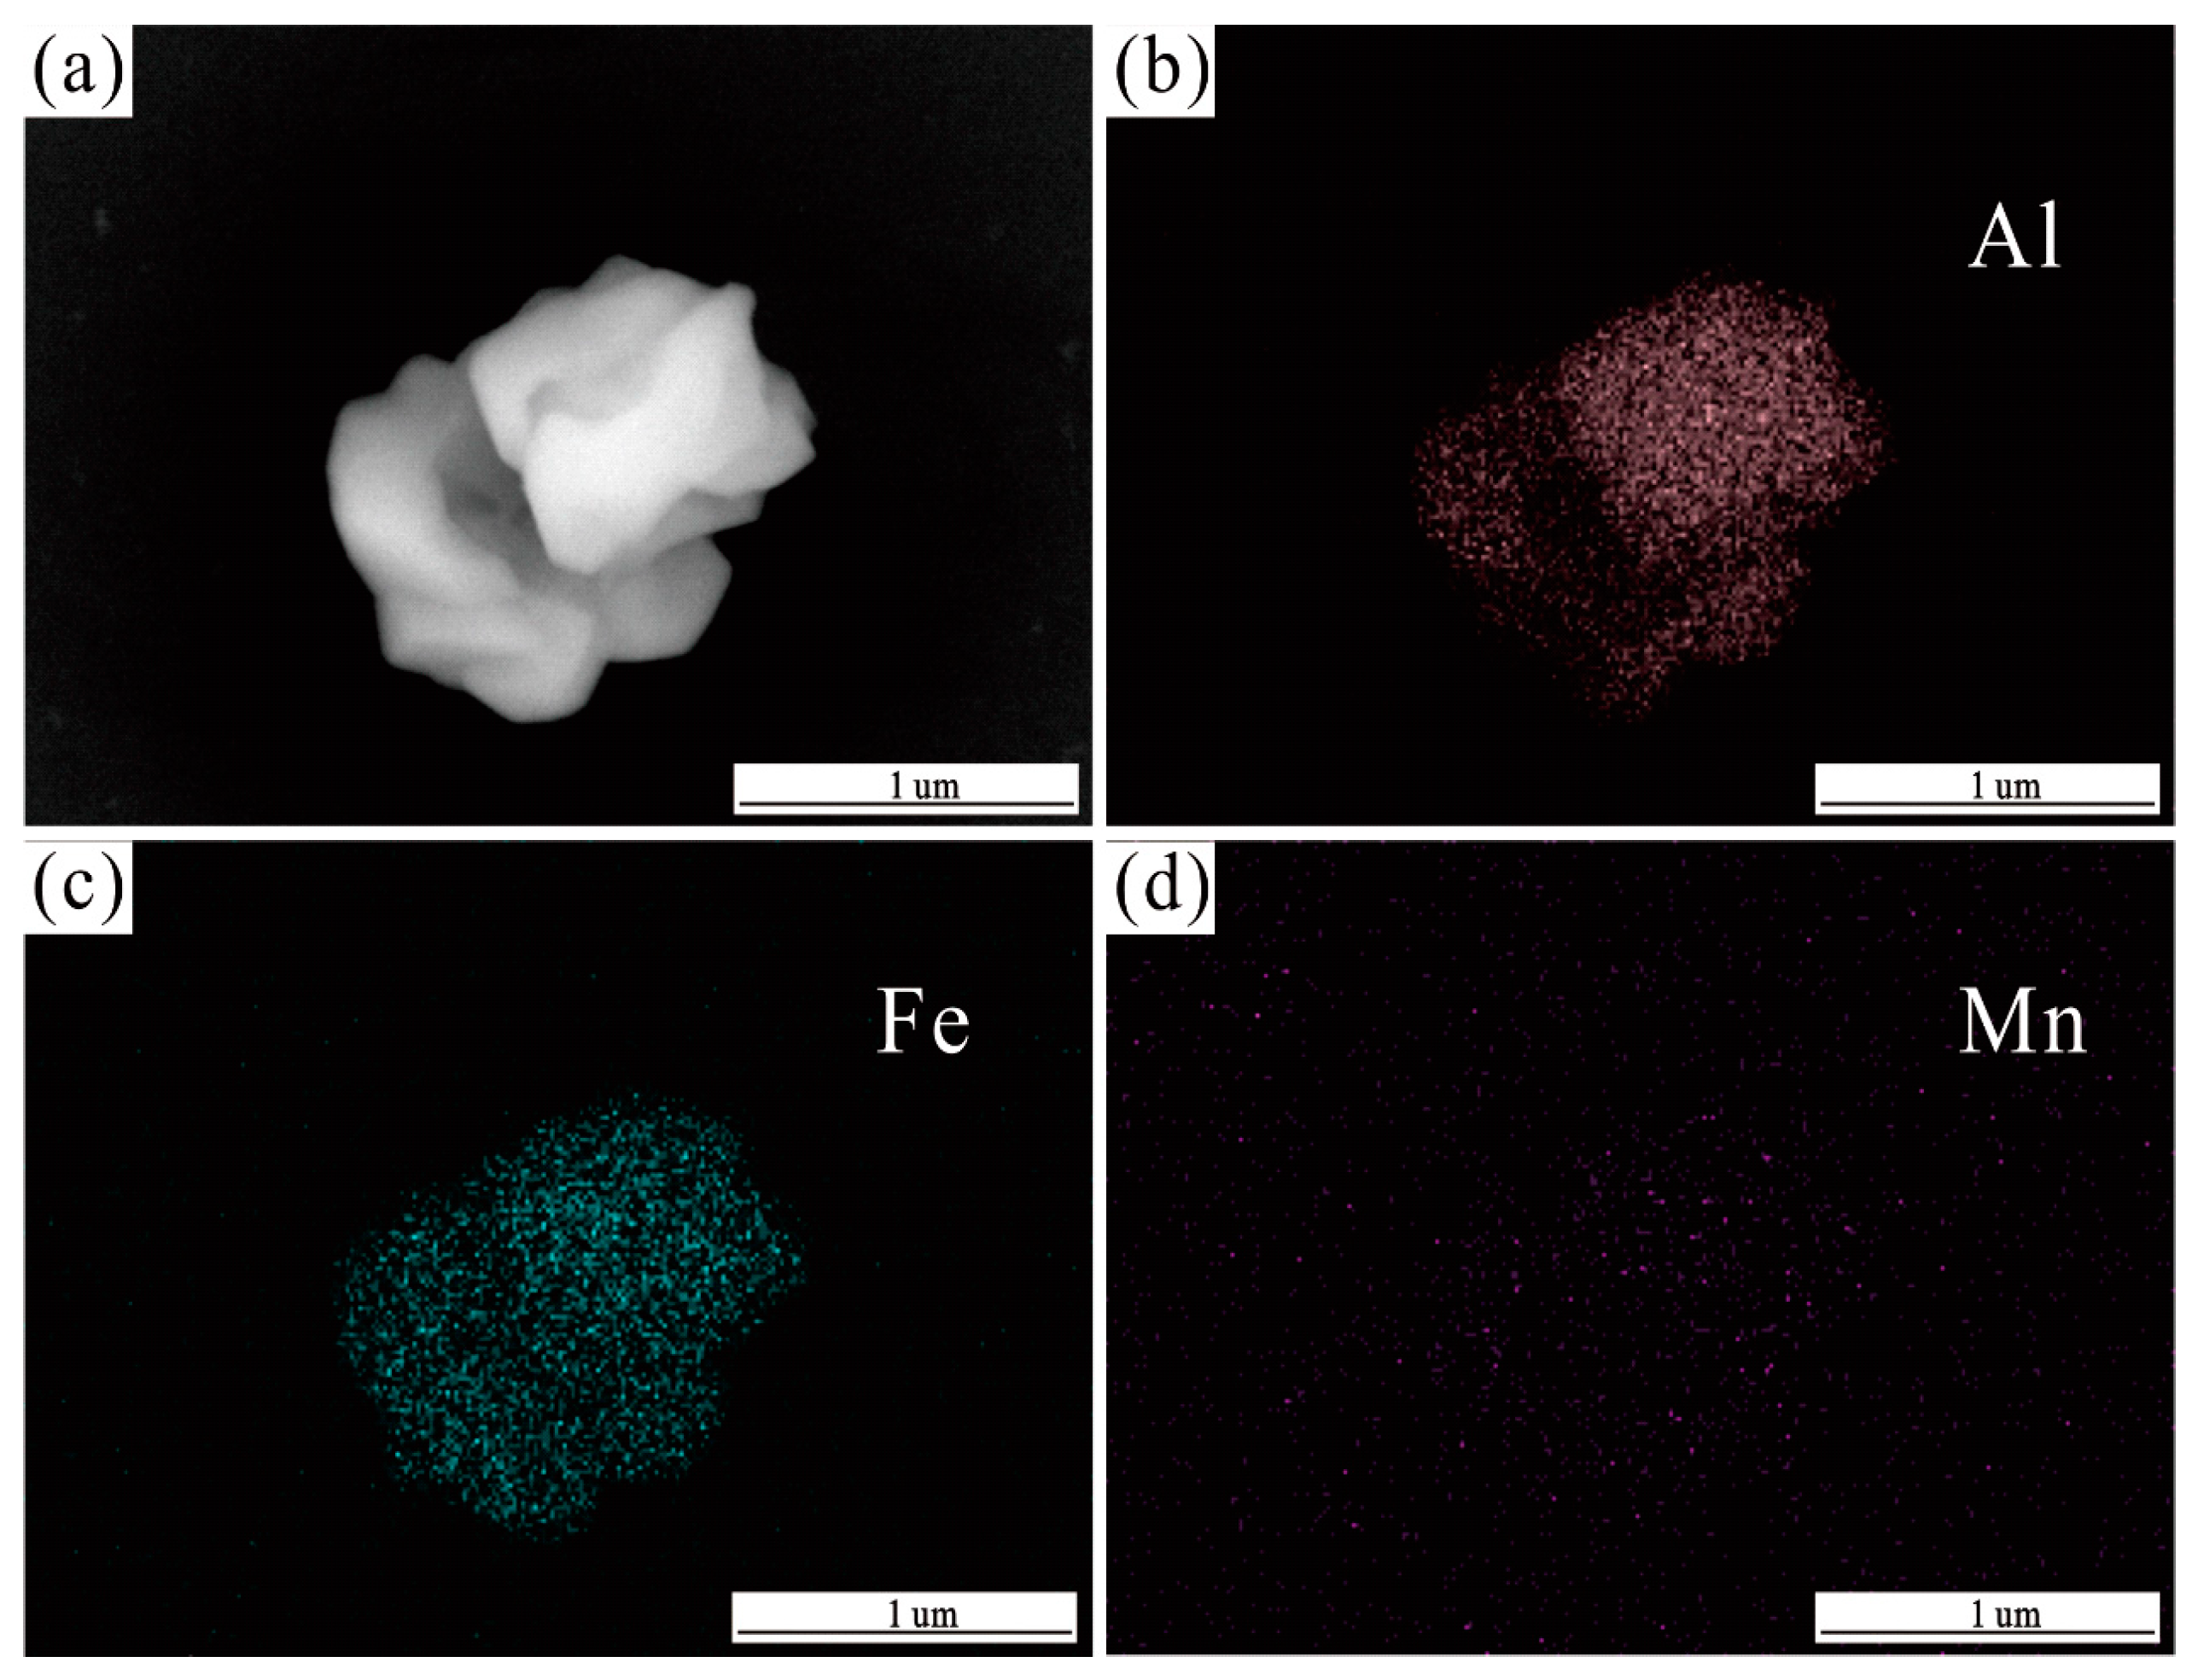
In the Mg-3Al alloy, irregular angular particles were observed in EPMA and SEM/EDX, which are shown in Figure 5a, Figure 6a, and Figure 7, respectively. Due to the limited amount, they were not successfully extracted and identified by XRD. For the phase composition of these particles, both EPMA and EDX maps indicated they were Mn negligible or Mn free, meaning they were Al-Fe phases. It should be mentioned that EPMA analysis could pick up Mg signals from surrounding (αMg) due to the small size of the particles, which was the reason why some Mg was detected. As shown in Figure 5a, the Al/Fe ratio of the particles determined by EPMA was about 3.25, which was close to the composition of Al13Fe4. According to the Mg-Fe phase diagram and isothermal section of Mg-Al-Fe shown in Figure 1c and Figure 3b, respectively, we can see that the solid solubility of Fe in Mg was very limited, indicating that the Fe atoms would precipitate as Al-Fe phases [22,70,71].
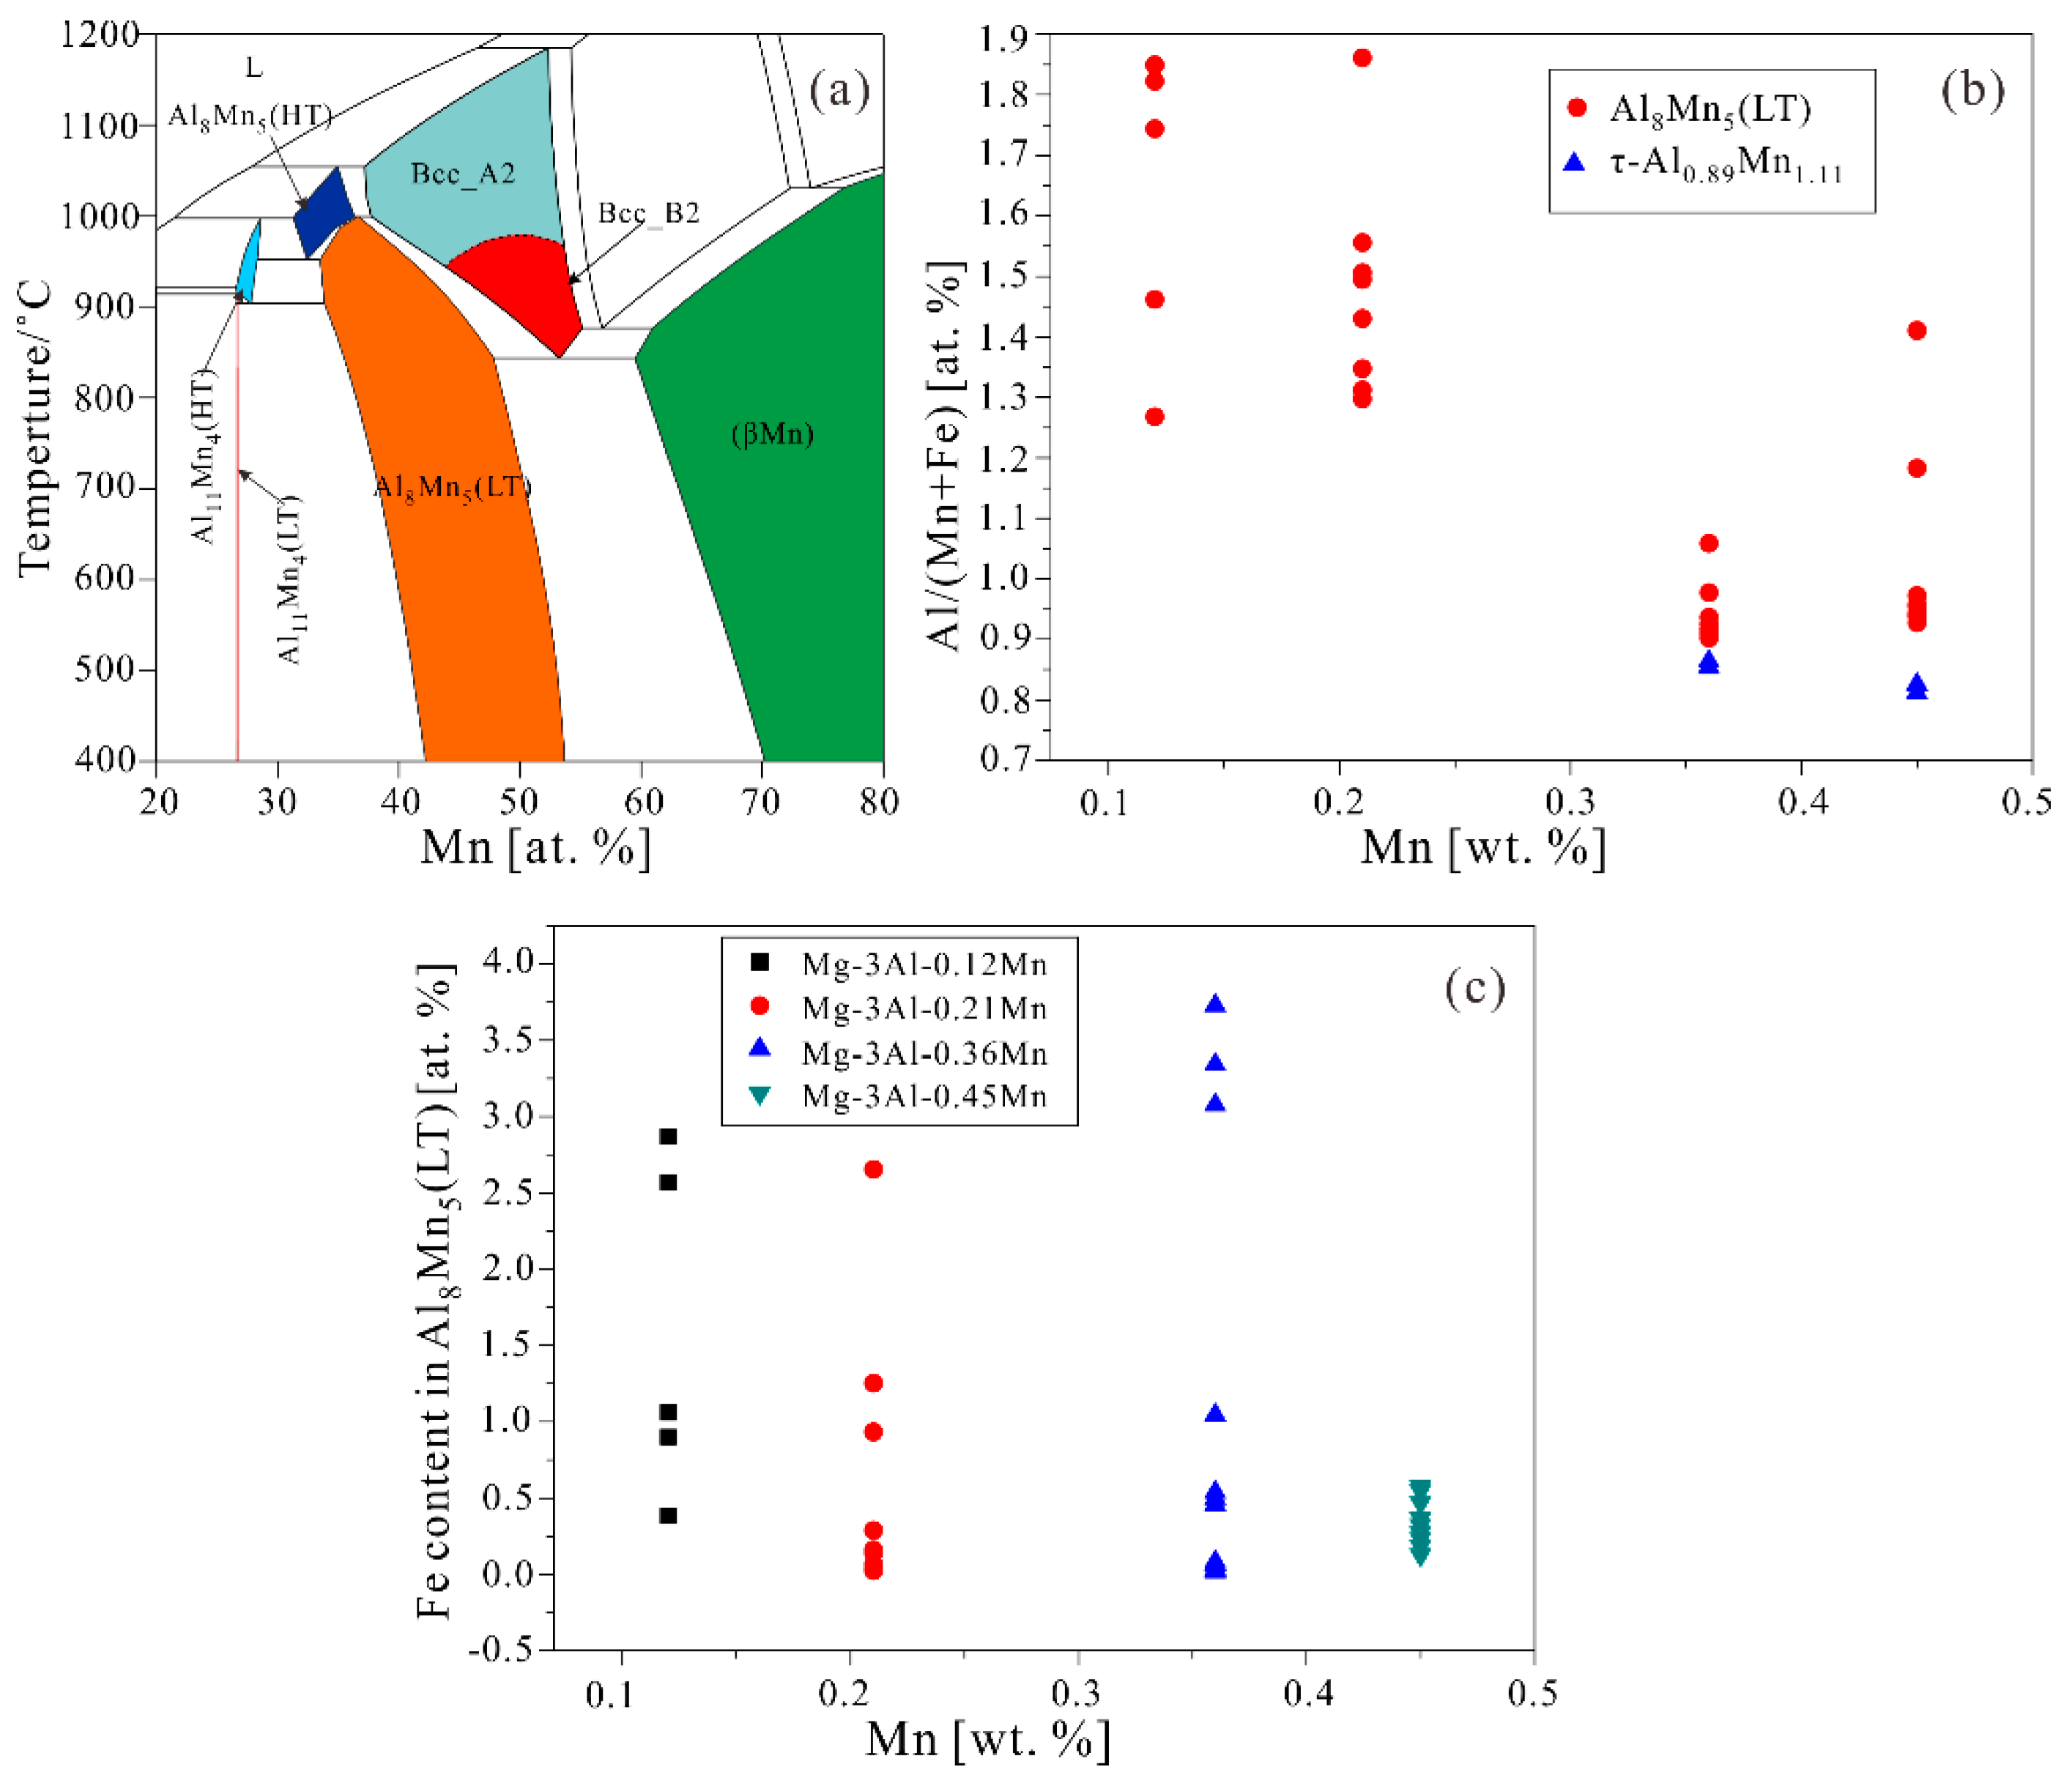
After adding 0.12 wt.% Mn into the Mg-3Al alloy, the intermetallics changed from Al-Fe phases to Al8Mn5(LT). XRD patterns of the particles extracted from the Mn-added alloys are shown in Figure 8. As we can see, Al8Mn5(LT) (space group R3m (160) ICDD PDF file 00-032-0021) and MgF2 (space group P42/mnm (136) ICDD PDF 00-041-1443) were identified in the Mg-3Al-0.12Mn and Mg-3Al-0.21Mn alloys. The MgF2 was likely formed from the reaction of the Mg melt with the protection of SF6 gas during the sample fabrication [32,72,73]. To investigate the composition of Al-Mn(-Fe) particles, their Al/(Mn + Fe) ratios were measured by EPMA and are summarized in Figure 9b. For the Mg-3Al-0.12Mn and Mg-3Al-0.21Mn alloys, the Al/(Mn + Fe) ratios of these particles were measured to be from 1.2 to 1.9. The Al/Mn ratio of Al8Mn5(LT) was at the range of 0.9–1.6 based on the partial Al-Mn phase diagram shown in Figure 9a. Moreover, the measured Al/(Mn + Fe) of Al8Mn5(LT) was reported up to 1.97 [74] or 1.95 [31] in literature. In view of these results, these particles were identified as Al8Mn5(LT) in the present work, which was consistent with the XRD results.
As we can see from Figure 8, τ–Al0.89Mn1.11 was observed with further addition of Mn to 0.36 wt.%. Al8Mn5(LT), and τ–Al0.89Mn1.11 (space group tP2 (123) ICDD file 00-030-0028) was identified in the Mg-3Al-0.36Mn and Mg-3Al-0.45Mn alloys. The crystal structures of the crucial phases are summarized in Table 2. It should be noted that no peaks of MgF2 were detected in the Mg-3Al-0.36Mn and Mg-3Al-0.45Mn alloys. τ–Al0.89Mn1.11 is a metastable phase and is not shown in the Al-Mn stable phase diagram (Figure 9a). Han and Liu [31] identified τ–Al0.89Mn1.11 via TEM and XRD, and the Al/(Mn+Fe) ratio was reported to be around 0.85, which was different from the range of both Al8Mn5(LT) and (βMn). In the present work, the measured Al/(Mn + Fe) ratio of some particles in the Mg-3Al-0.36Mn and Mg-3Al-0.45Mn alloys was about 0.85, as shown in Figure 9b. Thus, these particles were regarded as τ–Al0.89Mn1.11, as shown in Figure 5(d3,e2). Additionally, a lower Al/(Mn + Fe) ratio of Al8Mn5(LT) in the Mg-3Al-0.36Mn and Mg-3Al-0.45Mn alloys compared to that in the Mg-3Al-0.12Mn and Mg-3Al-0.21Mn alloys was obtained, which could be dated back to the solidification process. During the solidification, the Al concentration at the liquid/solid interface of the alloys with lower Mn content was relatively lower than that with higher Mn content, leading to the formation of Al8Mn5(LT) and τ–Al0.89Mn1.11 with a lower Al/(Mn + Fe) ratio [31]. Interestingly, some Al-Mn(-Fe) particles with relatively higher Fe content were obtained in the Mg-3Al-0.12Mn and Mg-3Al-0.45Mn alloys, as presented in Figure 5(b3,e3), respectively. Compared with the composition of B2-Al(Mn,Fe) in literature [74], these Fe-richer Al-Mn(-Fe) particles were likely to be B2-Al(Mn,Fe).
As for the morphologies, the particles in Figure 6b,c were indexed as Al8Mn5(LT), as it was the only Al-Mn(-Fe) intermetallic detected by XRD in Mg-3Al-0.12Mn and Mg-3Al-0.21Mn alloys. However, the particles in Figure 6d,e were difficult to distinguish from Al8Mn5(LT) and τ–Al0.89Mn1.11, because both phases were detected by XRD in Mg-3Al-0.36Mn and Mg-3Al-0.45Mn alloys.
Based on the above discussion, the morphologies and the Fe content of the particles in the Mg-3Al-xMn alloys are summarized in Table 3. The Al8Mn5(LT) particles showed different morphologies in Mn-added alloys, including micro-plates (Figure 5(b2,c3,d1,e1)), rods/ribbons (Figure 5(b1,c1) and Figure 6(b1,c1), dice-like shape (Figure 6(c3)), and polyhedral shape (Figure 5(c2,d2), Figure 6(b2,b3,c2)). τ–Al0.89Mn1.11 with micro-plates (Figure 5(e2)) along with polyhedral shape (Figure 5(d3)) and B2-Al(Mn,Fe) with micro-plates (Figure 5(b3)) and polyhedral shape (Figure 5(e3)) were observed. Al-Fe phases were in irregular blocky shape (Figure 5a, Figure 6a, and Figure 7a). As shown in Figure 9c, the Fe content in Al8Mn5(LT) was measured to be at the range of 0.2–4 at.%, which was similar to the reported value in literature [31,34]. The Fe content at the range of 0.5–5.9 at.% was measured for τ–Al0.89Mn1.11, which was higher than the reported one by Han et al. [41]. In addition, it should be noted that the Fe content in B2-Al(Mn,Fe) and Al-Fe phases was significantly higher than that in Al8Mn5(LT) and τ–Al0.89Mn1.11.
The morphologies and the composition of the Al-containing intermetallic particles in the Mg-3Al-xMn alloys were discussed above. However, due to the limited amount, the percentages of these intermetallic phases could not be determined experimentally, and the sequences of solidification of these phases were still not clear. Such problems could be explained by the thermodynamic calculations.
3.2. Thermodynamic Calculation
As discussed before, the tolerance limit of Fe impurity is very important in Mg alloys. The Fe/Mn ratio of all alloys in the present work exceeded the tolerance limit of that in AM60 (0.021). Thus, it was worthwhile to trace the Fe impurity in the alloys. The calculations were performed based on the real composition of the Mg-3Al-xMn alloys. With the established database, Figure 10 shows the calculated solidification paths of the Mg-3Al-xMn alloys using PANDATTM software based on Scheil solidification. For the Mg-3Al alloy, B2-Al(Mn,Fe), (αMg), Al2Fe, Al5Fe2 Al13Fe4, and Al12Mg17 phases were predicted to form in order. The Fe impurity was calculated to exist in the form of B2-Al(Mn,Fe), Al2Fe, Al5Fe2, and Al13Fe4 phases at different stages of solidification. This calculation was in good agreement with the results from EPMA and SEM/EDX, which can be seen from Figure 5a, Figure 6a and Figure 7.
In Mn-added alloys, the sequences of solidification paths of the phases were generally similar to each other. The phases of B2-Al(Mn,Fe), (αMg), Al8Mn5(LT), and Al11Mn4(LT) were precipitated in sequence, which was significantly different from that of the Mg-3Al alloy. Moreover, in Mn-added alloys, impure Fe dissolved into B2-Al(Mn,Fe) and Al8Mn5(LT) phases by substituting the Mn lattice sites [55,56,74]. This was due to their affinity and similarity in terms of atomic radii [41,83]. From the thermodynamic point of view, B2-Al(Mn,Fe) could be stable in all five alloys because it was the first precipitated phase in all five alloys and could be encapsulated by the subsequent precipitated phases, such as Al8Mn5(LT). However, B2-Al(Mn,Fe) was only experimentally detected in the Mg-3Al-0.12Mn and Mg-3Al-0.45Mn alloys due to the limited amount. The deduction was supported by the experiments by Zeng et al. [74] and present thermodynamic calculations. Two phase particles with a core-shell structure in AZ91D magnesium alloy with the Fe-richer B2-Al(Mn,Fe) core enveloped by low-Fe Al8Mn5(LT) shell were observed by means of a focused ion beam (FIB) from Zeng et al. [74]. Considering the predicted solidification sequences and the similar morphology of Al8Mn5(LT) from the present work and Zeng et al. [74], a similar enveloping phenomenon likely existed in this study.
The total mole percentages of B2-Al(Mn,Fe) and Al8Mn5(LT) of these five alloys after solidification were calculated and are displayed in Figure 11a. It can be seen that Al8Mn5(LT) was not precipitated in the Mg-3Al alloy, while the mole percentage of B2-Al(Mn,Fe) held steady with 0–0.36 wt.% Mn addition but increased when the content of Mn addition was 0.45 wt.%. The reason for this was that the Fe impurity in the Mg-3Al-0.45Mn alloy was higher than that of other alloys, as shown in Table 1. For Al8Mn5(LT), the percentage increased steadily with the increasing of Mn addition, which was consistent with the statistic number of particles per mm2 (Figure 11b) based on the low magnification EPMA images. Furthermore, the mole percentage of B2-Al(Mn,Fe) was far less than that of Al8Mn5(LT). This was one of the reasons why B2-Al(Mn,Fe) was not detected by EPMA in the Mg-3Al, Mg-3Al-0.21Mn, and Mg-3Al-0.36Mn alloys. More importantly, although the amount of Fe-richer B2-Al(Mn,Fe) seemed negligible due to the detrimental effect, it played an important role in the corrosion of Mg-Al-based alloys [28].
3.3. Electrochemical Tests and Corrosion Analysis
Potentiodynamic polarization curves are shown in Figure 12, which were tested in 3.5 wt.% NaCl solution at room temperature. The cathodic branches of the polarization curves of Mn-added alloys were lower than those of the Mg-3Al alloy, which indicated that there was a reduction of the cathodic hydrogen reaction. Obvious passivation behavior was observed in the anodic polarization curves of the Mg-3Al-0.36Mn and Mg-3Al-0.45Mn alloys, however, curves of others alloys showed active dissolution characteristics. The breakdown potential Eb (marked by the black arrow) of passive film was also obtained [58,84]. Critical parameters from potentiodynamic polarization curves are summarized in Table 4. With the increase of Mn addition, the current density icorr decreased gradually, and the value of the Mg-Al alloy was 26 times larger than that of the Mg-3Al-0.45Mn alloy. The larger value of (Eb-Ecorr) illustrated more stable passivation film. The value of Mg-3Al-0.45Mn was 94 mV, which was markedly larger than that of Mg-3Al-0.36Mn, indicating that the passive film was more stable, and there was less tendency for localized corrosion to appear [84]. In summary, the corrosion resistance was enhanced with the increase of Mn addition, and the Mg-3Al-0.45Mn alloy showed the best corrosion resistance among the five alloys.
The EIS results presented in Figure 13 show all alloys consisted of two capacitance loops and one inductive loop, indicating that the corrosion mechanisms and processes were similar among these alloys. The first capacitance loop at high frequency represented the double electric layer at the metal/solution interfaces, while the second one at medium frequency was the capacity of the corrosion products. The inductive loop at low frequency confirmed pitting corrosion behavior [85,86]. The aperture of impedance increased with the enhancement of Mn content, which indicated that the corrosion resistance was improved [18]. The EIS spectrums were fitted by an equivalent circuit [18,85], as shown in Figure 13b and Table 5. Rs was the solution resistance, and Rc and Cc represented the resistance and the capacitance of the corrosion product layer, respectively. CPE was the constant phase element for double layer capacitance, and its impedance was defined as , where C was capacitance, j was the current, and ω was the frequency [18]. Rdiff and L denoted the inductive resistance and the inductance of the partial protective film. Rct was the charge transfer resistance describing the resistance of interface between corrosion product layer and alloy, which was the last barrier for preventing aggressive Cl− in the solution from reaching the metal surface [85,87]. A larger Rct meant a better corrosion resistance. The values of Rct became larger with the increasing of Mn addition, meaning the Mg matrix corrosion could be prevented by the Mn addition in the alloys. This was also supported by the polarization curves discussed above.
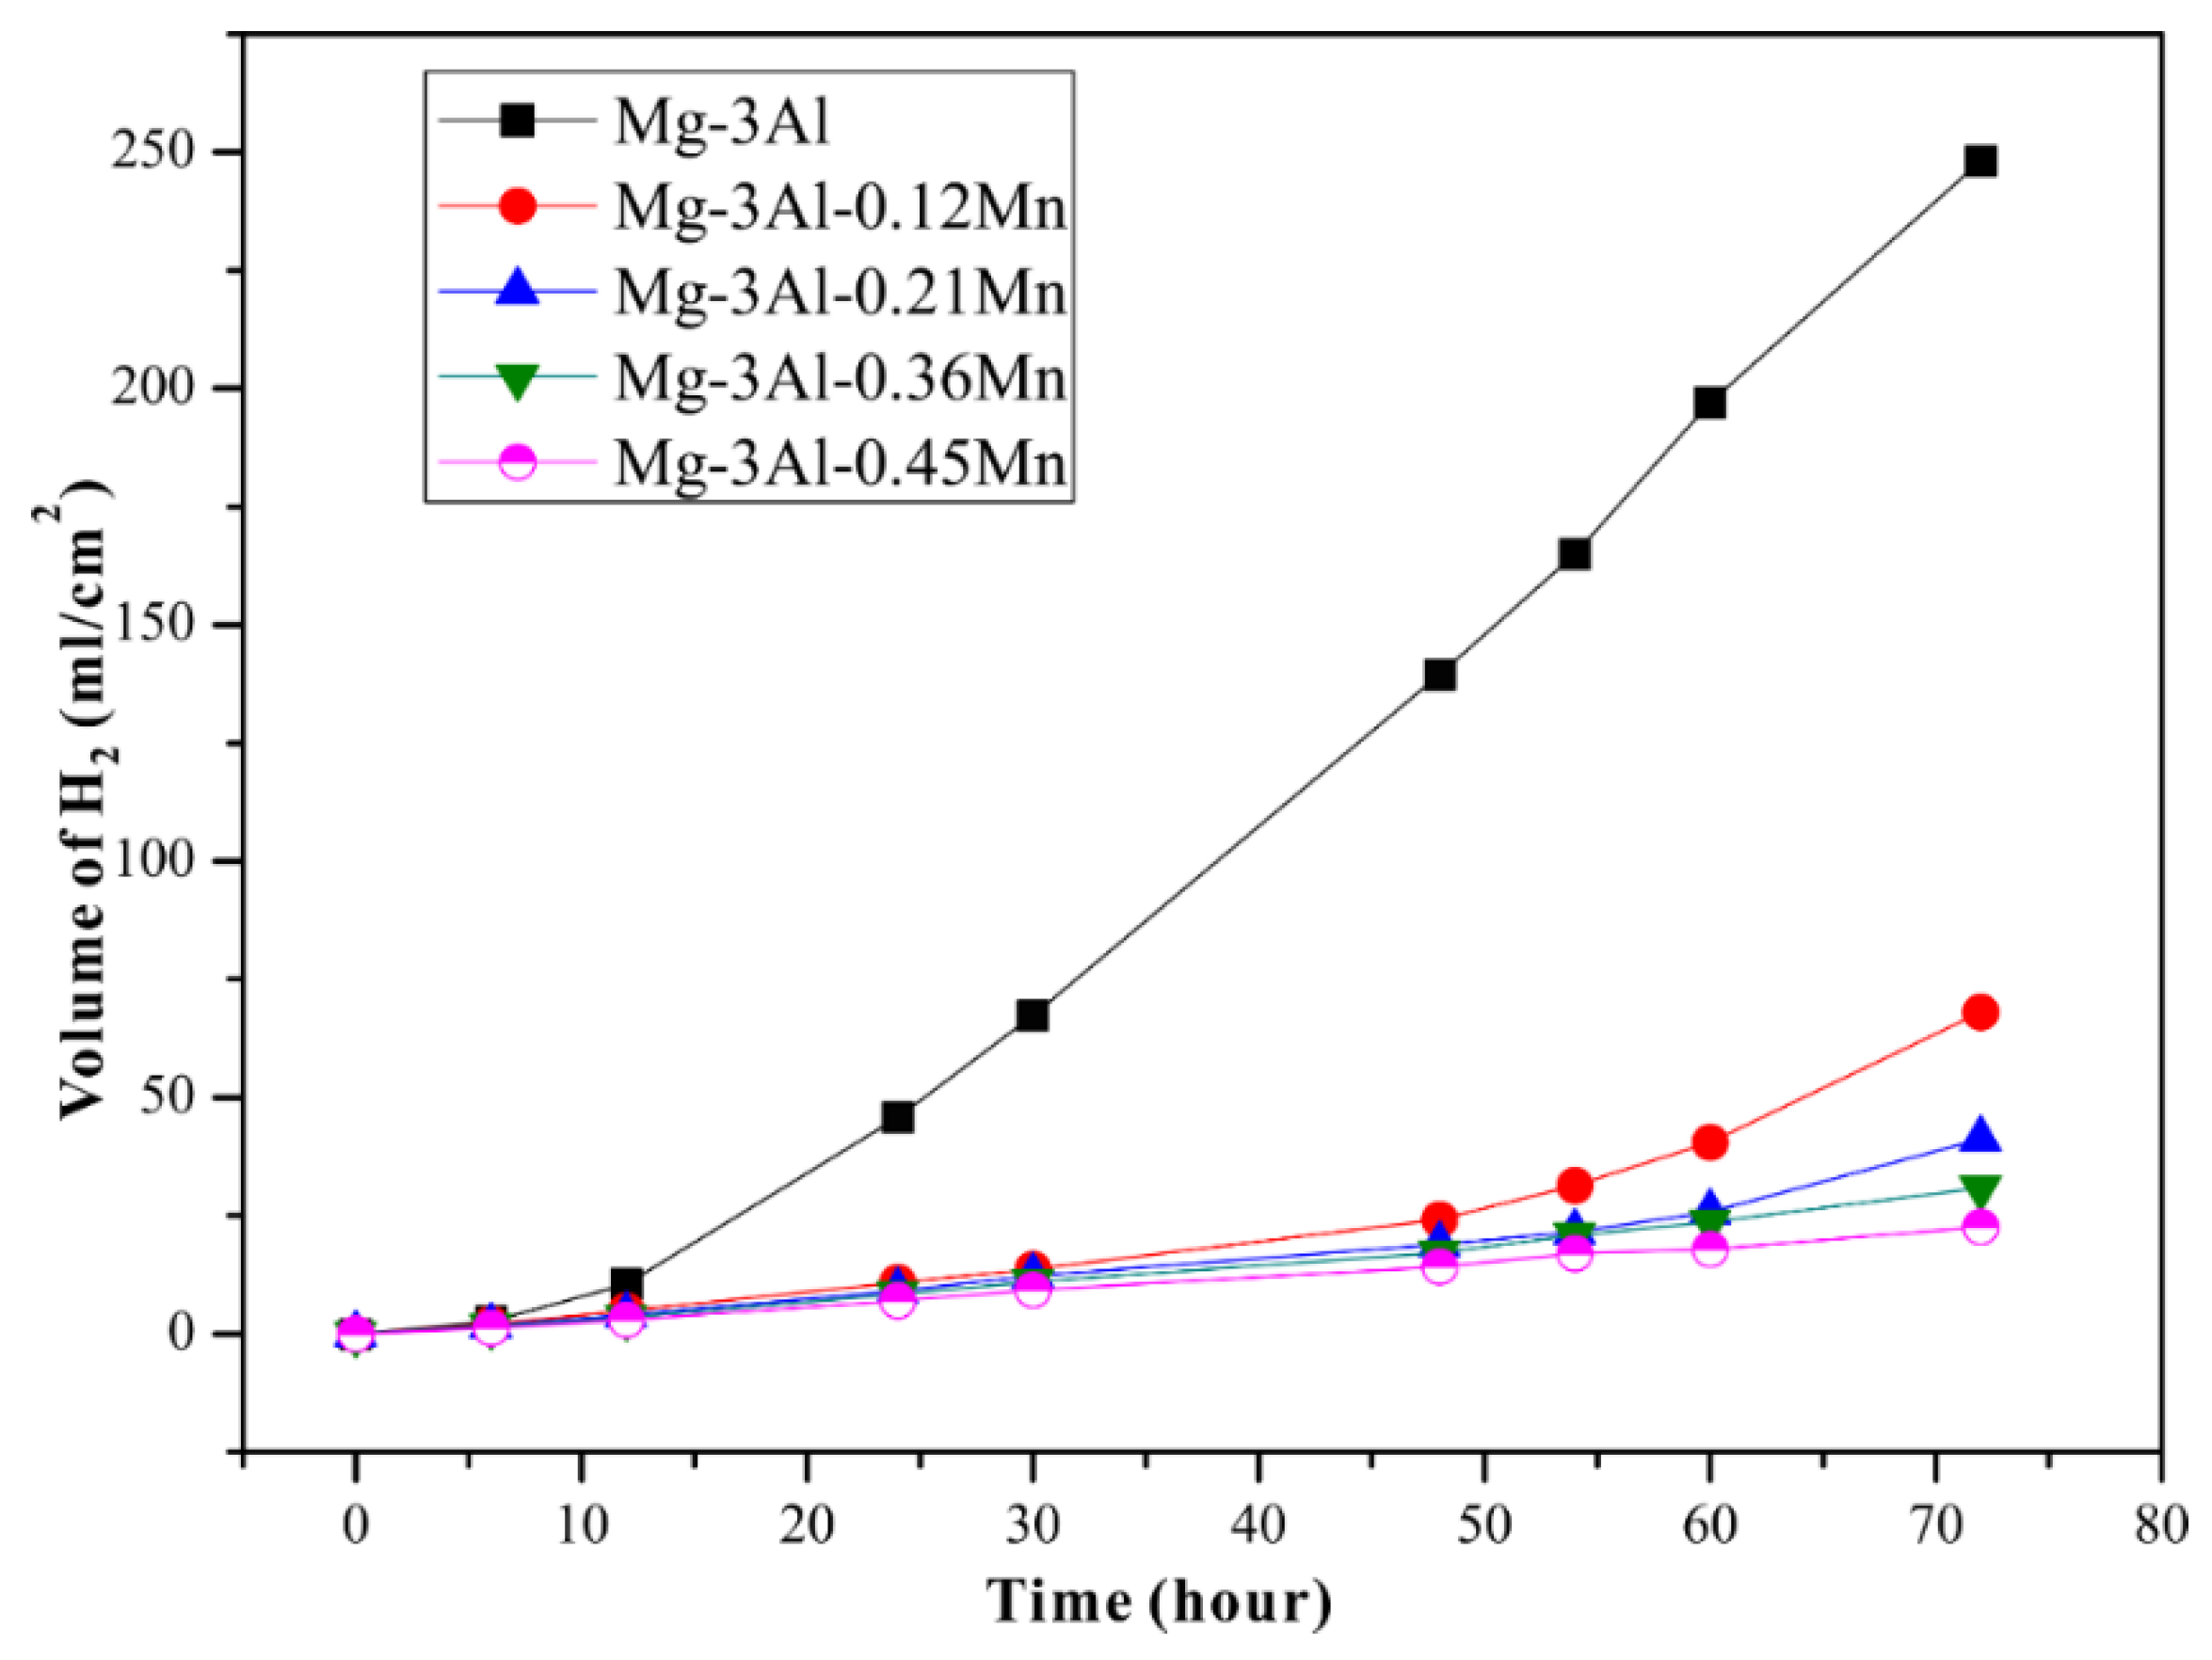
Figure 14 shows the effect of Mn on hydrogen evolution volume of the Mg-3Al-xMn alloys in 3.5 wt.% NaCl solution. In three days immersion, the hydrogen volume of the Mg-3Al alloy was about three to eleven times that of the Mn-added alloys, demonstrating that Mn addition improved corrosion resistance by decreasing the cathodic hydrogen reaction. The hydrogen volume of the alloys decreased gradually with the increase of Mn, which was in agreement with the electrochemical tests. As discussed above, due to the limited amount of Mn, the Fe impurity precipitated as the Al-Fe phases in the Mg-3Al alloy. The micro-galvanic corrosion between Al-Fe phases and the (αMg) matrix was extremely serious. After adding some Mn into the alloys, B2-Al(Mn,Fe), Al8Mn5(LT), and τ–Al0.89Mn1.11 precipitated with Fe. Although there was still micro-galvanic corrosion between these Al-Mn(-Fe) particles and the (αMg) matrix [32,88], this detrimental effect was suppressed significantly. There were two reasons for the improvement. First, the potential difference of Al-Mn(-Fe) particles was significantly less than Al-Fe particles with respect to the magnesium matrix [11,22,37,89]. Second, as shown in the above thermodynamic calculations, the first precipitated Fe-rich B2-Al(Mn,Fe) could be encapsulated by Al8Mn5(LT), which prevented the contact of the Fe-rich phase and the (αMg) matrix [74]. Additionally, the increasing amount of Al8Mn5(LT) with the increment of Mn content alleviated the harmful effect gradually. Thus, Mn addition improved the corrosion behavior of the Mg-Al alloys by changing the type and the amount of the intermetallic particles.
4. Conclusions
The effects of Mn addition on microstructure and corrosion behavior of the Mg-3Al-xMn (x = 0.12, 0.21, 0.36, 0.45) alloys were investigated through the combination of experiments and thermodynamic calculations. The main conclusions drawn are as follows:
(1) Mn addition did not show the grain refinement on the cast Mg-3Al-xMn alloys. A small amount of the Al-Fe particles was observed in the Mg-3Al alloy. Al8Mn5(LT) existed as the main intermetallic compound in all Mn-added alloys. Only in the Mg-3Al-0.36Mn and the Mg-3Al-0.45Mn alloys, a lower Al/(Mn + Fe) ratio τ–Al0.89Mn1.11 phase was observed.
(2) Based on the Scheil solidification calculation, Fe-richer B2-Al(Mn,Fe) was predicted to form as the first precipitated phase in all alloys. Due to the limited amount, B2-Al(Mn,Fe) was only experimentally observed in the Mg-3Al-0.12Mn and Mg-3Al-0.45Mn alloys. Al8Mn5(LT) would envelop B2-Al(Mn,Fe) in Mn-added alloys.
(3) Pitting corrosion characteristic was observed from the polarization and EIS curves in all alloys. Passivation stages were only detected in the polarization curves of the Mg-3Al-0.36Mn and the Mg-3Al-0.45Mn alloys. Both the electrochemical and the hydrogen evolution tests indicated that Mn addition gradually improved the corrosion resistance of the Mg-Al alloys in NaCl solution. The high cathodic Al-Fe intermetallic compounds could be changed into Al8Mn5(LT) by adding minor quantities of Mn (0.12 wt.%). Increasing Mn addition would lead to more Al8Mn5(LT), which could encapsulate the Fe-richer B2-Al(Mn,Fe) phase and thus alleviate micro-galvanic corrosion in the alloys.
Author Contributions
S.Y. and S.L. conceived and designed the experiments; S.Y. performed the experiments; S.L. and X.L. constructed the thermodynamic database and performed the thermodynamic calculations; S.L., T.L., Y.L. and Y.D. contributed reagents and analysis tools; S.Y, S.L., G.Z, X.L. wrote the manuscript.
Funding
The financial support from National Natural Foundation of China (No. 51771235) is acknowledged.
Acknowledgements
S.Y and S.L. appreciate the help of Wenxin Hu from Baotou Research Institute of Rare Earths, Baotou 014030, China, for the samples fabrication.
Conflicts of Interest
The authors declare no conflict of interest.
References
- Kulekci, M.K. Magnesium and its alloys applications in automotive industry. Int. J. Adv. Manuf. Technol. 2007, 39, 851–865. [Google Scholar] [CrossRef]
- Kumar, D.S.; Sasanka, C.T.; Ravindra, K.; Suman, K. Magnesium and its alloys in automotive applications—A review. Am. J. Mater. Sci. Technol. 2015, 4, 12–30. [Google Scholar] [CrossRef]
- Pekguleryuz, M.O.; Kaya, A.A. Creep resistant magnesium alloys for powertrain applications. Adv. Eng. Mater. 2003, 5, 866–878. [Google Scholar] [CrossRef]
- La, M.; Zhou, H.J.; Li, N.; Xin, Y.C.; Sha, R.; Bao, S.H.; Jin, P. Improved performance of Mg–Y alloy thin film switchable mirrors after coating with a superhydrophobic surface. Appl. Surf. Sci. 2017, 403, 23–28. [Google Scholar] [CrossRef]
- Atrens, A.; Song, G.L.; Liu, M.; Shi, Z.M.; Cao, F.Y.; Dargusch, M.S. Review of recent developments in the field of magnesium corrosion. Adv. Eng. Mater. 2015, 17, 400–453. [Google Scholar] [CrossRef]
- Cao, H.H.; Huo, W.T.; Ma, S.F.; Zhang, Y.S.; Zhou, L. Microstructure and corrosion behavior of composite coating on pure Mg acquired by sliding friction treatment and micro-arc oxidation. Materials 2018, 11, 1232. [Google Scholar] [CrossRef]
- Atrens, A.; Song, G.L.; Shi, Z.M.; Soltan, A.; Johnston, S.; Dargusch, M.S. Understanding the Corrosion of Mg and Mg Alloys. In Encyclopedia of Interfacial Chemistry; Wandelt, K., Ed.; Elservier: Oxford, UK, 2018; pp. 515–534. [Google Scholar]
- Liu, W.J.; Cao, F.H.; Chang, L.R.; Zhang, Z.; Zhang, J.Q. Effect of rare earth element Ce and La on corrosion behavior of AM60 magnesium alloy. Corros. Sci. 2009, 51, 1334–1343. [Google Scholar] [CrossRef]
- Ahmed, D.S.; Edyvean, R.G.J.; Sellars, C.M.; Jones, H. Effect of additions of Mn, Ce, Nd, and Si on rate of dissolution of splat quenched Mg–Al and Mg–Zn alloys in 3% NaCl solution. Mater. Sci. Technol. 1990, 6, 469–474. [Google Scholar] [CrossRef]
- Zhang, J.H.; Wang, J.; Qiu, X.; Zhang, D.P.; Tian, Z.; Niu, X.D.; Tang, D.X.; Meng, J. Effect of Nd on the microstructure, mechanical properties and corrosion behavior of die-cast Mg–4Al-based alloy. J. Alloys Compd. 2008, 464, 556–564. [Google Scholar] [CrossRef]
- Mingo, B.; Arrabal, R.; Mohedano, M.; Mendis, C.L.; del Olmo, R.; Matykina, E.; Hort, N.; Merino, M.C.; Pardo, A. Corrosion of Mg–9Al alloy with minor alloying elements (Mn, Nd, Ca, Y and Sn). Mater. Des. 2017, 130, 48–58. [Google Scholar] [CrossRef]
- Arrabal, R.; Mingo, B.; Pardo, A.; Matykina, E.; Mohedano, M.; Merino, M.C.; Rivas, A.; Maroto, A. Role of alloyed Nd in the microstructure and atmospheric corrosion of as-cast magnesium alloy AZ91. Corros. Sci. 2015, 97, 38–48. [Google Scholar] [CrossRef]
- Liu, N.; Wang, J.L.; Wang, L.D.; Wu, Y.M.; Wang, L.M. Electrochemical corrosion behavior of Mg–5Al–0.4Mn–xNd in NaCl solution. Corros. Sci. 2009, 51, 1328–1333. [Google Scholar] [CrossRef]
- Cai, S.H.; Lei, T.; Li, N.F.; Feng, F.F. Effects of Zn on microstructure, mechanical properties and corrosion behavior of Mg–Zn alloys. Mater. Sci. Eng. C 2012, 32, 2570–2577. [Google Scholar] [CrossRef]
- Nam, N.D. Corrosion behavior of Mg-5Al based magnesium alloy with 1 wt.% Sn, Mn and Zn additions in 3.5 wt.% NaCl solution. J. Magn. Alloys 2014, 2, 190–195. [Google Scholar] [CrossRef]
- Baek, S.M.; Kang, J.S.; Shin, H.J.; Yim, C.D.; You, B.S.; Ha, H.Y.; Park, S.S. Role of alloyed Y in improving the corrosion resistance of extruded Mg–Al–Ca-based alloy. Corros. Sci. 2017, 118, 227–232. [Google Scholar] [CrossRef]
- Bakhsheshi-Rad, H.R.; Abdellahi, M.; Hamzah, E.; Ismail, A.F.; Bahmanpour, M. Modelling corrosion rate of biodegradable magnesium-based alloys: The case study of Mg–Zn–RE–xCa (x = 0, 0.5, 1.5, 3 and 6 wt.%) alloys. J. Alloys Compd. 2016, 687, 630–642. [Google Scholar] [CrossRef]
- Nam, N.D.; Mathesh, M.; Forsyth, M.; Jo, D.S. Effect of manganese additions on the corrosion behavior of an extruded Mg–5Al based alloy. J. Alloys Compd. 2012, 542, 199–206. [Google Scholar] [CrossRef]
- Metalnikov, P.; Ben-Hamu, G.; Templeman, Y.; Shin, K.S.; Meshi, L. The relation between Mn additions, microstructure and corrosion behavior of new wrought Mg–5Al alloys. Mater. Charact. 2018, 145, 101–115. [Google Scholar] [CrossRef]
- Wan, D.Q.; Wang, J.C.; Wang, G.F.; Chen, X.Y.; Lin, L.; Feng, Z.G.; Yang, G.C. Effect of Mn on damping capacities, mechanical properties, and corrosion behaviour of high damping Mg–3wt.%Ni based alloy. Mater. Sci. Eng. A 2008, 494, 139–142. [Google Scholar]
- Cho, D.H.; Lee, B.W.; Park, J.Y.; Cho, K.M.; Park, I.M. Effect of Mn addition on corrosion properties of biodegradable Mg-4Zn-0.5Ca-xMn alloys. J. Alloys Compd. 2017, 695, 1166–1174. [Google Scholar] [CrossRef]
- Ha, H.Y.; Kim, H.J.; Baek, S.M.; Kim, B.; Sohn, S.D.; Shin, H.J.; Jeong, H.Y.; Park, S.H.; Yim, C.D.; You, B.S.; et al. Improved corrosion resistance of extruded Mg–8Sn–1Zn–1Al alloy by microalloying with Mn. Scr. Mater. 2015, 109, 38–43. [Google Scholar] [CrossRef]
- Li, X.Y.; Li, M.Z.; Fan, L.Q.; Wang, H.Y.; Feng, C.; Meng, H. Effects of Mn on Corrosion Resistant Property of AZ91 Alloys. Rare Met. Mater. Eng. 2014, 43, 278–282. [Google Scholar]
- Song, G.L.; Atrens, A. Understanding Magnesium Corrosion—A Framework for Improved Alloy Performance. Adv. Eng. Mater. 2003, 5, 837–858. [Google Scholar] [CrossRef]
- Hillis, J.E.; Murray, R.W. Finishing alternatives for high purity magnesium alloys. In Proceedings of the SDCE 14th International Die Casting Congress and Exposition, Toronto, ON, Canada, 11–14 May 1987. Paper No. G-T87-003. [Google Scholar]
- Hillis, J.E.; Shook, S.O. Composition and performance of an improved magnesium AS41 alloy. In Proceedings of the SAE International Congress and Exposition, Detroit, MI, USA, 1 February 1989. SAE Technical Paper 890205. [Google Scholar]
- Hillis, J.E.; Reichek, K. High Purity Magnesium AM60 Alloy: The Critical Contaminant Limits and the Salt Water Corrosion Performance. In Proceedings of the SAE International Congress and Exposition, Detroit, MI, USA, 1 February 1986. SAE Technical Paper 860288. [Google Scholar]
- Liu, M.; Uggowitzer, P.J.; Nagasekhar, A.V.; Schmutz, P.; Easton, M.; Song, G.L.; Atrens, A. Calculated phase diagrams and the corrosion of die-cast Mg–Al alloys. Corros. Sci. 2009, 51, 602–619. [Google Scholar] [CrossRef]
- Mercer, W.E.; Hillis, J.E. The critical contaminant limits and salt water corrosion performance of magnesium AE42 alloy. In Proceedings of the SAE International Congress and Exposition, Detroit, MI, USA, 1 February 1992. SAE Technical Paper 920073. [Google Scholar]
- Song, G.L.; Atrens, A. Corrosion mechanisms of magnesium alloys. Adv. Eng. Mater. 1999, 1, 11–33. [Google Scholar] [CrossRef]
- Han, G.; Liu, X.F. Phase control and formation mechanism of Al–Mn(–Fe) intermetallic particles in Mg–Al-based alloys with FeCl3 addition or melt superheating. Acta Mater. 2016, 114, 54–66. [Google Scholar] [CrossRef]
- Danaie, M.; Asmussen, R.M.; Jakupi, P.; Shoesmith, D.W.; Botton, G.A. The cathodic behaviour of Al–Mn precipitates during atmospheric and saline aqueous corrosion of a sand-cast AM50 alloy. Corros. Sci. 2014, 83, 299–309. [Google Scholar] [CrossRef]
- Ye, H.Z.; Liu, X.Y. In situ formation behaviors of Al8Mn5 particles in Mg–Al alloys. J. Alloys Compd. 2006, 419, 54–60. [Google Scholar] [CrossRef]
- Pawar, S.; Zhou, X.; Hashimoto, T.; Thompson, G.E.; Scamans, G.; Fan, Z. Investigation of the microstructure and the influence of iron on the formation of Al8Mn5 particles in twin roll cast AZ31 magnesium alloy. J. Alloys Compd. 2015, 628, 195–198. [Google Scholar] [CrossRef]
- Pan, F.S.; Feng, Z.X.; Zhang, X.Y.; Tang, A.T. The Types and Distribution Characterization of Al–Mn Phases in the AZ61 Magnesium Alloy. Procedia Eng. 2012, 27, 833–839. [Google Scholar] [CrossRef]
- Lun Sin, S.; Dubé, D.; Tremblay, R. Characterization of Al–Mn particles in AZ91D investment castings. Mater. Charact. 2007, 58, 989–996. [Google Scholar] [CrossRef]
- Pawar, S.; Zhou, X.; Thompson, G.E.; Scamans, G.; Fan, Z. The Role of Intermetallics on the Corrosion Initiation of Twin Roll Cast AZ31 Mg Alloy. J. Electrochem. Soc. 2015, 162, C442–C448. [Google Scholar] [CrossRef]
- Laser, T.; Nürnberg, M.R.; Janz, A.; Hartig, C.; Letzig, D.; Schmid-Fetzer, R.; Bormann, R. The influence of manganese on the microstructure and mechanical properties of AZ31 gravity die cast alloys. Acta Mater. 2006, 54, 3033–3041. [Google Scholar] [CrossRef]
- Wang, R.M.; Eliezer, A.; Gutman, E.M. An investigation on the microstructure of an AM50 magnesium alloy. Mater. Sci. Eng. A 2003, 355, 201–207. [Google Scholar] [CrossRef]
- Liu, C.P.; Pan, F.S.; Wang, W.Q. Phase analysis of Al-Mn compounds in the AZ magnesium alloys. Mater. Sci. Forum 2007, 546–549, 395–398. [Google Scholar] [CrossRef]
- Han, G.; Ma, G.L.; Liu, X.F. Effect of manganese on the microstructure of Mg–3Al alloy. J. Alloys Compd. 2009, 486, 136–141. [Google Scholar] [CrossRef]
- Medved, J.; Mrvar, P. Thermal Analysis of the Mg–Al Alloys. Mater. Sci. Forum 2006, 508, 603–608. [Google Scholar] [CrossRef]
- Voncina, M.; Petric, M.; Mrvar, P.; Medved, J. Thermodynamic characterization of solidification and defects that occur in Mg-alloy AM60. J. Min. Metall. Sect. B 2017, 53, 107–114. [Google Scholar] [CrossRef]
- Gandel, D.S.; Easton, M.A.; Gibson, M.A.; Birbilis, N. CALPHAD simulation of the Mg–(Mn, Zr)–Fe system and experimental comparison with as-cast alloy microstructures as relevant to impurity driven corrosion of Mg-alloys. Mater. Chem. Phys. 2014, 143, 1082–1091. [Google Scholar] [CrossRef]
- Xu, G.L.; Zhang, L.G.; Liu, L.B.; Du, Y.; Zhang, F.; Xu, K.; Liu, S.H.; Tan, M.Y.; Jin, Z.P. Thermodynamic database of multi-component Mg alloys and its application to solidification and heat treatment. J. Magn. Alloys 2016, 4, 249–264. [Google Scholar] [CrossRef]
- Chen, H.L.; Chen, Q.; Engström, A. Development and applications of the TCAL aluminum alloy database. Calphad 2018, 62, 154–171. [Google Scholar] [CrossRef]
- Schmid-Fetzer, R.; Zhang, F. The light alloy Calphad databases PanAl and PanMg. Calphad 2018, 61, 246–263. [Google Scholar] [CrossRef]
- Shi, R.H.; Luo, A.A. Applications of CALPHAD modeling and databases in advanced lightweight metallic materials. Calphad 2018, 62, 1–17. [Google Scholar] [CrossRef]
- Dahle, A.K.; Lee, Y.C.; Nave, M.D.; Schaffer, P.L.; StJohn, D.H. Development of the as-cast microstructure in magnesium–aluminium alloys. J. Light Met. 2001, 1, 61–72. [Google Scholar] [CrossRef]
- Khan, S.A.; Miyashita, Y.; Mutoh, Y.; Sajuri, Z.B. Influence of Mn content on mechanical properties and fatigue behavior of extruded Mg alloys. Mater. Sci. Eng. A 2006, 420, 315–321. [Google Scholar] [CrossRef]
- Gusieva, K.; Davies, C.H.J.; Scully, J.R.; Birbilis, N. Corrosion of magnesium alloys: The role of alloying. Int. Mater. Rev. 2014, 60, 169–194. [Google Scholar] [CrossRef]
- Zheng, W.S.; He, S.; Selleby, M.; He, Y.L.; Li, L.; Lu, X.G.; Ågren, J. Thermodynamic assessment of the Al–C–Fe system. Calphad 2017, 58, 34–49. [Google Scholar] [CrossRef]
- Zheng, W.; Mao, H.; Lu, X.G.; He, Y.; Li, L.; Selleby, M.; Ågren, J. Thermodynamic investigation of the Al-Fe-Mn system over the whole composition and wide temperature ranges. J. Alloys Compd. 2018, 742, 1046–1057. [Google Scholar] [CrossRef]
- Balanetskyy, S.; Pavlyuchkov, D.; Velikanova, T.; Grushko, B. The Al-rich region of the Al–Fe–Mn alloy system. J. Alloys Compd. 2015, 619, 211–220. [Google Scholar] [CrossRef]
- Lindahl, B.B.; Selleby, M. The Al–Fe–Mn system revisited-An updated thermodynamic description using the most recent binaries. Calphad 2013, 43, 86–93. [Google Scholar] [CrossRef]
- Lindahl, B.B.; Burton, B.P.; Selleby, M. Ordering in ternary BCC alloys applied to the Al–Fe–Mn system. Calphad 2015, 51, 211–219. [Google Scholar] [CrossRef]
- Qiu, K.; Wang, R.C.; Peng, C.Q.; Lu, X.X.; Wang, N.G. Polynomial regression and interpolation of thermodynamic data in Al–Si–Mg–Fe system. Calphad 2015, 48, 175–183. [Google Scholar] [CrossRef]
- Wu, P.P.; Xu, F.J.; Deng, K.K.; Han, F.Y.; Zhang, Z.Z.; Gao, R. Effect of extrusion on corrosion properties of Mg-2Ca-xAl (x = 0, 2, 3, 5) alloys. Corros. Sci. 2017, 127, 280–290. [Google Scholar] [CrossRef]
- Zhong, Y.; Yang, M.; Liu, Z.K. Contribution of first-principles energetics to Al–Mg thermodynamic modeling. Calphad 2005, 29, 303–311. [Google Scholar] [CrossRef]
- Gröbner, J.; Mirkovic, D.; Ohno, M.; Schmid-Fetzer, R. Experimental Investigation and Thermodynamic Calculation of Binary Mg–Mn Phase Equilibria. J. Phase Equilib. Diffus. 2005, 26, 234–239. [Google Scholar] [CrossRef]
- Ansara, I.; Dinsdale, A.T.; Rand, M.H. COST 507: Thermochemical Database for Light Metal Alloys; Office for Official Publications of the European Communities: Brussels, Belgium, 1998; Volume 2, p. 195. [Google Scholar]
- Du, Y.; Wang, J.; Zhao, J.R.; Schuster, J.C.; Weitzer, F.; Schmid-Fetzer, R.; Ohno, M.; Xu, H.; Liu, Z.K.; Shang, S.L.; et al. Reassessment of the Al–Mn system and a thermodynamic description of the Al–Mg–Mn system. Int. J. Mater. Res. 2007, 98, 855–871. [Google Scholar] [CrossRef]
- Sundman, B.; Ohnuma, I.; Dupin, N.; Kattner, U.R.; Fries, S.G. An assessment of the entire Al–Fe system including D03 ordering. Acta Mater. 2009, 57, 2896–2908. [Google Scholar] [CrossRef]
- Huang, W.M. An assessment of the Fe-Mn system. Calphad 1989, 13, 243–252. [Google Scholar] [CrossRef]
- Djurovic, D.; Hallstedt, B.; von Appen, J.; Dronskowski, R. Thermodynamic assessment of the Fe–Mn–C system. Calphad 2011, 35, 479–491. [Google Scholar] [CrossRef]
- Liu, S.H. Order-Disorder Phase Transition, Topology of Phase Diagrams and Their Applications during Solidification of Al Alloys. Ph.D. Thesis, Central South University, Changsha, China, 2010. [Google Scholar]
- Wang, P.S.; Zhao, J.R.; Du, Y.; Xu, H.H.; Gang, T.; Fen, J.C.; Zhang, L.J.; He, C.Y.; Liu, S.H.; Ouyang, H.W. Experimental investigation and thermodynamic calculation of the Fe–Mg–Mn and Fe–Mg–Ni systems. Int. J. Mater. Res. 2011, 102, 6–16. [Google Scholar] [CrossRef]
- Cao, P.; Qian, M.; StJohn, D.H. Effect of manganese on grain refinement of Mg–Al based alloys. Scr. Mater. 2006, 54, 1853–1858. [Google Scholar] [CrossRef]
- Wang, Y.; Xia, M.; Fan, Z.; Zhou, X.; Thompson, G.E. The effect of Al8Mn5 intermetallic particles on grain size of as-cast Mg–Al–Zn AZ91D alloy. Intermetallics 2010, 18, 1683–1689. [Google Scholar] [CrossRef]
- Revie, R.W. Uhlig’s Corrosion Handbook, 3rd ed.; John Wiley & Sons: New York, NY, USA, 2011; p. 830. [Google Scholar]
- Kim, H.J.; Kim, B.; Baek, S.M.; Sohn, S.D.; Shin, H.J.; Jeong, H.Y.; Yim, C.D.; You, B.S.; Ha, H.Y.; Park, S.S. Influence of alloyed Al on the microstructure and corrosion properties of extruded Mg–8Sn–1Zn alloys. Corros. Sci. 2015, 95, 133–142. [Google Scholar] [CrossRef]
- Liu, J.R.; Chen, H.K.; Zhao, L.; Huang, W.D. Oxidation behaviour of molten magnesium and AZ91D magnesium alloy in 1,1,1,2-tetrafluoroethane/air atmospheres. Corros. Sci. 2009, 51, 129–134. [Google Scholar] [CrossRef]
- Pettersen, G.; Øvrelid, E.; Tranell, G.; Fenstad, J.; Gjestland, H. Characterisation of the surface films formed on molten magnesium in different protective atmospheres. Mater. Sci. Eng. A 2002, 332, 285–294. [Google Scholar] [CrossRef]
- Zeng, G.; Xian, J.W.; Gourlay, C.M. Nucleation and growth crystallography of Al8Mn5 on B2-Al(Mn,Fe) in AZ91 magnesium alloys. Acta Mater. 2018, 153, 364–376. [Google Scholar] [CrossRef]
- Crisan, A.D.; Vasiliu, F.; Nicula, R.; Bartha, C.; Mercioniu, I.; Crisan, O. Thermodynamic, structural and magnetic studies of phase transformations in MnAl nanocomposite alloys. Mater. Charact. 2018, 140, 1–8. [Google Scholar] [CrossRef]
- Balanetskyy, S.; Meisterernst, G.; Heggen, M.; Feuerbacher, M. Reinvestigation of the Al–Mn–Pd alloy system in the vicinity of the T-and R-phases. Intermetallics 2008, 16, 71–87. [Google Scholar] [CrossRef]
- Braun, P.B.; Goedkoop, J.A. An X-ray and neutron diffraction investigation of the magnetic phase Al0.89Mn1.11. Acta Cryst. 1963, 16, 737–740. [Google Scholar] [CrossRef]
- Koch, A.J.J.; Hokkeling, P.; vd. Steeg, M.G.; de Vos, K.J. New Material for Permanent Magnets on a Base of Mn and Al. J. Appl. Phys. 1960, 31, S75–S77. [Google Scholar] [CrossRef]
- Krendelsberger, N.; Weitzer, F.; Schuster, J.C. On the constitution of the system Al–Mn–Si. Metall. Mater. Trans. A 2002, 33, 3311–3319. [Google Scholar] [CrossRef]
- Grushko, B.; Stafford, G. A Cs–Cl-type phase in electrodeposited Al–Mn alloys. Scr. Metall. Mater. 1994, 31, 1711–1716. [Google Scholar] [CrossRef]
- Hafner, J.; Hobbs, D. Understanding the complex metallic element Mn. II. Geometric frustration in β-Mn, phase stability, and phase transitions. Phys. Rev. B 2003, 68, 014408–014423. [Google Scholar] [CrossRef]
- Nishidate, K.; Baba, M.; Sato, T.; Nishikawa, K. Molecular-dynamics studies on the shock-induced phase transition of a MgF2 crystal. Phys. Rev. B 1995, 52, 3170–3176. [Google Scholar] [CrossRef]
- Kim, Y.M.; Yim, C.D.; You, B.S. Grain refining mechanism in Mg–Al base alloys with carbon addition. Scr. Mater. 2007, 57, 691–694. [Google Scholar] [CrossRef]
- Choi, H.Y.; Kim, W.J. Development of the highly corrosion resistant AZ31 magnesium alloy by the addition of a trace amount of Ti. J. Alloys Compd. 2016, 664, 25–37. [Google Scholar] [CrossRef]
- Yu, X.; Wang, J.; Zhang, M.L.; Yang, P.P.; Yang, L.H.; Cao, D.X.; Li, J.Q. One-step synthesis of lamellar molybdate pillared hydrotalcite and its application for AZ31 Mg alloy protection. Solid State Sci. 2009, 11, 376–381. [Google Scholar] [CrossRef]
- Feng, H.; Liu, S.H.; Du, Y.; Lei, T.; Zeng, R.C.; Yuan, T.C. Effect of the second phases on corrosion behavior of the Mg-Al-Zn alloys. J. Alloys Compd. 2017, 695, 2330–2338. [Google Scholar] [CrossRef]
- Wei, Y.H.; Zhang, L.X.; Ke, W. Evaluation of corrosion protection of carbon black filled fusion-bonded epoxy coatings on mild steel during exposure to a quiescent 3% NaCl solution. Corros. Sci. 2007, 49, 287–302. [Google Scholar] [CrossRef]
- Ma, Y.L.; Zhang, J.; Yang, M.B. Research on microstructure and alloy phases of AM50 magnesium alloy. J. Alloys Compd. 2009, 470, 515–521. [Google Scholar] [CrossRef]
- Andreatta, F.; Apachitei, I.; Kodentsov, A.A.; Dzwonczyk, J.; Duszczyk, J. Volta potential of second phase particles in extruded AZ80 magnesium alloy. Electrochim. Acta 2006, 51, 3551–3557. [Google Scholar] [CrossRef]
Figure 1.
Calculated phase diagrams of binary systems based on the self-constructed Mg-Al-Mn-Fe database: (a) Al-Mg, (b) Mg-Mn, (c) Mg-Fe.
Figure 1.
Calculated phase diagrams of binary systems based on the self-constructed Mg-Al-Mn-Fe database: (a) Al-Mg, (b) Mg-Mn, (c) Mg-Fe.

Figure 2.
Calculated phase diagrams of binary systems based on the self-constructed Mg-Al-Mn-Fe database: (a) Al-Mn, (b) Al-Fe, (c) Fe-Mn. The dashed line in (b) represents the calculated Bcc_A2/Bcc_B2 transition line.
Figure 2.
Calculated phase diagrams of binary systems based on the self-constructed Mg-Al-Mn-Fe database: (a) Al-Mn, (b) Al-Fe, (c) Fe-Mn. The dashed line in (b) represents the calculated Bcc_A2/Bcc_B2 transition line.

Figure 3.
Calculated isothermal sections of four ternary systems based on the self-constructed Mg-Al-Mn-Fe database: (a) Al-Mg-Mn at 710 °C, (b) Mg-Al-Fe at 400 °C, (c) Al-Fe-Mn at 700 °C, (d) Fe-Mg-Mn at 400 °C. The dashed line in (c) represents the calculated Bcc_A2/Bcc_B2 transition line.
Figure 3.
Calculated isothermal sections of four ternary systems based on the self-constructed Mg-Al-Mn-Fe database: (a) Al-Mg-Mn at 710 °C, (b) Mg-Al-Fe at 400 °C, (c) Al-Fe-Mn at 700 °C, (d) Fe-Mg-Mn at 400 °C. The dashed line in (c) represents the calculated Bcc_A2/Bcc_B2 transition line.
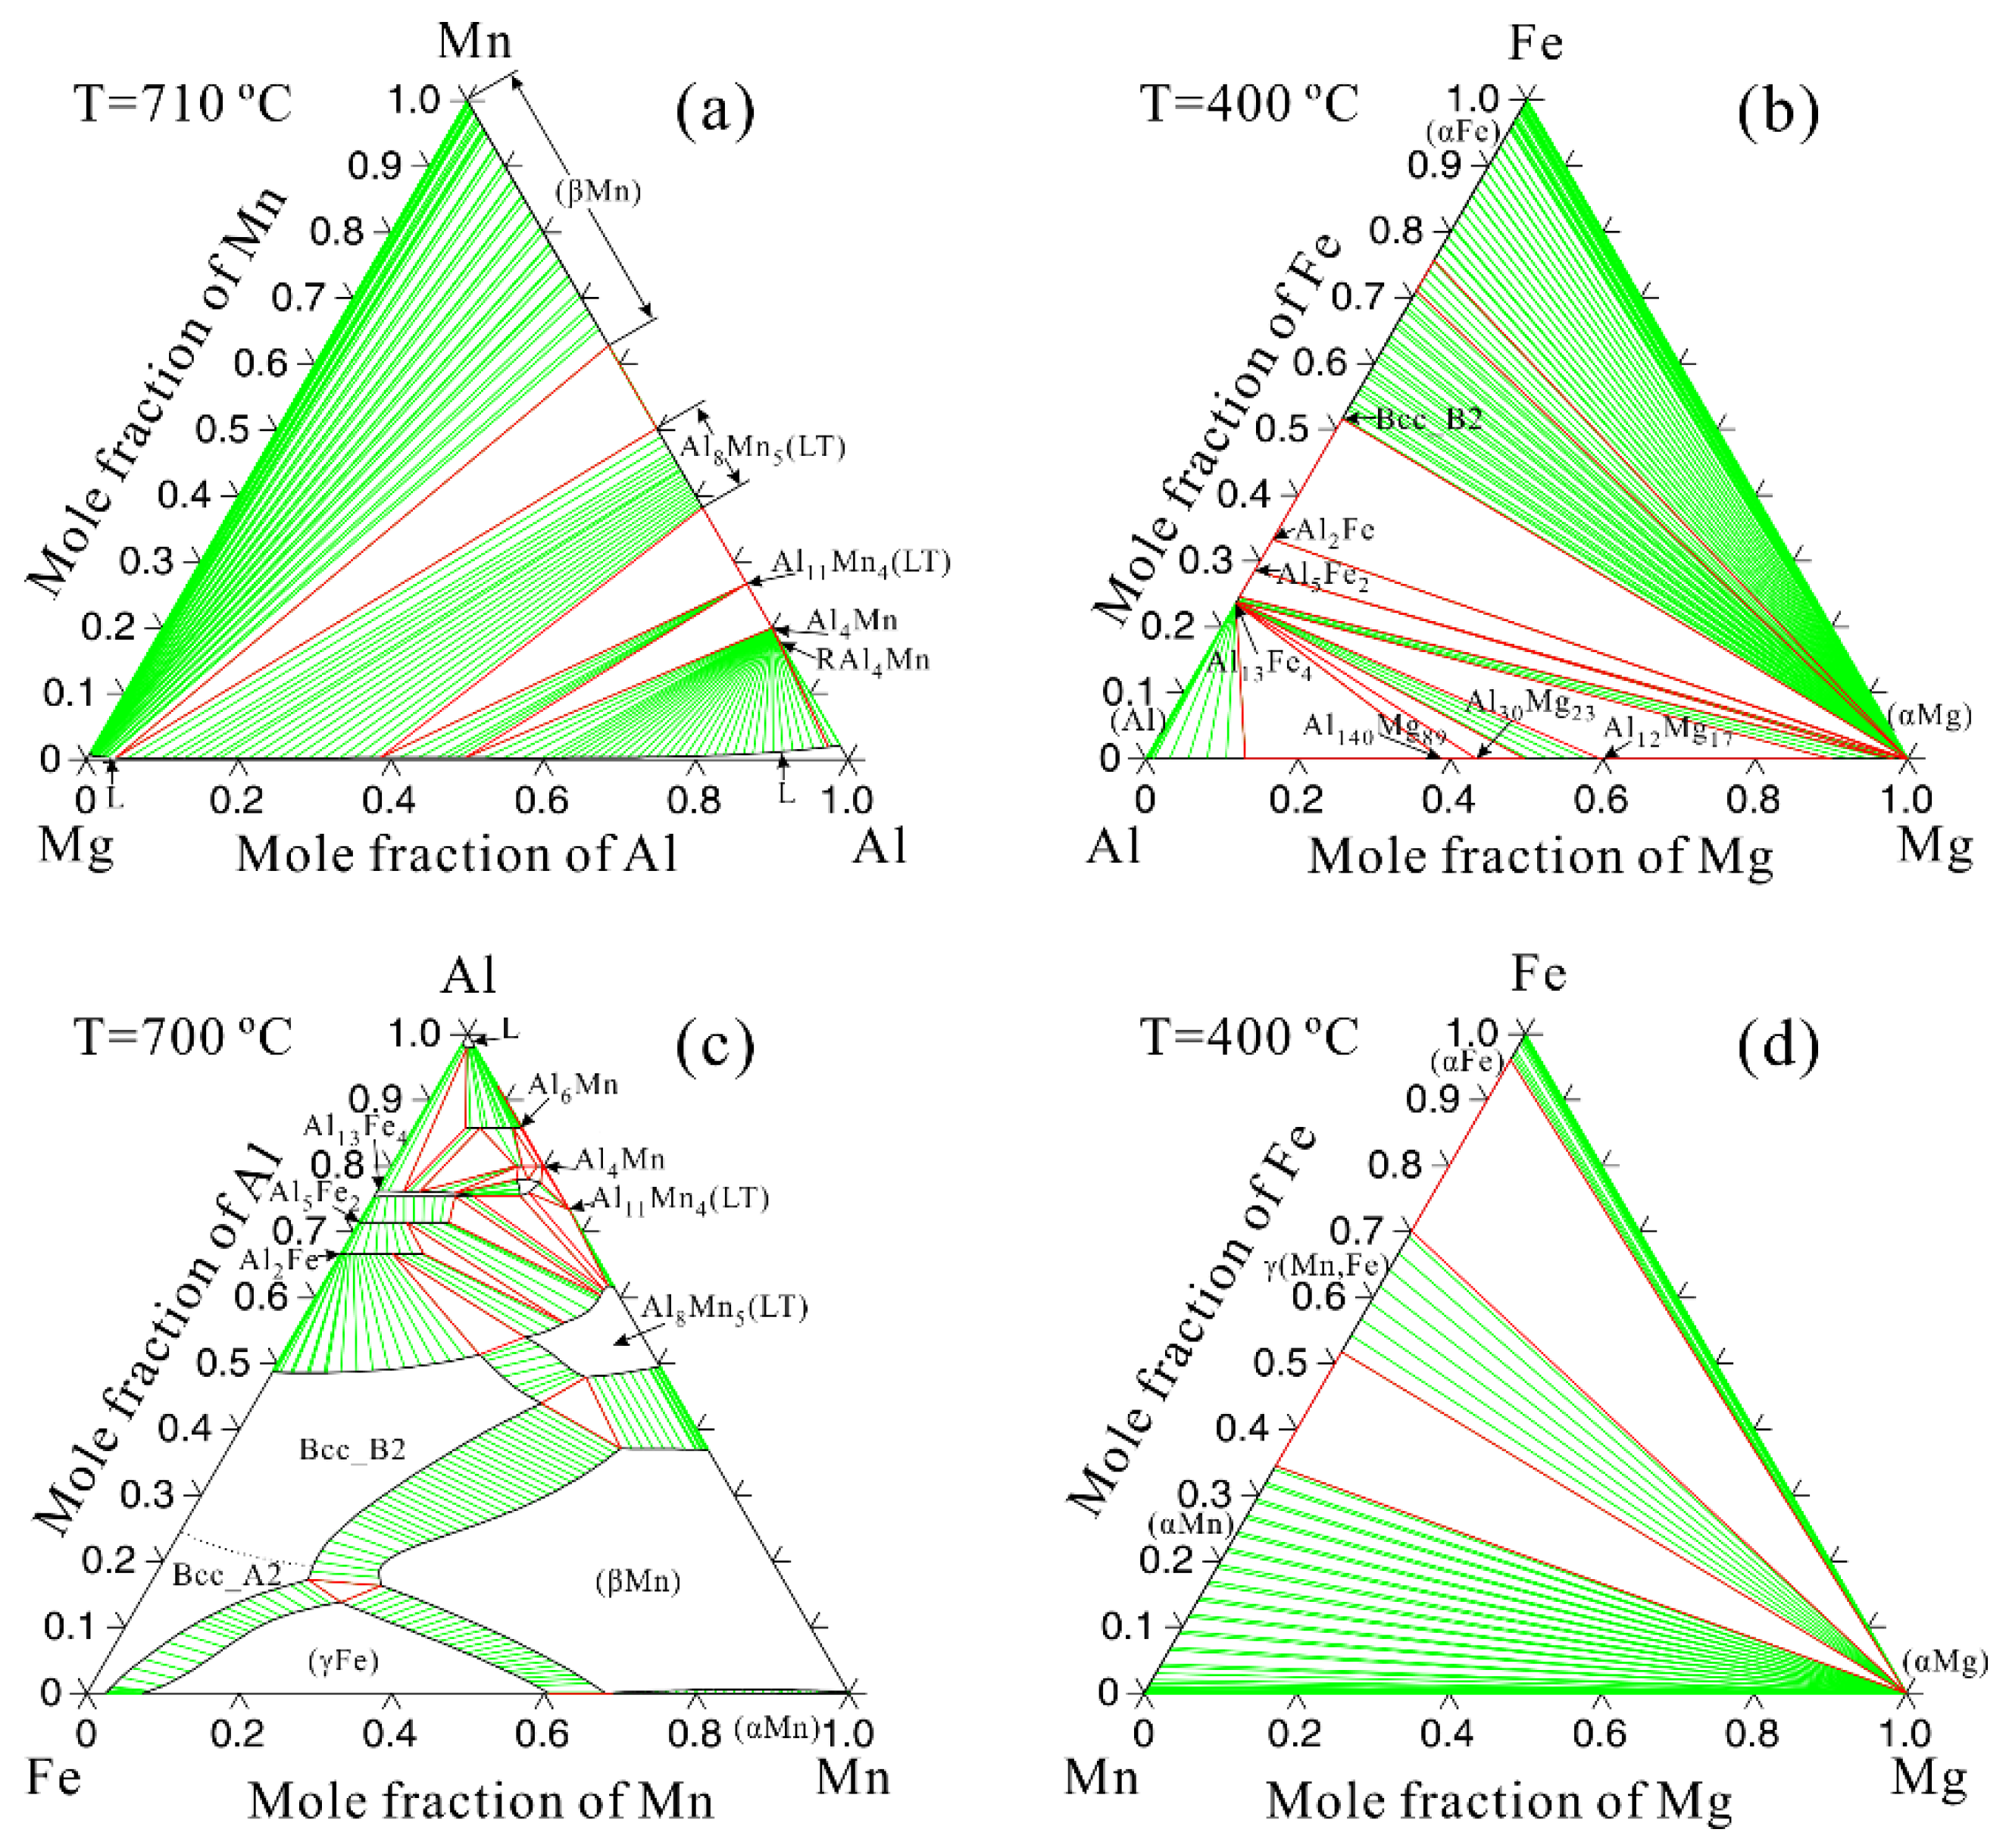
Figure 4.
Back scattered electron (BSE) images of the electrolytic polished Mg-3Al-xMn alloys by electron probe microanalysis (EPMA): (a) Mg-3Al, (b) Mg-3Al-0.12Mn, (c) Mg-3Al-0.21Mn, (d) Mg-3Al-0.36Mn, (e) Mg-3Al-0.45Mn. The dark spots are shrinkage cavity formed in the solidification process.
Figure 4.
Back scattered electron (BSE) images of the electrolytic polished Mg-3Al-xMn alloys by electron probe microanalysis (EPMA): (a) Mg-3Al, (b) Mg-3Al-0.12Mn, (c) Mg-3Al-0.21Mn, (d) Mg-3Al-0.36Mn, (e) Mg-3Al-0.45Mn. The dark spots are shrinkage cavity formed in the solidification process.

Figure 5.
BSE images of typical particles in the mechanical polished Mg-3Al-xMn alloys by EPMA: (a) Mg-3Al, (b) Mg-3Al-0.12Mn, (c) Mg-3Al-0.21Mn, (d) Mg-3Al-0.36Mn, (e) Mg-3Al-0.45Mn.
Figure 5.
BSE images of typical particles in the mechanical polished Mg-3Al-xMn alloys by EPMA: (a) Mg-3Al, (b) Mg-3Al-0.12Mn, (c) Mg-3Al-0.21Mn, (d) Mg-3Al-0.36Mn, (e) Mg-3Al-0.45Mn.

Figure 6.
BSE images of typical particles in the etched Mg-3Al-xMn alloys by SEM: (a) Mg-3Al alloy, (b) Mg-3Al-0.12Mn, (c) Mg-3Al-0.21Mn, (d) Mg-3Al-0.36Mn, (e) Mg-3Al-0.45Mn.
Figure 6.
BSE images of typical particles in the etched Mg-3Al-xMn alloys by SEM: (a) Mg-3Al alloy, (b) Mg-3Al-0.12Mn, (c) Mg-3Al-0.21Mn, (d) Mg-3Al-0.36Mn, (e) Mg-3Al-0.45Mn.

Figure 7.
(a) BSE images of the representative Al-Fe phase in the etched Mg-3Al alloy by SEM. (b–d) energy dispersive X-ray spectroscopy (EDX) maps showing Al, Fe, and Mn elemental distributions, respectively, in the particle.
Figure 7.
(a) BSE images of the representative Al-Fe phase in the etched Mg-3Al alloy by SEM. (b–d) energy dispersive X-ray spectroscopy (EDX) maps showing Al, Fe, and Mn elemental distributions, respectively, in the particle.

Figure 8.
XRD patterns of the extracted particles in the Mg-3Al-xMn alloys (x = 0.12, 0.21, 0.36, 0.45). Note that the particles in the Mg-3Al alloy were not extracted successfully due to the limited amount.
Figure 8.
XRD patterns of the extracted particles in the Mg-3Al-xMn alloys (x = 0.12, 0.21, 0.36, 0.45). Note that the particles in the Mg-3Al alloy were not extracted successfully due to the limited amount.

Figure 9.
(a) Calculated partial Al-Mn phase diagram based on the self-constructed database, (b) the Al/(Mn + Fe) ratio of the particles in the Mg-3Al-xMn alloys by EPMA, (c) determined Fe content in Al8Mn5(LT) (Al8Mn5 in low temperature) of the Mg-3Al-xMn alloys by EPMA.
Figure 9.
(a) Calculated partial Al-Mn phase diagram based on the self-constructed database, (b) the Al/(Mn + Fe) ratio of the particles in the Mg-3Al-xMn alloys by EPMA, (c) determined Fe content in Al8Mn5(LT) (Al8Mn5 in low temperature) of the Mg-3Al-xMn alloys by EPMA.

Figure 10.
Calculated Scheil solidification paths of the alloys: (a) Mg-2.97Al-0.01Mn-0.013Fe, (b) Mg-2.98Al-0.12Mn-0.01Fe, (c) Mg-2.86Al-0.21Mn-0.01Fe, (d) Mg-2.97Al-0.36Mn-0.008Fe, (e) Mg-2.96Al-0.45Mn-0.015Fe.
Figure 10.
Calculated Scheil solidification paths of the alloys: (a) Mg-2.97Al-0.01Mn-0.013Fe, (b) Mg-2.98Al-0.12Mn-0.01Fe, (c) Mg-2.86Al-0.21Mn-0.01Fe, (d) Mg-2.97Al-0.36Mn-0.008Fe, (e) Mg-2.96Al-0.45Mn-0.015Fe.

Figure 11.
(a) Predicted mole percentage of B2-Al(Mn,Fe) and Al8Mn5(LT) by Scheil solidification in different Mg-3Al-xMn alloys. (b) The statistic number of particles per mm2 in the Mg-3Al-xMn alloys based on low magnification EPMA images.
Figure 11.
(a) Predicted mole percentage of B2-Al(Mn,Fe) and Al8Mn5(LT) by Scheil solidification in different Mg-3Al-xMn alloys. (b) The statistic number of particles per mm2 in the Mg-3Al-xMn alloys based on low magnification EPMA images.
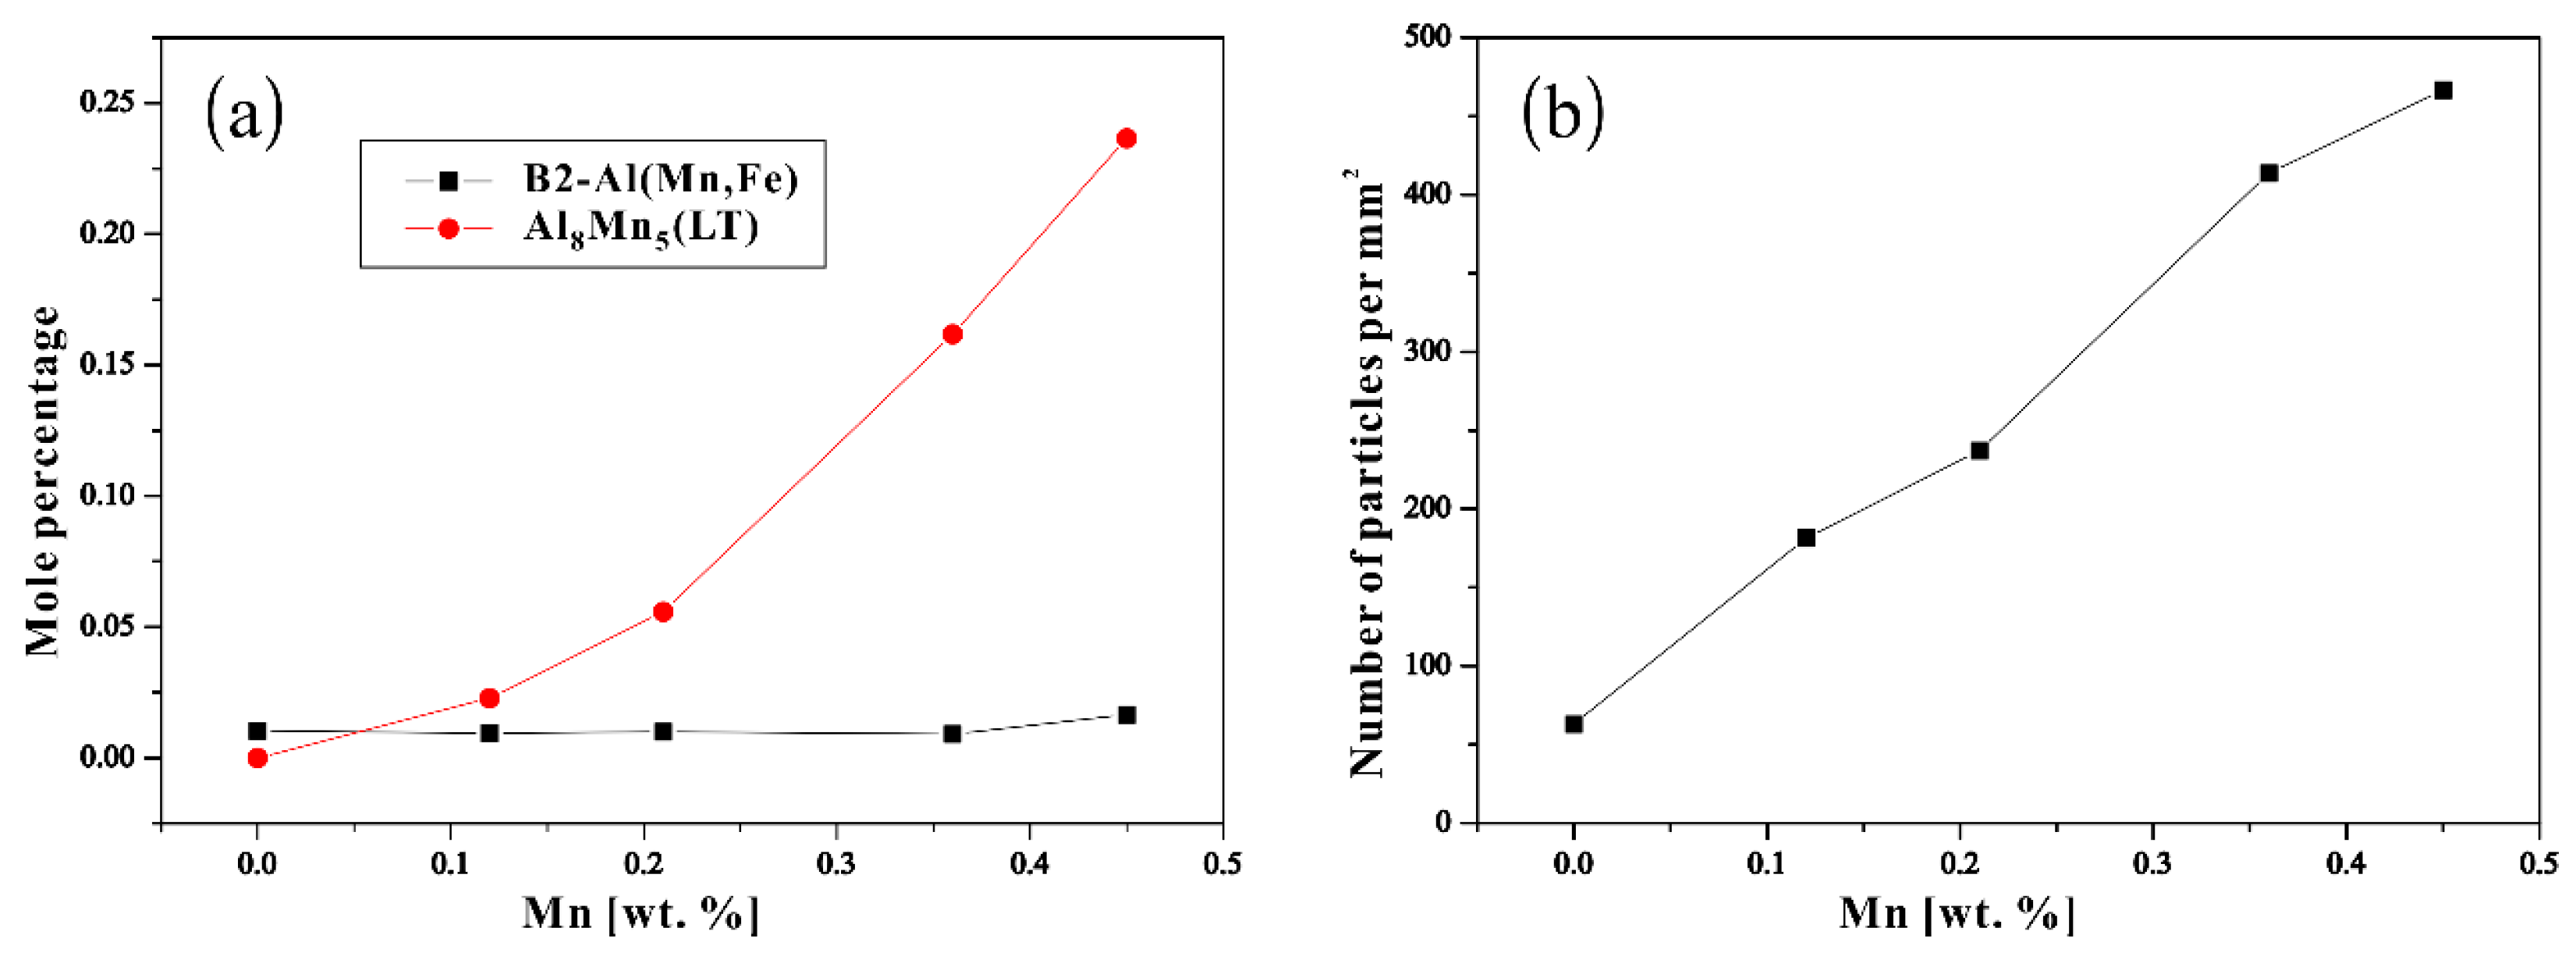
Figure 12.
Polarization curves of the Mg-3Al-xMn alloys in 3.5 wt.% NaCl solution, the breakdown potential Eb is marked by the arrow.
Figure 12.
Polarization curves of the Mg-3Al-xMn alloys in 3.5 wt.% NaCl solution, the breakdown potential Eb is marked by the arrow.

Figure 13.
The electrochemical impedance spectrum (EIS) results of the Mg-3Al-xMn alloys in 3.5 wt.% NaCl solution: (a) Nyquist plots, (b) the equivalent circuit.
Figure 13.
The electrochemical impedance spectrum (EIS) results of the Mg-3Al-xMn alloys in 3.5 wt.% NaCl solution: (a) Nyquist plots, (b) the equivalent circuit.

Figure 14.
Hydrogen evolution curves of the Mg-3Al-xMn samples immersed in 3.5 wt.% NaCl solution at room temperature.
Figure 14.
Hydrogen evolution curves of the Mg-3Al-xMn samples immersed in 3.5 wt.% NaCl solution at room temperature.


Table 1.
Alloy composition (wt.%) determined by ICP-AES (inductively coupled plasma-atomic emission spectroscopy).
Table 1.
Alloy composition (wt.%) determined by ICP-AES (inductively coupled plasma-atomic emission spectroscopy).
| Alloys | Al | Mn | Fe | Cu | Ni | Si | Fe/Mn | Mg |
|---|---|---|---|---|---|---|---|---|
| Mg-3Al | 2.97 | 0.01 | 0.013 | 0.001 | 0.006 | 0.001 | 1.300 | Balance |
| Mg-3Al-0.12Mn | 2.98 | 0.12 | 0.010 | 0.001 | 0.015 | 0.001 | 0.083 | Balance |
| Mg-3Al-0.21Mn | 2.86 | 0.21 | 0.010 | 0.001 | 0.030 | 0.001 | 0.048 | Balance |
| Mg-3Al-0.36Mn | 2.97 | 0.36 | 0.008 | 0.003 | 0.019 | 0.001 | 0.022 | Balance |
| Mg-3Al-0.45Mn | 2.96 | 0.45 | 0.015 | 0.002 | 0.018 | 0.001 | 0.033 | Balance |
Table 2.
Crystal structure of some crucial phases in the present study.
| Phase | Other Name | Crystal System | Pearson Symbol | Space Group | Lattice Parameters | Reference | |
|---|---|---|---|---|---|---|---|
| a, b, c/Å | α, β, γ | ||||||
| Al8Mn5(LT) | γ2 D810-Al8Mn5 | Hexagonal | 12.54, 12.54, 15.74 | α = β = 90°, γ = 120° | [75] | ||
| Al8Mn5(HT) | γ1 D82-Al8Mn5 | Cubic | 8.89, 8.89, 8.89 | α = β = γ = 90° | [74,76] | ||
| τ–Al0.89Mn1.11 | τ | Tetragonal | 2.77, 2.77, 3.54 | α = β = γ = 90° | [77,78] | ||
| Al11Mn4(LT) | - | Triclinic | 5.11, 8.87, 5.06 | α = 89°, β = 101°, γ = 105° | [79] | ||
| B2-Al(Mn,Fe) | Bcc_B2, B2-AlMn | Cubic | 3.08, 3.08, 3.08 | α = β = γ = 90° | [74,80] | ||
| (βMn) | - | Cubic | 32 | 6.29, 6.29, 6.29 | α = β = γ = 90° | [81] | |
| MgF2 | - | Tetragonal | 4.63, 4.63, 3.06 | α = β = γ = 90° | [82] | ||
Table 3.
Summary of the phases, Fe content, and morphologies of the Al-containing intermetallic particles based on EPMA and SEM analysis.
Table 3.
Summary of the phases, Fe content, and morphologies of the Al-containing intermetallic particles based on EPMA and SEM analysis.
| Phase | Fe Range (at.%) | Morphologies | Alloys |
|---|---|---|---|
| Al8Mn5(LT) | 0.2–4 | Micro-plates Rods/ribbons Dice-like particles Polyhedral particles | Mg-3Al-xMn (x = 0.12, 0.21, 0.36, 0.45) |
| τ–Al0.89Mn1.11 | 0.5–5.9 | Micro-plates Polyhedral particles | Mg-3Al-xMn (x = 0.36, 0.45) |
| B2-Al(Mn,Fe) | 12.5–17.3 | Micro-plates Polyhedral particles | Mg-3Al-xMn (x = 0.12, 0.45) |
| Al-Fe phase | 15.3–17.3 | Irregular blocky particles | Mg-3Al |
Table 4.
Critical parameters determined from polarization curves for the Mg-3Al-xMn alloys.
| Alloys | icorr/uA·cm−2 | Ecorr/VSCE | Eb/VSCE | (Eb − Ecorr)/mV |
|---|---|---|---|---|
| Mg-3Al | 410.1 | −1.560 | - | - |
| Mg-3Al-0.12Mn | 112.5 | −1.545 | - | - |
| Mg-3Al-0.21Mn | 51.3 | −1.546 | - | - |
| Mg-3Al-0.36Mn | 18.6 | −1.485 | −1.471 | 14 |
| Mg-3Al-0.45Mn | 15.8 | −1.512 | −1.417 | 95 |
Table 5.
Fitting results of the EIS data for the Mg-3Al-xMn alloys.
| Specimen | Rs /Ω·cm−2 | Cc /μF·cm−2 | Rc /Ω·cm−2 | CPE | Rct /Ω·cm−2 | L /H·cm−2 | Rdiff /Ω·cm−2 | |
|---|---|---|---|---|---|---|---|---|
| C /μF·cm−2 | n (0–1) | |||||||
| Mg-3Al | 4.81 | 6.62 | 12.75 | 3.05 | 1 | 21.34 | 14.46 | 78.9 |
| Mg-3Al-0.12Mn | 2.91 | 8.38 | 10.26 | 11.12 | 0.9123 | 37.03 | 26.42 | 86.4 |
| Mg-3Al-0.21Mn | 1.03 | 7.34 | 29.14 | 51.34 | 0.3518 | 53.95 | 58.68 | 255.4 |
| Mg-3Al-0.36Mn | 2.99 | 5.99 | 22.01 | 6.23 | 0.8646 | 95.21 | 49.58 | 279.5 |
| Mg-3Al-0.45Mn | 4.73 | 7.08 | 20.76 | 49.23 | 0.5554 | 106.54 | 58.09 | 341.9 |
© 2019 by the authors. Licensee MDPI, Basel, Switzerland. This article is an open access article distributed under the terms and conditions of the Creative Commons Attribution (CC BY) license (http://creativecommons.org/licenses/by/4.0/).
Share and Cite
MDPI and ACS Style
Yao, S.; Liu, S.; Zeng, G.; Li, X.; Lei, T.; Li, Y.; Du, Y. Effect of Manganese on Microstructure and Corrosion Behavior of the Mg-3Al Alloys. Metals 2019, 9, 460. https://doi.org/10.3390/met9040460
AMA Style
Yao S, Liu S, Zeng G, Li X, Lei T, Li Y, Du Y. Effect of Manganese on Microstructure and Corrosion Behavior of the Mg-3Al Alloys. Metals. 2019; 9(4):460. https://doi.org/10.3390/met9040460
Chicago/Turabian StyleYao, Sheng, Shuhong Liu, Guang Zeng, Xiaojing Li, Ting Lei, Yunping Li, and Yong Du. 2019. "Effect of Manganese on Microstructure and Corrosion Behavior of the Mg-3Al Alloys" Metals 9, no. 4: 460. https://doi.org/10.3390/met9040460
Note that from the first issue of 2016, this journal uses article numbers instead of page numbers. See further details here.