Microstructure and Mechanical Properties of a Fiber Welded Socket-Joint Made of Powder Metallurgy Molybdenum Alloy


1
School of Mechanical and Electrical Engineering, Xi’an University of Architecture and Technology, Xi’an 710055, China
2
School of Information Science and Engineering, East China University of Science and Technology, Shanghai 200237, China
3
State Key Laboratory of Mechanical Behavior for Materials, Xi’an JiaoTong University, Xi’ann 710049, China
*
Authors to whom correspondence should be addressed.
Metals 2019, 9(6), 640; https://doi.org/10.3390/met9060640
Submission received: 17 April 2019
/
Revised: 27 May 2019
/
Accepted: 30 May 2019
/
Published: 2 June 2019
(This article belongs to the Special Issue Laser Micromachining of Metals)
Abstract
:Fiber welding of socket-joints made of nanostructured high-performance molybdenum alloy (NS Mo) was carried out to get a better understanding of the role of welding heat input. It was found that low heat input (i.e., high welding speed) resulted in significantly refined grains in the fusion zone (FZ) of fiber laser welded NS Mo joints. When welding heat input decreased from 3600 J/cm (i.e., 1.2 kW, 20 cm/min) to 250 J/cm (i.e., 2.5 kW, 600 cm/min), the tensile strength of welded joints increased from about 250 MPa to about 570 MPa. It was confirmed by energy spectrum analysis that the higher the welding heat input, the higher the oxygen contents at the grain boundary (GB) within the FZ. In addition, the most important reason for poor strength of welded joints of Mo alloys was reported as being that MoO2 was segregated on the grain boundary. Therefore, it was concluded that welding under low heat input (i.e., high welding speed) was able to reduce the segregation degree of MoO2 at the grain boundary by refining grains and increasing the total area of GBs, thus improving the strength of welded joints and reducing the proportion of the intergranular fracture zone in tensile fractures.
1. Introduction
Molybdenum alloy has the advantages of a high fusion point, high heat conductivity and a low neutron absorption cross-section [1,2,3]. In order to delay the deterioration of that may lead to serious accidents and allow for more time to take emergency measures, the newly developed nanostructured molybdenum alloy (NS-Mo) has been selected as one of the candidate materials for the cladding tube in nuclear fuel. The NS Mo alloy developed by Liu et al. [4] is strengthened by nano-doping and has a strength of about 700 MPa and an elongation of about 40% at room temperature. The reliable welding technology of the NS Mo alloy is the premise of its wide application in various complex structures. Therefore, the weldability of this new type of molybdenum alloy has been widely studied in recent years [5,6,7,8,9,10].
Welding methods for Mo alloys include brazing [11,12], friction stir welding [13,14], electric resistance welding (ERW) [15,16], fusion welding [17,18,19], etc.
The service temperature of the joint fabricated by brazing is limited by the low melting point of brazing filler metal, which is not suitable for the service conditions of nuclear fuel rods at high temperature. Friction stir welding requires the workpiece to be rigid enough and cannot be used for small or thin-walled components, such as the cladding tube considered in this study. In addition, serious tool wear is also a challenge for the friction stir welding of refractory materials.
Because of its good high-temperature strength and low resistivity, weldability of Mo for ERW is poor. Molten metal expulsion and electrode sticking might happen in ERW of molybdenum alloys [15,16,20].
Fusion welding is a reliable and flexible method of joining metallic materials, while fusion welding of Mo alloys encounters cracks, porosity, and serious softening due to the excessive grain growth and impurities in the heated area [17,21,22,23]. It was reported that molybdenum titanium zirconium (TZM) alloy joint produced by using tungsten inert gas arc welding (GTAW) not only presented coarse columnar grains in the FZ, but also reduced joint strength remarkably, which took up about 40% of that of the base metal (BM) [17]. Kolarikova et al. [23] compared electron beam welding and GTAW welding of pure molybdenum powder metallurgy thin plates. The width of the FZ zone of the EBW joint and the GTAW joint were 0.8 mm and 1.7 mm respectively, while the width of the heat affected zone (HAZ) of the EBW joint and the GTAW joint were significantly different, which were 1.4 mm and 35 mm, respectively. Especially, the grain size of the FZ and HAZ areas in the EBW joint was much smaller than that of the GTAW joint. The results showed that a welding method with high energy density was more suitable for welding molybdenum than the GTAW method.
Laser welding not only has the advantages of high-power density and low-heat input, but also can be carried out in an open environment without vacuum chamber [24,25,26,27,28,29,30,31]. Therefore, laser welding of molybdenum alloy has been studied by many researchers [5,6,7,8,9,10,32]. However, welding of molybdenum alloys still faces many unsolved issues, especially those related to the newly developed molybdenum alloys. In this study, fiber welding of socket joints made of NS Mo alloys was performed with an emphasis on the influence of heat input. The NS Mo alloy end plugs and tubes were produced through powder metallurgy and multi-pass hot rolling. The weld geometry, microstructure, microhardness, strength and fracture morphology of the welded socket joints produced under different heat inputs were tested and compared.
2. Materials and Methods
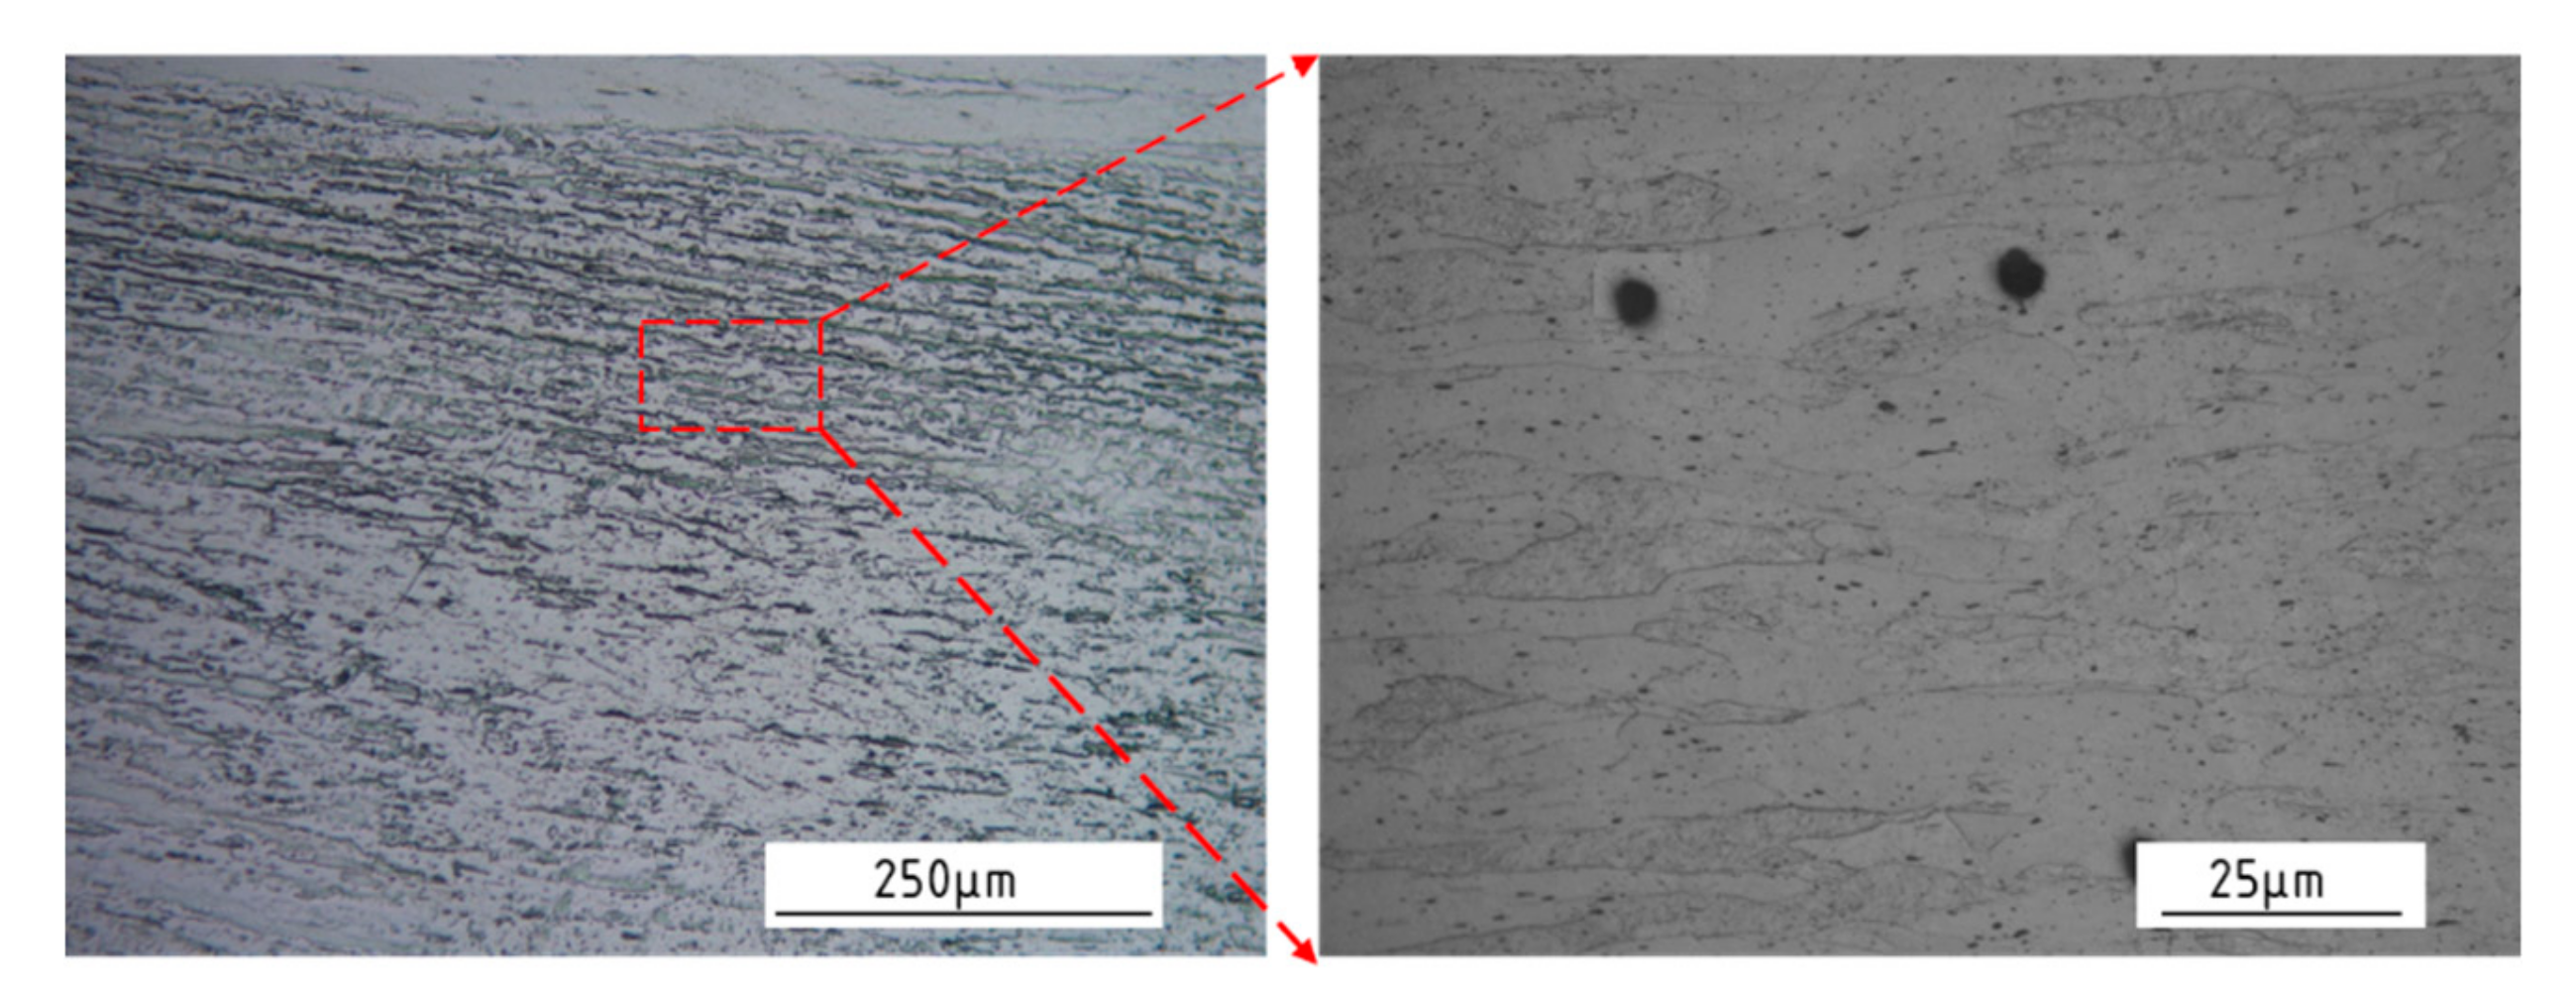
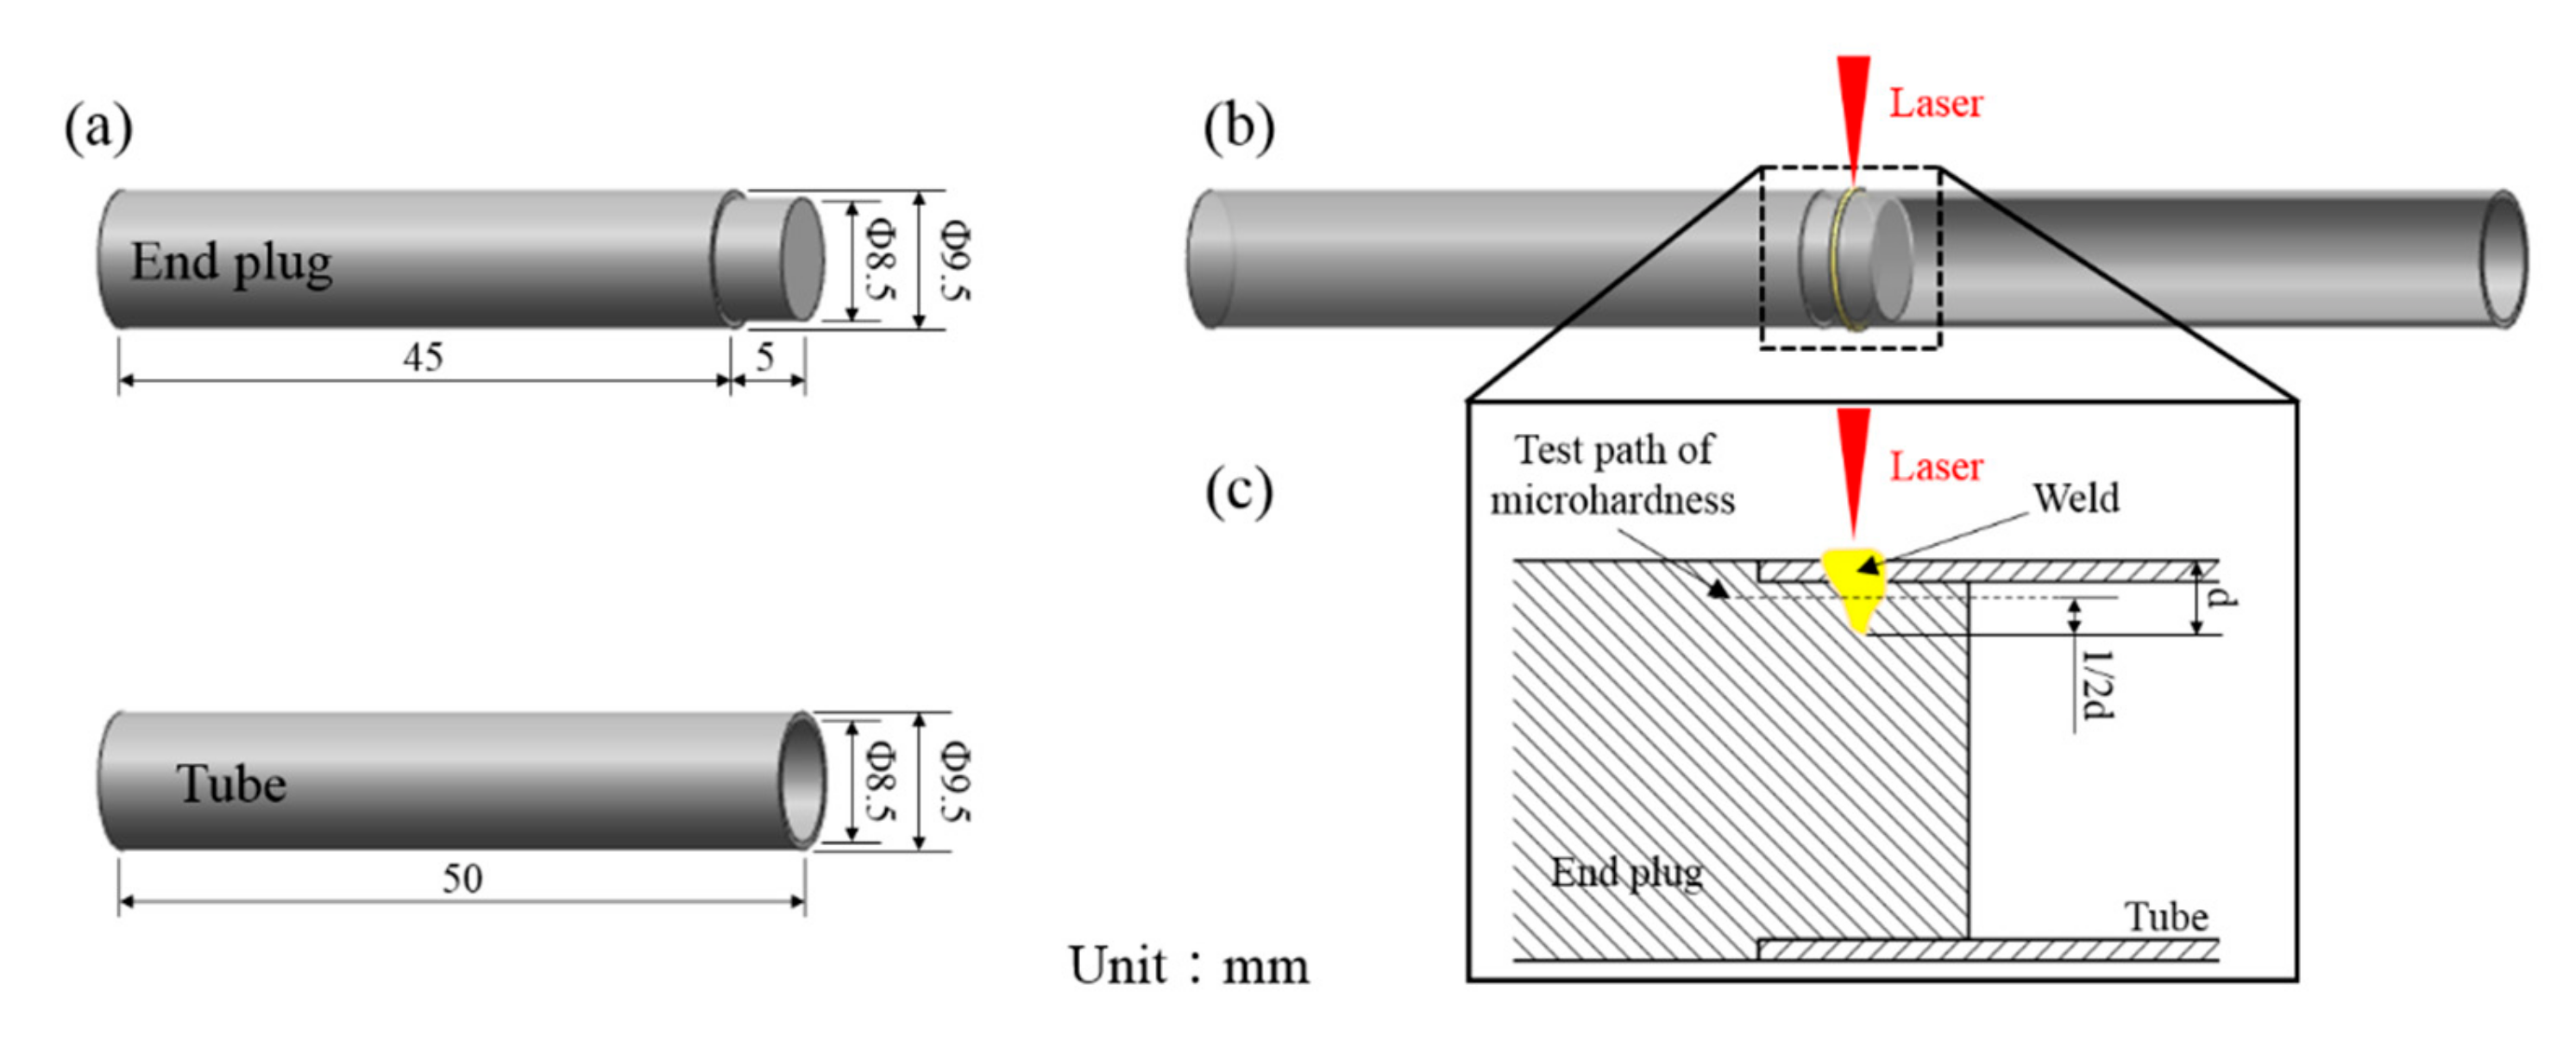
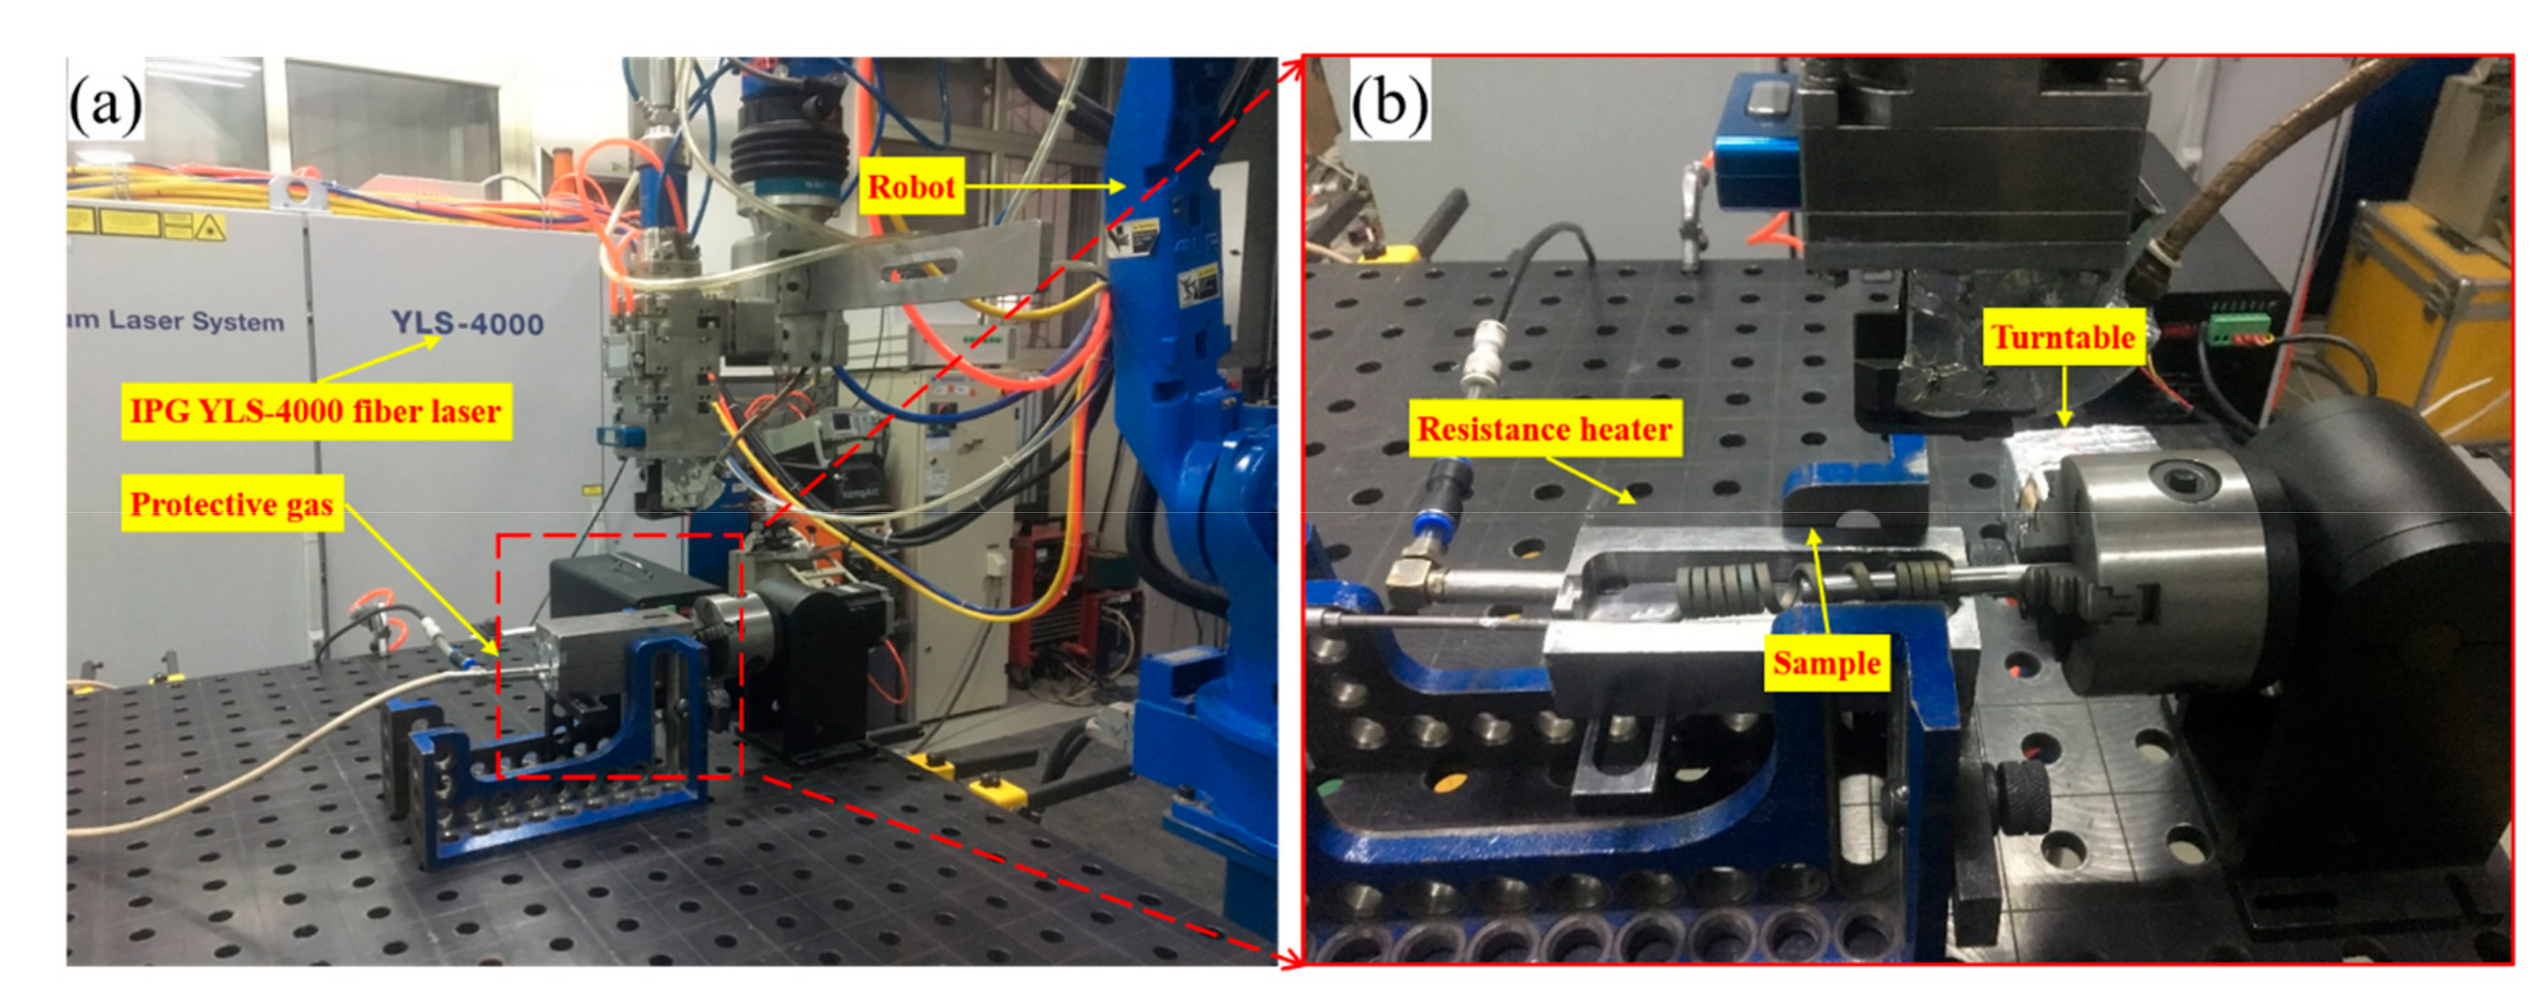
The tube and end plug were produced by powder metallurgy and hot rolling. The compactness of the NS Mo was about 99.6%. However, the tube was strengthened by the 0.5 wt.% La2O3 nanoparticles dispersed on the Mo matrix and its manufacturing process was more complex than end plugs, i.e., preformation and multiple rolling. Cross-sectional images of the microstructure of NS Mo alloy are shown in Figure 1, which presents fine grains with rolled morphology. Figure 2a shows the dimensions of the NS Mo end plug and tube. Before welding, the specimen was preheated to about 450 °C using a resistance wire as the heat source. The end plug and tube were assembled together by interference fit. The laser beam was focused on the lap zone of the end plug and tube during the welding process, as demonstrated in Figure 2b. The welding tests were conducted using an IPG YLS-4000 fiber laser continuous welding (CW) system (IPG, New York, NY, USA), as illustrated in Figure 3, with a maximum output of 4 kW, a central wave length of 1070 nm and a focal spot size of 0.2 mm in diameter. During welding, the workpiece was rotated while the position of laser head was left fixed. The focus was 1 mm above the workpiece surface. Preheating was conducted for the first laser pass. The real spot size on the workpiece surface was about 0.2 mm in diameter. The welding speed was the linear speed at the surface of the rotating workpiece. The heat input (HI) was the energy applied by the heat source to the unit length weld, which was greater than the actual absorbed energy per unit length of weld. Argon was taken as the shielding gas. Table 1 lists the welding parameters employed in this study.
After welding, the cross-sectional metallographic specimens of the welded joints were prepared using a standard metallographic method, etched with an etchant consisting of 10 mL of HF, 10 mL of HNO3, and 30 mL of H2O, and then observed under a Nikon Eclipse MA200 (Nikon, Tokyo, Japan). The EDS analysis on the chemical composition of the FZ was performed on a FESEM-SU6600 scanning electron microscope (SEM, HITACHI, Tokyo, Japan). The average size and shape coefficient of grains in the FZ were calculated using Image pro plus 6.0. Subsequently, the microhardness distribution on the cross-section of the welded joint was measured using a MH-5 micro-Vickers hardness tester (Everone, Shanghai, China) under a load of 100 gf and a holding time of 30 s. The measurement path over the sample is indicated in Figure 2c. Finally, a tensile test was carried out using a CSS-88100 electronic testing machine (INSTRON, Shanghai, China) with the tensile rate of 0.5 mm/min. The morphology of the tensile fracture of the welded joints was observed using SEM. The size of the weld was measured under a VMS-3020 optical image measuring instrument (WANHAO, Suzhou, China) with an accuracy of 0.01 mm.
3. Results and Discussion
At the beginning of this section, it is necessary to note that the welding speed for the low heat input was thirty times that for high heat input, while the laser power for the low heat input was just two times that for the high heat input. Therefore, the heat input was essentially controlled by the welding speed.
3.1. Surface Morphology of Weld Seams
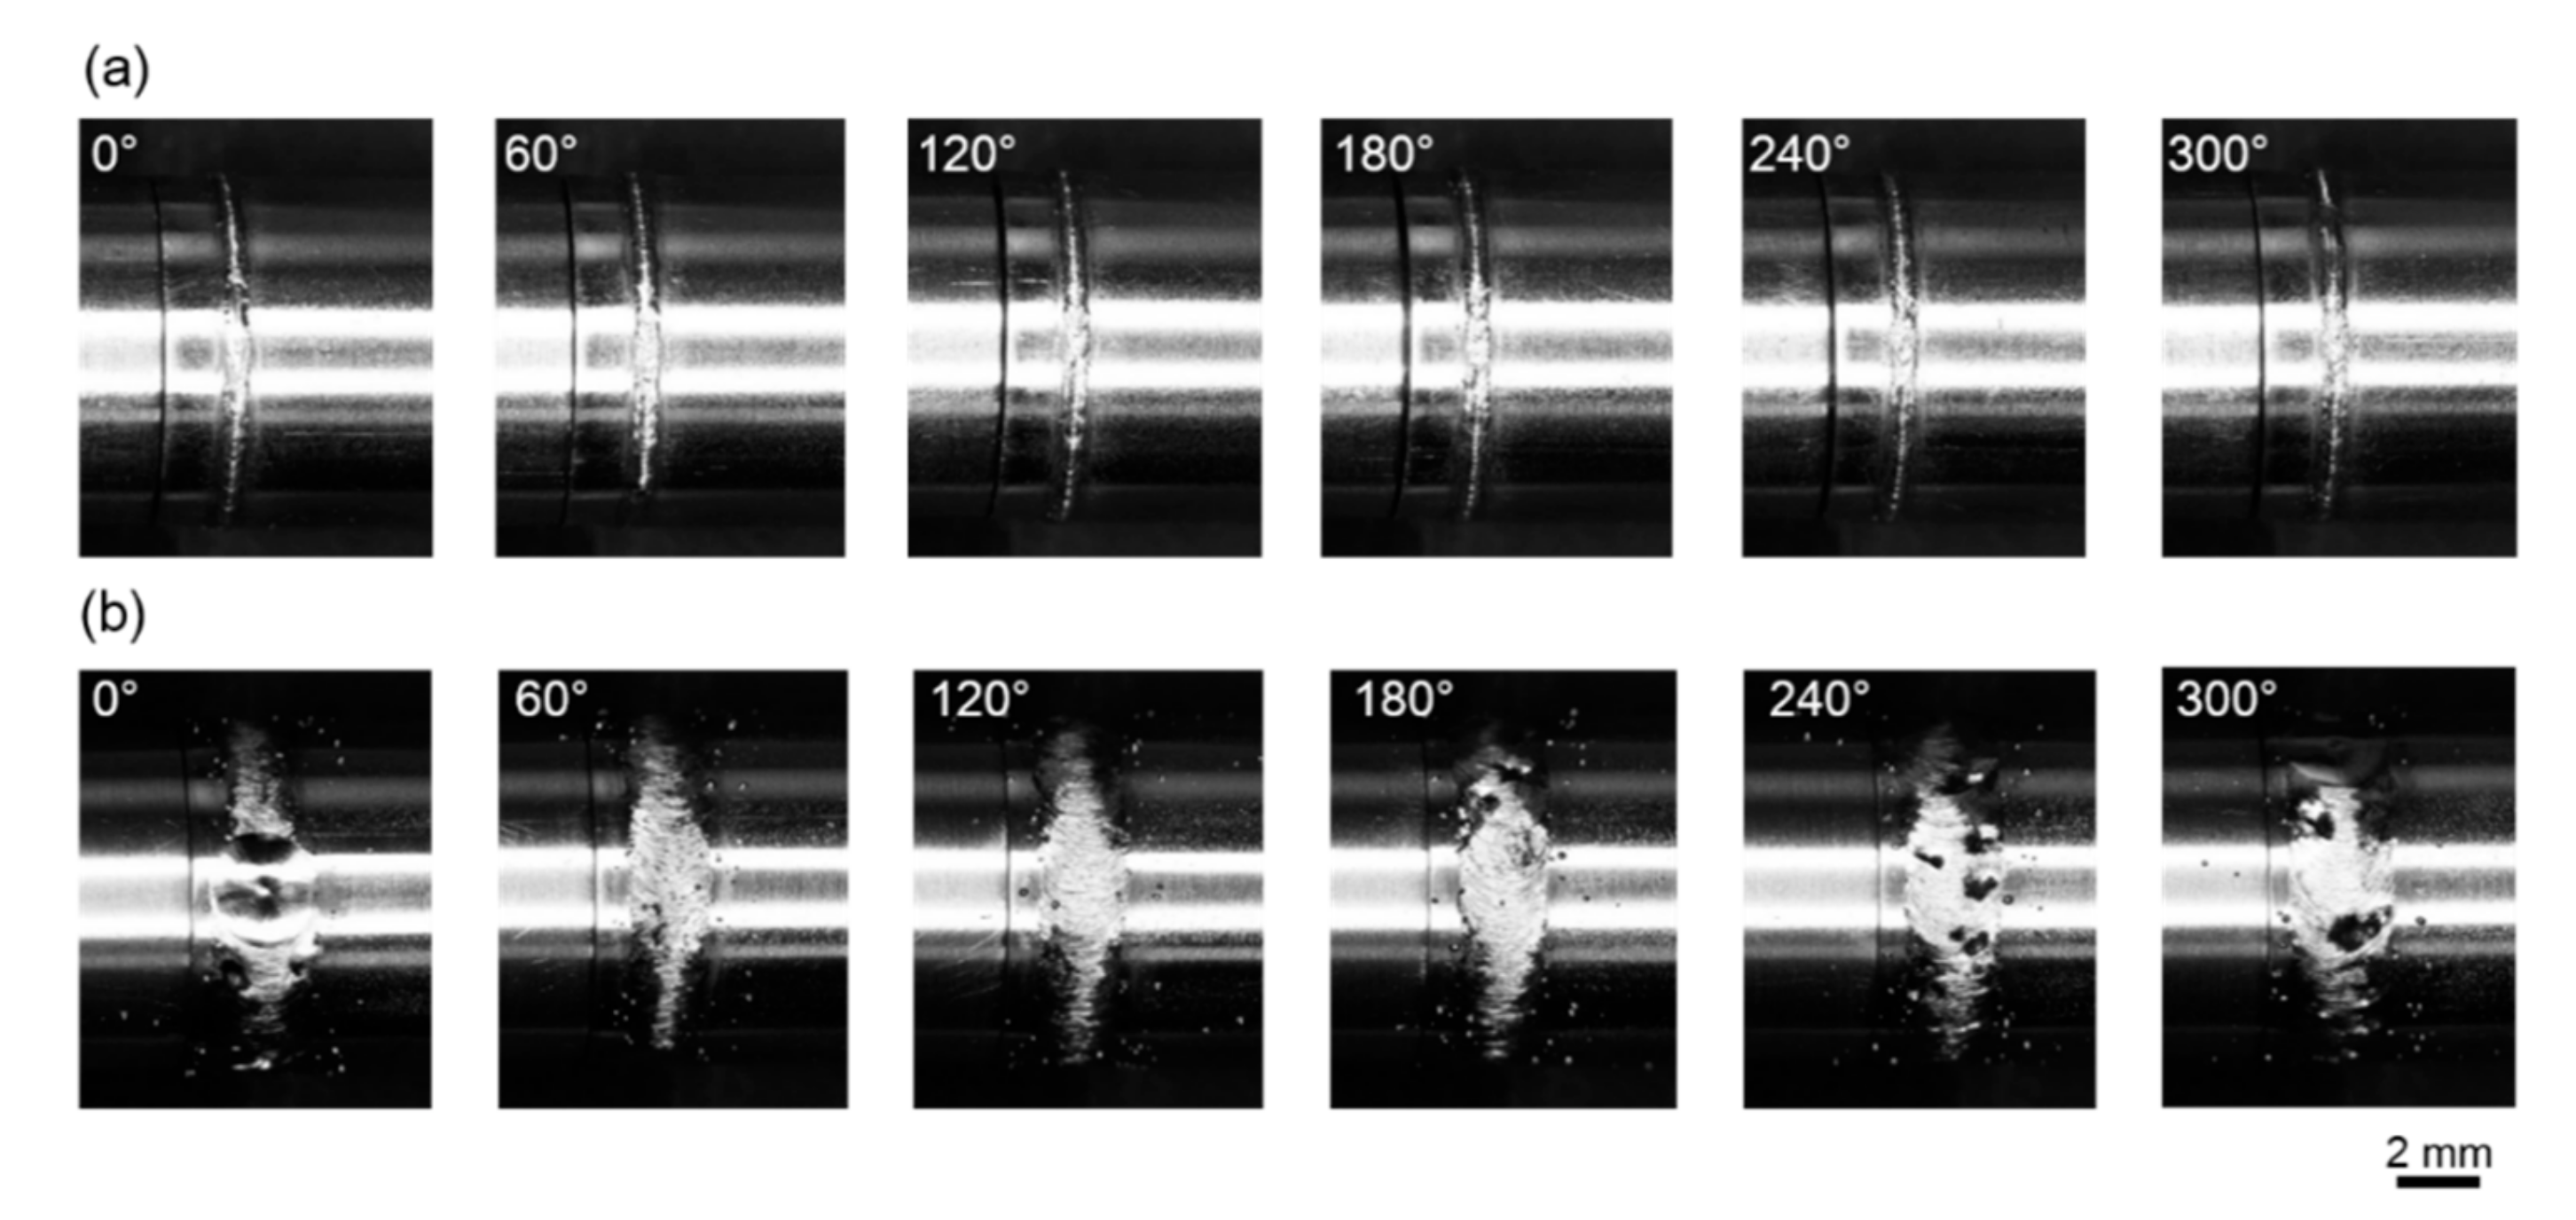
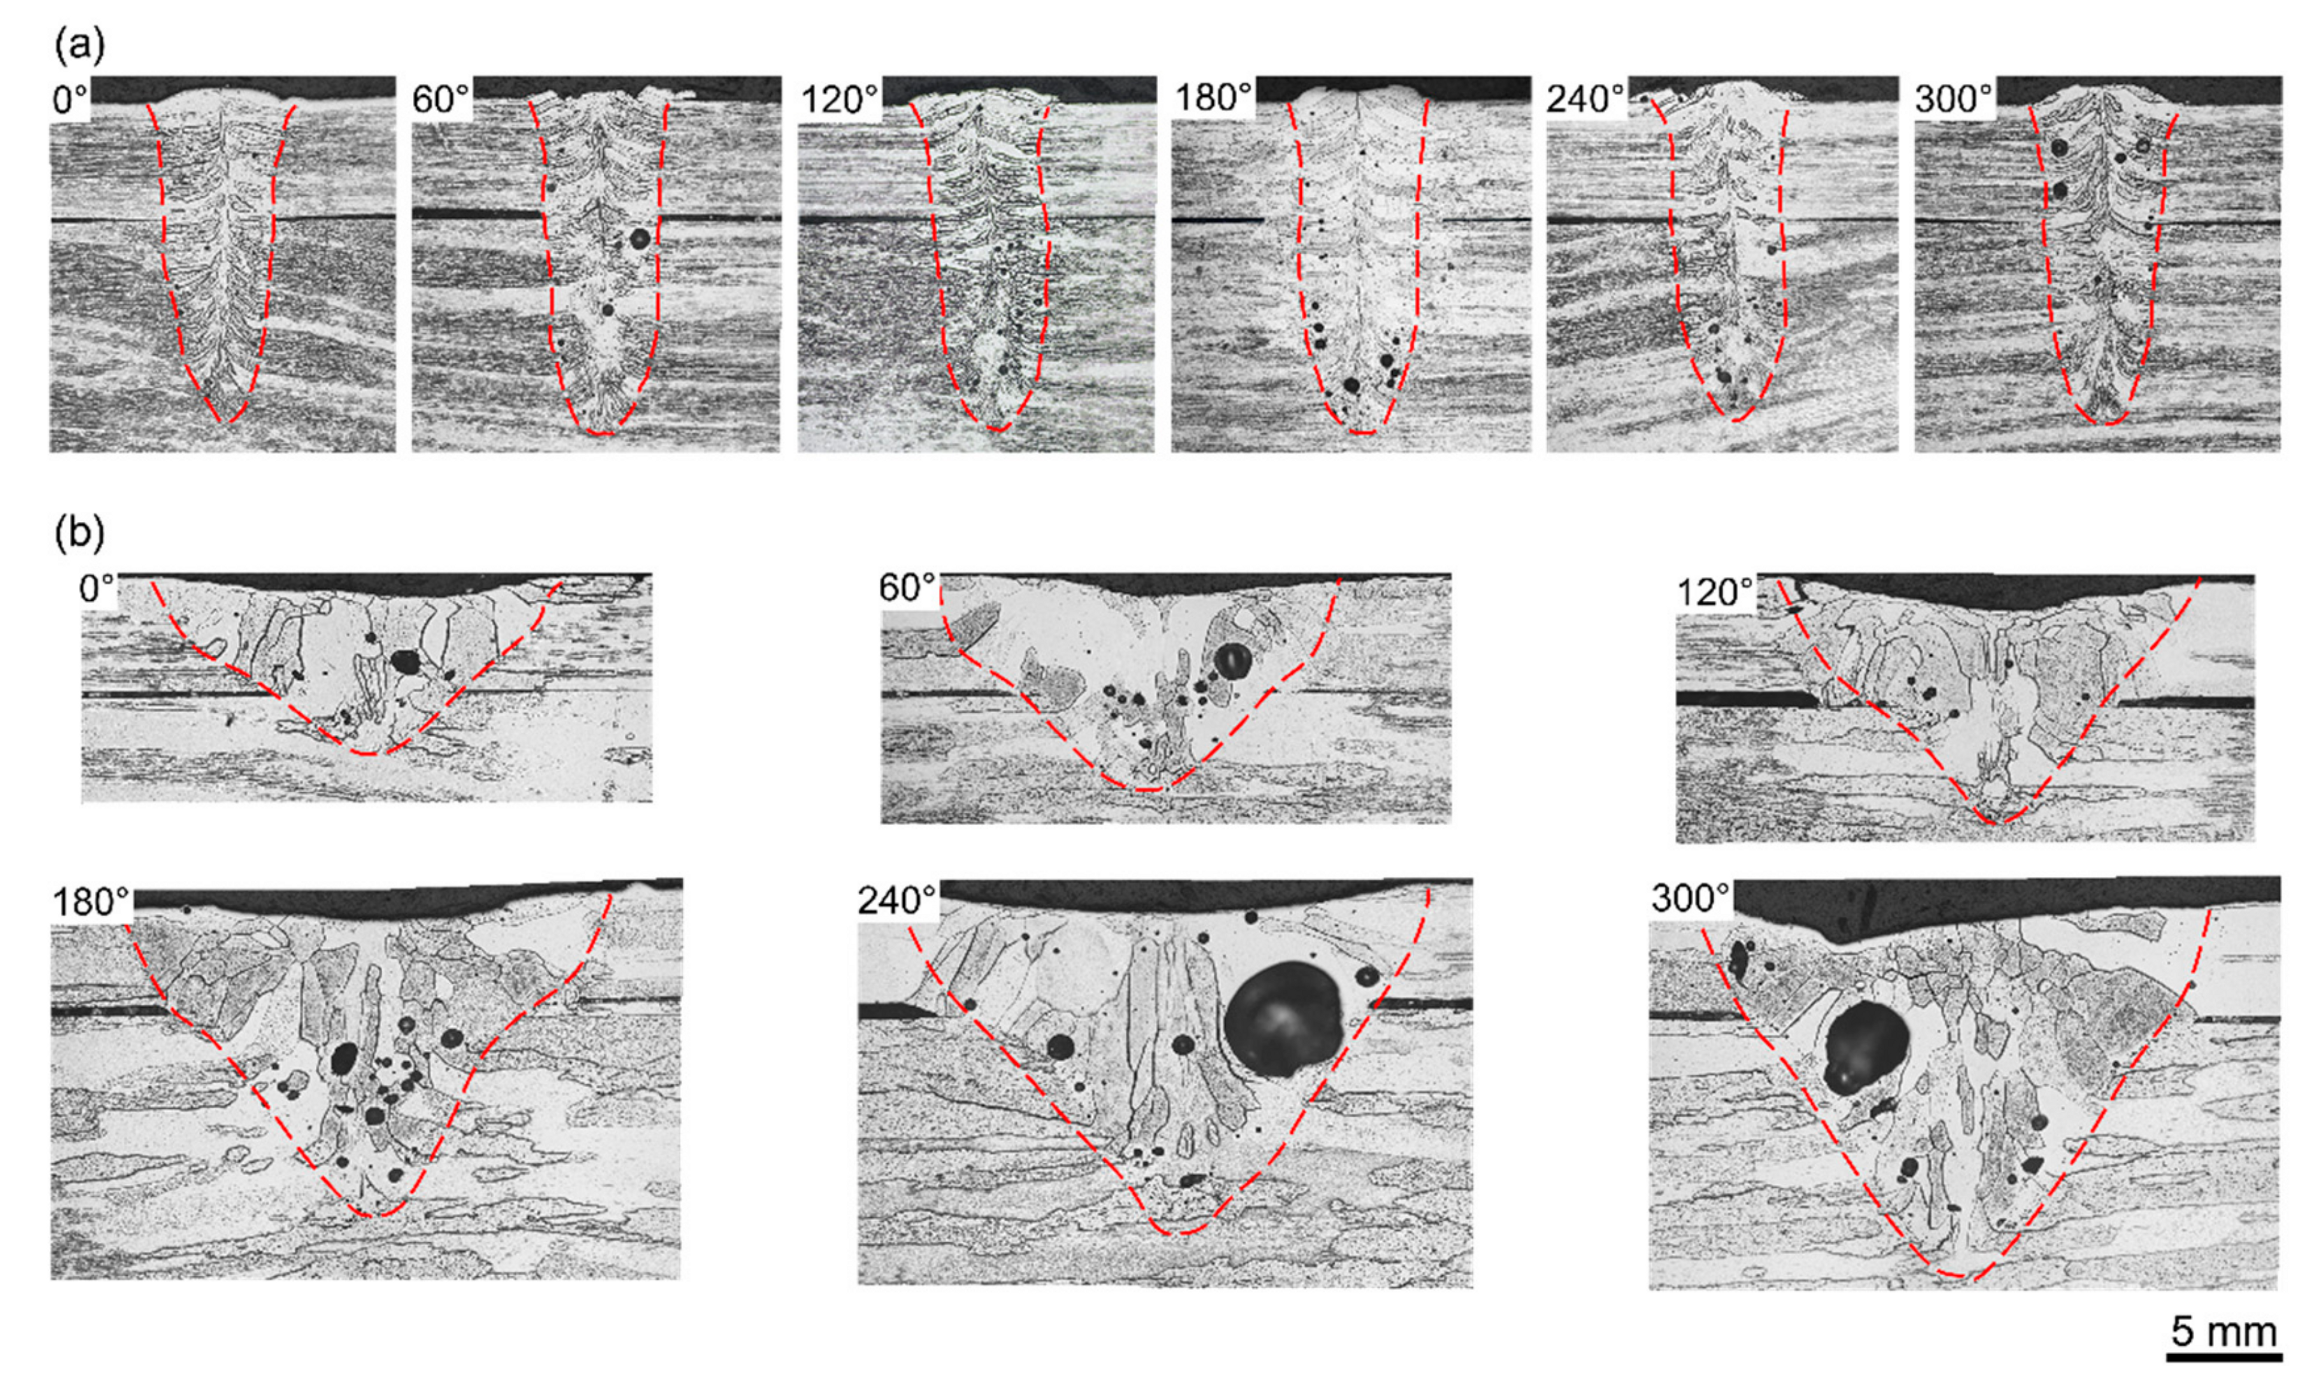
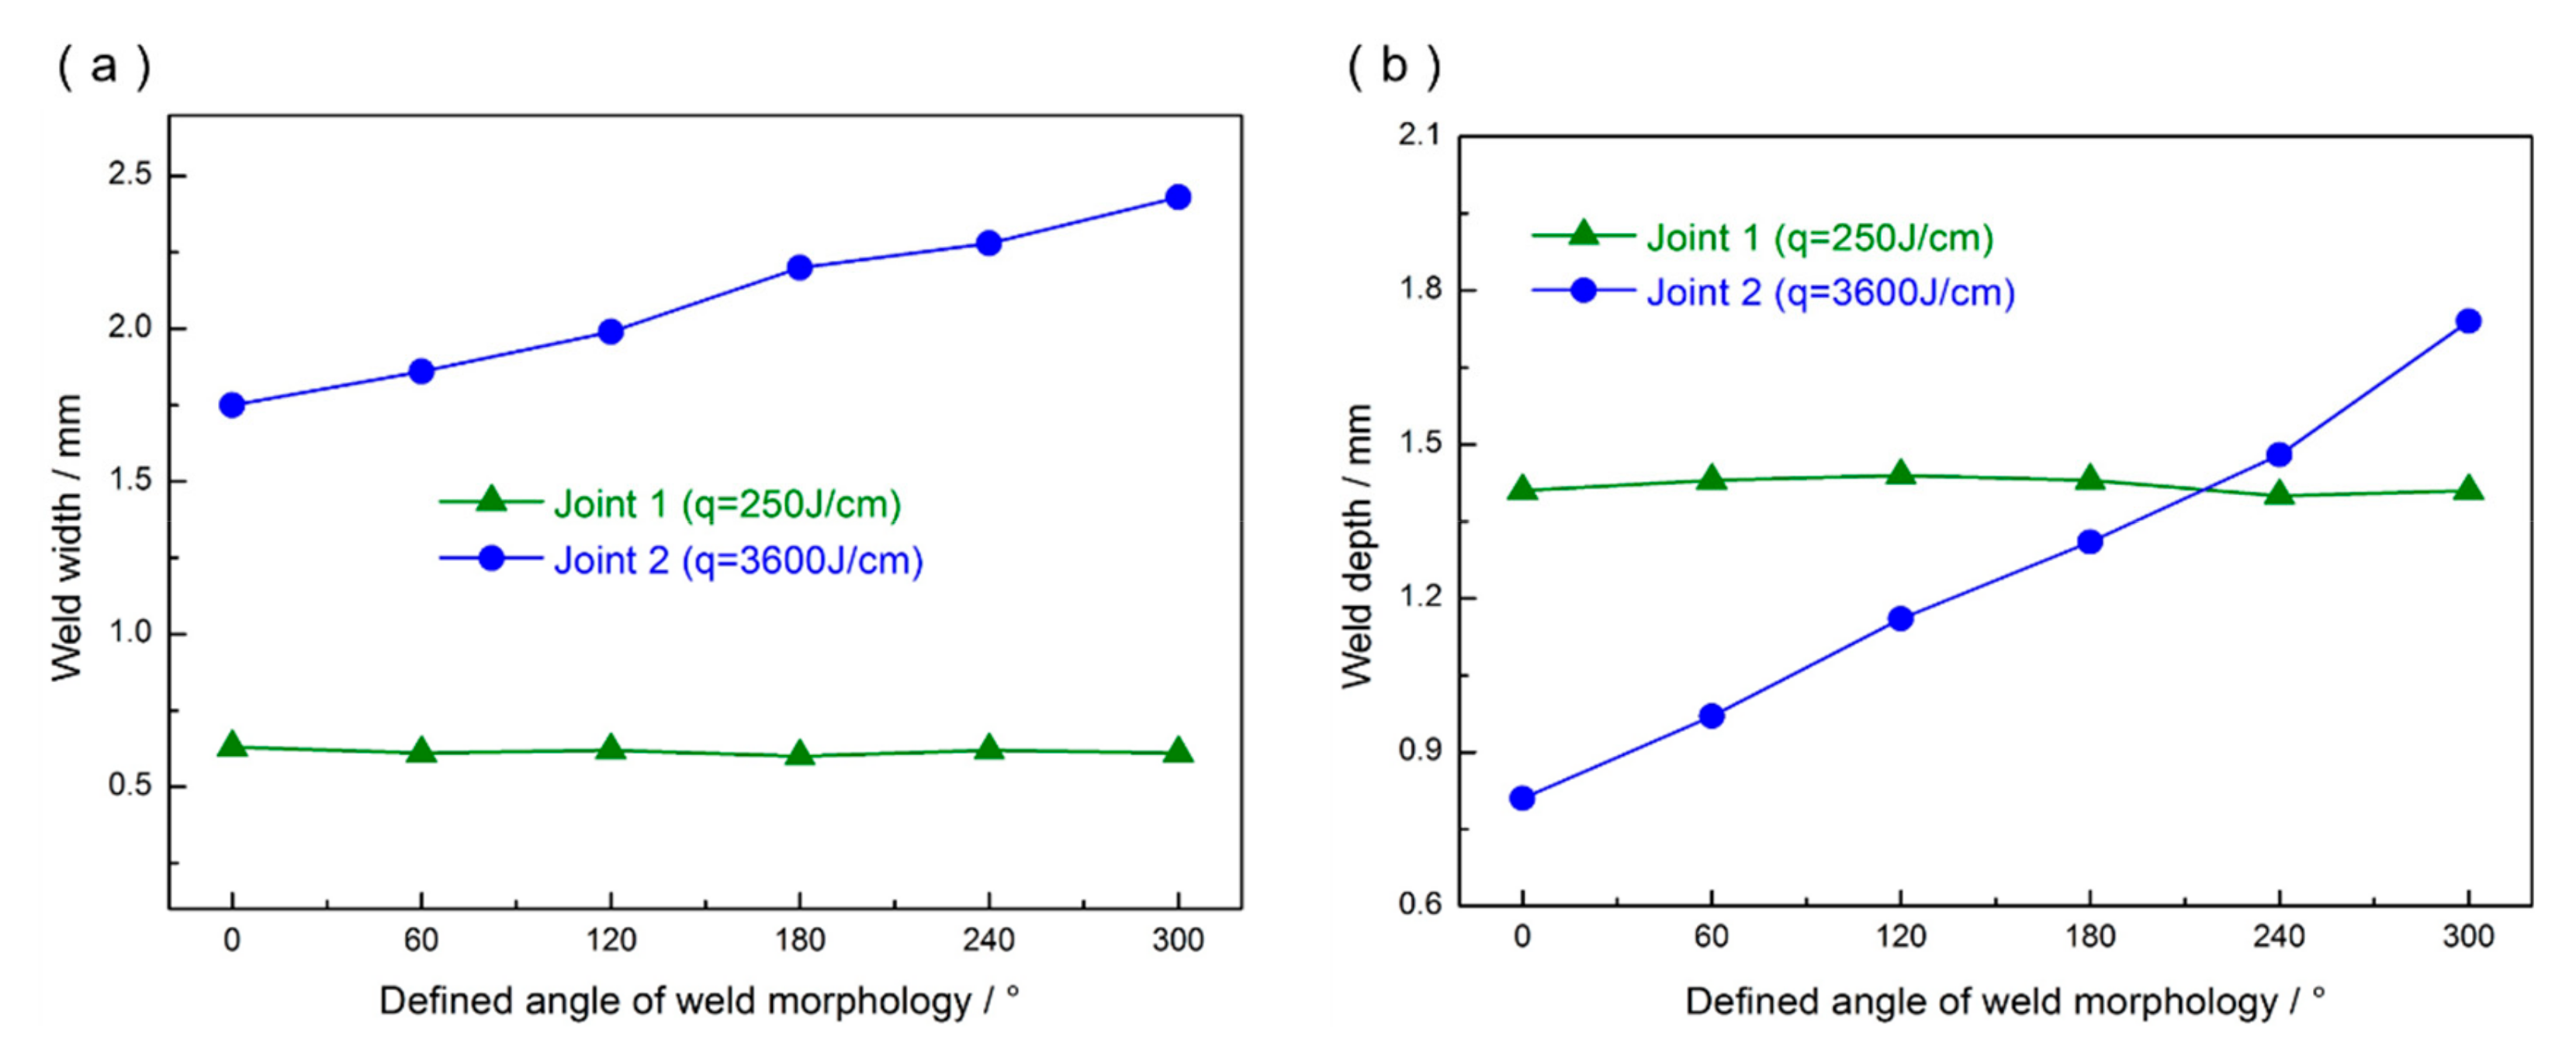
As shown in Figure 4, for the description, the circumference of the socket joint was divided into six parts. Here, the position of 0° indicates the welding start position and the welding direction is indicated by the curved red arrow in Figure 4a. Welding tests were conducted following the parameters given in Table 1 and the surface morphologies of the socket joints achieved under these welding conditions are presented in Figure 5. Figure 6a,b shows cross-sections of Joint 1 and Joint 2, respectively. The width and depth of the welded seams are shown in Figure 7a,b, respectively.
According to Figure 5, regular and smooth surface morphology was achieved under low heat input (i.e., 250 J/cm), while a lot of spattering was found when high heat input (i.e., 3600 J/cm) was adopted. It can be found from Figure 7 that widths and depths of the fusion zone of joint 1 kept almost uniform over the whole circumference, while those of the fusion of joint 2 increased gradually along the welding direction.
During the welding of joint 2, due to the low welding speed (i.e., 0.2 m/min) and the high thermal conductivity of Mo alloy, the regions in front of the weld pool were preheated and the heat accumulation effect were strengthened gradually as the welding process continued, resulting in the gradually increase of weld width and weld depth in joint 2. In contrast, joint 1 was welded at a higher speed (i.e., 6 m/min) within a short time of about 0.29 s, leading to both the width and depth of the weld seam being almost constant along the welding direction.
3.2. Microstructure Observations
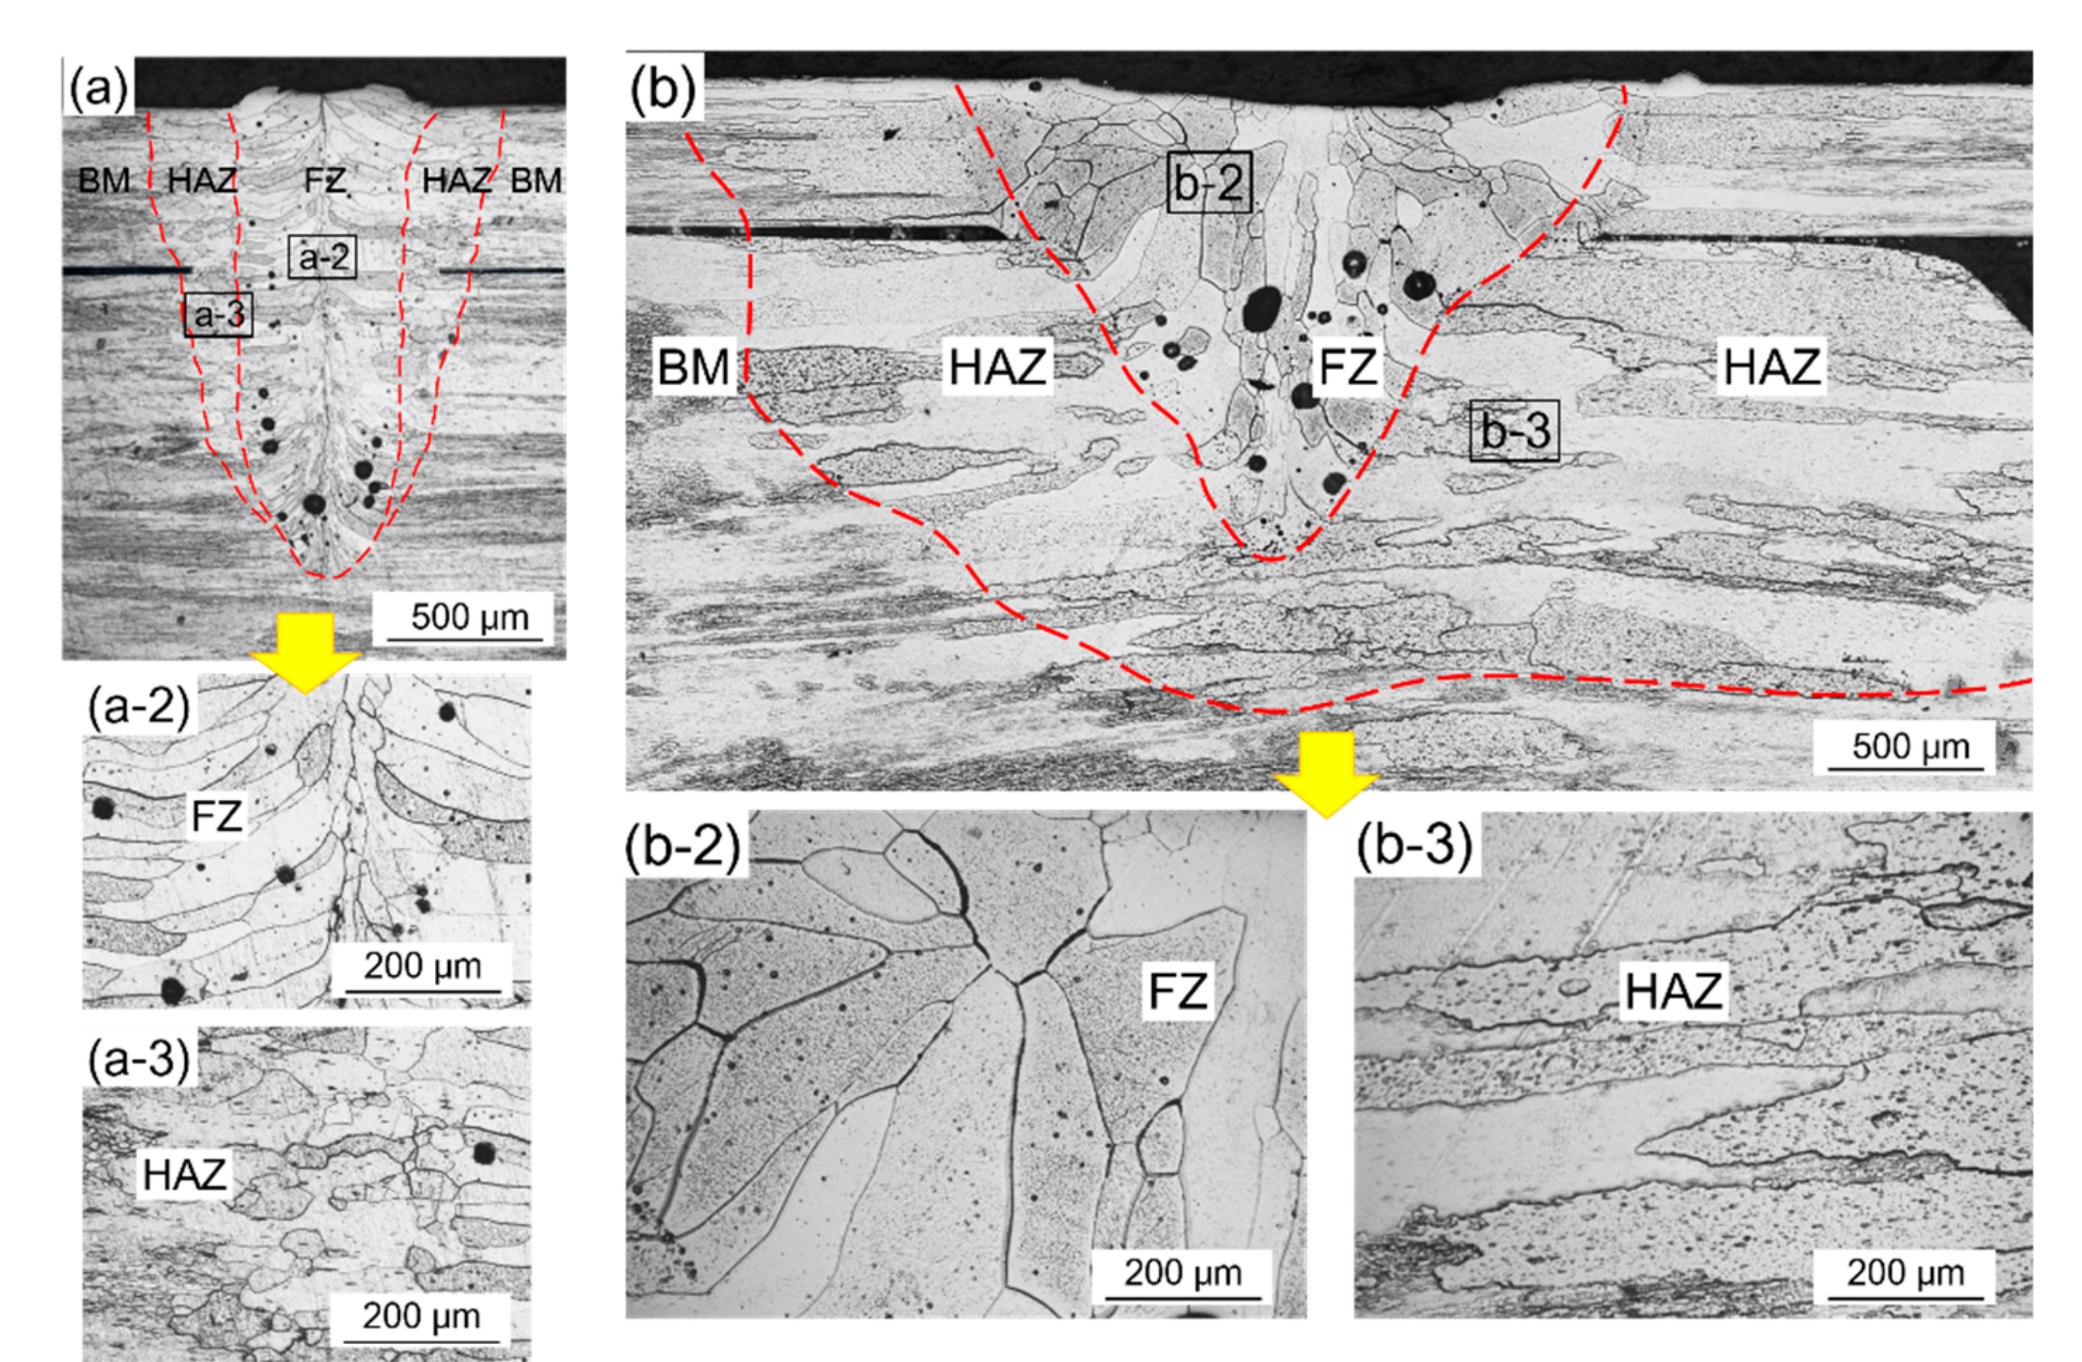
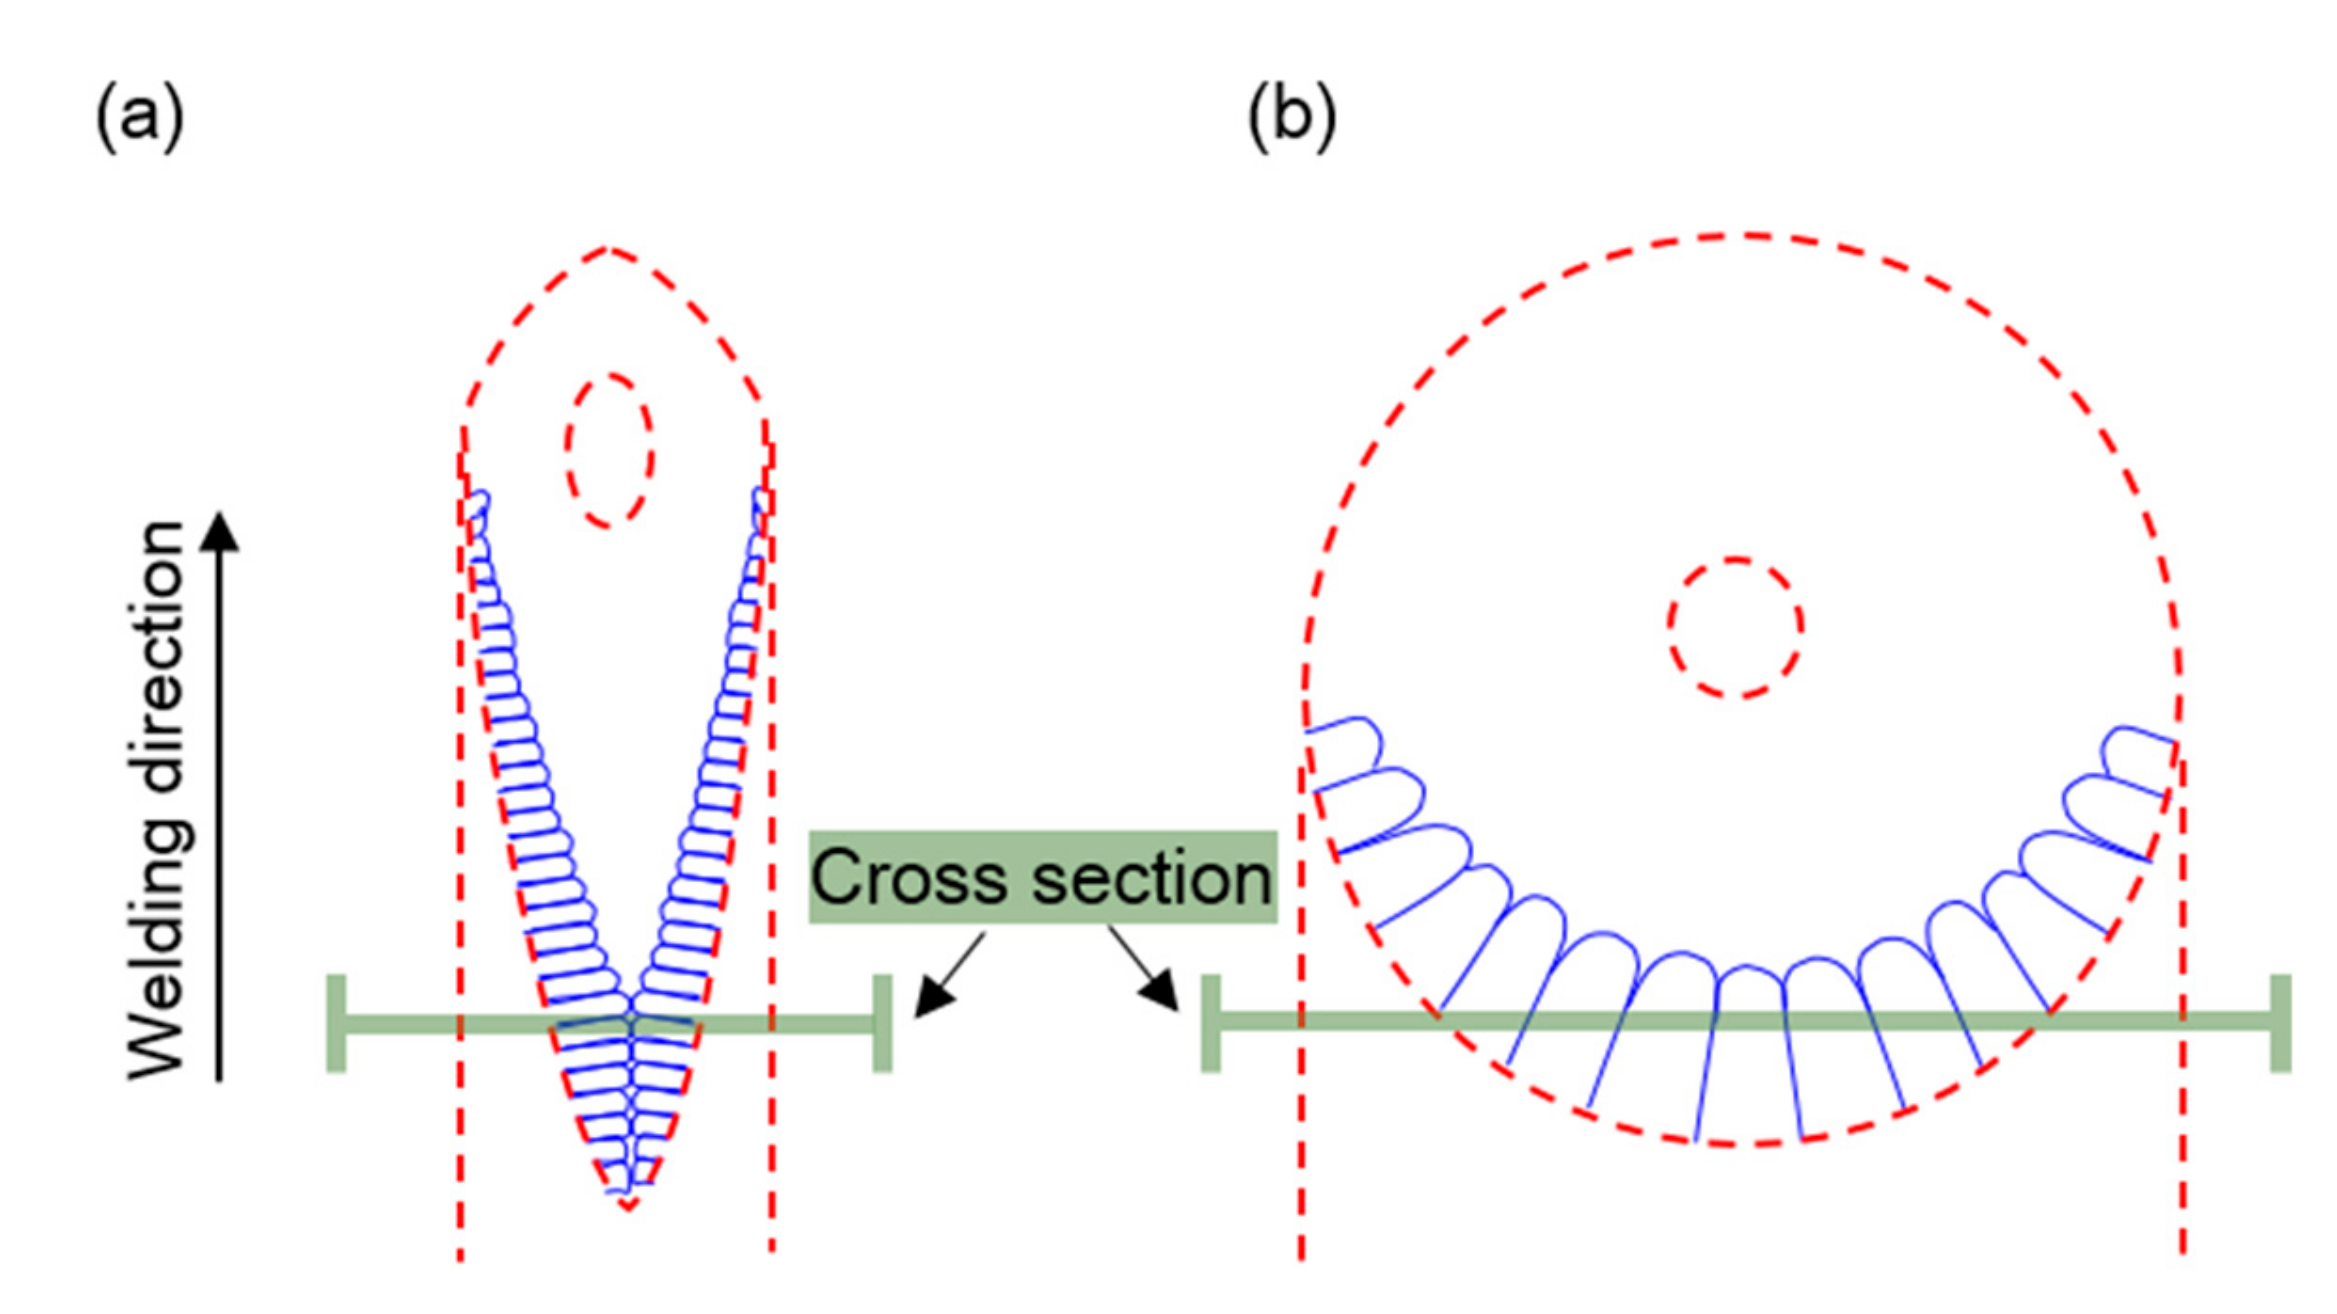
Figure 8 shows the cross-sectional morphologies of joints 1 and 2 at the 180° position. The linear intercept method was used to determine the average grain size of FZ in both joints and the results are listed in Table 2. It can be found that the FZ of joint 1 mainly consisted of slender columnar grains with an average grain size of about 42 μm, while the HAZ of joint 1 contained recrystallized equiaxed crystals. Moreover, the FZ of joint 2 presented a mixed morphology of coarse columnar crystals and coarse equiaxed crystals, of which the average grain size was about 131 μm. The HAZ in joint 2 appeared as significantly coarse recrystallization microstructures. Additionally, due to the asymmetry of cooling conditions, the width of the HAZ at the left side (i.e., end plug side) of the FZ in joint 2 was less than that at the right side (i.e., tube side) of the FZ. Actually, the equiaxed crystals morphology observed in the FZs of joints 1 and 2 were more likely to be the cross-section of some curved columnar crystals [33,34,35,36], which could be explained with the aid of Figure 9. Since those columnar crystals grew along the direction with maximum temperature gradient (i.e., perpendicular to the rear edge of molten pool), the columnar crystals in the FZ of joint 2 could develop along the welding direction, owing to the large curvature profile of the rear edge of the molten pool resulting from low welding speed. Joint 1 was produce under a high welding speed, thus the molten pool was prolonged which caused columnar grains growing along the horizontal direction.
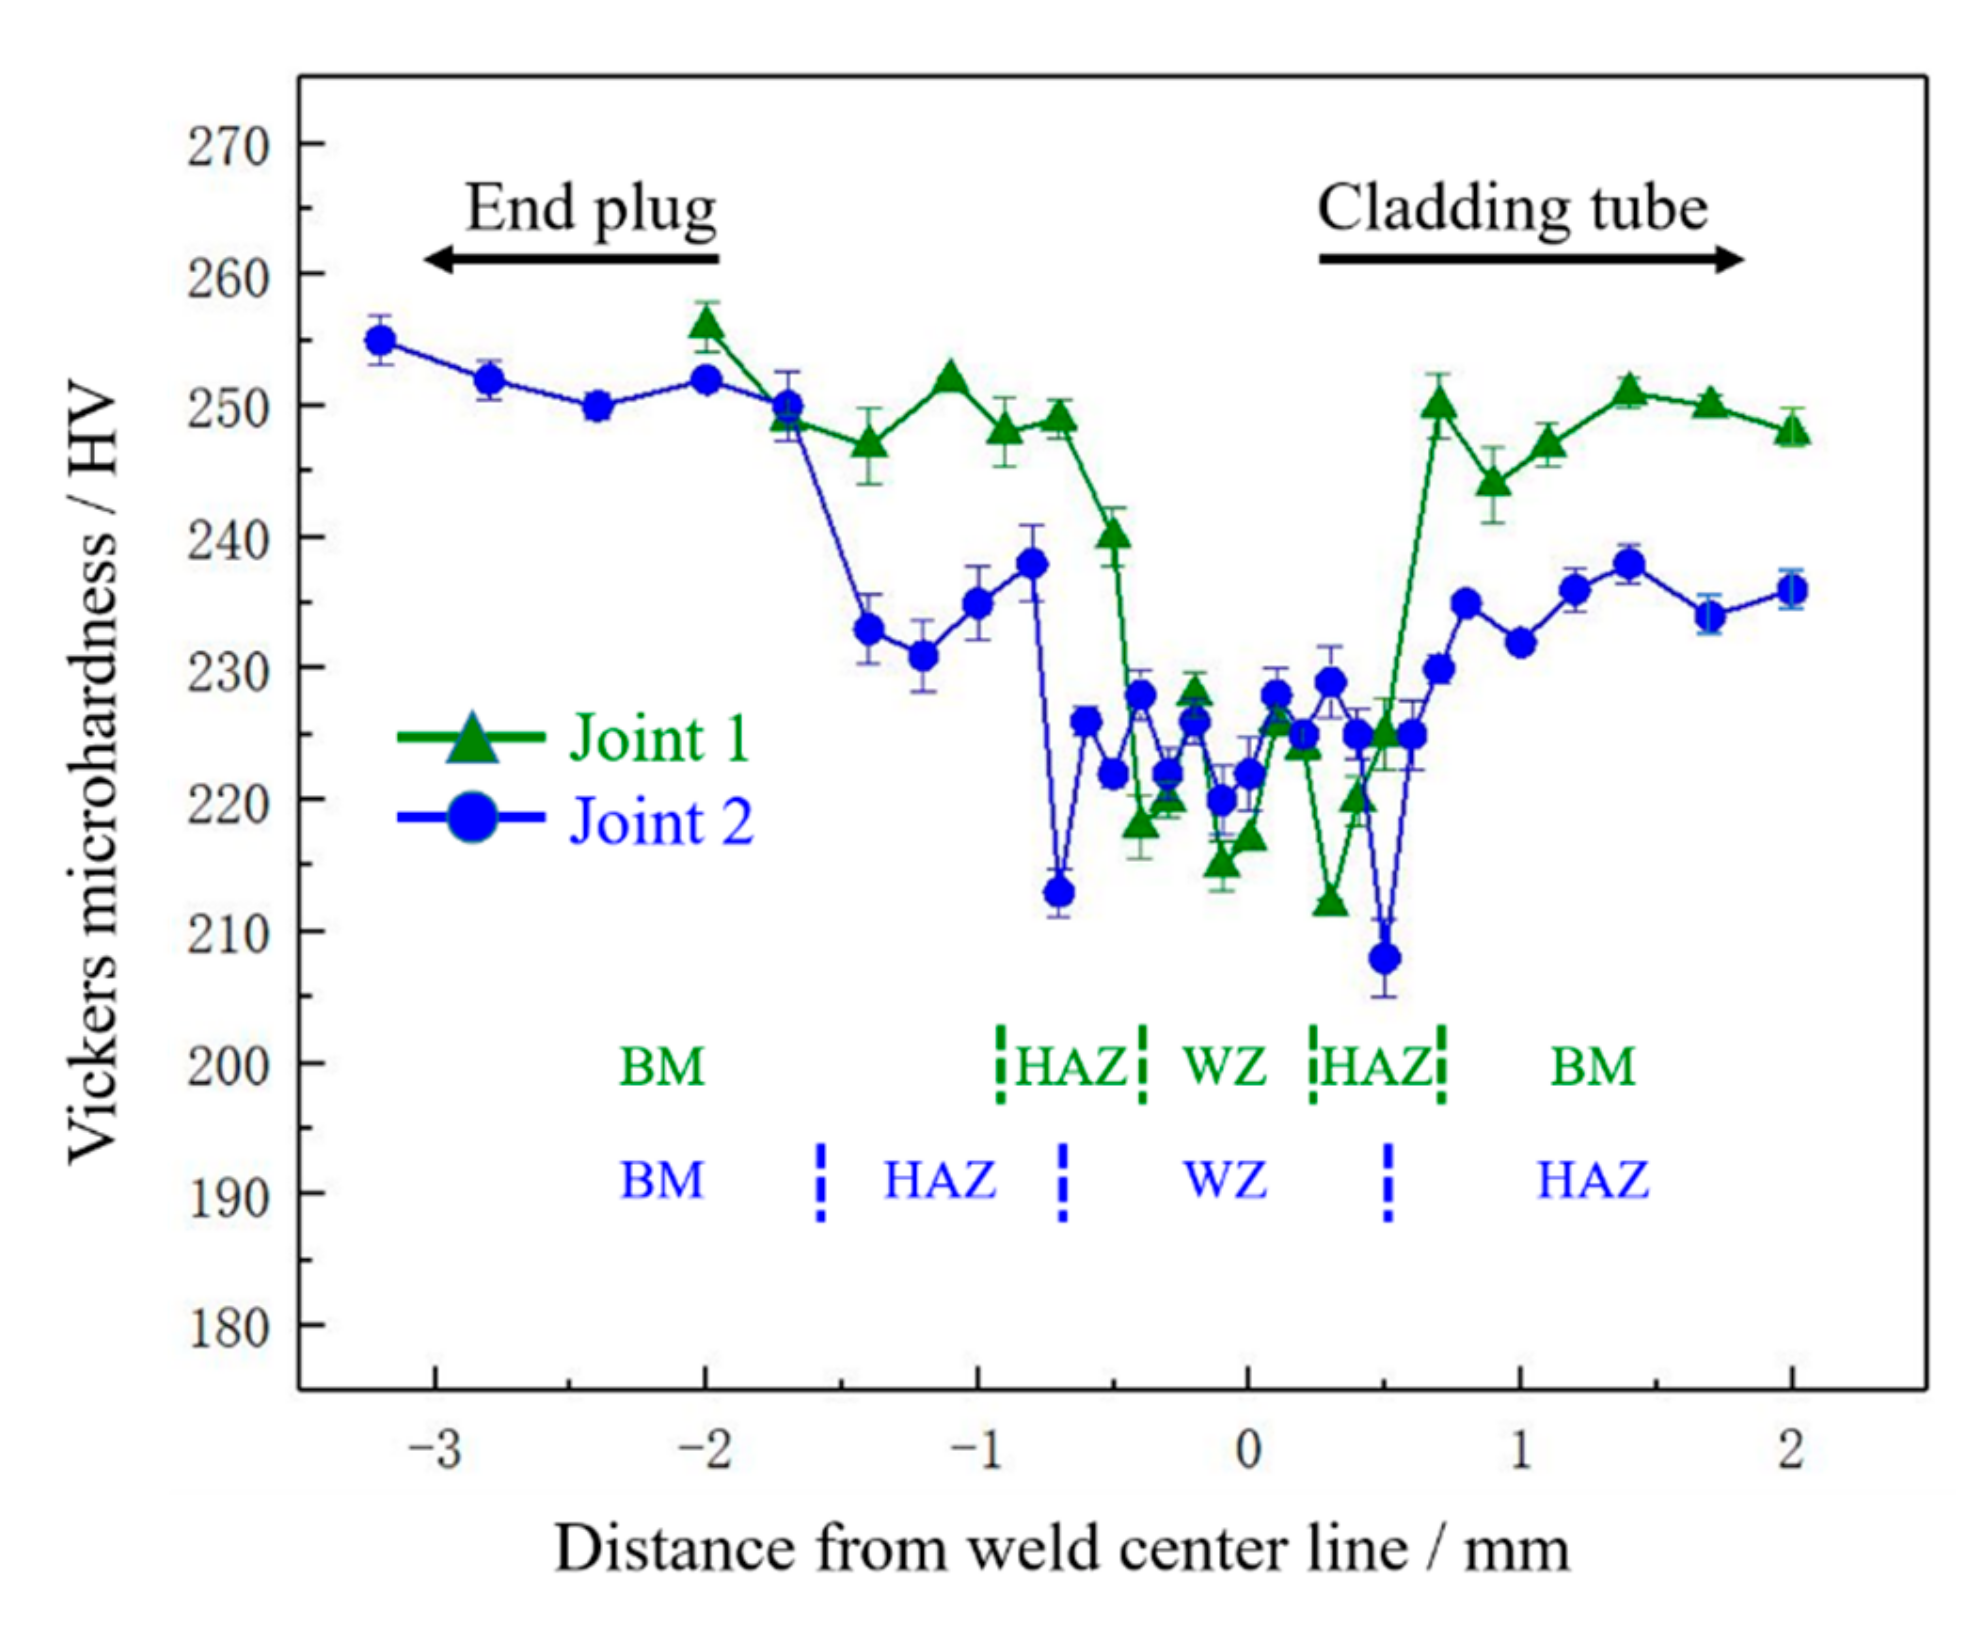
3.3. Microhardness Measurements
The microhardness distributions on the cross-sections at 180° were tested along the paths indicated in Figure 2c, and the results were presented in Figure 10. From Figure 10, it can be found that the microhardness of the BM was 250~260 HV, the heated zones of both joints 1 and 2 were softened and the minimum hardness on the cross-sections of these joints always appeared at the FZ-HAZ interface. The results also indicated that the width of the softened zone of joint 1 was greatly less than that of joint 2, while the minimum hardness of the former was slightly higher than that of the latter. For NS Mo base metal, a special liquid liquid mixing preparation method was employed to realize the dispersed distribution of nano-sized La2O3 particles, resulting in favorable mechanical performance. Owing to the melting point of La2O3 (i.e., 2207°C) [4] being lower than that of Mo (i.e., 2622 °C, La2O3 particles in the FZ will decompound during the laser welding process. Thus, the microhardness of the FZ was significantly decreased and lower than those of the HAZ and BM. The NS Mo BM considered in this work is also a type of work-hardened material. Therefore, softening of the HAZ in the welded joints might be largely due to the decreased number of dislocations after the welding thermal cycle.
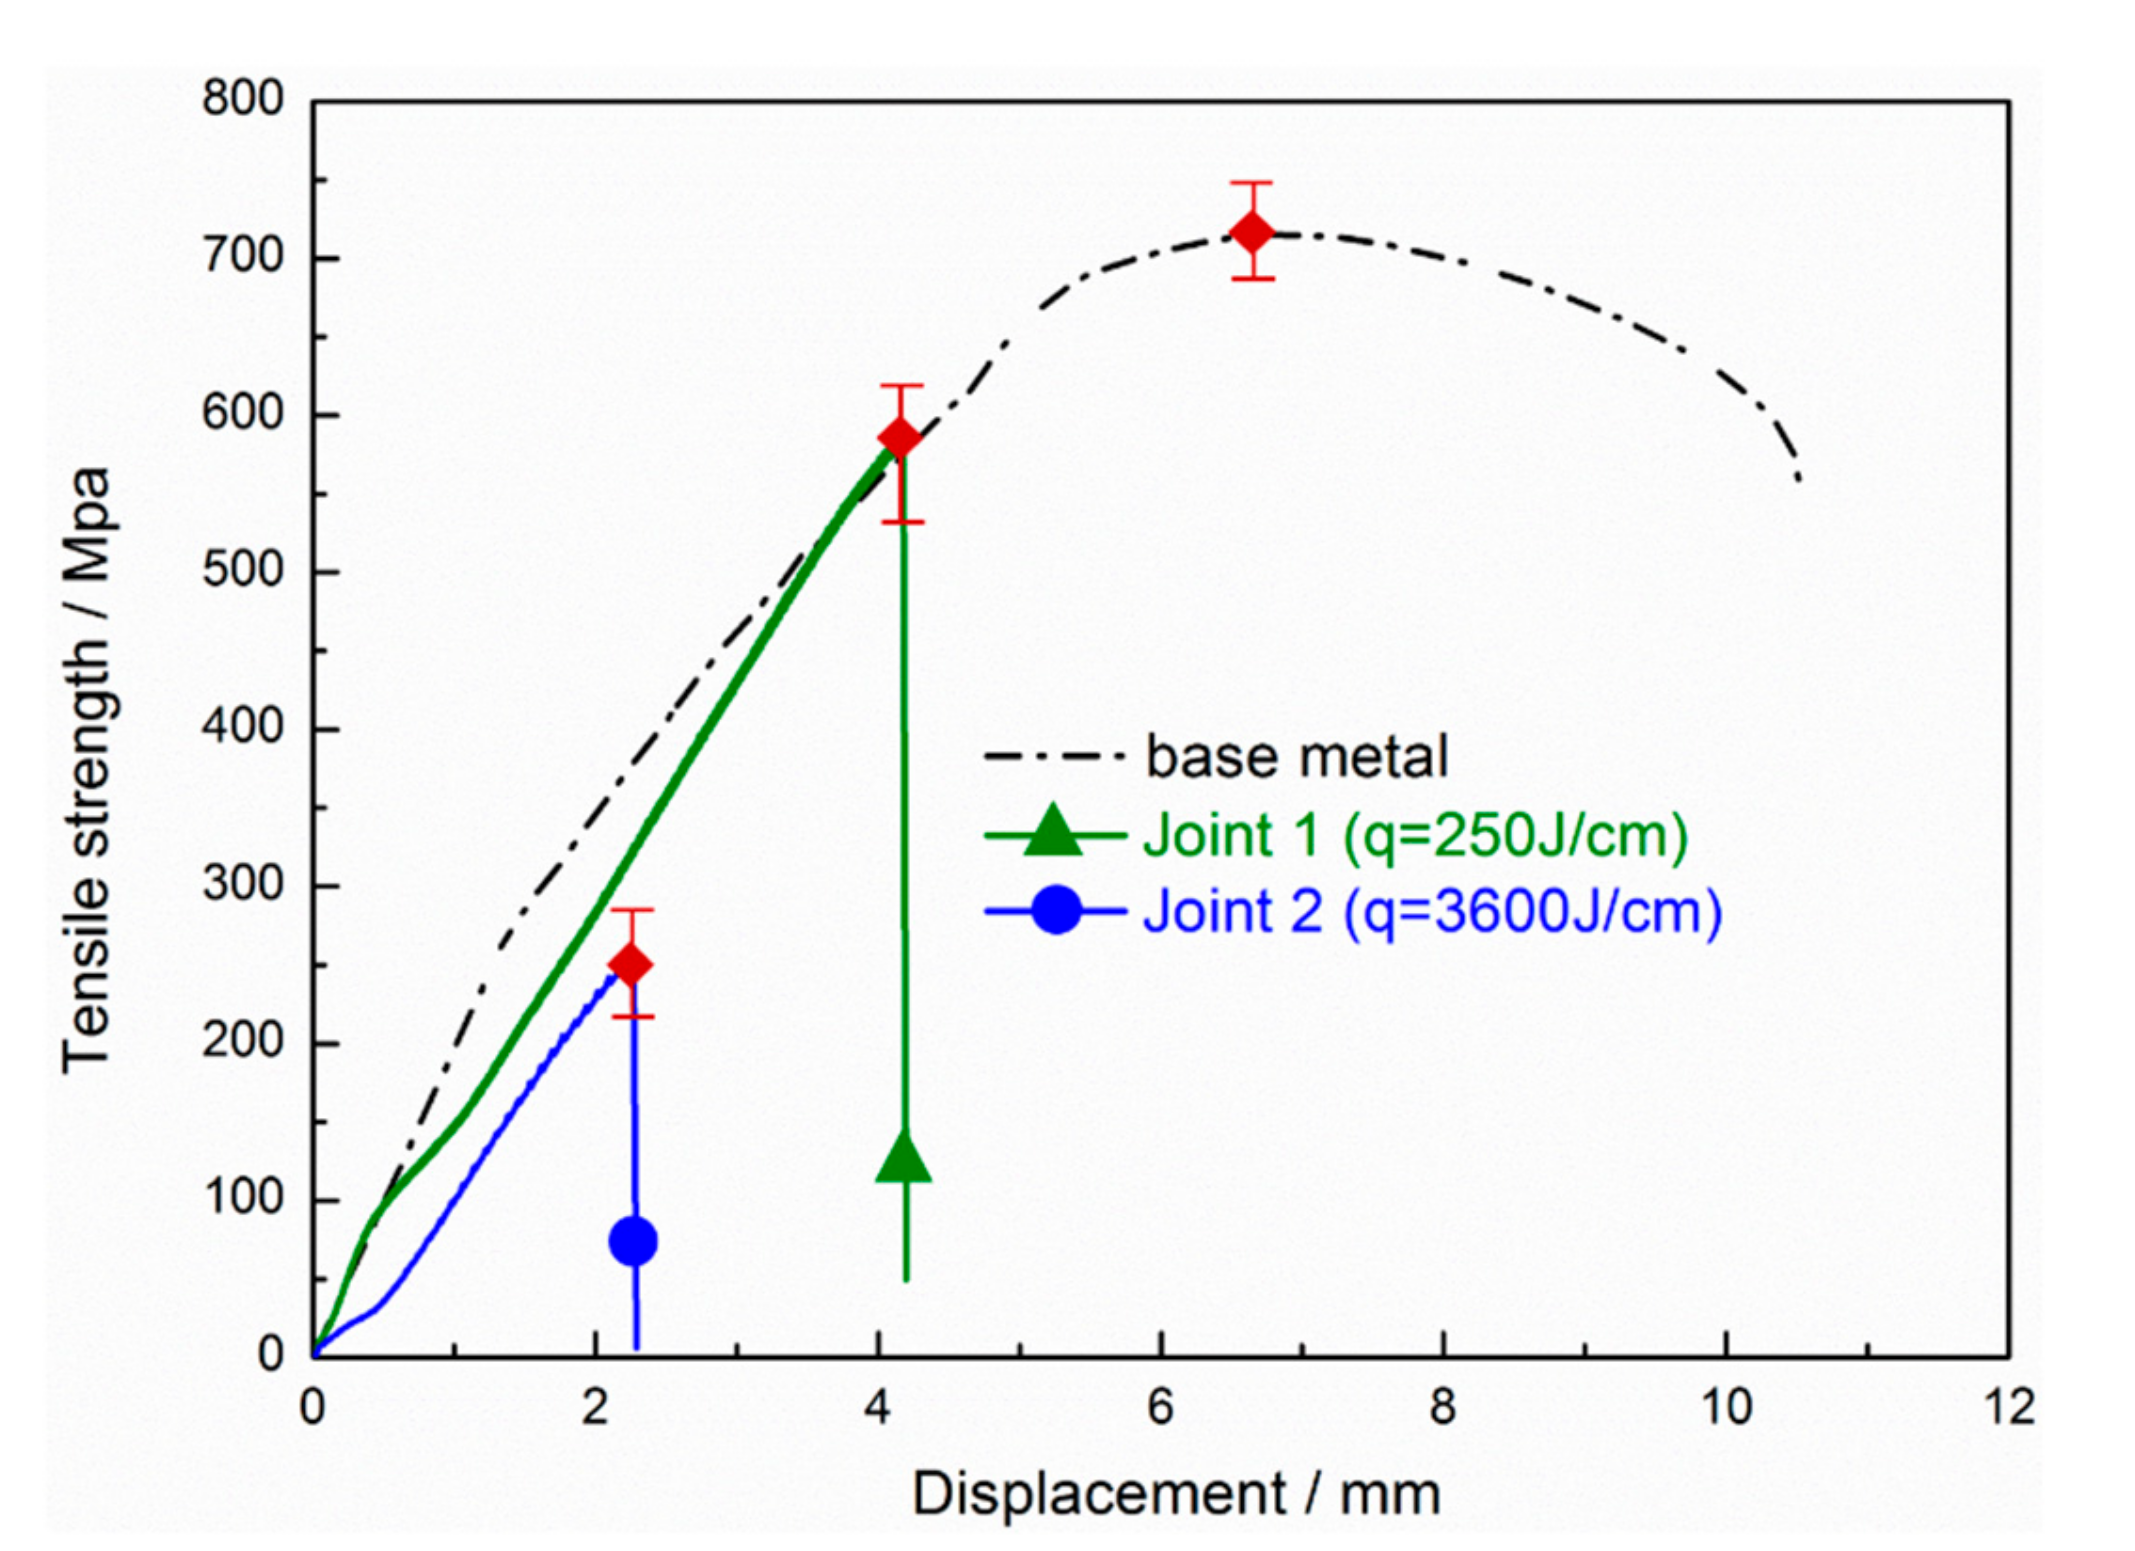
3.4. Tensile Strength
3.4.1. Tensile Strength and Fracture Path
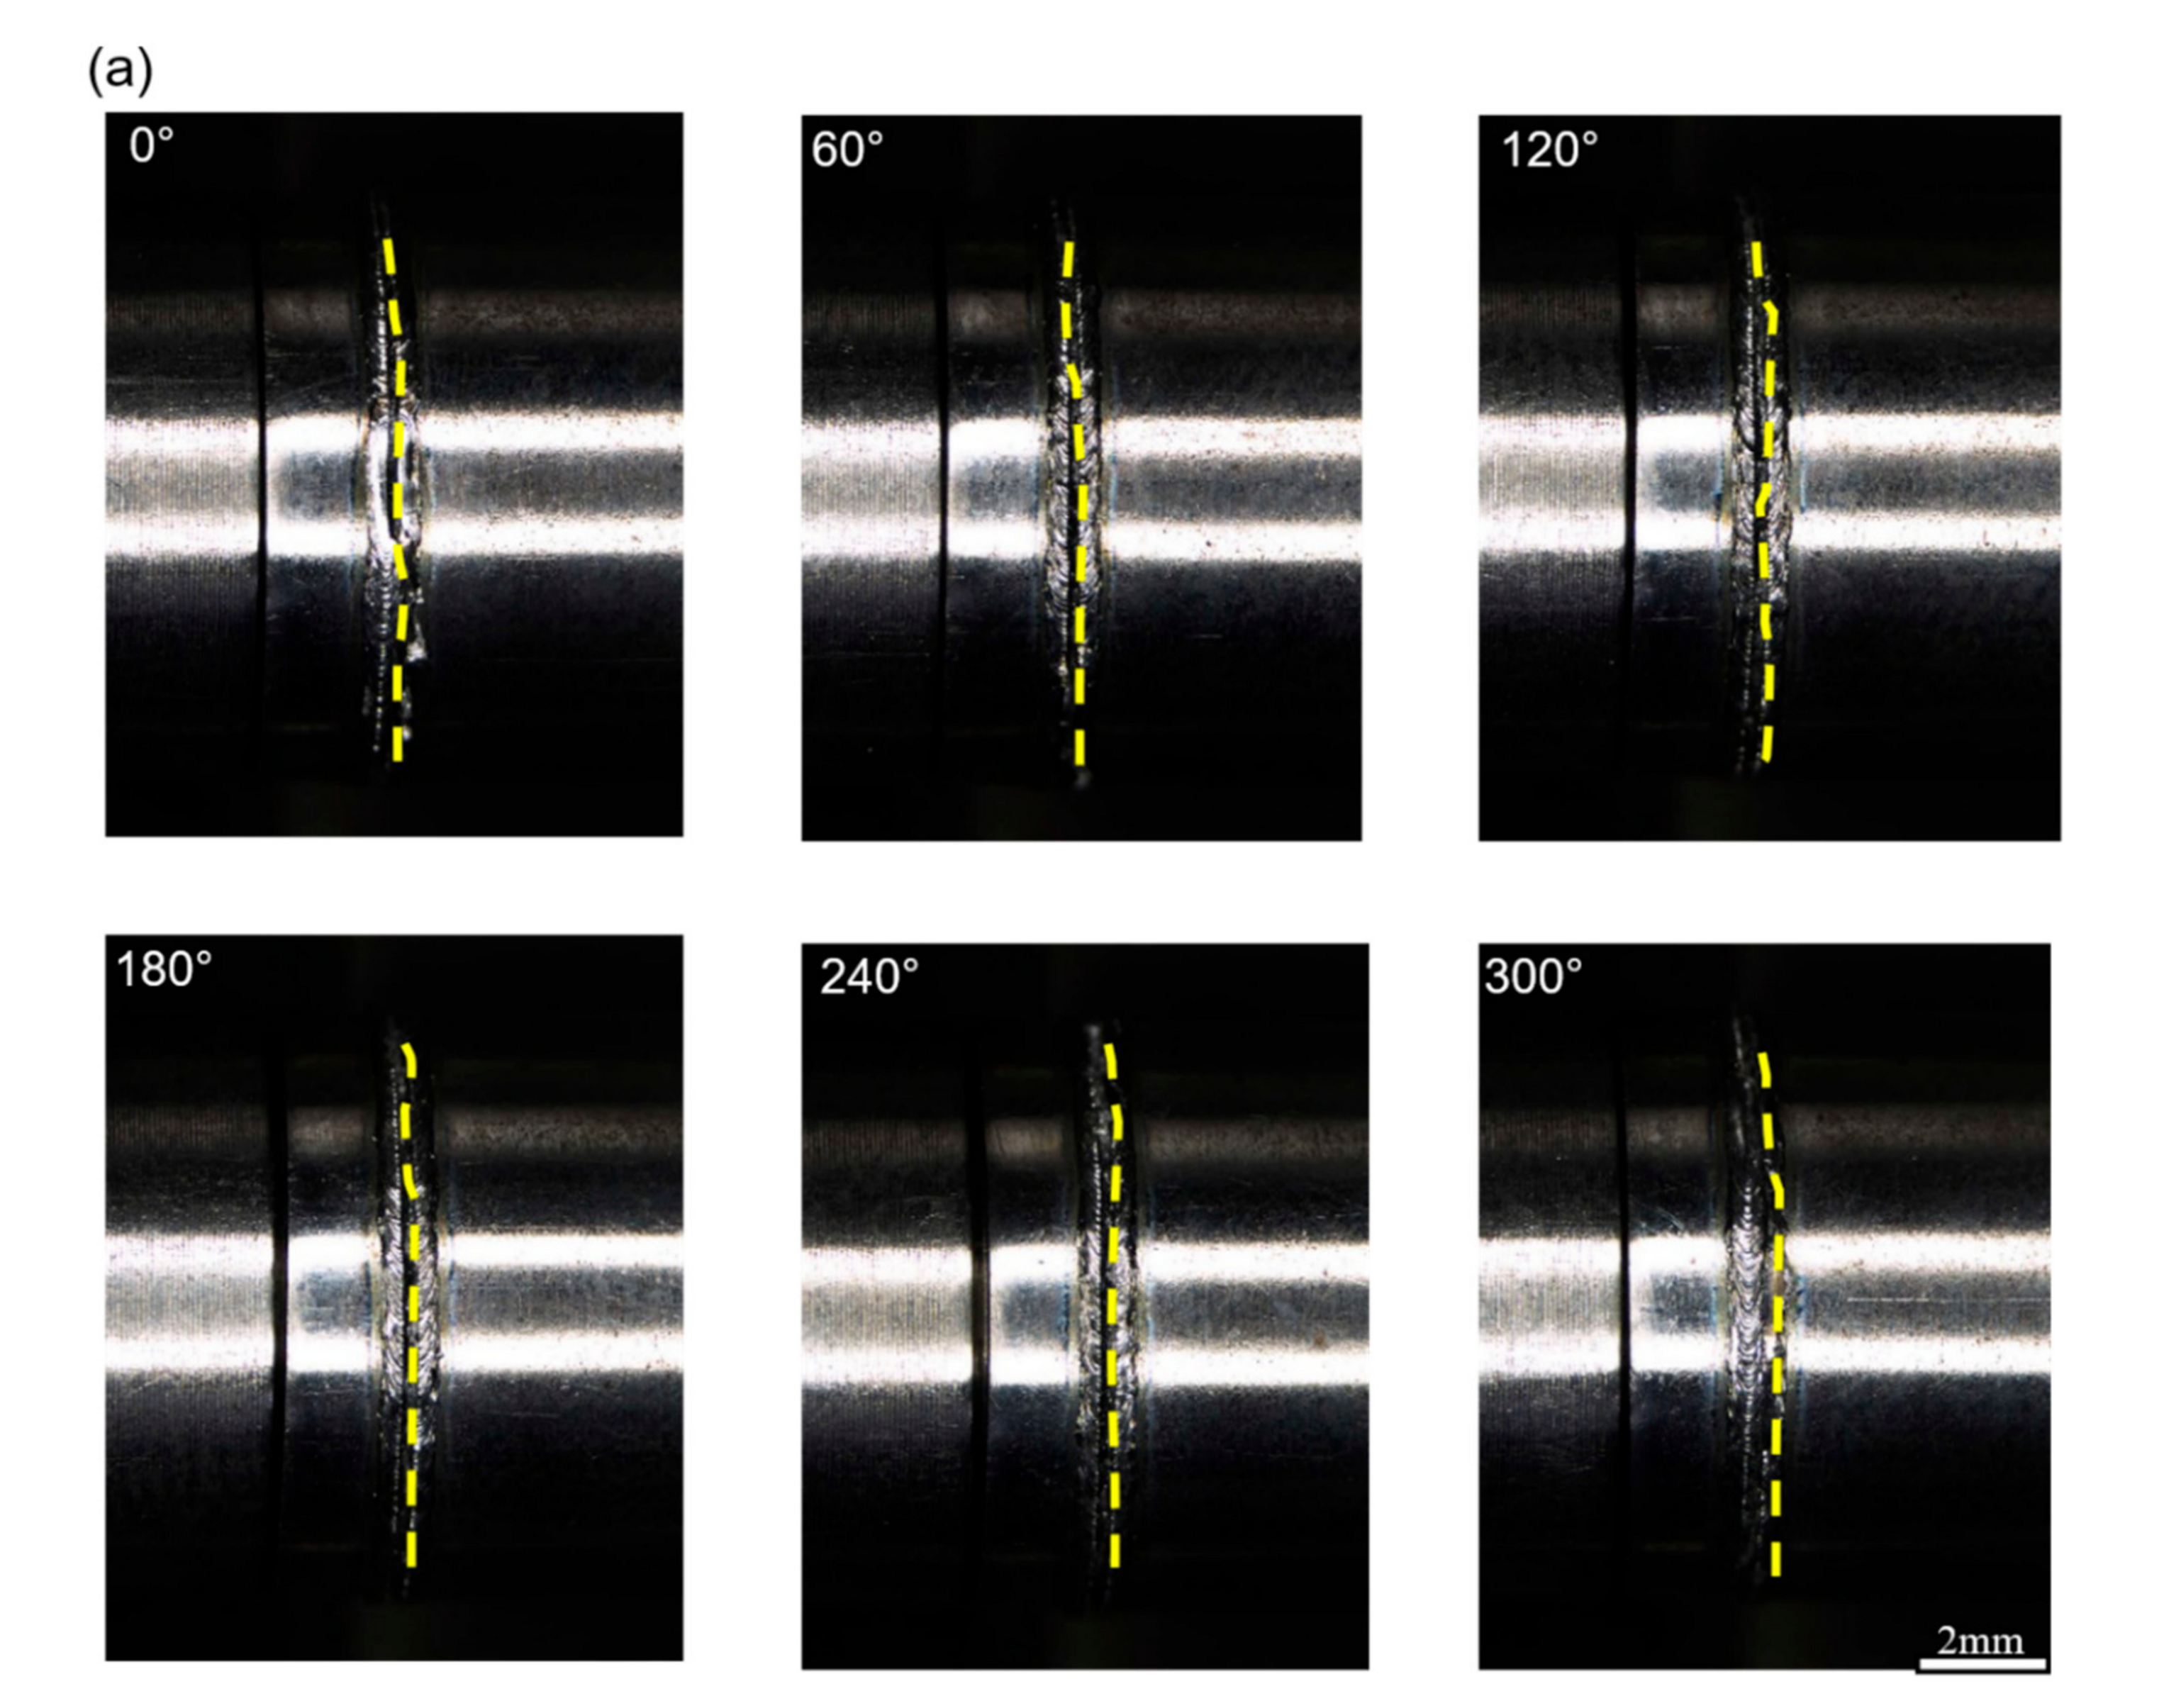
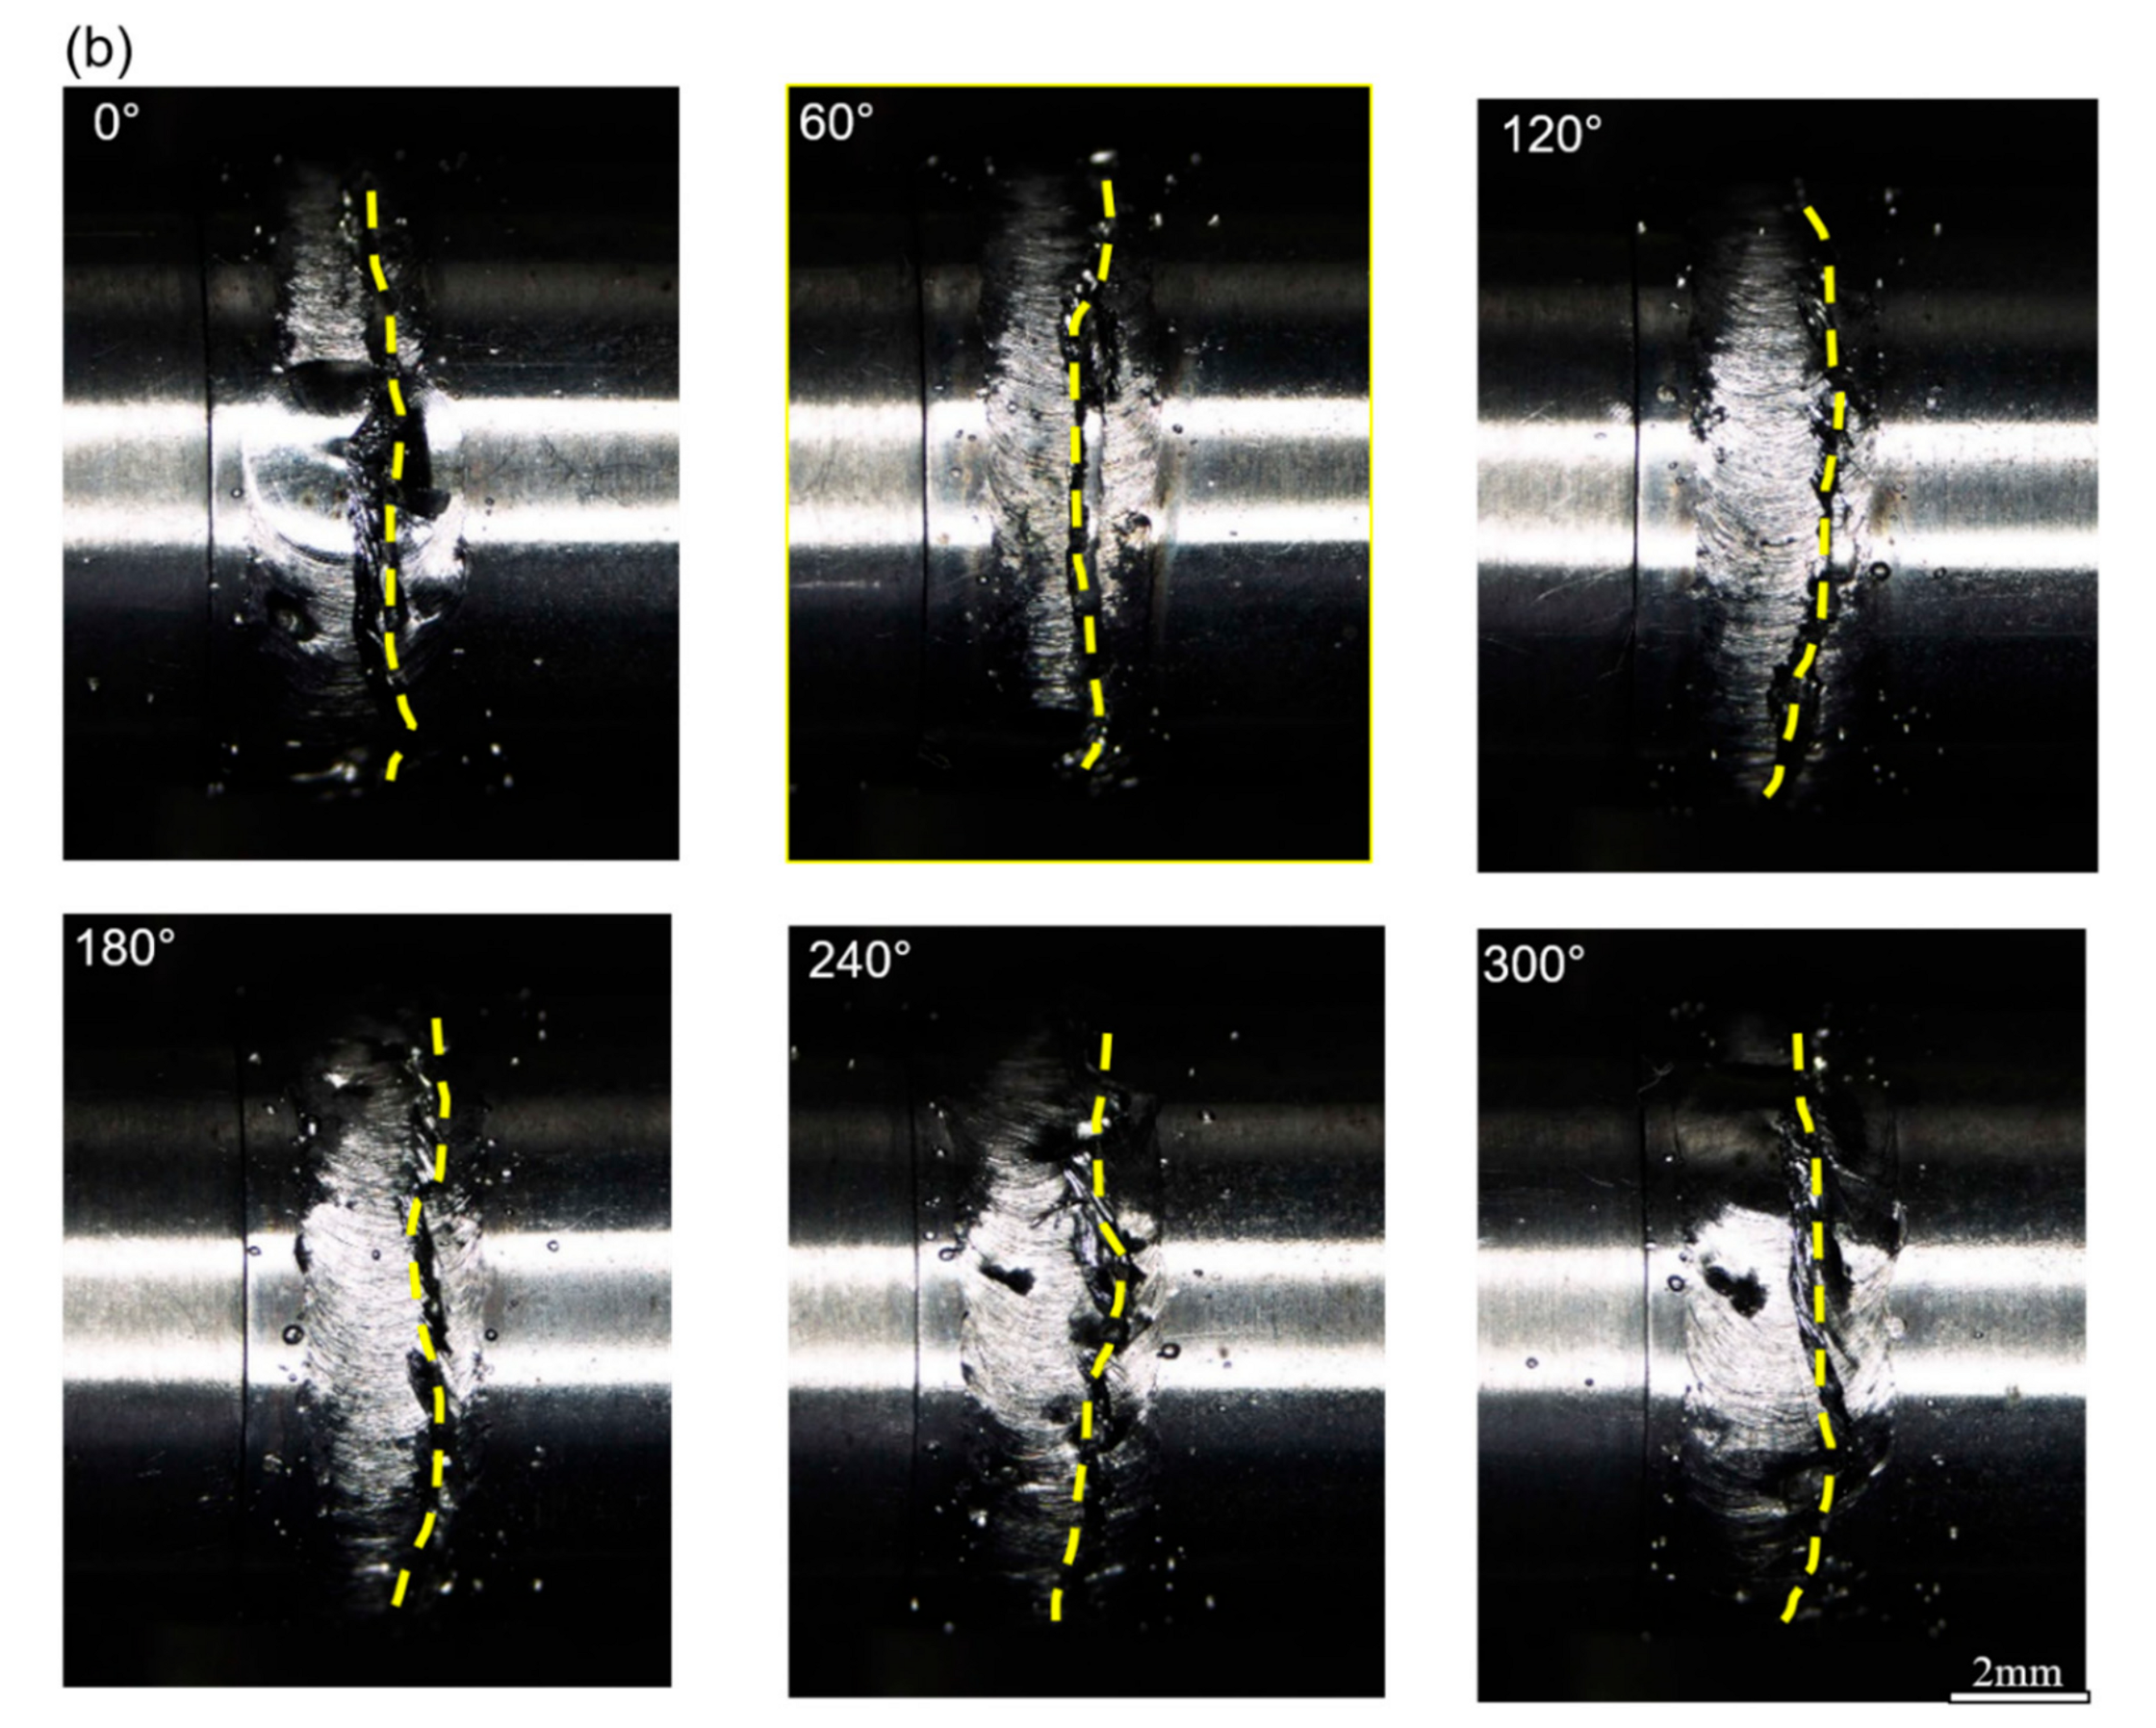
The results of the tensile test and the surface morphologies of fractured specimens are displayed in Figure 11 and Figure 12, respectively. The tensile strength of BM was 718 MPa while those of the joints 1 and 2 were 568 and 252 MPa, which took up 79% and 35% of that of BM, respectively. Namely, the tensile strengths of joint 2 was significantly lower than that of joint 1. The tensile specimens of both joints were fractured in the FZs and were not subjected to plastic deformation before failure. It can be found from Figure 12 that joint 1 fractured along the center line of the FZ, while joint 2 fractured along the FZ-HAZ interface at the tube side.
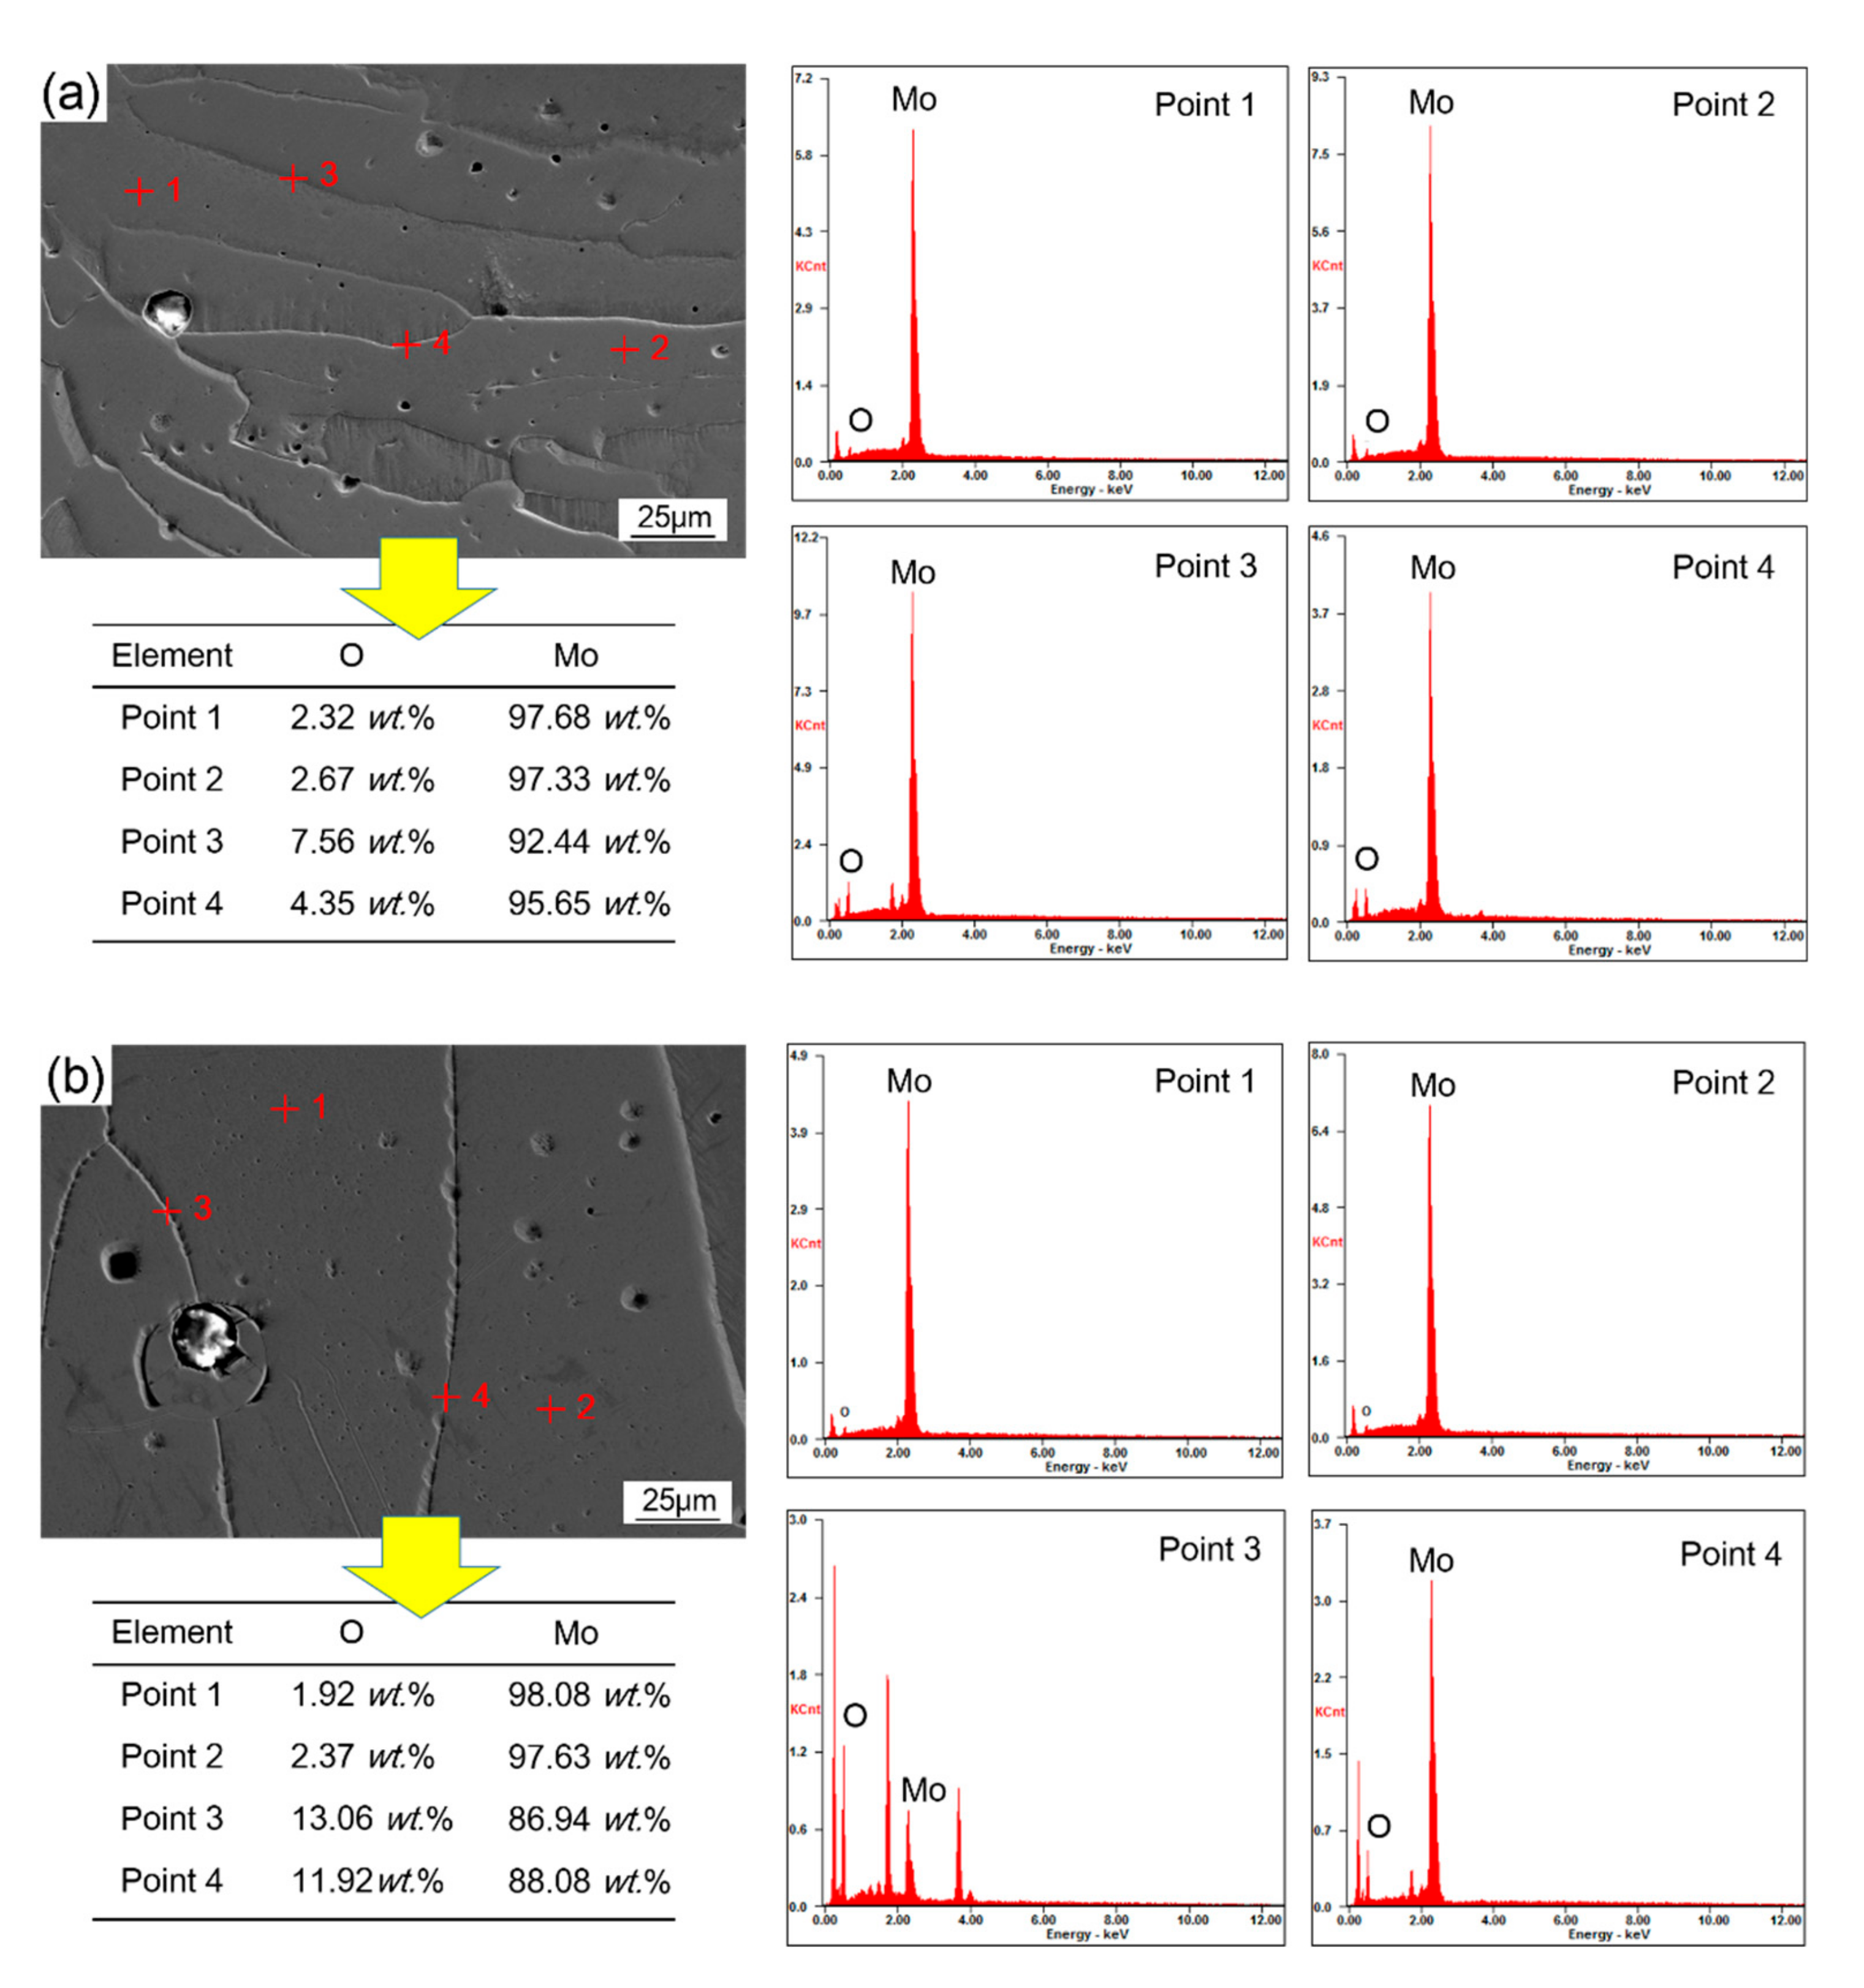
As mentioned in Section 3.4, the La2O3 particles in the FZ might decompound during fusion welding, which would cause O to dissolve into a molten pool and react with Mo. Thus, MoO2 was generated and had a great probability to gather on GBs, due to its lower melting point (2300 °C). Previous research already showed that the discontinuous distribution of MoO2 at the GBs of the FZ was the main reason causing a reduction of the strengths of Mo alloy joints [19]. In this work, oxygen segregation at GBs in the FZ was also investigated and is presented in the next subsection. Of course, the numbers of porosity defects and pore sizes in the FZ of joint 2 were larger than those of joint 1 respectively, which is also an important reason why the tensile strengths of joint 2 was significantly lower than that of joint 1.
3.4.2. Composition of Grain Boundary Segregation
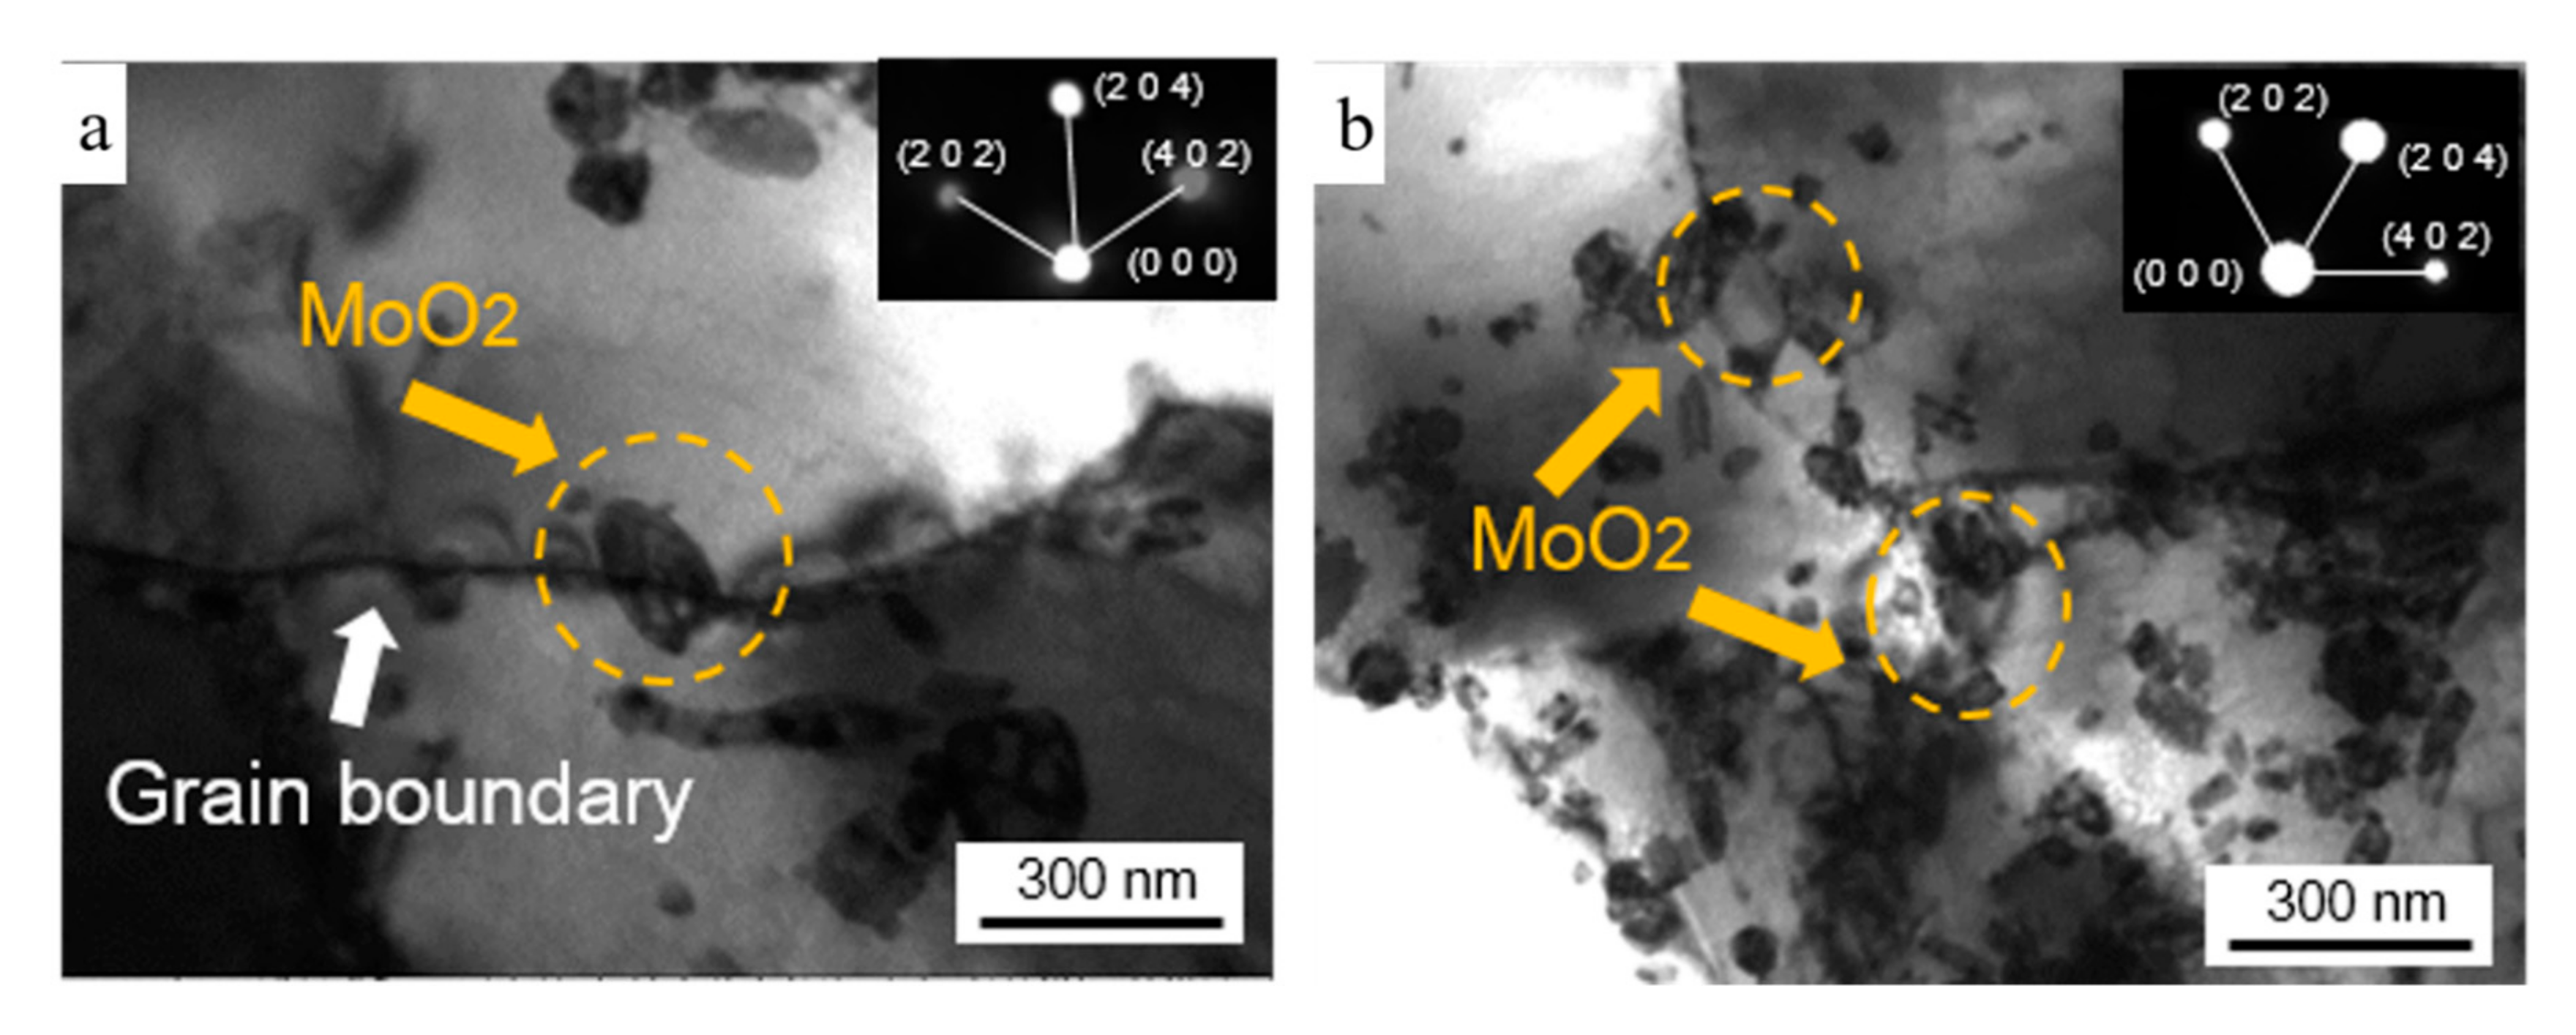
The EDS results for cross-sections of joints 1 and 2 at 180° are shown in Figure 13a,b, respectively. It indicated that the oxygen contents at the grain boundaries within the FZs of the two welded joints were all higher than those at the interior of the grains within the FZ. In addition, it was confirmed that the oxygen contents at the GBs within the FZ of joint 2 was significantly higher than that of joint 1. Generally, MoO2 will segregate on GBs after laser welding no matter which heat input is used [5,6,17,23]. Then, TEM was used to identify the phase in the FZ of each joint, and the TEM results are shown in Figure 14a,b, respectively. The MoO2 segregation at grain boundaries can be seen in Figure 14. The segregation of joint 2 was more serious. It is easy to understand that reduced GBs area would result in excessive aggregation of precipitates on GBs. Therefore, the coarse grains in joint 2 caused by higher heat input would lead to the total area of GBs being reduced, and consequently, aggravate the segregation of MoO2 at GBs.
3.4.3. Morphology of Tensile Fractures
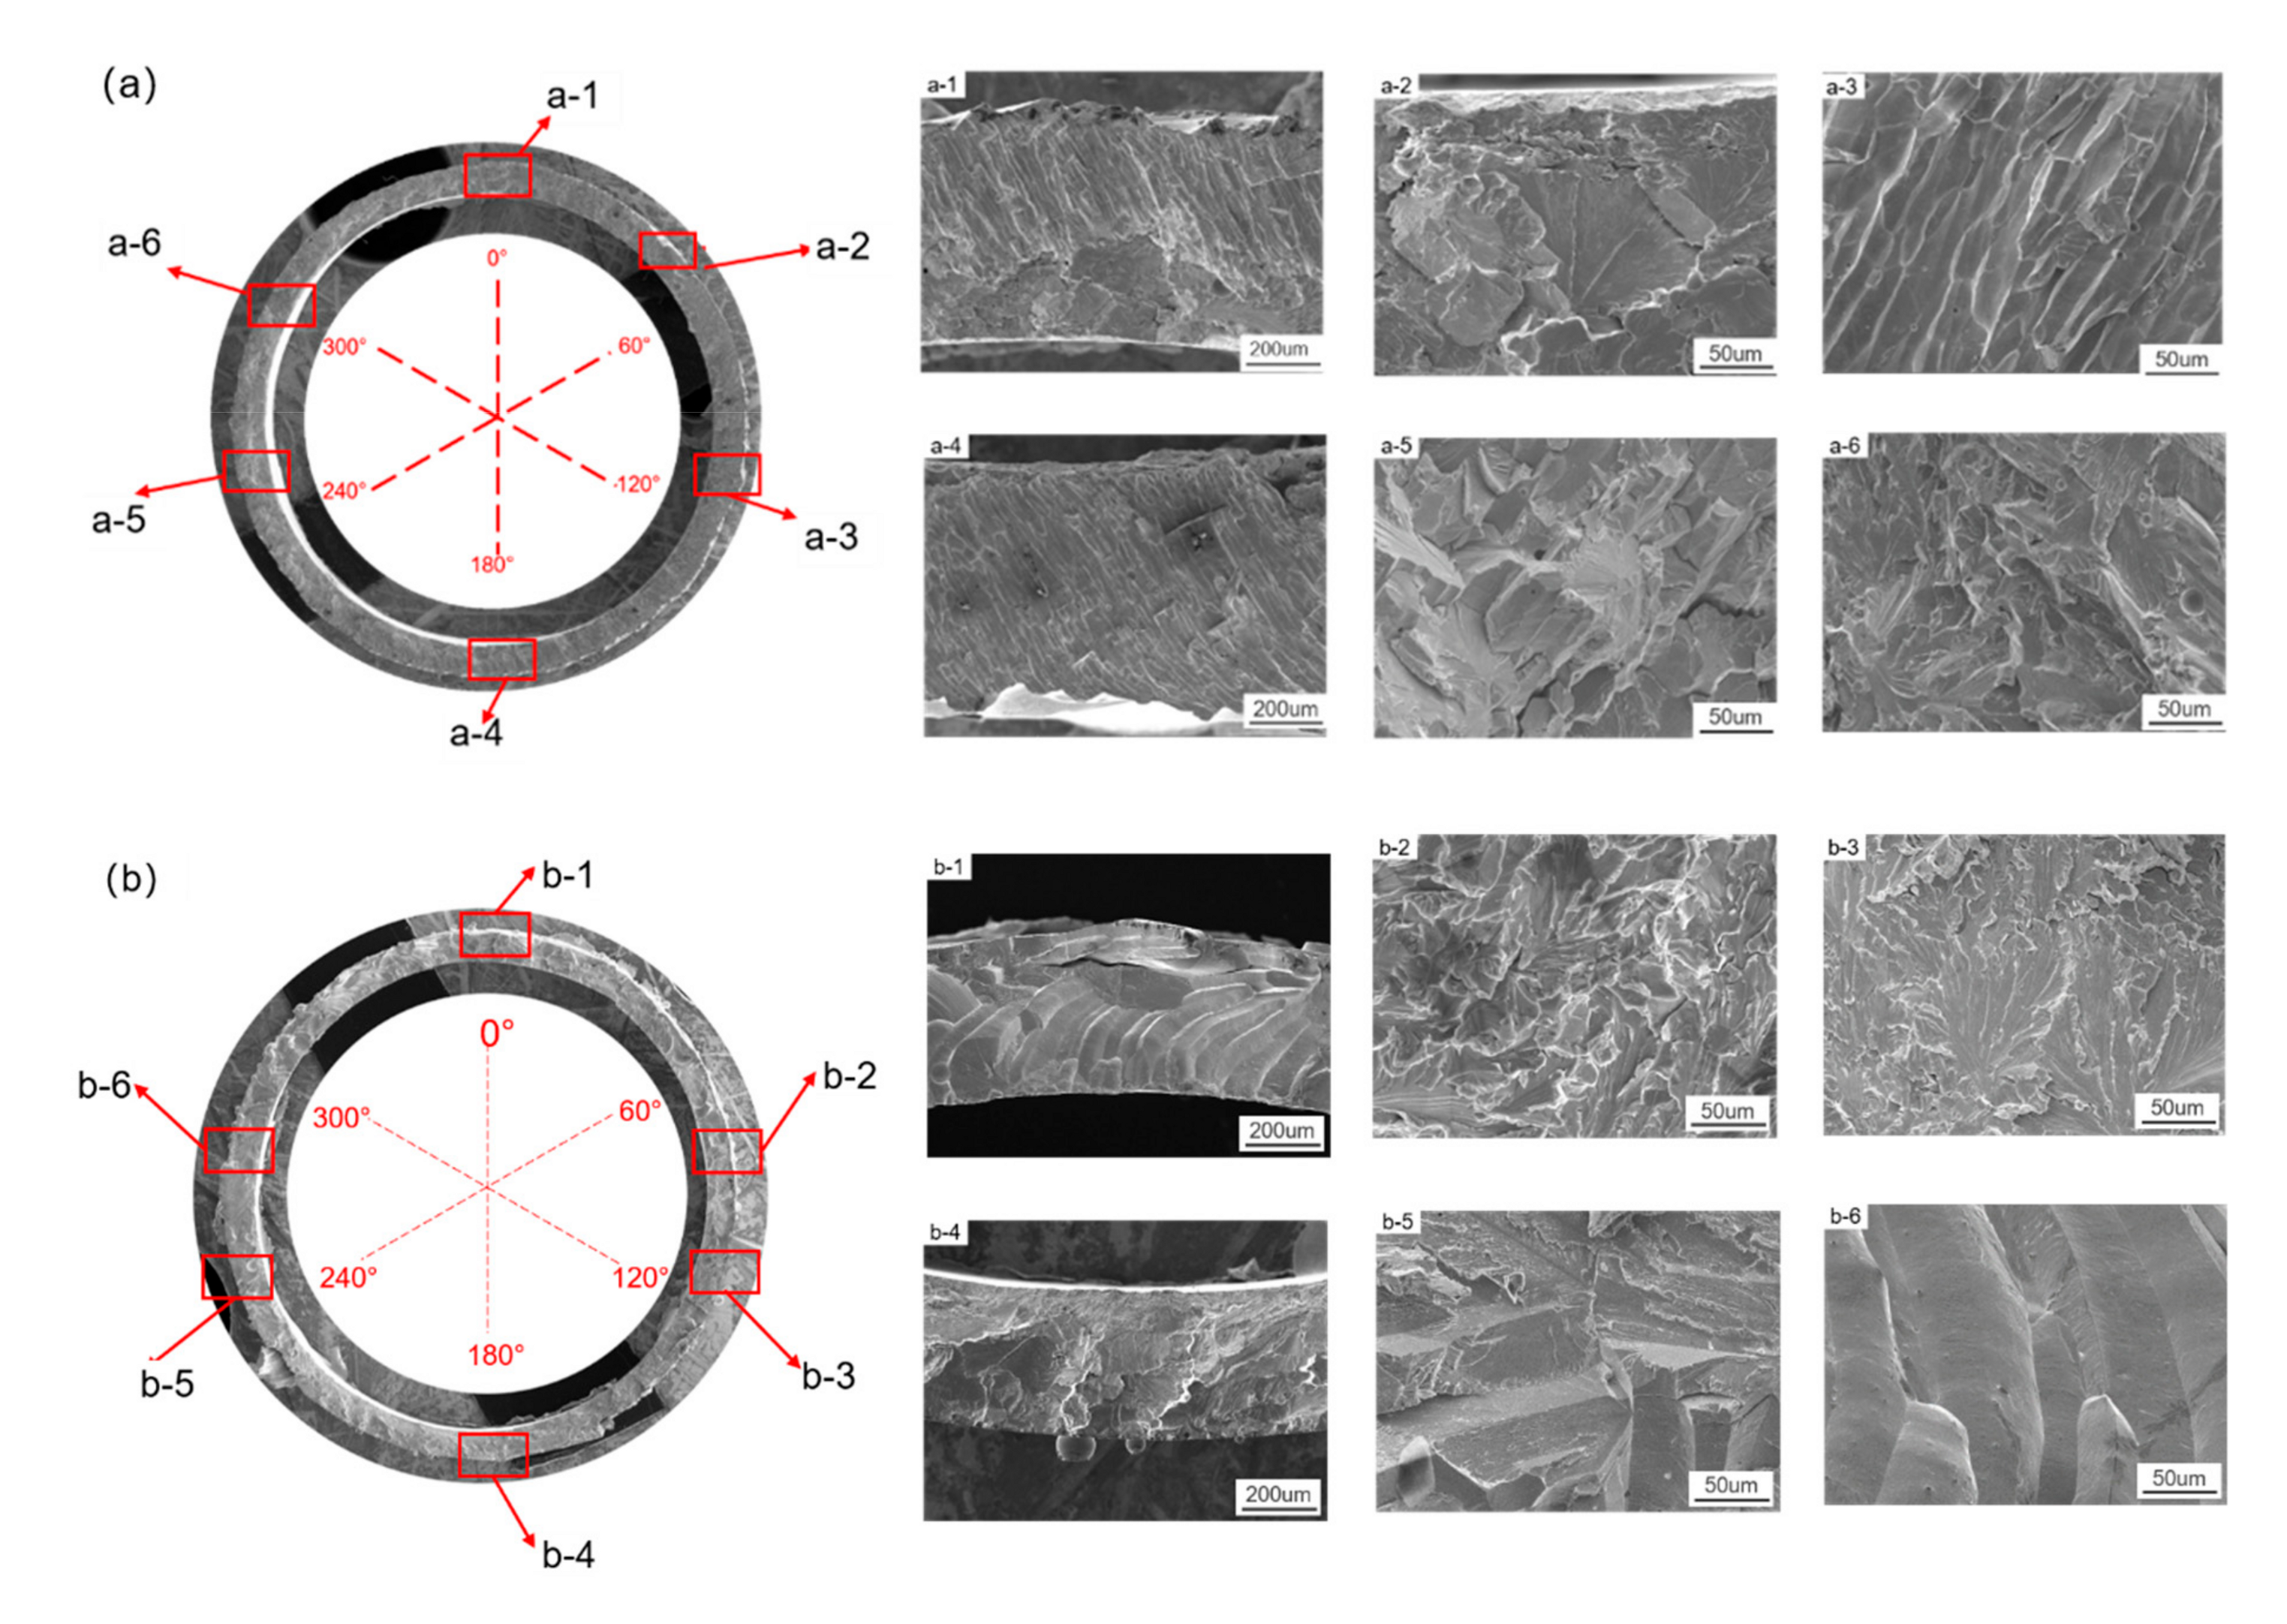
Figure 15 displays the morphologies of tensile fractures of joints 1 and 2 observed by using SEM. The fractures of the two joints all appeared as intergranular and transgranular mixed fracture morphology. The river-like patterns were observed at the 0°, 60°, 120° and 300° positions of the fracture of joint 1 (as shown in Figure 15a), namely, shown as cleavage fracture, which took up about 70% of the total area of the fracture. In the fracture zone of joint 1 at 80° and 140°, the grain surface exposed due to the intergranular fracture occurred there, which accounted for about 30% of the total area of the fracture. The river-like pattern occurred at the 30° and 90°positions on the fracture of joint 2 (as shown in Figure 15b), which accounted for about 50% of the total area of the fracture. Intergranular fracture morphology took up about 50% of the total area of the fracture of joint 2, which should be attributed to the serious MoO2 segregate on GBs in the FZ of joint 2. As mentioned above, higher heat input would result in coarsened grains and reduce the total area of the grain boundary, which would consequently cause excessive aggregation of MoO2 on GBs and weaken grain boundary strength. Therefore, the tensile strength of joint 2 was obviously lower than that of joint 1.
4. Conclusions
Fiber welding tests of socket joint made of powder metallurgy NS Mo alloy were carried out and the welding heat inputs were taken as 250 J/cm and 3600 J/cm. The role of welding heat input in fiber laser welding of powder metallurgy NS Mo alloy was discussed by comparing the microstructure, mechanical properties and grain boundary segregation of both joints. The main conclusions are as follows.
- (1)
- Laser welding of an NS Mo alloy under a low heat input resulted in a high aspect ratio of the FZ and uniform widths and depths of FZ over the whole circumference of the joint. In contrast, in the joint prepared with a high heat input, a low aspect ratio of the FZ was observed and both width and depth of FZ increased gradually along the welding direction.
- (2)
- The FZ and HAZ of joint 1 and joint 2 both were softened. The minimum microhardness of the softened zone of both joints was similar and was less than that of BM by about 20%.
- (3)
- When heat input was increased from 250 J/cm to 3600 J/cm, the average grain size of the FZ increased from about 40 μm to about 130 μm, which would significantly reduce the total area of GBs, and therefore might aggravate the segregation of MoO2 at GBs.
- (4)
- The tensile strengths of the welded joints achieved using heat inputs of 250 J/cm and 3600 J/cm were 79% and 35% of that of BM, respectively. Both joints fractured in the FZ and intergranular fracture morphology took up about 30% and 50% of the total area of the fractures of joint 1 and joint 2, respectively.
The authors hope that the results of this study will enable researchers who want to alleviate the porosity issue in fusion welding of powder metallurgy Mo alloy with high heat input to understand its impact on mechanical performance. In addition, although the study can deepen our understanding of the weldability of powder metallurgy molybdenum alloy in fiber laser welding, we have to admit that the results are rather preliminary and there is still a long way to go before applying it in industry.
Author Contributions
Conceptualization, M.-X.X.; Validation, M.-X.X. and Y.-X.L.; Formal Analysis, J.-Y.P., X.-W.W. and X.-T.S.; Writing—Review and Editing, M.-X.X. and Y.-X.L.
Funding
This work was supported by the National Natural Science Foundation of China (Grant No. 51775416 and 61773165).
Conflicts of Interest
The authors declare no conflicts of interest.
References
- Dimiduk, D.M.; Perepezko, J.H. Mo-Si-B alloys: Developing a revolutionary turbine-engine material. MRS Bull. 2003, 28, 639–645. [Google Scholar] [CrossRef]
- Schade, P.; Bartha, L. Deformation and properties of PM molybdenum and tungsten. Int. J. Refract. Met. Hard Mater. 2002, 20, 259–260. [Google Scholar] [CrossRef]
- Zhang, G.J.; Liu, G.; Sun, Y.J.; Jiang, F.; Wang, L.; Wang, R.H.; Sun, J. Microstructure and strengthening mechanisms of molybdenum alloy wires doped with lanthanum oxide particles. Int. J. Refract. Met. Hard Mater. 2009, 27, 173–176. [Google Scholar] [CrossRef]
- Liu, G.; Zhang, G.J.; Jiang, F.; Ding, X.D.; Sun, Y.J.; Sun, J.; Ma, E. Nanostructured high-strength molybdenum alloys with unprecedented tensile ductility. Nat. Mater. 2013, 12, 344–350. [Google Scholar] [CrossRef] [PubMed]
- Zhang, L.L.; Zhang, L.J.; Long, J.; Ning, J.; Zhang, J.X.; Na, S.J. Effects of titanium on grain boundary strength in molybdenum laser weld bead and formation and strengthening mechanisms of brazing layer. Mater. Des. 2019, 169, 107681. [Google Scholar] [CrossRef]
- Zhang, L.J.; Liu, J.Z.; Bai, Q.L.; Wang, X.W.; Sun, Y.J.; Li, S.G.; Gong, X. Effect of preheating on the microstructure and properties of fiber laser welded girth joint of thin-walled nanostructured Mo alloy. Int. J. Refract. Met. Hard Mater. 2019, 78, 219–227. [Google Scholar] [CrossRef]
- Zhang, L.J.; Pei, J.Y.; Zhang, L.L.; Long, J.; Zhang, J.X.; Na, S.J. Laser seal welding of end plug to thin-walled nanostructured high-strength molybdenum alloy cladding with a zirconium interlayer. J. Mater. Proc. Technol. 2019, 267, 338–347. [Google Scholar] [CrossRef]
- Ning, J.; Hong, K.M.; Inamke, G.V.; Shin, Y.C.; Zhang, L.J. Analysis of microstructure and mechanical strength of lap joints of TZM alloy welded by a fiber laser. J. Manuf. Process. 2019, 39, 146–159. [Google Scholar] [CrossRef]
- Zhang, L.J.; Lu, G.F.; Ning, J.; Zhu, Q.; Zhang, J.X.; Na, S.J. Effects of minor Zr addition on the microstructure and mechanical properties of laser welded dissimilar joint of titanium and molybdenum. Mater. Sci. Eng. A 2019, 742, 788–797. [Google Scholar] [CrossRef]
- Zhang, L.J.; Lu, G.F.; Ning, J.; Zhang, L.L.; Long, J.; Zhang, G.F. Influence of Beam Offset on Dissimilar Laser Welding of Molybdenum to Titanium. Materials 2018, 11, 1852. [Google Scholar] [CrossRef]
- Song, X.G.; Tian, X.; Zhao, H.Y.; Si, X.Q.; Han, G.H.; Feng, J.C. Interfacial microstructure and joining properties of Titanium–Zirconium–Molybdenum alloy joints brazed using Ti–28Ni eutectic brazing alloy. Mater. Sci. Eng. A 2016, 653, 115–121. [Google Scholar] [CrossRef]
- Chang, C.T.; Shiue, R.K. Infrared brazing of Ti-6Al-4V using the Ti-15Cu-15Ni braze alloy. J. Mater. Sci. 2006, 41, 2145–2150. [Google Scholar] [CrossRef]
- Ambroziak, A. Friction welding of molybdenum to molybdenum and to other metals. Int. J. Refract. Met. Hard Mater. 2011, 29, 462–469. [Google Scholar] [CrossRef]
- Fujii, H.; Sun, Y.; Kato, H. Microstructure and mechanical properties of friction stir welded pure Mo joints. Scr. Mater. 2011, 64, 657–660. [Google Scholar] [CrossRef]
- Farrell, J.; Umstead, W.; Xu, J.; Zhai, T. Resistance spot welding of 50Mo-50Re refractory alloy foils. In Proceeding of the 2008 IEEE International Vacuum Electronics Conference, Monterey, CA, USA, 22–24 April 2008. [Google Scholar]
- Xu, J.; Jiang, X.; Zeng, Q.; Zhai, T.; Leonhardt, T.; Farrell, J.; Umstead, W.; Effgen, M.P. Optimization of resistance spot welding on the assembly of refractory alloy 50Mo–50Re thin sheet. J. Nucl. Mater. 2007, 366, 417–425. [Google Scholar] [CrossRef]
- Wang, H.; Zhang, Y.P.; Zhang, X.Y. TZM alloy TIG welding process and microstructure of welded joints. Adv. Mater. Res. 2011, 291–294, 867–871. [Google Scholar] [CrossRef]
- Chatterjee, A.; Kumar, S.; Tewari, R.; Dey, G.K. Welding of Mo-based alloy using electron beam and laser-GTAW hybrid welding techniques. Metall. Mater. Trans. A 2016, 47, 1143–1152. [Google Scholar] [CrossRef]
- Zhang, Y.Y.; Wang, T.; Jiang, S.Y.; Zhang, B.G.; Wang, Y.; Feng, J.C. Microstructure evolution and embrittlement of electron beam welded TZM alloy joint. Mater. Sci. Eng. A 2017, 700, 512–518. [Google Scholar] [CrossRef]
- Ferrenz, E.E.; Amare, A.; Arumainayagam, C.R. An improved method to spot-weld difficult junctions. Rev. Sci. Instrum. 2001, 72, 4474–4476. [Google Scholar] [CrossRef]
- Jiang, Q.; Li, Y.; Puchkov, U.A.; Wang, J.; Xia, C. Microstructure characteristics in TIG welded joint of Mo–Cu composite and 18-8 stainless steel. Int. J. Refract. Met. Hard Mater. 2010, 28, 429–433. [Google Scholar]
- Matsuda, F.; Ushio, M.; Nakata, K.; Edo, Y. Weldability of molybdenum and its alloy sheet (report I) (materials, metallurgy, weldability). Trans. JWRI 1979, 8, 217–229. [Google Scholar]
- Kolarikova, M.; Kolarik, L.; Vondrous, P. Welding of thin molybdenum sheets by EBW and GTAW. In Annals of DAAAM for 2012 Proceedings of the 23rd International DAAAM Symposium; DAAAM International: Vienna, Austria, 2012; Volume 23, pp. 1005–1008. [Google Scholar]
- Tan, C.; Yang, J.; Zhao, X.; Zhang, K.; Song, X.; Chen, B.; Li, L.; Feng, J. Influence of Ni coating on interfacial reactions and mechanical properties in laser welding-brazing of Mg/Ti butted joint. J. Alloys Compd. 2018, 764, 186–201. [Google Scholar] [CrossRef]
- Wei, G.; Crowther, D.; Francis, J.A.; Thompson, A.; Zhu, L.; Lin, L. Microstructure and mechanical properties of laser welded S960 high strength steel. Mater. Des. 2015, 85, 534–548. [Google Scholar]
- Lin, Y.; Jiang, G. Pulsed Nd: YAG laser fine spot welding for attachment of refractory mini-pins. In Proceedings of the SPIE LASE, San Francisco, CA, USA, 2–7 February 2013; Volume 8608, pp. 885–905. [Google Scholar]
- Ning, J.; Zhang, L.J.; Bai, Q.L.; Yin, X.Q.; Niu, J.; Zhang, J.-X. Comparison of the microstructure and mechanical performance of 2A97 Al-Li alloy joints between autogenous and non-autogenous laser welding. Mater. Des. 2017, 120, 144–156. [Google Scholar] [CrossRef]
- Zhang, L.J.; Ning, J.; Zhang, X.J.; Zhang, G.-F.; Zhang, J.-X. Single pass hybrid laser–MIG welding of 4-mm thick copper without preheating. Mater. Des. 2015, 74, 1–18. [Google Scholar] [CrossRef]
- Gao, X.L.; Zhang, L.J.; Liu, J.; Zhang, J.X. A comparative study of pulsed Nd: YAG laser welding and TIG welding of thin Ti6Al4V titanium alloy plate. Mater. Sci. Eng. A 2013, 559, 14–21. [Google Scholar] [CrossRef]
- Zhang, L.J.; Zhang, G.F.; Ning, J.; Zhang, X.-J.; Zhang, J.-X. Microstructure and properties of the laser butt welded 1.5-mm thick T2 copper joint achieved at high welding speed. Mater. Des. 2015, 88, 720–736. [Google Scholar] [CrossRef]
- Gao, X.L.; Liu, J.; Zhang, L.J. Dissimilar metal welding of Ti6Al4V and Inconel 718 through pulsed laser welding-induced eutectic reaction technology. Int. J. Refract. Met. Hard Mater. 2018, 96, 1061–1071. [Google Scholar] [CrossRef]
- An, G.; Sun, J.; Sun, Y.; Cao, W.; Zhu, Q.; Bai, Q.; Zhang, L. Fiber laser welding of fuel cladding and end plug made of La₂O₃ dispersion-strengthened molybdenum alloy. Materials 2018, 11, 1071. [Google Scholar] [CrossRef]
- Wei, H.L.; Elmer, J.W.; Debroy, T. Three-dimensional modeling of grain structure evolution during welding of an aluminum alloy. Acta Mater. 2017, 126, 413–425. [Google Scholar] [CrossRef] [Green Version]
- Stütz, M.; Oliveira, D.; Rüttinger, M.; Reheis, N.; Kestler, H.; Enzinger, N. Electron Beam Welding of TZM Sheets. Mater. Sci. Forum 2017, 879, 1865–1869. [Google Scholar] [CrossRef]
- Alexander-Morrison, G.M.; Dobbins, A.G.; Holbert, R.K.; Doughty, M.W. Metallurgical examination of powder metallurgy uranium alloy welds. J. Mater. Energy Syst. 1986, 8, 70–79. [Google Scholar] [CrossRef]
- Han, S.; Song, Y.; Cui, S. Effect of Sintering Parameters on Properties and Microstructure of Mo-Cu Alloys. Chin. J. Rare Met. 2009, 33, 666–669. [Google Scholar]
Figure 1.
Cross-sectional microstructure of the hot-rolled powder metallurgy nanostructured molybdenum (NS Mo) alloy.
Figure 1.
Cross-sectional microstructure of the hot-rolled powder metallurgy nanostructured molybdenum (NS Mo) alloy.

Figure 2.
Schematics of the materials and methods: (a) dimensions of the NS Mo alloy end plug and tube; (b) laser beam irradiation zone on the specimen during welding tests; (c) cross-section of the weld joint.
Figure 2.
Schematics of the materials and methods: (a) dimensions of the NS Mo alloy end plug and tube; (b) laser beam irradiation zone on the specimen during welding tests; (c) cross-section of the weld joint.

Figure 3.
(a) Robot-controlled laser-welding system; (b) preheating device used in this study.

Figure 4.
Schematic of the six regions of the laser-welded NS Mo alloy joint in the: (a) overall perspective; (b) the cross-section perpendicular to the axis of the tube.
Figure 4.
Schematic of the six regions of the laser-welded NS Mo alloy joint in the: (a) overall perspective; (b) the cross-section perpendicular to the axis of the tube.

Figure 5.
The morphology of the welded seams of the laser-welded NS Mo alloy joints with: (a) heat input of 250 J/cm; (b) 3600 J/cm.
Figure 5.
The morphology of the welded seams of the laser-welded NS Mo alloy joints with: (a) heat input of 250 J/cm; (b) 3600 J/cm.

Figure 6.
The cross-sectional macrostructure of laser-welded NS Mo alloy joints with: (a) heat input of 250 J/cm; (b) 3600 J/cm. The fusion lines are marked by red lines.
Figure 6.
The cross-sectional macrostructure of laser-welded NS Mo alloy joints with: (a) heat input of 250 J/cm; (b) 3600 J/cm. The fusion lines are marked by red lines.

Figure 7.
Change in: (a) width and (b) depth of the fusion zone for laser-welded NS Mo alloy joints along the weld circumference.
Figure 7.
Change in: (a) width and (b) depth of the fusion zone for laser-welded NS Mo alloy joints along the weld circumference.

Figure 8.
The cross-sectional microstructures of the NS Mo alloy laser welding joints. Heat input: (a) 250 J/cm; (b) 3600 J/cm.
Figure 8.
The cross-sectional microstructures of the NS Mo alloy laser welding joints. Heat input: (a) 250 J/cm; (b) 3600 J/cm.

Figure 9.
Comparison of the solution direction for columnar grain in fusion zone between: (a) high welding speed; (b) low welding speed.
Figure 9.
Comparison of the solution direction for columnar grain in fusion zone between: (a) high welding speed; (b) low welding speed.

Figure 10.
The average microhardness distributions in the cross-sections of joint 1 and 2, produced under 250 J/cm and 3600 J/cm, respectively.
Figure 10.
The average microhardness distributions in the cross-sections of joint 1 and 2, produced under 250 J/cm and 3600 J/cm, respectively.

Figure 11.
Tensile stress displacement curve of NS Mo base metal and its laser welding joints.

Figure 12.
Views of the failure path of weld joints: (a) 250 J/cm; (b) 3600 J/cm.


Figure 13.
SEM images and EDS results in the fusion zone of NS Mo alloy welded joints. Heat input: (a) 250 J/cm; (b) 3600 J/cm.
Figure 13.
SEM images and EDS results in the fusion zone of NS Mo alloy welded joints. Heat input: (a) 250 J/cm; (b) 3600 J/cm.

Figure 14.
TEM images in the fusion zone of NS Mo alloy welded joints. Heat input: (a) 250 J/cm; (b) 3600 J/cm.
Figure 14.
TEM images in the fusion zone of NS Mo alloy welded joints. Heat input: (a) 250 J/cm; (b) 3600 J/cm.

Figure 15.
Fracture surface morphologies by SEM of NS Mo alloy laser welding joints under heat input of: (a) 250 J/cm; (b) 3600 J/cm.
Figure 15.
Fracture surface morphologies by SEM of NS Mo alloy laser welding joints under heat input of: (a) 250 J/cm; (b) 3600 J/cm.


Table 1.
Welding parameters used in the fiber laser welding of the socket joint made of NS Mo.
| Sample Number | Laser Power (kW) | Welding Speed (cm/min) | Defocusing Distance (mm) | Heat Input (J/cm) |
|---|---|---|---|---|
| Joint 1 | 2.5 | 600 | 1 | 250 |
| Joint 2 | 1.2 | 20 | 1 | 3600 |
Table 2.
The average grain size of the NS Mo alloy laser welding.
| Joint 1 | Joint 2 | |
|---|---|---|
| Average grain size | 42 μm | 131 μm |
| Standard deviation | 15 μm | 40 μm |
© 2019 by the authors. Licensee MDPI, Basel, Switzerland. This article is an open access article distributed under the terms and conditions of the Creative Commons Attribution (CC BY) license (http://creativecommons.org/licenses/by/4.0/).
Share and Cite
MDPI and ACS Style
Xie, M.-X.; Li, Y.-X.; Shang, X.-T.; Wang, X.-W.; Pei, J.-Y. Microstructure and Mechanical Properties of a Fiber Welded Socket-Joint Made of Powder Metallurgy Molybdenum Alloy. Metals 2019, 9, 640. https://doi.org/10.3390/met9060640
AMA Style
Xie M-X, Li Y-X, Shang X-T, Wang X-W, Pei J-Y. Microstructure and Mechanical Properties of a Fiber Welded Socket-Joint Made of Powder Metallurgy Molybdenum Alloy. Metals. 2019; 9(6):640. https://doi.org/10.3390/met9060640
Chicago/Turabian StyleXie, Miao-Xia, Yan-Xin Li, Xiang-Tao Shang, Xue-Wu Wang, and Jun-Yu Pei. 2019. "Microstructure and Mechanical Properties of a Fiber Welded Socket-Joint Made of Powder Metallurgy Molybdenum Alloy" Metals 9, no. 6: 640. https://doi.org/10.3390/met9060640
Note that from the first issue of 2016, this journal uses article numbers instead of page numbers. See further details here.