Numerical Simulation of Macrosegregation with Solid Deformation During the Solidification of Steel Ingots Using a Single-Phase/Two-Phase Integrated Model


Key Laboratory for Advanced Materials Processing Technology, Ministry of Education, School of Materials Science and Engineering, Tsinghua University, Beijing 100084, China
*
Author to whom correspondence should be addressed.
Metals 2019, 9(6), 669; https://doi.org/10.3390/met9060669
Submission received: 24 April 2019
/
Revised: 31 May 2019
/
Accepted: 6 June 2019
/
Published: 10 June 2019
Abstract
:Macrosegregation, a serious defect formed during the solidification of steel ingots, impairs the performance of the final components. To predict macrosegregation caused by thermal-solutal convection and solid deformation, a volume-averaged single-phase/two-phase integrated model is developed. During the deformation stage, the two-phase model coupling the solid deformation and liquid flow in the mushy zone is utilized. Before or after the deformation stage, the motion of the solid phase is neglected, and the single-phase model is solved. A 450 kg steel ingot punching test is considered for application. The results show that when the solid shell of the ingot is being punched, the solid phase in the mushy core at punching height is compressed, and a relative liquid flow is induced. This in turn causes a transition of positive segregation to negative segregation in the compressed mushy core of the ingot. According to numerical sensitivity tests of different punching parameters, as the punching start time and punching velocity increase, the effect of punching on macrosegregation will be smaller. It is demonstrated that the single-phase/two-phase integrated model can predict macrosegregation in the steel ingots which are deformed during solidification.
1. Introduction
Macrosegregation refers to a non-uniform distribution in local solute composition during the solidification of metal alloys. As a serious defect in steel ingots, it causes a wide variation in the properties and impairs the performance of the final components. Macrosegregation results from the relative motion between the solute-depleted solid phase and solute-enriched liquid phase. The main factors of the relative motion include the thermal-solutal convection, solidification shrinkage, grain sedimentation, and solid deformation [1,2,3].
Considerable effort has been devoted to development of a model for macrosegregation. Single-domain models based on the classical mixture theory [4] or volume averaging method [5] are usually utilized to predict macrosegregation caused by the thermal-solutal convection. These models have been combined with a modified volume of fluid (VOF) method [6] or arbitrary Lagrangian-Eulerian (ALE) method [7] to couple the effect of solidification shrinkage. During recent years, more advanced two-phase or multi-phase models have been developed [8,9,10,11,12,13]. In these models, macroscopic transport phenomena, including the melt flow and grain sedimentation, are coupled with a microscopic solidification mechanism. Ge et al. developed a four-phase dendritic model to predict macrosegregation in a 55-ton steel ingot [11]. In the four-phase model, three factors for the relative motion which had a significant impact on macrosegregation in steel ingots were considered, including the thermal-solutal convection, solidification shrinkage, and grain sedimentation.
Generally, deformation of the solid phase is neglected in the prediction of macrosegregation for the ingot casting process. The reasons for this are as follows. First, since solid deformation in the mushy zone is caused by thermal stresses, shrinkage stresses, and the metallostatic head of steel ingots [1,2], the influence of solid deformation on macrosegregation is negligible compared to other macrosegregation formation mechanisms. Secondly, the modeling of macrosegregation with solid deformation is rather complicated.
Previous studies on the formation mechanism of macrosegregation with solid deformation have mainly been concerned with the continuous casting process. Lesoult et al. [14] derived a formula of segregation rates during solidification with spongy deformation of an alloyed mushy zone. However, this formula could only serve as a qualitative analysis due to the existence of unknown variables. Fachinotti et al. [15] developed a two-phase model considering the thermo-mechanical and macrosegregation during the solidification of a binary alloy. The velocities of the solid and liquid phases were solved concurrently using the ALE approach. The application of the model to the steel continuous casting process retrieved the influence of bulging on the formation of central macrosegregation.
Except for the direct modeling of macrosegregation in the continuous casting process, ingot bending or ingot punching tests were developed to analyze macrosegregation and hot tearing phenomena caused by deformation of the solid phase. These tests consisted of deforming the external solid shell during the solidification of steel ingots [16,17]. Koshikawa et al. [16,17] conducted a series of ingot punching tests on the 450 kg steel ingot. They utilized a two-phase model to simulate the macrosegregation formation during punching of the solidifying steel ingot [17]. The simulation results showed the redistribution of solutes through the central mushy zone of the ingot during punching progress. However, the thermal-solutal convection induced macrosegregation before punching was neglected in the simulation.
During recent years, a method called forging solidifying metal (FSM) has been developed to establish an energy-efficient process chain for ferrous alloy [18,19]. The FSM method, based on semi-solid forming (SSF) technology, consists of deforming the ingot with the mushy core when the solid shell has formed during solidification. Through a combination of the solidification with a large deformation process (LDP) in the two-phase region, the FSM process has the following advantages. Firstly, compared with the traditional methods for grain refinement and porosity elimination in steel ingots, it is more effective in both time and energy consumption due to the reduced heat consumption before forging. Secondly, it has the potential to reduce defects such as macrosegregation and porosity. For the FSM process of the ingots, the deformation of the solid phase is significant and may influence the macrosegregation formation.
Thus far, much progress has been achieved regarding the development of a model for macrosegregation in steel ingots, considering the combined effect of the thermal-solutal convection, solidification shrinkage, and grain sedimentation. However, studies concentrating on macrosegregation with solid deformation are limited. Besides, for ingot punching tests or the FSM process, numerical approaches for macrosegregation during the whole process of solidification and deformation stages are needed.
In this study, a volume-averaged single-phase/two-phase integrated model is developed to predict macrosegregation in steel ingots which are deformed during solidification. The thermal-solutal convection and solid deformation are considered in the model. A 450 kg steel ingot punching test is considered, and macrosegregation during the whole process, including the solidification and deformation stages, is simulated. The macrosegregation evolution caused by the punching of the solid shell is analyzed. The influence of different punching parameters is numerically studied.
2. Model Description and Numerical Approach
In this section, the volume-averaged two-phase model in which the solid deformation and liquid flow are coupled is developed at first. Then, the two-phase model is extended to consider the whole process, including the solidification and deformation stages.
2.1. Volume-Averaged Two-Phase Model
The main assumptions of the two-phase model are as follows:
- The volume-averaging method is utilized to derive the conservation equations for the solid and liquid phases during the solidification of steel ingots;
- For the conservation of mass, energy, and species, the governing equations are derived for the solid-liquid mixture, while for momentum conservation, the solid and liquid phases are considered separately;
- The Boussinesq approximation is utilized to calculate the thermal-solutal buoyancy force. The mushy zone is modeled as an isotropic porous medium saturated with liquid, and the momentum interaction between the solid and liquid phases is described by Darcy law. The permeability is calculated by the Carman-Kozeny formula;
- The densities of the solid and liquid phases are equal, thus solidification shrinkage is omitted;
- The microscopic solidification phenomenon is described by the lever rule;
- The thermophysical properties of the solid and liquid phases are equal and constant;
- The liquid phase is considered as Newtonian. The solid deformation behavior of the mushy zone with a high solid fraction (gs > 0.5) is considered as compressible viscoplastic. For the mushy zone with a low solid fraction, the grain sedimentation is neglected.
With the above assumptions, the governing equations of the two-phase model can be derived. The equations are summarized as follows.
Mass conservation for the mixture:
where vs and vl denote the velocities of the solid and liquid phases, respectively, and gs and gl denote the volume fractions of the solid and liquid phases, respectively, and add up to 1.
Momentum conservation for the liquid phase:
where τl denotes the deviatoric stress tensor in the liquid phase, p denotes the pressure, μl denotes the dynamic viscosity of the liquid phase, K denotes the permeability defined by the Carman-Kozeny model, denotes the liquid density in the buoyancy term, g denotes the gravity vector, ρ is the density, and t is the time. The definitions of τl, K, and , are as follows:
where denotes the strain rate tensor of the liquid phase, I denotes the second-order unit tensor, λ2 denotes the secondary dendrite arm spacing, βT denotes the thermal expansion coefficient, T denotes the temperature, denotes the solutal expansion coefficient for solute i, and wi denotes the average concentration for solute i.
Momentum conservation for the solid phase:
where τs denotes the deviatoric stress tensor in the solid phase, which is defined by the constitutive model of the solid phase. The inertia terms are neglected due to the low velocity of the solid phase.
Energy conservation for the mixture:
where cp denotes the specific heat, k denotes the thermal conductivity, and L denotes the latent heat.
Species conservation of solute i for the mixture:
where ws,i and wl,i denote the concentrations for solute i in the solid and liquid phases, respectively, and Dl denotes the diffusion coefficient in the liquid phase.
To solve the solid momentum conservation equation, the constitutive model for the solid phase should be developed. Experimental results show that the ingot exhibits viscoplastic behavior at a high temperature [20]. In this study, the NFS model [20] proposed by Nguyen-Favier-Suéry is used to describe the viscoplastic deformation behavior of the solid phase in the mushy zone, which is summarized as follows.
where denotes the apparent viscosity of the solid phase, α and β are two empirical coefficients [20] related to the solid volume fraction gs, denotes the strain rate tensor in the solid phase, Kν denotes the viscoplastic consistency, denotes the equivalent strain rate in the solid phase, and m denotes the strain rate sensitivity.
The above viscoplastic model for the solid phase applies for the mushy zone with a high solid fraction and can be extended to the fully solidified state. However, the extension of the model to the fully liquid region is impossible. Therefore, the two-phase model can only be used for the deformation stage when the fully liquid state does not exist inside the ingot.
2.2. Extension to the Single-Phase/Two-Phase Integrated Model
As previously stated, the two-phase model coupling the solid deformation and liquid flow does not apply for the early solidification stage when the fully liquid region exists inside the ingot. Therefore, to simulate macrosegregation formed during the whole process of the ingots which are deformed during solidification, a single-phase/two-phase integrated model is extended from the two-phase model. The extension of the two-phase model is briefly introduced as follows. First, a deformation flag indicating whether the ingot is being deformed is added. During the deformation stage, the deformation flag is true, and the two-phase model (Equations (1)–(15)) is utilized to predict macrosegregation with solid deformation. Otherwise, before or after the deformation stage, the deformation flag is false and the deformation of the solid phase is neglected. The momentum conservation equation for the solid phase (Equation (6)) can be neglected and the solid velocity vs is set to zero. Then, the two-phase model can be reduced to a single-phase model governed by Equations (1)–(5) and (7) and (8), which is commonly used to predict macrosegregation caused by the thermal-solutal convection.
The finite element method is adopted to solve the single-phase/two-phase integrated model. The ALE formulations are adopted for the conservation equations. The mesh is attained by the solid phase during deformation. The Streamline-Upwind/Petrov-Galerkin (SUPG) method is utilized to stabilize the convection terms in the conservation equations for liquid momentum, energy, and species. For the single-phase model, a stabilized pressure correction method developed by the authors [7] is adopted to solve the coupling between the liquid velocity and pressure. For the two-phase model, the solid velocity, liquid velocity, and pressure are coupled, so a stabilized multi-phase pressure correction method is utilized. The segregated algorithm is adopted to solve the coupling between the conservation equations of the model. Figure 1 shows the algorithm for the single-phase/two-phase integrated model, which is detailed as follows:
- Initialize the variables of the current time step with those of the previous time step;
- Determine whether it is in the deformation stage based on the current time t, the deformation start time ts, and the deformation duration ∆td. If ts + ∆td > t > ts, the deformation flag is true. Otherwise, it is false;
- If the deformation flag is true, the stabilized multi-phase pressure correction method is utilized to solve Equations (1)–(6) and (9)–(15). Otherwise, the stabilized pressure correction method is used to solve Equations (1)–(5), where the solid velocity is zero;
- Solve the non-linear energy conservation equation (Equation (7)) with the Newton–Raphson method;
- Solve the non-linear species conservation equation (Equation (8)) with the Newton–Raphson method;
- Calculate the difference in liquid velocity, temperature, and solute concentration between two adjacent iterations. If they are not converged, return to step 3;
- If the deformation is true, update the mesh according to the solid velocity;
- Advance the time to the next time step.
3. Results
3.1. 450 kg Steel Ingot Punching Test and Simulation Setup
A 450 kg steel ingot punching test [17], as shown in Figure 2a, is considered in this study. The ingot is 0.16 m in thickness, 0.5 m in width, and 0.75 m in height. The process of the ingot punching test is as follows. First, the molten steel was poured into the mold from the top at the temperature of about 1640 °C. At a certain time after filling, when the steel ingot was not fully solidified, the top right mold was removed. Then, the ingot was punched by a horizontal cylindrical tool. The punching started at the final stage of solidification, when no fully liquid domain remained in the ingot. A thermocouple TC-1 was placed in the center of the ingot to measure the temperature evolution of the ingot.
In this study, macrosegregation during the whole solidification and deformation process of the ingot punching test is simulated using the single-phase/two-phase integrated model. A 2D simulation is conducted along the transverse mid-section of the ingot, as shown in Figure 2b. For simplicity, only the ingot is considered in the simulation. The heat extraction of the ingot through the mold is modeled by applying a Fourier-type boundary condition. The top surface is assumed to be adiabatic. The punching on the ingot is modeled by applying a velocity load to part of the right boundary at the mid-height (shown as the red line segment in Figure 2b). Besides, the filling process is neglected, and an initial temperature of 1550 °C is assumed for the ingot. Due to the short duration of punching, the effect of solidification on macrosegregation is negligible compared to the punching effect. Thus, solidification during the punching process is neglected. This simplification can eliminate the influence of solidification when analyzing macrosegregation during punching progress.
An Fe-0.2% C-1.5% Mn ternary alloy is considered. The phase diagram of the Fe-C-Mn ternary alloy system is calculated using Thermo-Calc software. The parameters of the solid constitutive model for the alloy at a high temperature are obtained from the literature [17]. The computation parameters used in the current simulation are shown in Table 1 [17]. A structured triangular mesh with the mesh size of 5 mm is used and the total element number is 9600. The time step is 0.01s.
Figure 3 shows the comparison of the temperature evolutions close to the ingot center predicted by the present study with the measurements and predictions by Koshikawa et al. [17]. Except for the fact that the filling process is neglected in the simulation, the predicted curve of the cooling history is in good agreement with the measurements and reference predictions. This demonstrates the accuracy of the temperature predictions.
3.2. Initial Soldification Stage Before Punching Starts
Figure 4 and Figure 5 show the temperature, solid volume fraction, liquid flow, and C concentration of the ingot at solidification times of t = 100 s and 700 s. Due to the cooling of the mold, the ingot solidifies from the bottom and lateral sides, as indicated by the distributions of the temperature (Figure 4a) and solid volume fraction (Figure 4b). Figure 4c shows the distribution of C concentration, with convection flow predicted by the single-phase volume-averaged model. At time t = 100 s, the solidification progress is not much advanced in the ingot, and a complicated liquid flow with several large vortexes forms along the vertical direction in the liquid region of the ingot. Besides, the distributions of the liquid velocity vector and C concentration are not strictly symmetrical along the centerline of the ingot, which may result from the instability of melt flow during solidification.
As solidification progresses, at the solidification time t = 700 s, the temperature continues to decrease and the liquid region in the ingot gradually disappears. Most of the ingot has completely solidified, and a narrow deep mushy core forms in the central region of the ingot. The convection flow in the ingot turns rather weak, as shown by the liquid velocity vector zoomed 2000 times in Figure 5c. In the mushy core, the remaining liquid is enriched in C, and positive segregation forms there.
Figure 6 shows the state of the ingot before punching starts at the solidification time t = 720 s. The values of local solid volume fractions for the whole ingot are all above 0.5, as shown in Figure 6a. The relative concentrations ((wi−wi,0)/wi,0) for C and Mn are calculated to represent the segregation intensity of the ingot, as shown in Figure 6b,c. The macrosegregation patterns for C and Mn are similar to each other: negative segregation forms beside the vertical walls at the top of the ingot and positive segregation occupies about 8/9 of the centerline from the top surface. However, the segregation intensity for Mn is much smaller than that for C. The reason for this is that the solute partition coefficient of Mn is larger (kp[C] = 0.162 < kp[Mn] = 0.703), so the solute enrichment is less serious for Mn.
3.3. Punching Stage
In the simulation, the solid shell is punched by a simplified rectangular punching tool. Figure 7 shows the evolution of the horizontal component of the solid velocity, vs, representing the leftward displacement of the solid phase. Due to the motion of the punching tool, both the solid shell and the mushy core are displaced; at the same time, a relative liquid flow is induced in the ingot. Figure 8 shows the relative velocity vector vl–vs and the vertical component of vl–vs at different times after punching starts. The relative velocity vector in Figure 8 is only distributed in the center mushy core and equals zero in the solid shell. This validates the extension of the two-phase model to the fully solid state. Besides, the liquid in the mushy core flows upwards basically in the vertical direction and is expelled out of the top surface of the ingot. This is because that the ingot surface is an open boundary for the liquid flow due to the thermal insulation effect. The predicted liquid expulsion phenomenon is consistent with the experimental result of the ingot test, in which the melt is expelled at the top surface into the primary shrinkage cavity. In the simulation, the liquid expelled out of the surface will no longer be considered, and thus the total mass in the computation domain reduces during the punching process. It should be noted that the relative liquid flow is caused by the punching effect, since the liquid flow due to the thermal-solutal convection is almost negligible (Figure 5c). Besides, the max relative velocity during the punching process is much larger than the punching velocity (2 mm/s).
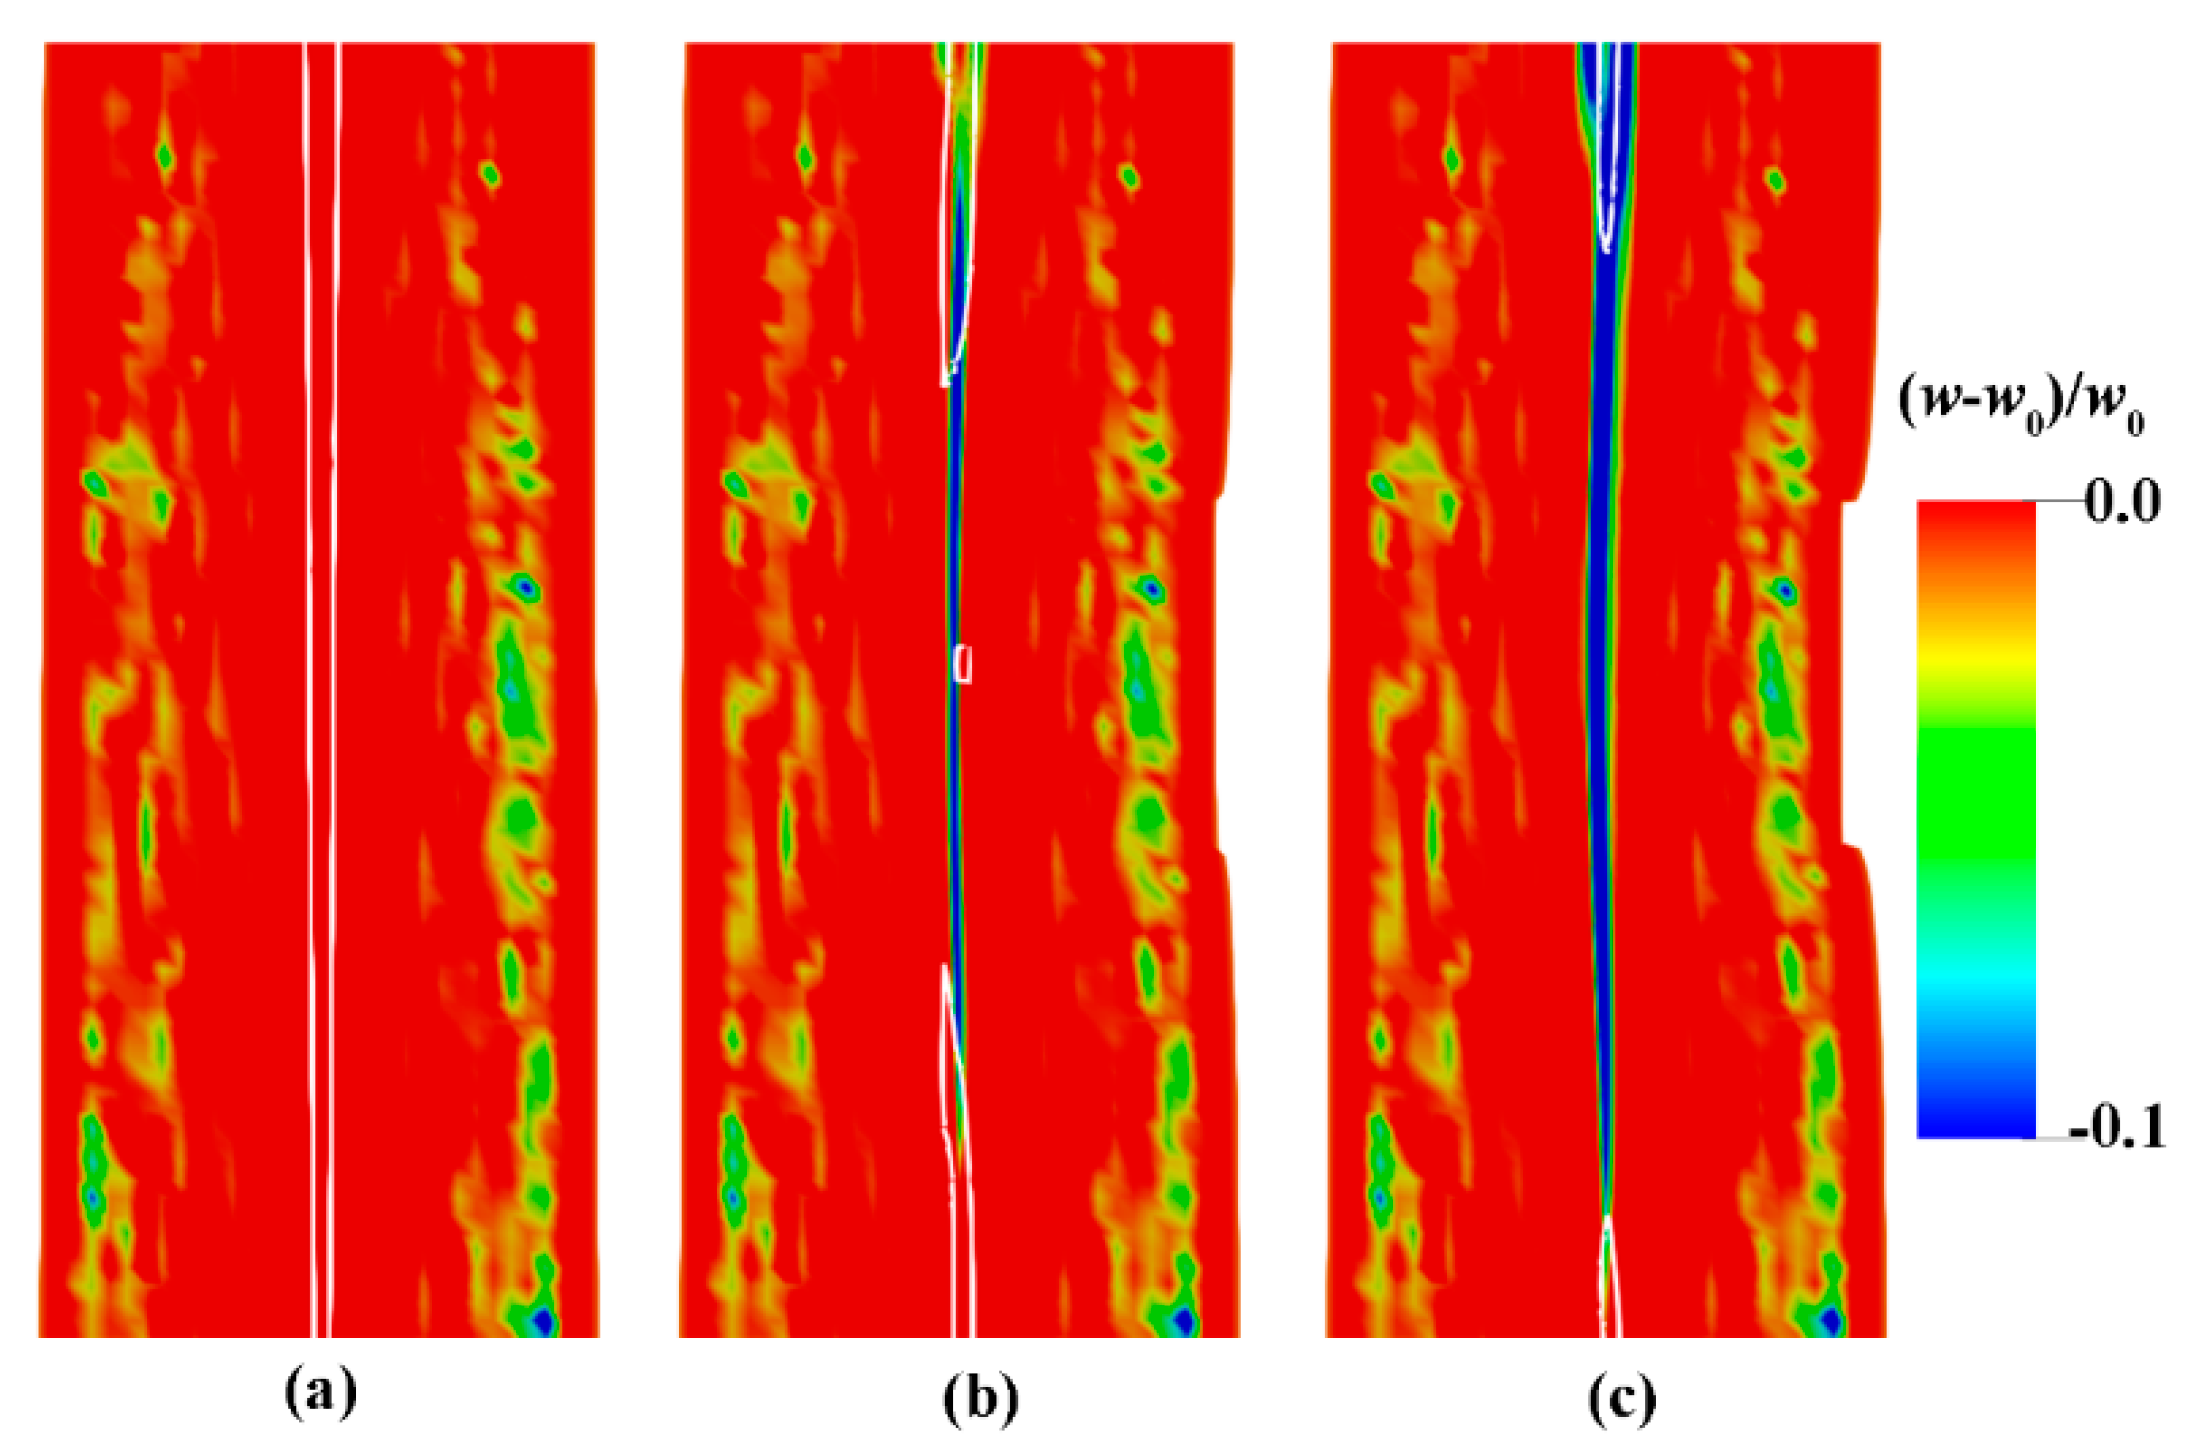
Figure 9 shows the evolution of the relative concentration of C at punching height after punching starts. The solid volume fraction contour of 0.8 is also plotted on the figure to show the evolution of the solid fraction caused by the punching effect. As punching progresses, the liquid volume fraction in the mushy zone reduces, and negative segregation gradually forms in the mushy core at punching height. The formation mechanism of negative segregation will be discussed in the following section.
Figure 10 shows the comparison of the relative concentration of Mn along the horizontal section line at punching height predicted by the present study with the measurements and predictions presented by Koshikawa et al. [17]. Qualitatively, the predicted final segregation profile agrees with the measurements and the reference predictions. The negative segregation trend for Mn in the central region of the ingot is predicted in this study. However, the intensity of the negative segregation is underestimated. This discrepancy may be due to the type of microsegregation model and the constitutive model and parameters controlling the compression of the solid phase in the mushy zone [17].
4. Discussion
4.1. Formation Mechanism of Macrosegregation With Deformation
As stated earlier, when the solid shell of the ingot is being punched, a relative liquid flow will form in the mushy core of the ingot. Figure 11 shows in more detail the motions of the solid and liquid phases at punching height at 6 s after punching starts. The solid shell is displaced due to the punching effect, as shown by the horizontal component of the solid velocity vs in Figure 11a. The divergence of the solid velocity, ∇⋅vs, denotes the volumetric strain rate of the solid phase. The positive and negative values of ∇⋅vs indicate, respectively, the expansion and compression of the solid phase in the mushy zone. Figure 11b indicates that the solid phase in the mushy zone at punching height is in a compression state. This compression causes a relative liquid flow out of the compression region, as shown in Figure 11c.
Before punching starts, positive segregation forms in the mushy zone at punching height (Figure 6), and then turns into negative segregation as punching progresses (Figure 9 and Figure 10). The formation mechanism of negative segregation can be explained as follows.
In this study, the equilibrium rule is assumed for the microscopic solidification phenomenon. Therefore, the average concentration for solute i can be expressed by Equation (16):
where kp,i is the partition coefficient for solute i. In the mushy zone, the solid phase is solute-depleted and the liquid phase is solute-enriched. Due to the thermal-solutal convection, the average concentration in the mushy core is higher than the nominal composition before punching starts. As stated in Section 3.1, solidification as punching progresses is neglected, and the temperature remains unchanged as punching progresses. Therefore, the concentration of solute i in the liquid phase defined as wl,i = (T − Tf)/mi remains unchanged. Therefore, the average concentration for solute i is determined by the solid fraction gs. As punching progresses, the relative liquid flow out of the mushy core at punching height increases the local solid fraction (Figure 9). Therefore, according to Equation (16), the average solute concentration decreases (kp,i < 1). This can explain the transition from positive segregation to negative segregation in the mushy core at punching height.
4.2. Influence of the Punching Parameters
The punching parameters, including the punching start time and punching velocity, may influence the relative liquid flow and macrosegregation evolution during the punching process. In order to quantitatively represent the intensity of the relative liquid flow and the magnitude of segregation evolution, two parameters are defined. The first is the maximum relative velocity in the ingot, denoted by (v − vs)max, and the second is the minimum relative concentration of C along the horizontal section line at punching height, denoted by ((w − w0)/w0)min, which is negative due to the punching effect. The greater the maximum relative velocity, the more intense the relative liquid flow. The smaller the relative concentration of C, the larger the segregation evolution.
First, the influence of punching start time is investigated. For the punching start time, three cases are added based on the original punching start time, in which punching starts 20 s earlier, 20 s later, and 40 s later, respectively. A punching velocity of 2 mm/s and a total punching time of 6.5 s are used for all the four cases. The total punching displacement is 13 mm.
Figure 12 shows the evolution of the maximum relative velocity using different punching start times. As punching starts earlier, the maximum relative velocity increases, and the relative liquid flow becomes stronger. The reason for this can be explained as follows. The solid compression in the mushy zone is the driving force for the relative liquid flow. According to the solid constitutive model (Equations (9)–(15)), the compressibility of the solid phase in the mushy zone is negatively correlated with the solid fraction. Besides, the Darcy resistance force decreases with the solid fraction. When punching starts earlier, the solid fraction of the mushy core decreases and the compressibility of the mushy zone and the driving force of liquid flow increase, but the Darcy resistance force decreases, so the relative liquid flow grows stronger.
For different punching start times, the trends of the maximum relative velocity evolution with time are different. For the cases in which punching starts 20 s later and 40 s later, as punching progresses, the maximum relative velocity increases. However, when punching starts early (the original punching start time or 20 s earlier), as punching progresses, the maximum relative velocity increases first and then decreases. The reason for this can be explained as follows. The relative liquid flow is driven by the solid deformation and resisted by the Darcy term. When punching starts later, the solid deformation driving force dominates, so the relative liquid flow is enhanced as punching progresses. When punching starts early, the solid deformation driving force dominates at first and later the Darcy term dominates, so the liquid flow first increases and then weakens.
Figure 13 shows the evolution of ((w − w0)/w0)min with time using different punching start times. As punching starts later, the magnitude of ((w − w0)/w0)min decreases, and the influence on macrosegregation weakens. The reason for this is that when punching starts later, the liquid phase in the mushy zone remains less, and the relative liquid flow is weakened (Figure 12). Therefore, the amount of solute-enriched liquid phase flowing out of the mushy zone reduces and the magnitude of ((w − w0)/w0)min decreases. Besides, as punching progresses, the magnitude of ((w − w0)/w0)min increases. The formation of negative segregation is caused by the outflow of the solute-rich liquid phase. As punching progresses, the solute-rich liquid phase continuously flows out of the mushy core, so the degree of negative segregation gradually increases.
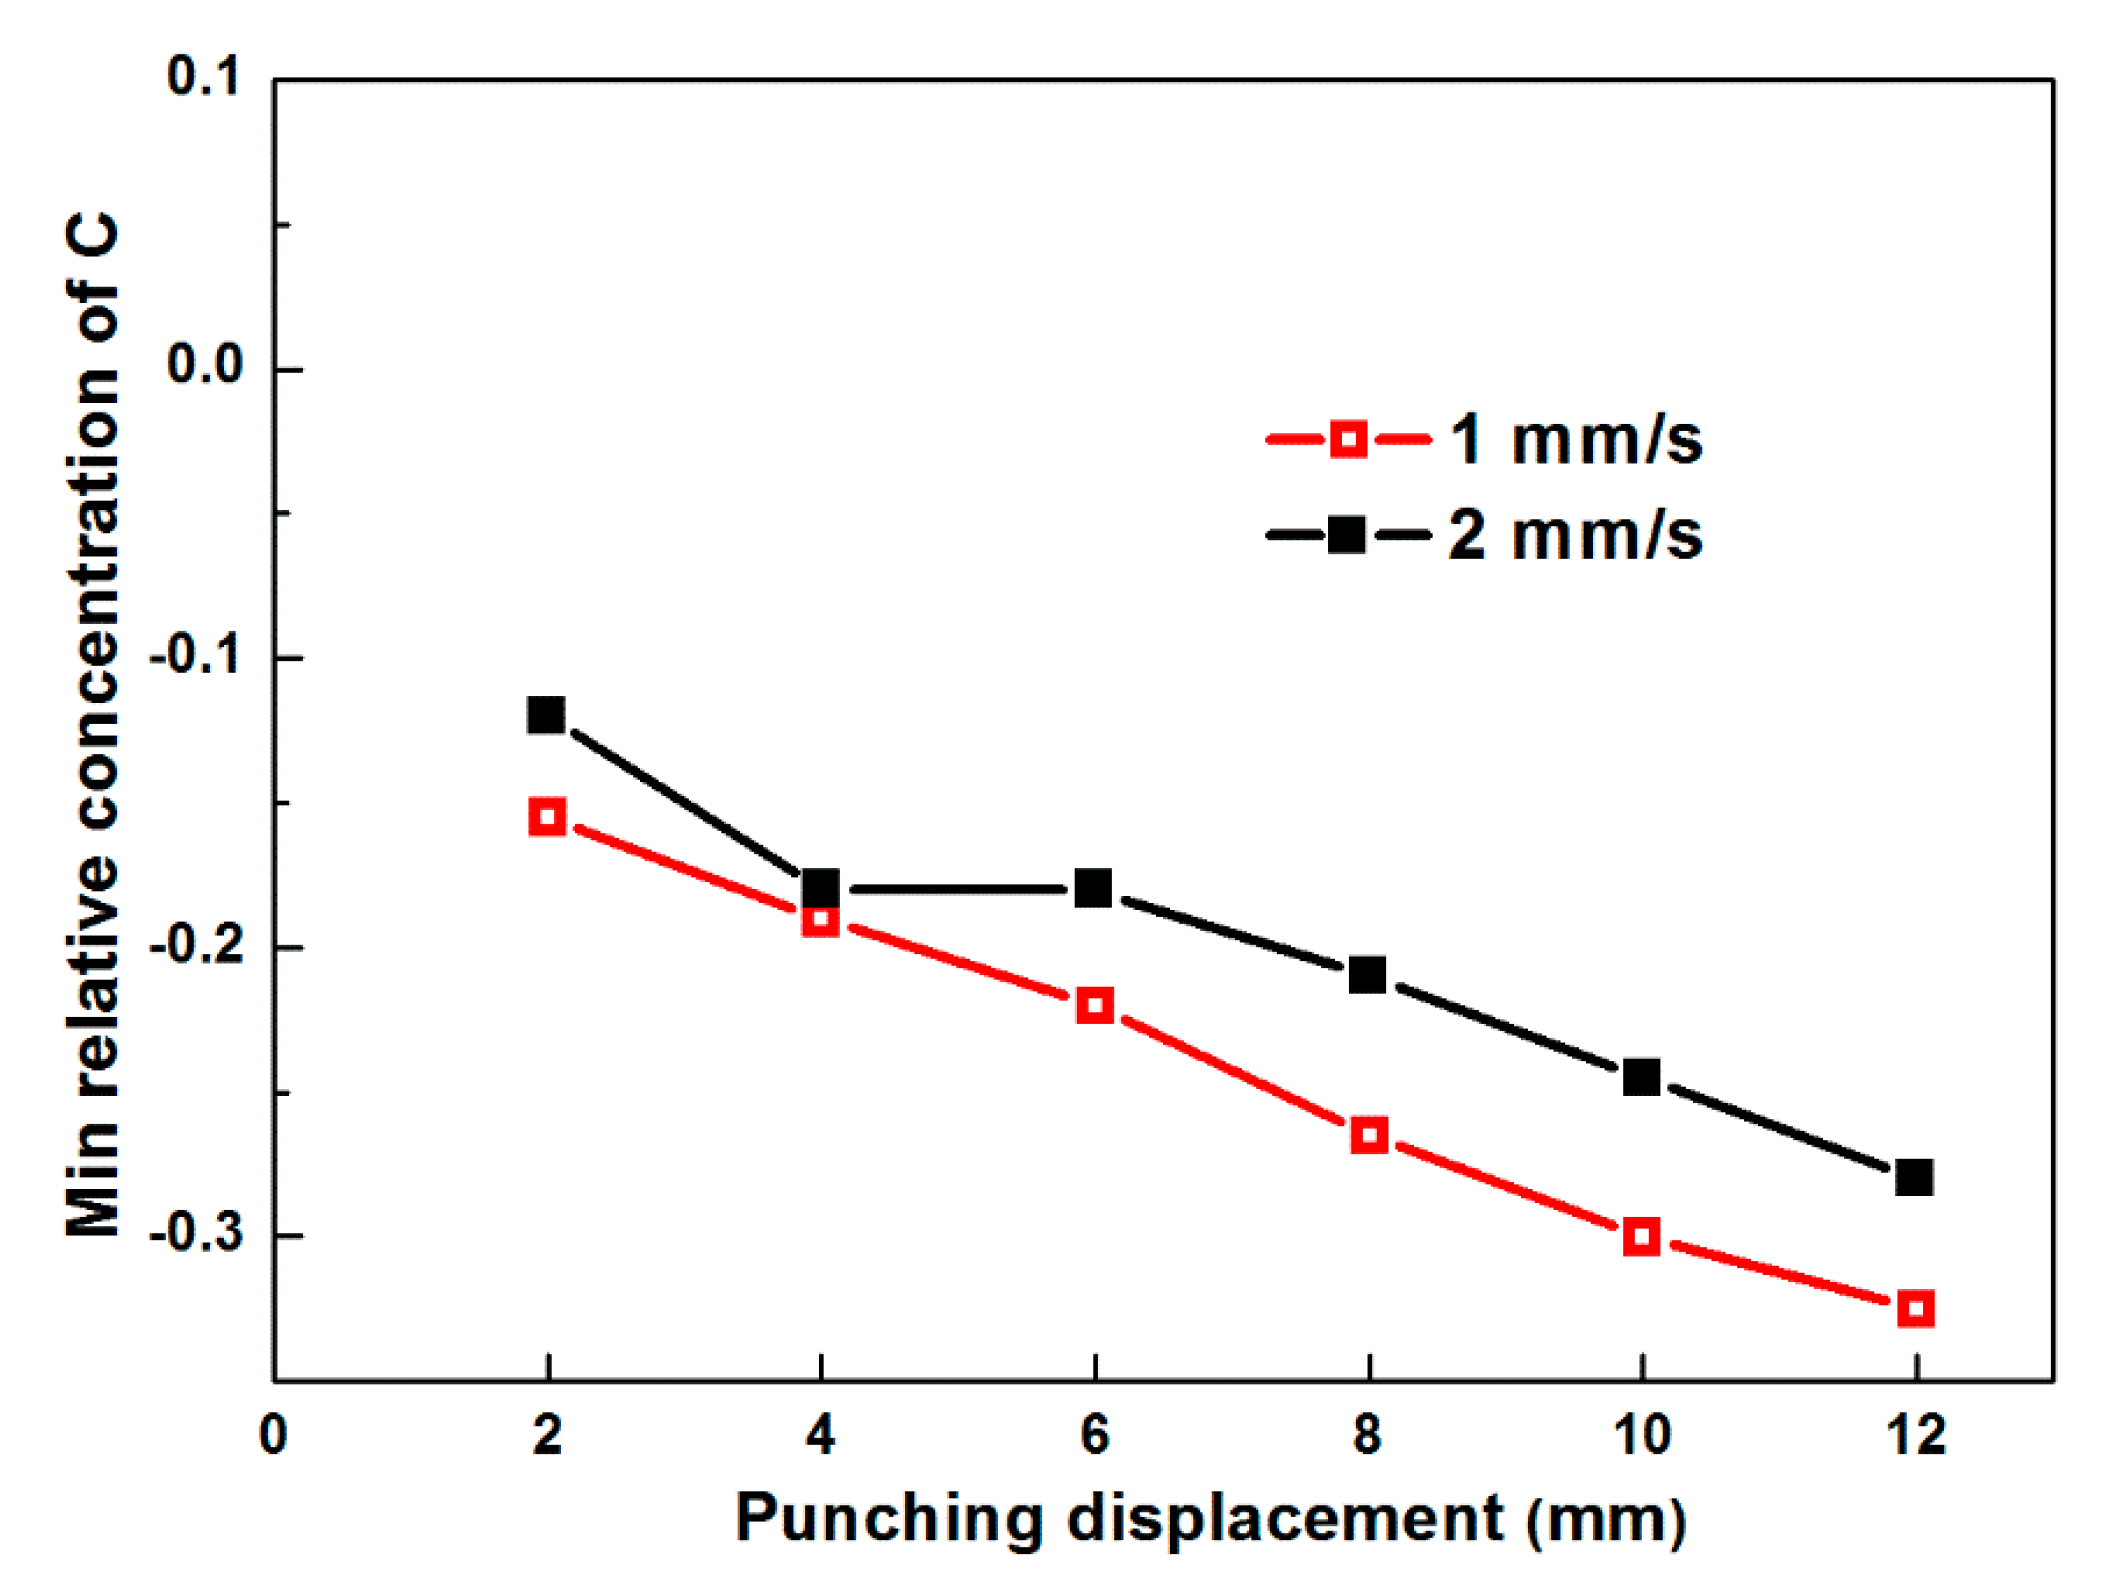
Figure 14 shows the evolution of ((w − w0)/w0)min with punching displacement using different punching velocities. The same punching start time and total punching distance are used. When the punching displacement is equal, the minimum relative concentration using the low punching velocity (1 mm/s) is smaller than that using the punching velocity of 2 mm/s. The reason for this can be explained as follows. The degree of negative segregation in the mushy core at punching height depends on the amount of extruded liquid phase. The greater the extruded liquid phase, the more serious the negative segregation in the mushy core at punching height. When a slow punching velocity is used (1 mm/s), for the same punching distance, the punching time is two times that when using the punching velocity of 2 mm/s. However, the time-averaged maximum relative velocities using the slow and high punching velocities are 0.0183 m/s and 0.0304 m/s, and the velocity ratio (0.0304/0.0183 = 1.66) is less than 2. Thus, for the low velocity case, there is more liquid phase flowing out at the same punching distance, and the negative segregation in the mushy core will become more serious. In general, at the same punching distance, a slow punching velocity increases the effect of punching on the macrosegregation evolution.
5. Conclusions
A single-phase/two-phase integrated model has been developed to investigate macrosegregation in steel ingots which are deformed during solidification. The thermal-solutal convection and solid deformation are involved in the model. To consider the deformation of the solid phase in the mushy zone, a two-phase model is proposed based on the volume averaging method. Since the two-phase model does not apply for the fully liquid region, an extension of the two-phase model is made to consider the early solidification stage before deformation. Before or after the deformation stage, the two-phase model is degenerated to a single-phase model accounting for the thermal-solutal convection-induced macrosegregation by neglecting the solid motion. The integrated single-phase/two-phase model is utilized to predict macrosegregation during the whole process of a 450 kg steel ingot punching test. The relative motion of the solid and liquid phases, as well as macrosegregation formation, is studied. The formation mechanism of macrosegregation with solid deformation is analyzed. The results show that the compression of the solid phase in the mushy zone leads to a relative liquid flow in the mushy zone of the ingot. This in turn leads to a decrease of solute concentration in the compressed region of the mushy zone. The effects of the punching start time and punching velocity on macrosegregation are investigated. The later the punching starts, the larger the punching velocity, and the smaller the effect on the macrosegregation evolution will be. It is demonstrated that the single-phase/two-phase integrated model can predict the macrosegregation evolution during the whole process of ingots, which are deformed during solidification.
Author Contributions
Conceptualization, K.C. and H.S.; methodology, K.C.; software, K.C.; validation, K.C.; formal analysis, K.C. and H.S.; investigation, K.C. and H.S.; resources, K.C.; data curation, K.C.; writing—original draft preparation, K.C.; writing—review and editing, K.C. and H.S.; visualization, K.C. and H.S.; supervision, H.S.; project administration, H.S.; funding acquisition, H.S.
Funding
This research was funded by the National Natural Science Foundation, grant number U1508215.
Conflicts of Interest
The authors declare no conflict of interest.
References
- Flemings, M.C. Our understanding of macrosegregation: past and present. ISIJ Int. 2000, 40, 833–841. [Google Scholar] [CrossRef]
- Beckermann, C. Modelling of macrosegregation: applications and future needs. Int. Mater. Rev. 2002, 47, 243–261. [Google Scholar] [CrossRef]
- Ludwig, A.; Wu, M.; Kharicha, A. On macrosegregation. Metall. Mater. Trans. A 2015, 46, 4854–4867. [Google Scholar] [CrossRef]
- Bennon, W.D.; Incropera, F.P. A continuum model for momentum, heat and species transport in binary solid-liquid phase change systems—I. Model formulation. Int. J. Heat Mass Tran. 1987, 30, 2161–2170. [Google Scholar] [CrossRef]
- Beckermann, C.; Viskanta, R. Double-diffusive convection during dendritic solidification of a binary mixture. PhysicoChem. Hydrodyn. 1988, 10, 195–213. [Google Scholar]
- Zhang, S.; Yanke, J.R.; Johnson, D.; JM Krane, M. Modeling defects in castings using a volume of fluid method. Int. J. Numer. Method H 2014, 24, 468–482. [Google Scholar] [CrossRef]
- Chen, K.; Shen, H. Numerical simulation of macrosegregation caused by thermal-solutal convection and solidification shrinkage Using ALE Model. Acta Metall. Sin. (Engl. Lett.). (accepted). [CrossRef]
- Wu, M.; Ludwig, A. Modeling equiaxed solidification with melt convection and grain sedimentation—I: Model description. Acta Mater. 2009, 57, 5621–5631. [Google Scholar] [CrossRef]
- Wu, M.; Fjeld, A.; Ludwig, A. Modelling mixed columnar-equiaxed solidification with melt convection and grain sedimentation—Part I: Model description. Comp. Mater. Sci. 2010, 50, 32–42. [Google Scholar] [CrossRef]
- Tu, W.; Duan, Z.; Shen, B.; Shen, H.; Liu, B. Three-dimensional simulation of macrosegregation in a 36-ton steel ingot using a multicomponent multiphase model. JOM-US 2016, 68, 3116–3125. [Google Scholar] [CrossRef]
- Ge, H.; Ren, F.; Li, J.; Han, X.; Xia, M.; Li, J. Four-phase dendritic model for the prediction of macrosegregation, shrinkage cavity, and porosity in a 55-ton ingot. Metall. Mater. Trans. A 2017, 48, 1–12. [Google Scholar] [CrossRef]
- Wu, M.; Ludwig, A.; Kharicha, A. A four phase model for the macrosegregation and shrinkage cavity during solidification of steel ingot. Appl. Math. Model. 2017, 41, 102–120. [Google Scholar] [CrossRef]
- Nguyen, T.T.M.; Gandin, C.A.; Combeau, H.; Založnik, M.; Bellet, M. Finite element multi-scale modeling of chemical segregation in steel solidification taking into account the transport of equiaxed grains. Metall. Mater. Trans. A 2018, 49, 1725–1748. [Google Scholar] [CrossRef]
- Lesoult, G.; Gandin, C.; Niane, N.T. Segregation during solidification with spongy deformation of the mushy zone. Acta Mater. 2003, 51, 5263–5283. [Google Scholar] [CrossRef]
- Fachinotti, V.D.; Le Corre, S.; Triolet, N.; Bobadilla, M.; Bellet, M. Two-phase thermo-mechanical and macrosegregation modelling of binary alloys solidification with emphasis on the secondary cooling stage of steel slab continuous casting processes. Int. J. Numer. Meth. Eng. 2006, 67, 1341–1384. [Google Scholar] [CrossRef] [Green Version]
- Koshikawa, T.; Bellet, M.; Gandin, C.; Yamamura, H.; Bobadilla, M. Study of hot tearing during steel solidification through ingot punching test and its numerical simulation. Metall. Mater. Trans. A 2016, 47, 4053–4067. [Google Scholar] [CrossRef]
- Koshikawa, T.; Bellet, M.; Gandin, C.A.; Yamamura, H.; Bobadilla, M. Experimental study and two-phase numerical modeling of macrosegregation induced by solid deformation during punch pressing of solidifying steel ingots. Acta Mater. 2017, 124, 513–527. [Google Scholar] [CrossRef]
- Guo, Y.; Liu, W.; Sun, M.; Xu, B.; Li, D. A method based on semi-solid forming for eliminating coarse dendrites and shrinkage porosity of H13 tool steel. Metals-Basel 2018, 8, 277. [Google Scholar] [CrossRef]
- Guo, Y.; Cao, Y.; Sun, M.; Xu, B.; Li, D. Effects of liquid fraction on the microstructure and mechanical properties in forge solidifying 12Cr1MoV steel. J. Mater. Process. Tech. 2018, 256, 25–35. [Google Scholar] [CrossRef]
- Nguyen, T.G.; Favier, D.; Suery, M. Theoretical and experimental study of the isothermal mechanical behaviour of alloys in the semi-solid state. Int. J. Plasticity 1994, 10, 663–693. [Google Scholar] [CrossRef]
Figure 1.
Schematic of the solution algorithm for the single-phase/two-phase integrated model.

Figure 2.
Schematic [17] (a) and 2D computation domain (b) of the 450 kg steel ingot punching test. The configuration shown in (a) is half of the setup. A thermocouple (TC-1) is placed at coordinates (0, 0.43, 0.06).
Figure 2.
Schematic [17] (a) and 2D computation domain (b) of the 450 kg steel ingot punching test. The configuration shown in (a) is half of the setup. A thermocouple (TC-1) is placed at coordinates (0, 0.43, 0.06).

Figure 3.
Comparison of the cooling history at the location of the thermocouple TC-1.
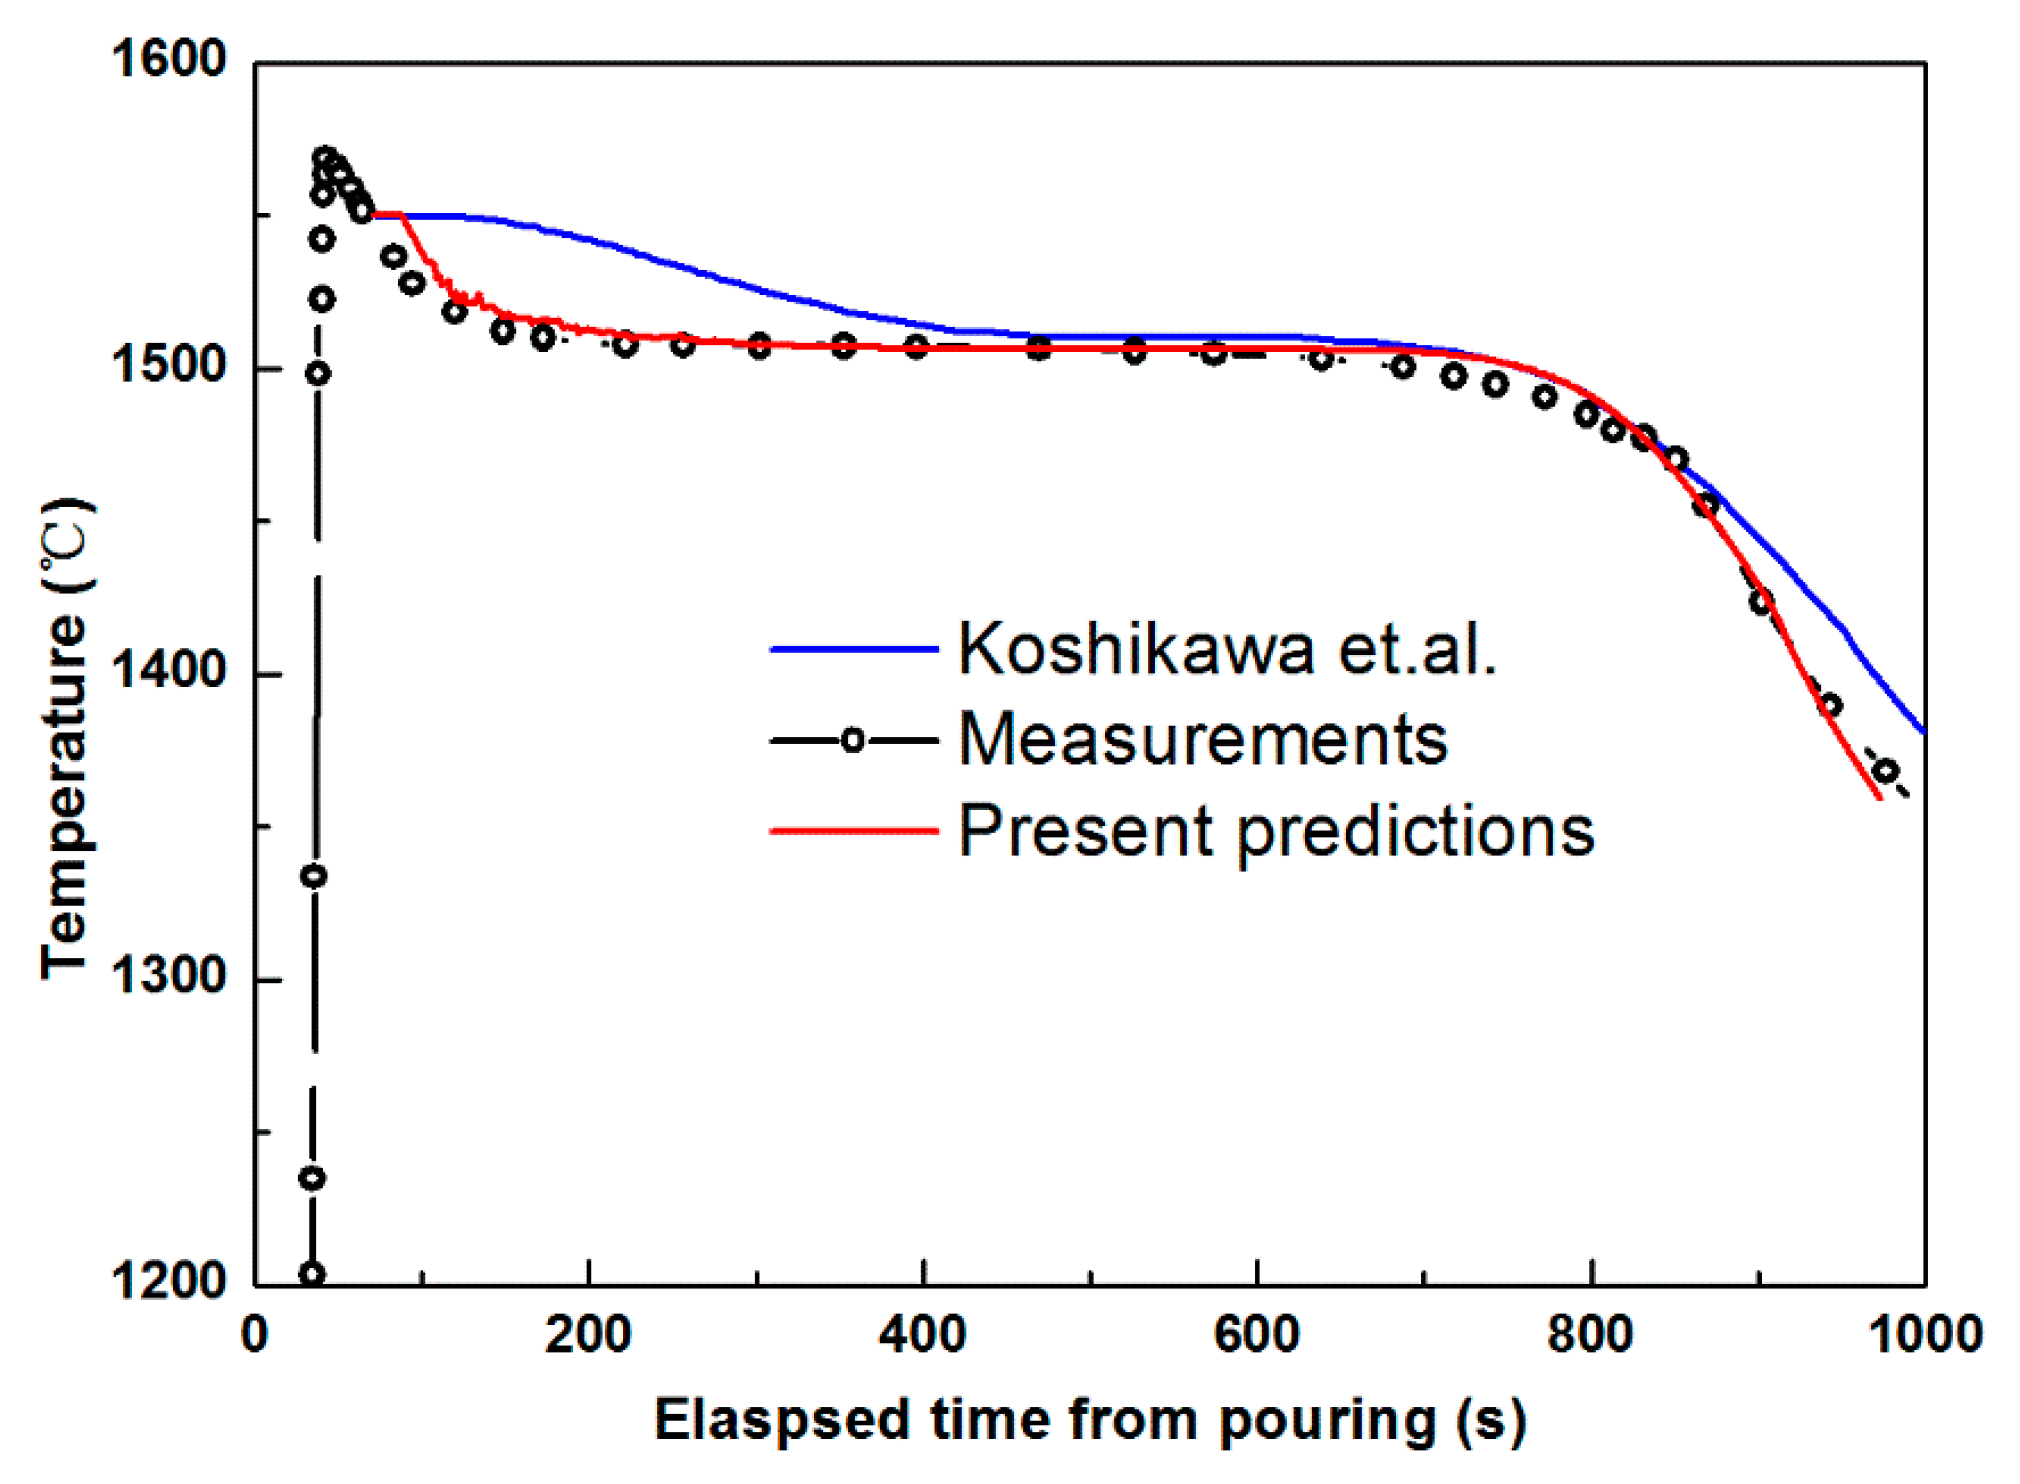
Figure 4.
The predicted temperature (a), solid volume fraction (b), liquid velocity, and C concentration (c) of the steel ingot at the solidification time t = 100 s. The two white lines in (c) represent the solid volume fraction contours of 0.1 and 0.9.
Figure 4.
The predicted temperature (a), solid volume fraction (b), liquid velocity, and C concentration (c) of the steel ingot at the solidification time t = 100 s. The two white lines in (c) represent the solid volume fraction contours of 0.1 and 0.9.
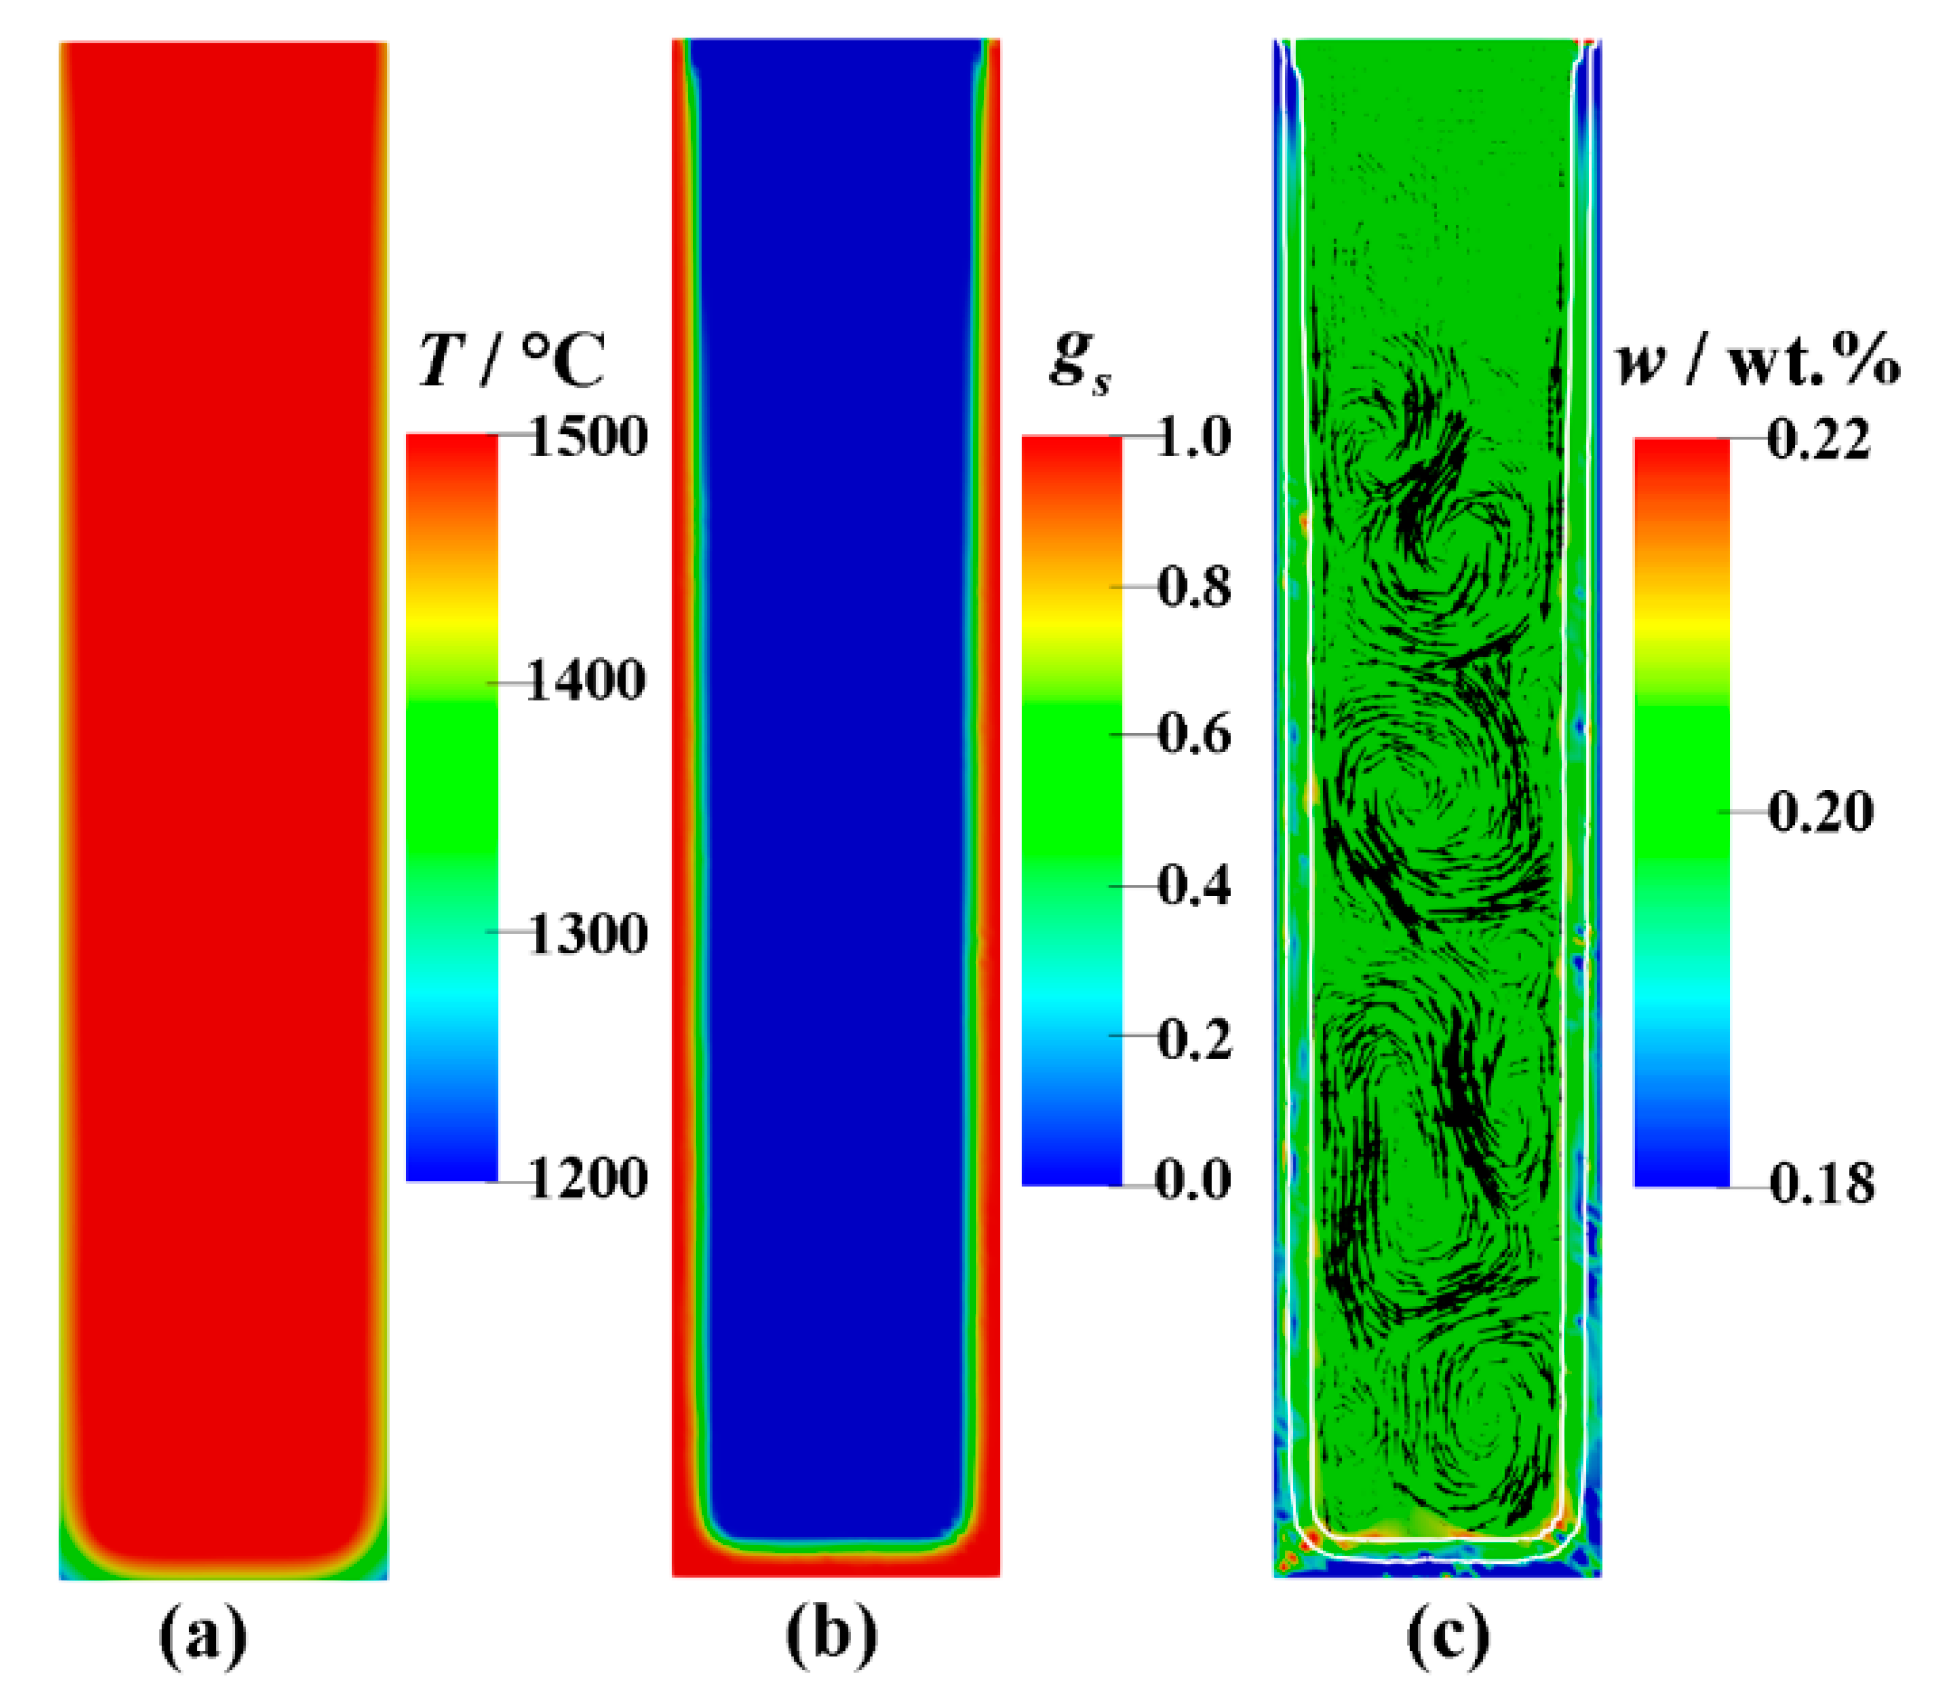
Figure 5.
The predicted temperature (a), solid volume fraction (b), liquid velocity, and C concentration (c) of the steel ingot at the solidification time t = 700 s. The two white lines in (c) represent the solid volume fraction contours of 0.1 and 0.9. The velocity vector zoomed 2000 times is indicated.

Figure 6.
The predicted solid volume fraction (a), relative concentrations for C (b), and Mn (c) in the steel ingot when the top right mold was removed.
Figure 6.
The predicted solid volume fraction (a), relative concentrations for C (b), and Mn (c) in the steel ingot when the top right mold was removed.
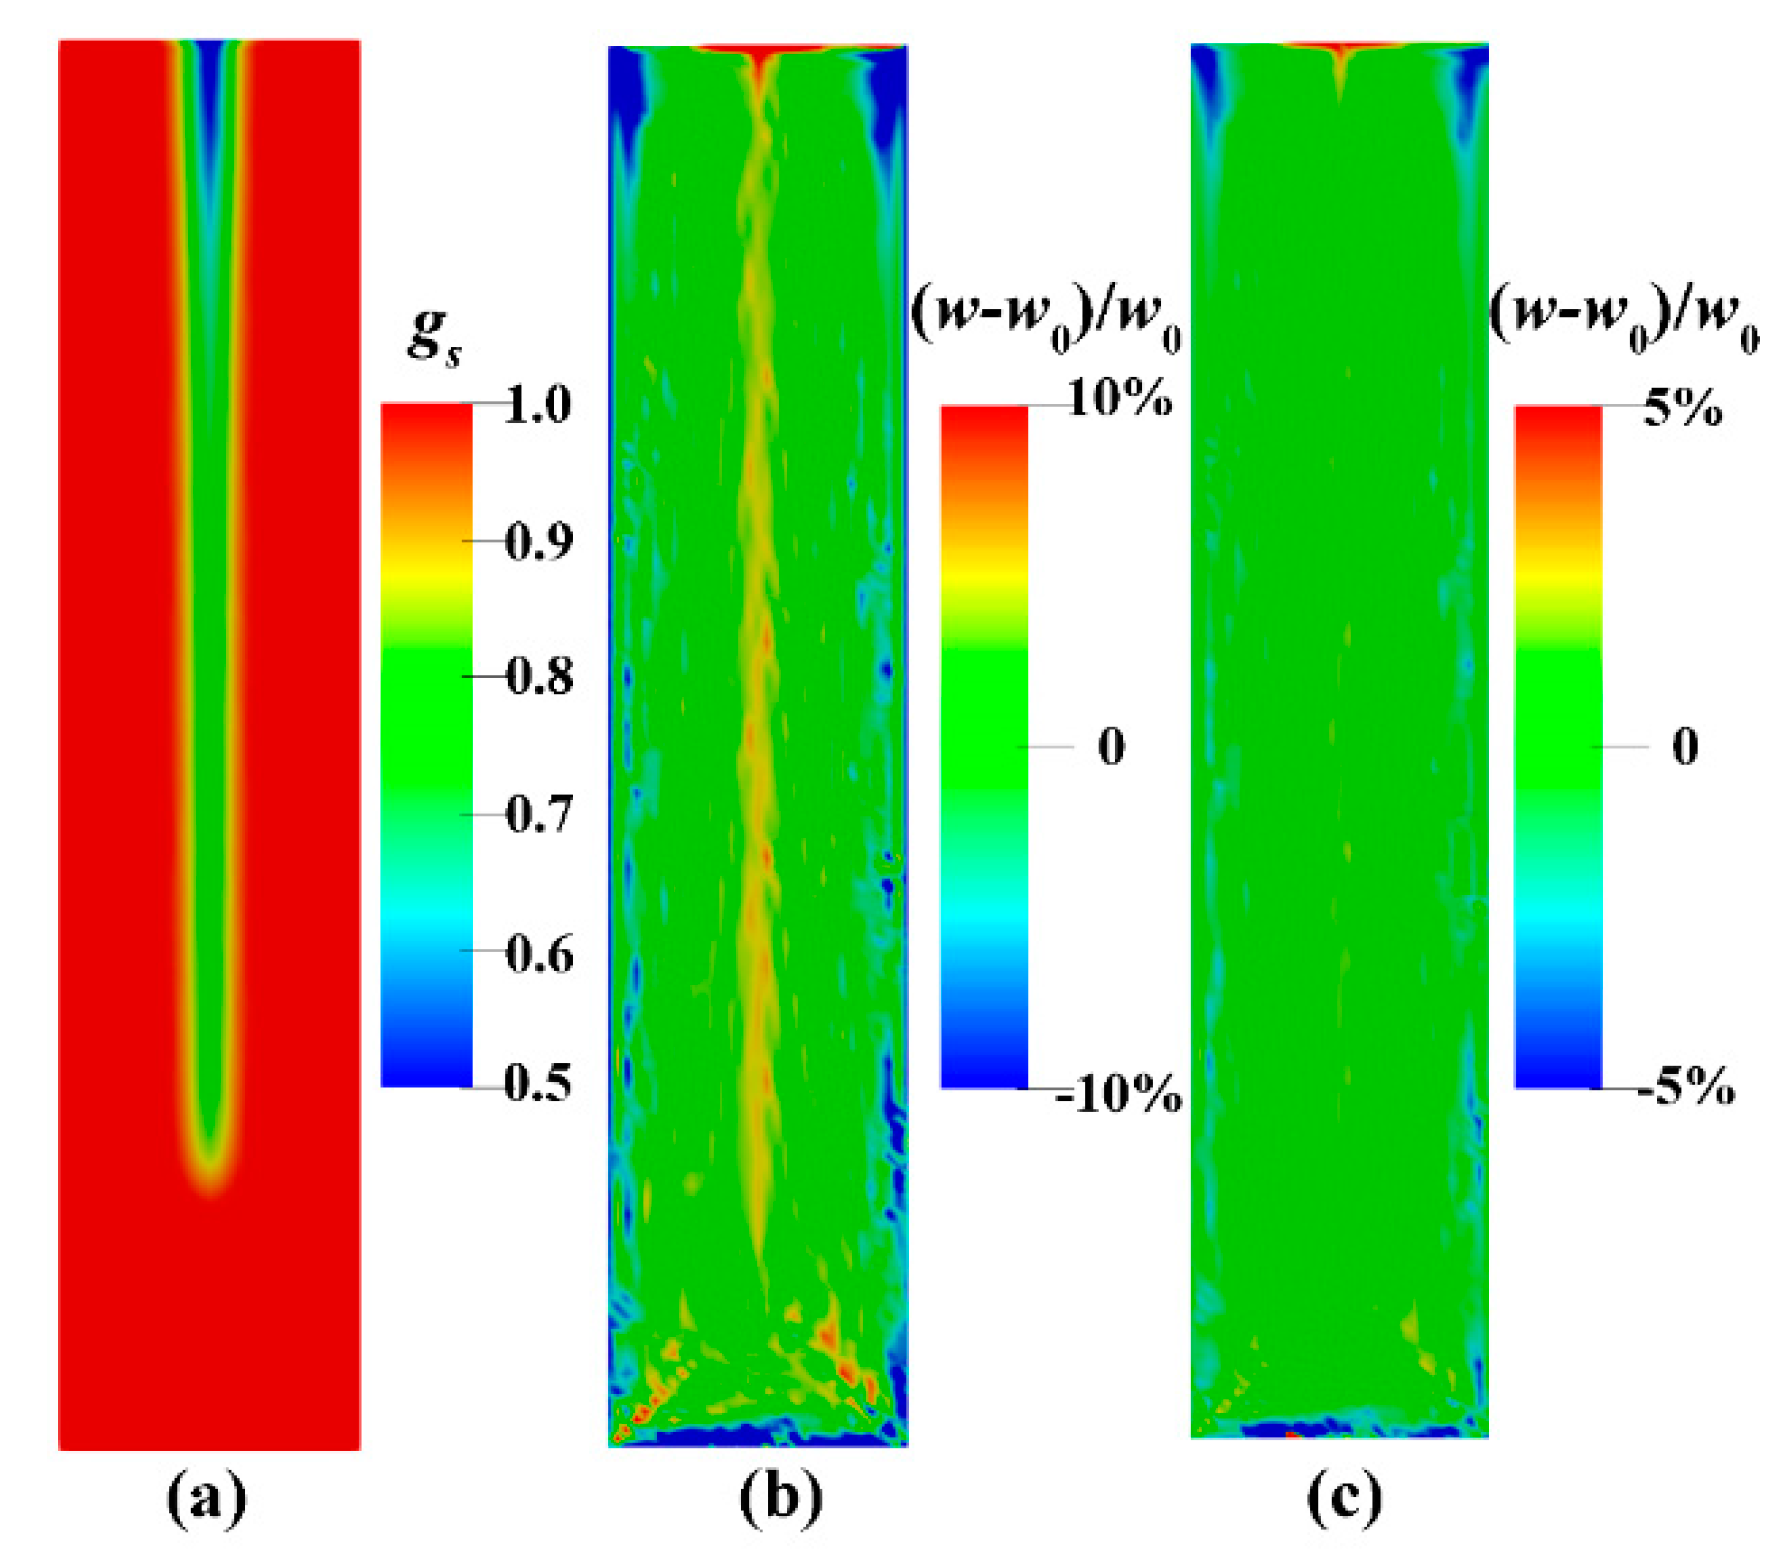
Figure 7.
The distribution of the horizontal component of the solid velocity, vs, at different times after punching starts: (a) 1 s, (b) 3 s, (c) 5 s.
Figure 7.
The distribution of the horizontal component of the solid velocity, vs, at different times after punching starts: (a) 1 s, (b) 3 s, (c) 5 s.
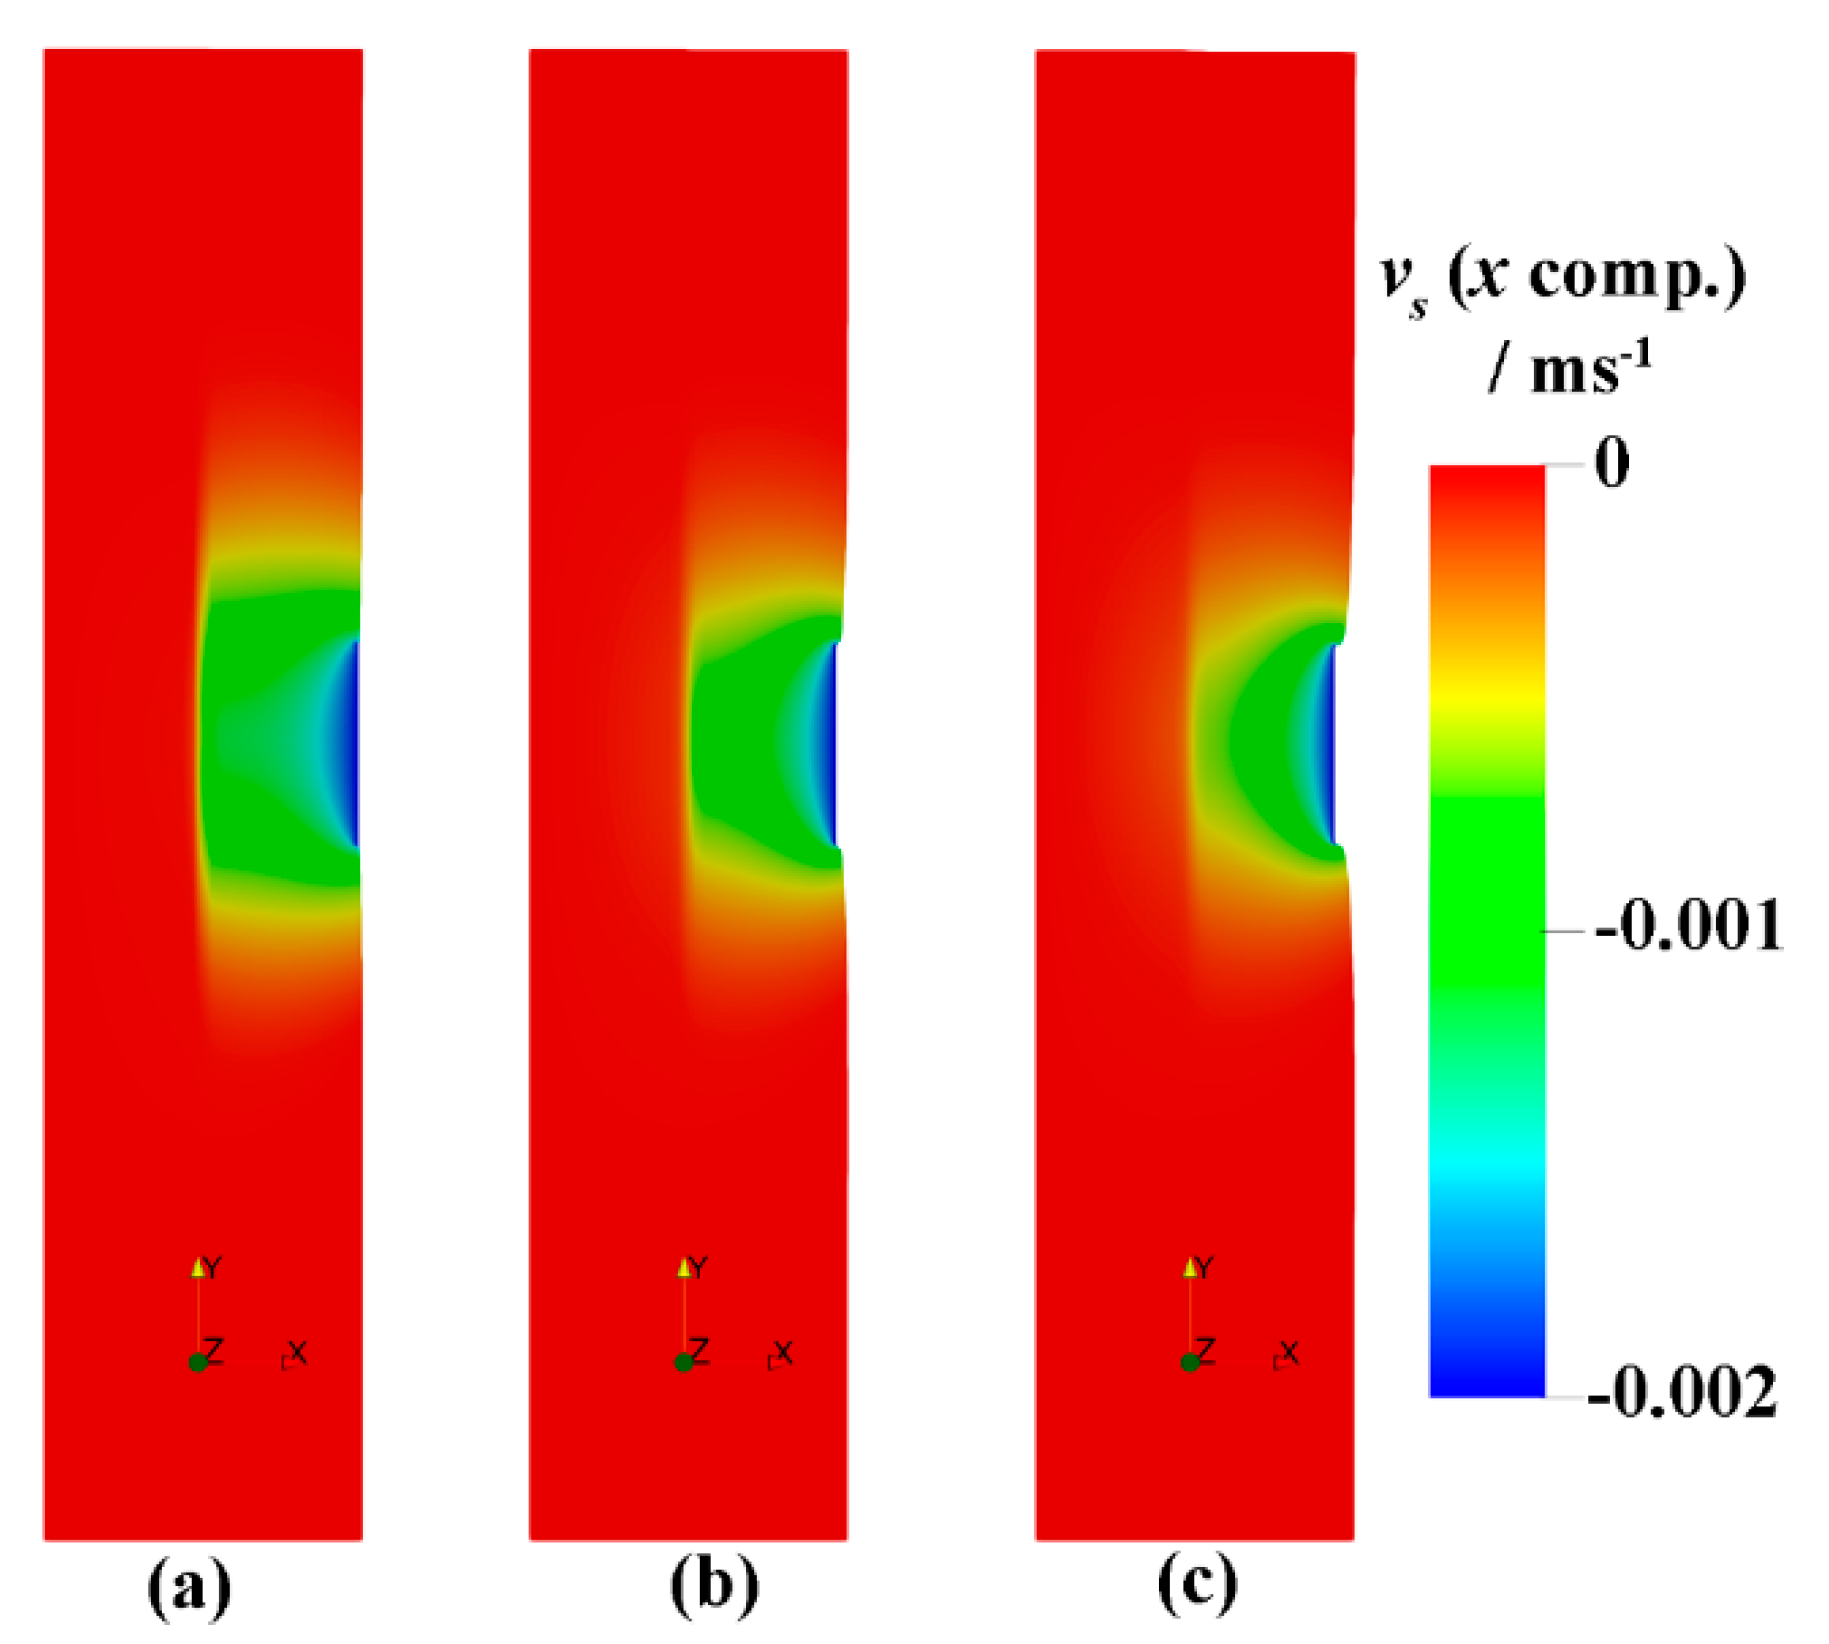
Figure 8.
The relative velocity, vl–vs, at different times after punching starts: (a) 1 s, (b) 3 s, (c) 5 s. The contour indicates the vertical component of the relative velocity, vl–vs.
Figure 8.
The relative velocity, vl–vs, at different times after punching starts: (a) 1 s, (b) 3 s, (c) 5 s. The contour indicates the vertical component of the relative velocity, vl–vs.
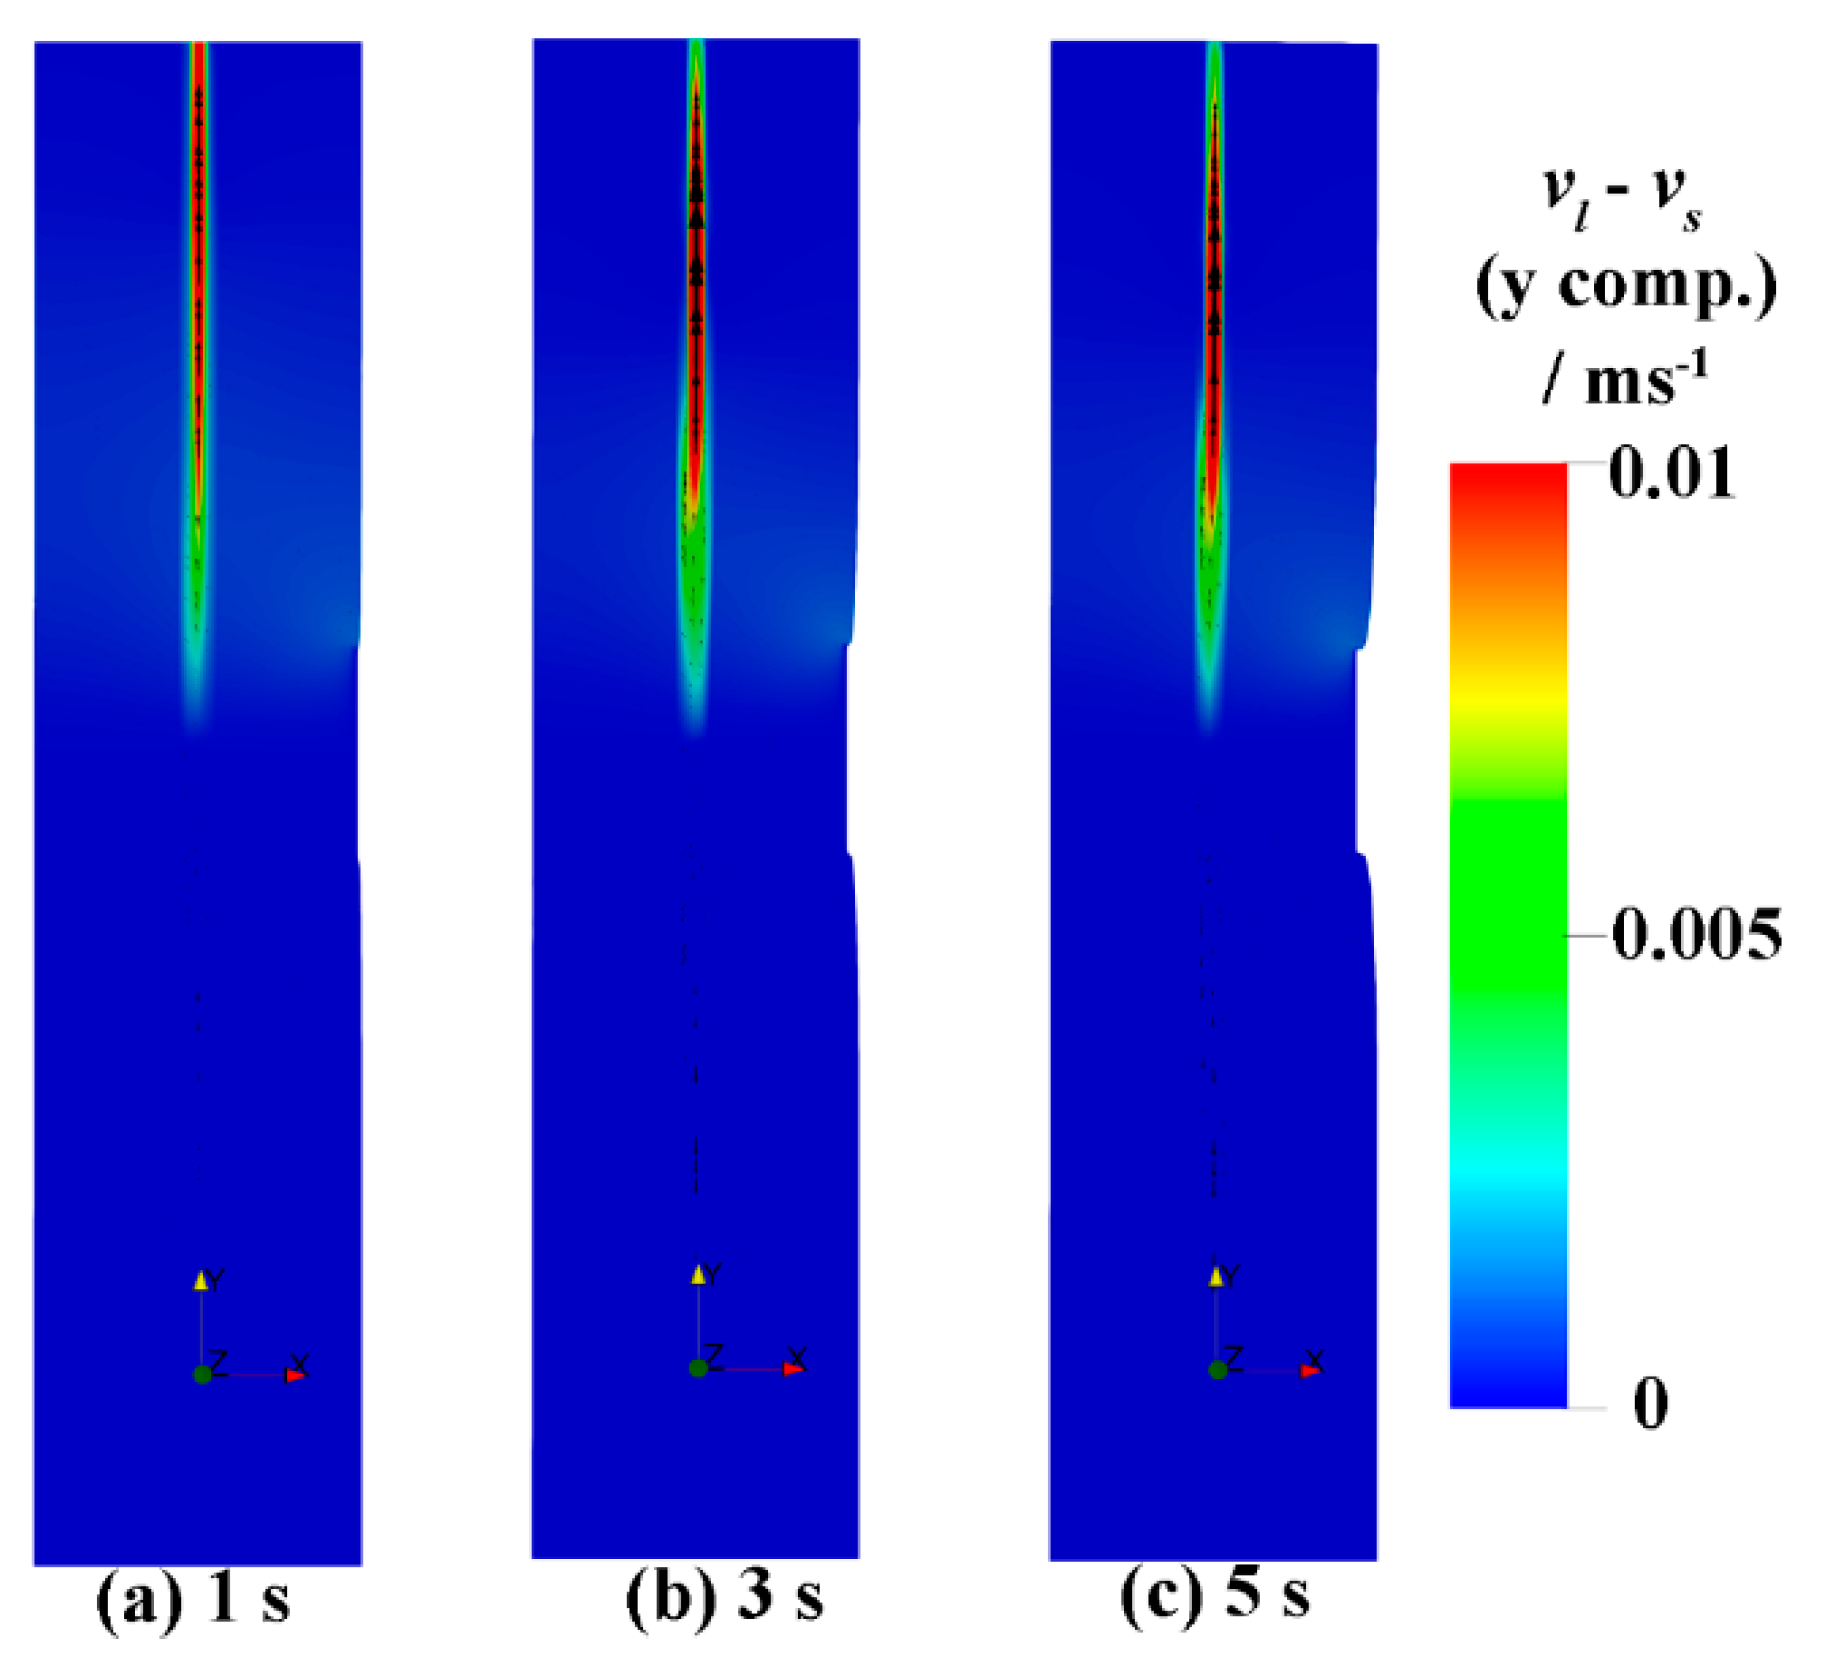
Figure 9.
The distribution of the relative concentration of C at the punching region of the ingot at different times after punching starts: (a) 1 s, (b) 3 s, (c) 5 s. The white line indicates the solid fraction contour line of 0.8.
Figure 9.
The distribution of the relative concentration of C at the punching region of the ingot at different times after punching starts: (a) 1 s, (b) 3 s, (c) 5 s. The white line indicates the solid fraction contour line of 0.8.

Figure 10.
The comparison of the predicted final segregation profile of the ingot with the predictions and measurements presented by Koshikawa et al. [17] at punch height.
Figure 10.
The comparison of the predicted final segregation profile of the ingot with the predictions and measurements presented by Koshikawa et al. [17] at punch height.
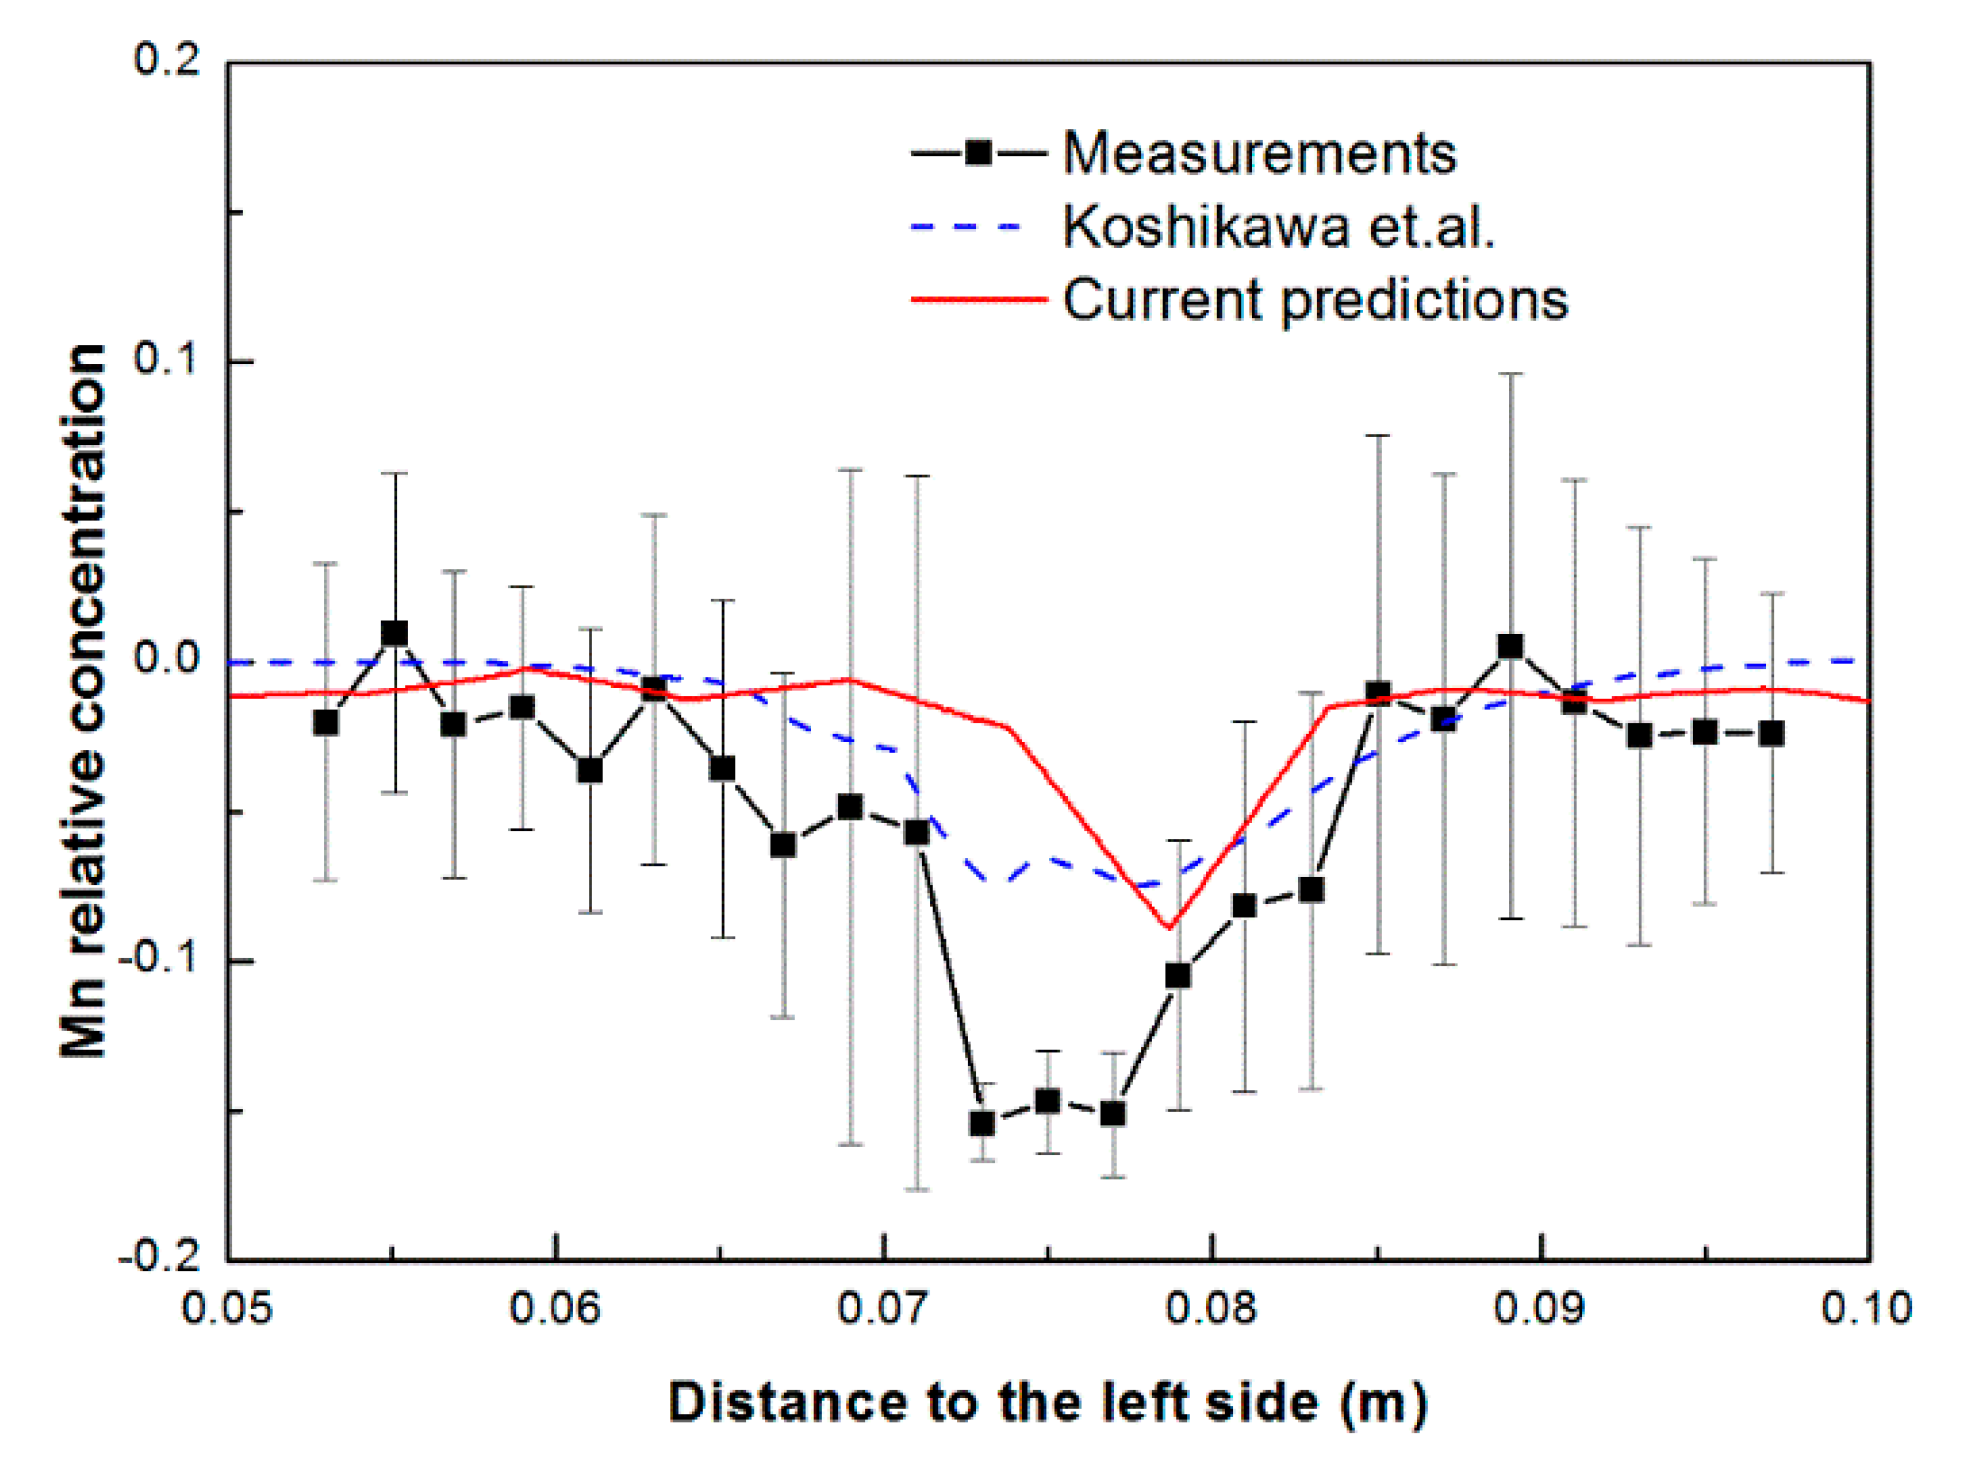
Figure 11.
The horizontal component of the solid velocity (a), divergence of the solid velocity (b), and relative velocity vl–vs (c) of the ingot at punch height.
Figure 11.
The horizontal component of the solid velocity (a), divergence of the solid velocity (b), and relative velocity vl–vs (c) of the ingot at punch height.

Figure 12.
The evolution of the maximum relative velocity using different punching start times.
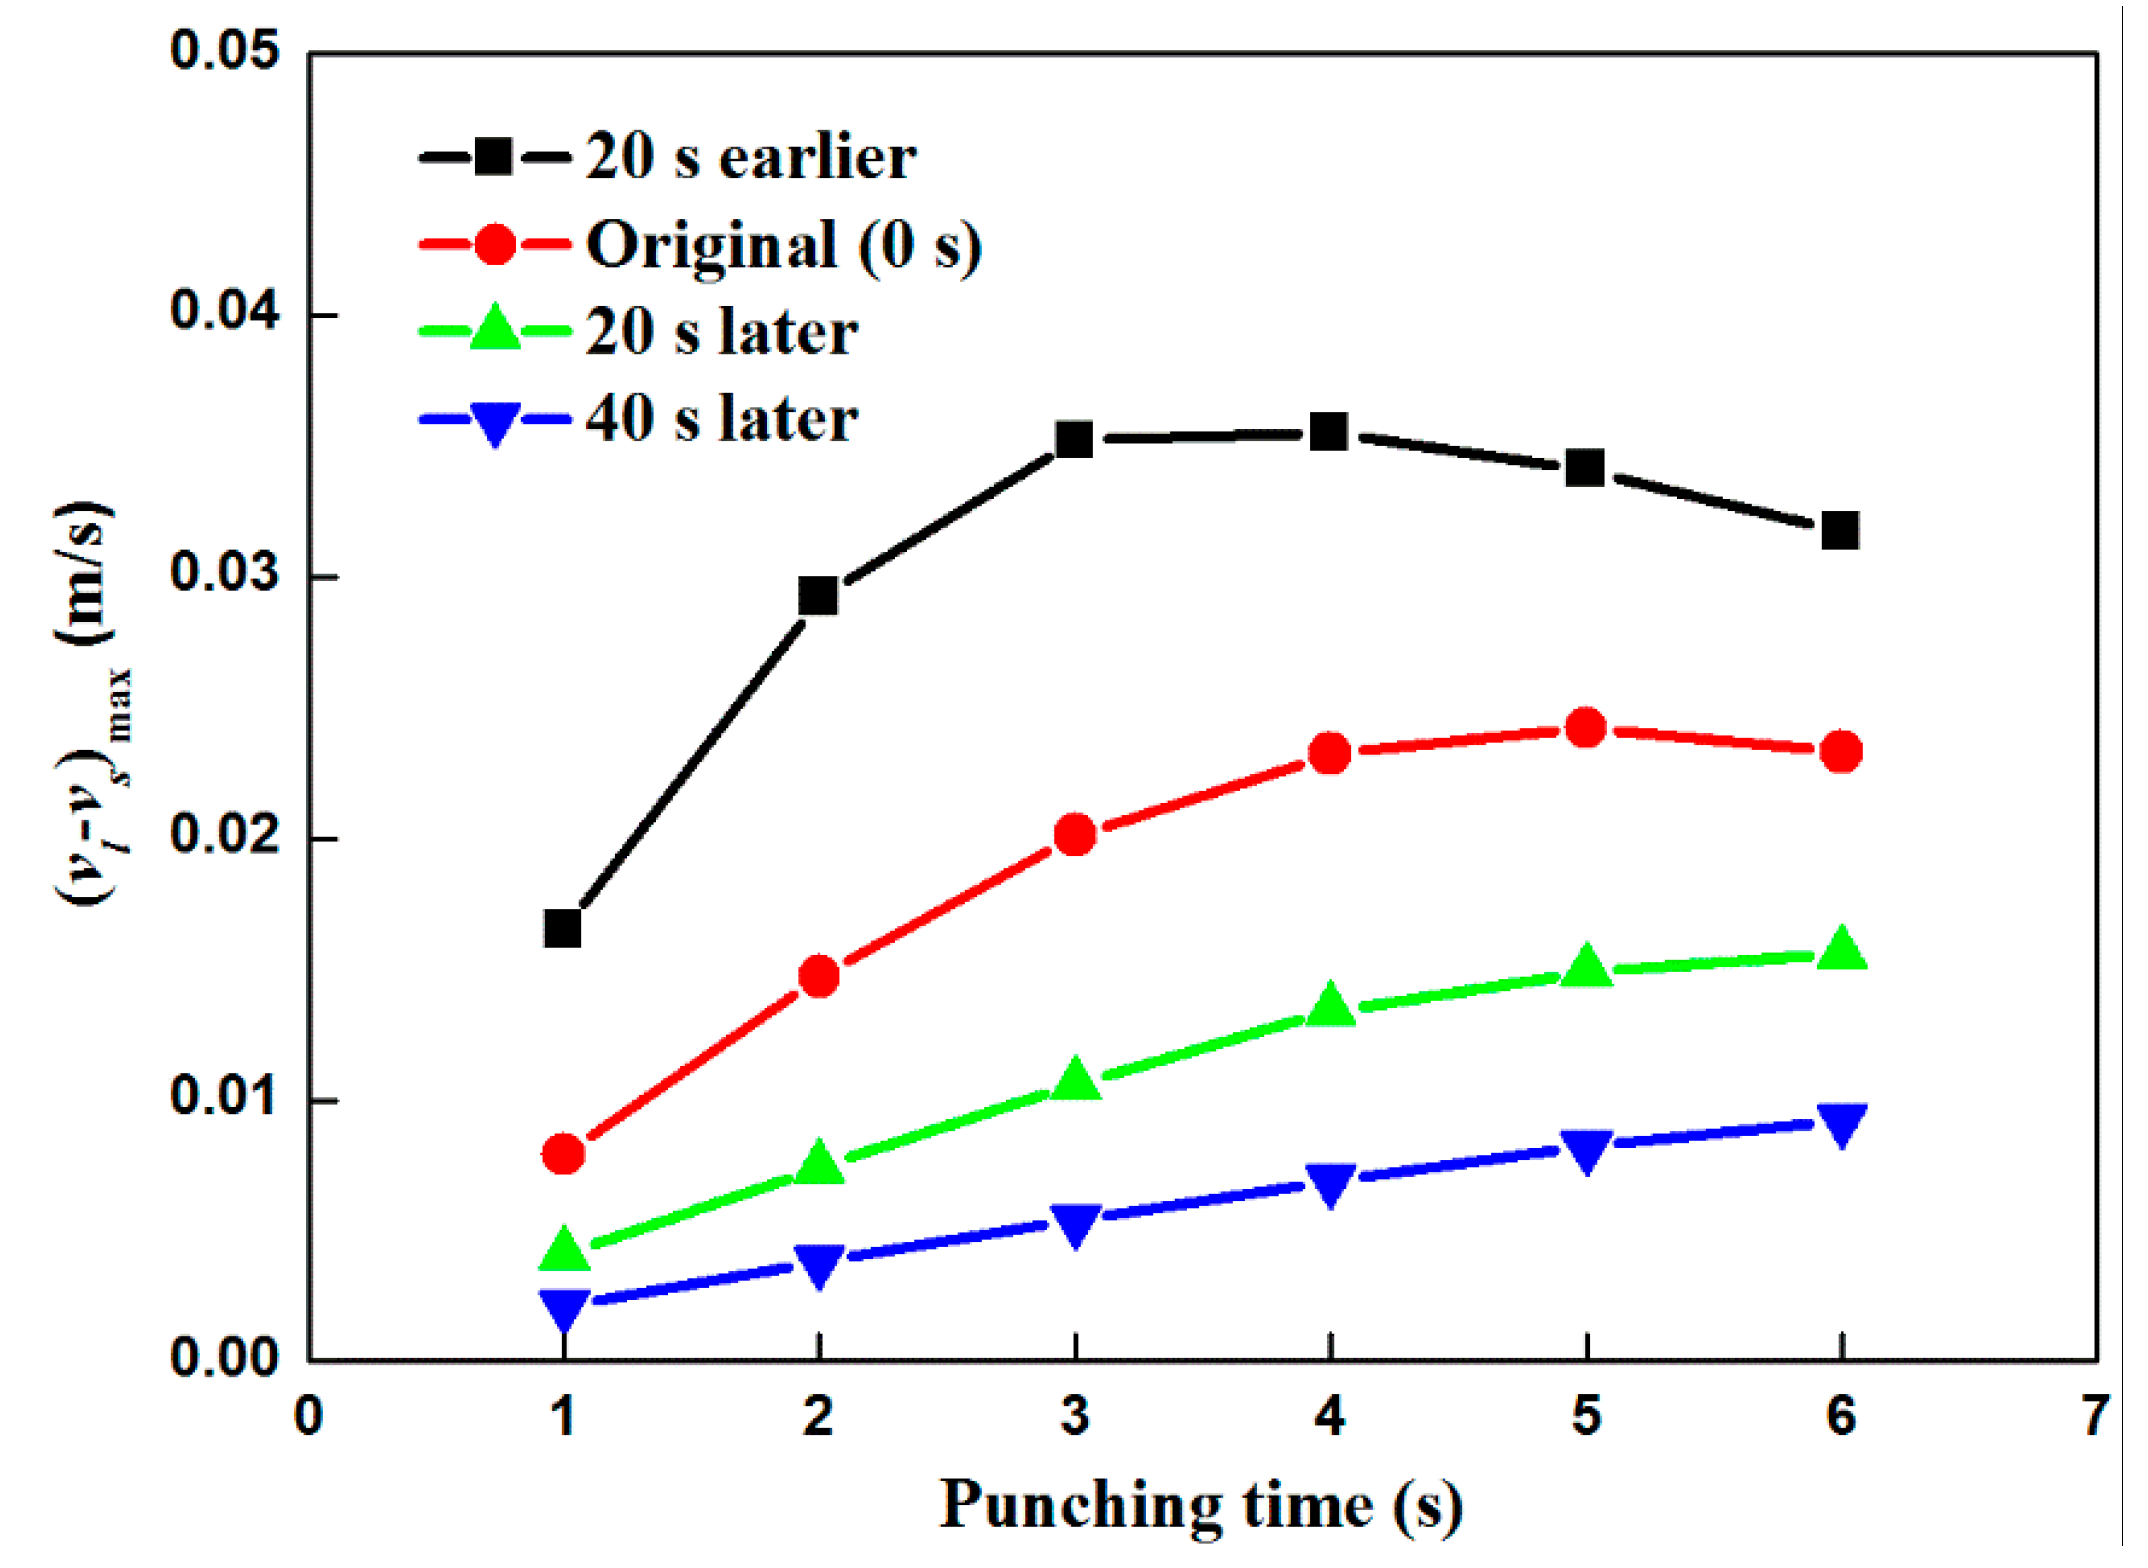
Figure 13.
The evolution of the minimum relative concentration of C with time using different punching start times.
Figure 13.
The evolution of the minimum relative concentration of C with time using different punching start times.

Figure 14.
The evolution of the minimum relative concentration of C with punching displacement using different punching velocities.
Figure 14.
The evolution of the minimum relative concentration of C with punching displacement using different punching velocities.

Table 1.
Thermo-physical properties and computational parameters used in the simulation [17].
Table 1.
Thermo-physical properties and computational parameters used in the simulation [17].
| Parameters | Units | Value |
|---|---|---|
| Density, ρ | kg⋅m−3 | 6990 |
| Specific heat, cp | J⋅kg−1⋅K-1 | 815 |
| Thermal conductivity, k | W⋅m−1⋅K-1 | 39.3 |
| Latent heat, L | J⋅kg−1 | 2.6 × 10⁵ |
| Liquid dynamic viscosity, μl | kg⋅m−1⋅s−1 | 4.2 × 10⁻³ |
| Thermal expansion coefficient, βT | K−1 | 1.07 × 10⁻⁴ |
| Secondary dendrite arm spacing, λ2 | m | 3 × 10⁻⁴ |
| Initial temperature, T0 | °C | 1550 |
| Diffusion coefficient in liquid, Dl | m2⋅s−1 | 2.0 × 10⁻⁸ |
| Convective heat transfer coefficient, h | W·m−2·K−1 | 250 |
| External temperature, Text | °C | 20 |
| Melting point of pure Fe, Tf | °C | 1538 |
| Liquidus slope for C, m[C] | °C(wt.%)−1 | 81 |
| Liquidus slope for Mn, m[Mn] | °C(wt.%)−1 | 5 |
| Partition coefficient for C, kp[C] | wt.%/wt.% | 0.162 |
| Partition coefficient for Mn, kp[Mn] | wt.%/wt.% | 0.703 |
| Solutal expansion coefficient for C, βw[C] | wt.%−1 | 1.10 × 10⁻² |
| Solutal expansion coefficient for Mn, βw[Mn] | wt.%−1 | 1.92 × 10⁻³ |
| Viscoplastic consistency, Kν | Pa⋅sm | 1 × 10⁷ |
| Strain rate sensitivity, m | 1 | 0.225 |
| Punching velocity | m⋅s−1 | 2 × 10⁻³ |
| Total punching distance | m | 1.3 × 10⁻² |
© 2019 by the authors. Licensee MDPI, Basel, Switzerland. This article is an open access article distributed under the terms and conditions of the Creative Commons Attribution (CC BY) license (http://creativecommons.org/licenses/by/4.0/).
Share and Cite
MDPI and ACS Style
Chen, K.; Shen, H. Numerical Simulation of Macrosegregation with Solid Deformation During the Solidification of Steel Ingots Using a Single-Phase/Two-Phase Integrated Model. Metals 2019, 9, 669. https://doi.org/10.3390/met9060669
AMA Style
Chen K, Shen H. Numerical Simulation of Macrosegregation with Solid Deformation During the Solidification of Steel Ingots Using a Single-Phase/Two-Phase Integrated Model. Metals. 2019; 9(6):669. https://doi.org/10.3390/met9060669
Chicago/Turabian StyleChen, Kangxin, and Houfa Shen. 2019. "Numerical Simulation of Macrosegregation with Solid Deformation During the Solidification of Steel Ingots Using a Single-Phase/Two-Phase Integrated Model" Metals 9, no. 6: 669. https://doi.org/10.3390/met9060669
Note that from the first issue of 2016, this journal uses article numbers instead of page numbers. See further details here.