Simulation of the Scale-up Process of a Venturi Jet Pyrolysis Reactor

1
School of Control Engineering, Northeastern University at Qinhuangdao, No. 143 Taishan Road, Qinhuangdao Economic and Technological Development Zone, Qinhuangdao 066004, China
2
School of Metallurgy, Northeastern University, Shenyang 110000, China
*
Author to whom correspondence should be addressed.
Metals 2019, 9(9), 979; https://doi.org/10.3390/met9090979
Submission received: 27 July 2019
/
Revised: 24 August 2019
/
Accepted: 1 September 2019
/
Published: 3 September 2019
(This article belongs to the Special Issue Advanced Simulation Technologies of Metallurgical Processing)
Abstract
:Micro- and nano-sized cerium oxide particles can be prepared through pyrolyzing cerium chloride solution directly in the venturi jet pyrolysis reactor. Micro- and nano-sized cerium oxide particles have better performance and higher application value. To increase the production of micro- and nano-sized cerium oxide, it is necessary to scale up the venturi jet pyrolysis reactor. According to the geometric similarity principle, the scale-up of the venturi jet pyrolysis reactors utilize dimensional analysis methods, with FLUENT13.0 and user-defined functions, following the mathematical simulation of the resulting enlarged reactors. After the dimensional analysis, the empirical formula obtained between the reactants and all the parameters is Q = 2.240727 × 10⁻⁴P0.004568ρ0.26223d−0.24801V1.25714n0.076479μ−0.26628, and the geometrical scale-up of the reactors needs to follow V = 0.0209d0.196. The results in this study can provide data support for the future optimization and amplification of reactors.
1. Introduction
Micro- and nano-sized cerium oxides possess novel structural, photoelectric and chemical properties such as improved stability and photocatalytic activity; these oxides are also widely used in daily life [1]. Currently, micro/nano technology is a hot topic in industry research. Many researchers have prepared the cerium oxide particles with various methods [2,3]. Cerium chloride solution obtained by extraction and separation can be used for direct pyrolysis to produce micro- and nano-meter sized cerium oxide particles [4,5]; this reduces the pyrolysis process (which includes precipitation, filtration and high temperatures) used in the traditional methods. In this process, ammonium bicarbonate and oxalic acid are not required for precipitation, thus reducing water waste and gas pollution [4]. This process utilizes a venturi jet pyrolysis reactor, which provides several advantages such as rapid reaction rates, good reaction uniformity and high product quality, as well as complete gas-phase absorption without gas escape [5]. The process of producing cerium oxides using cerium chloride pyrolysis has been validated several times with a large amount of experimental data, and it is necessary to scale up the reactors for industrial use. The key questions that arise are how to amplify the venturi jet pyrolysis reactor and what criteria should be followed for reactor amplification?
Reactor amplification refers to the design and manufacture of reactors based on experimental data obtained from laboratory reaction equipment; the designed reactors are compatible with large-scale reactions during industrial production [6,7,8,9,10,11]. The design of reactor amplification needs to follow certain criteria such as theoretical amplification for the momentum, mass and energy balance equations of the reaction system [12,13]. Van Geem et al. [14] performed dimensional analysis on the model equations to design the ideal pilot plant reactor by applying similarity theory to the amplification and reduction of steam cracking furnaces. The empirical amplification method mainly depends on the analysis of the parameters of the reactor through the step-by-step process, which includes a small-scale trial, intermediate-scale trial and large-scale trial to explore the equalization of various constants (e.g., Newton, Reynolds and Fred constants). Garcia-Ochoa et al. [15] evaluated dimensional empirical equations for the design and amplification of bioreactors. Dimensional amplification analysis is a method to keep the quasi-number (dimensionless) group of each parameter as constants in the process of reactor amplification, during which building the quasi-number group accurately is the key step. The Yang group [16] reported a discriminant method by performing dimensional analysis on backmixing plug-flow reactors. Safoniuk et al. [17] proposed a dynamic amplification method for a three-phase fluidized bed, which resulted in a series of dimensionless groups that required a good match to guarantee hydrodynamic similarity. Mathematical simulation amplification [18,19,20], which utilizes computer software technology in the process of reactor amplification, is usually used in combination with other amplification methods. After preliminary determination of the model and the initial conditions, computer software is used to build models and evaluate the enlarged reactors; during the process of observing the physical and chemical changes, the design parameters constantly adjust and correct. Nauha et al. [21] reported a novel modeling method calculation to estimate the regional conditions in a bioreactor, which can be used for large-scale retention and mass transfer modeling. Liu et al. [22] applied the Weilerma/Dushman method and CFD (Computational Fluid Dynamics) simulation to conduct a comparison study of various micro-hybrid properties in symmetric T-type micromixers with alternative channels and discussed the amplification strategy.
Currently, reactor amplification primarily uses theoretical amplification, empirical amplification, dimensional analysis amplification and numerical simulation amplification. In this paper, related parameters such as boundary parameters and initial conditions were first established by dimensional analysis of enlarged reactors; the feasibility was then further validated by numerical simulation amplification. The numerical simulation includes the coupling calculation of combustion, phase transformation and pyrolysis in the chemical reaction.
2. Modeling
2.1. Venturi Jet Pyrolysis Reactor Model
As shown in Figure 1, the size of the developed venturi jet reactor is as follows. the total length of the jet reactor was 850 mm.
2.2. Model Selection
In terms of numerical simulation, the geometric model is established with GAMBIT2.4.6; the grid is divided with ICEMCFD (The Integrated Computer Engineering and Manufacturing code for Computational Fluid Dynamics); simulation calculations are conducted with FLUENT13.0; and data post-processing is performed with CFD-POST13.0. The numerical simulation utilizes a three-dimensional un-stationary algorithm with a Euler multiphase flow model and uses discrete differential equations with finite volume. For the turbulent flow in the jet reactor, a standard k-ε double equation model was selected; the SIMPLE (semi-implicit method for pressure-linked equations) algorithm based on pressure-velocity coupling was applied. The control equations were differentiated with second-order upwind and the wall surface was set to adiabatic conditions; all items converged to 1 × 10⁻⁴ except energy (1 × 10⁻⁶). In this paper, the investigation of cerium chloride pyrosis in the reactor mainly included:
CH4(g) + 2O2(g) → CO2(g) + 2H2O(g)
2CeCl3(s) + 3H2O(g) + 1/2O2(g) → 2CeO2(s) + 6HCl(g)
According to the data of pre-exponential factor and apparent activation energy determined from the kinetic equations of CeCl3 reaction from experiments, we used UDFs (User Defined functions) to simulate CeCl3 pyrolysis reactions. The boundary conditions were set as shown in Table 1. The materials are CH4, O2, CO2, H2O, CeCl3, and CeO2. The physical properties of all materials were obtained from the manual of inorganic thermodynamics, and the particle size of CeO was set to 1 μm.
2.3. Validation and Optimization
3. Results and Discussion
3.1. Dimension Analysis
Dimensional analysis includes the entire process, such as laboratory equipment, pilot equipment and the industrial scale-up operation as well as the entire system consisting of the experimental data analysis, mathematical model and theoretical system. According to various operating and structural parameters, the concentration of the CeO2 product was mainly affected by the amount of CeCl3 in the reaction material. By applying the existing simulation results to dimensional analysis, the relationship between the material input quantity Q of inlet 2 and its related parameters can be determined. Throughout the simulation process, three parameters—operating parameters, structural parameters and physical parameters—largely affected the material carrying capacity. These parameters include the gas phase flow velocity of inlet 1 (V), the additional pressure of inlet 2 (P), the ratio of the straight pipe diameter to the throat pipe diameter (n), the drainage pipe diameter (d), the material density (ρ) and the material viscosity (μ).
Using dimensional analysis, the general function is:
Q = f (V, P, n, d, µ, ρ) or f (Q, V, P, n, d, µ, ρ) = 0.
Based on the π theorem, the number of variables was seven, the number of independent variables was three; ρ, V, and d have independent dimensions, and groups without dimensions can be established. For n, because it has no dimension, it can be directly expressed when constructing dimensionless π.
As analyzed in Table 2, each π is represented as:
Construct the number:
Obtain the following expression:
Form of explicit function:
Within a certain range of the independent variable, the criterion relation of various phenomena can often be expressed in the form of a power function. From the above analysis, the empirical criterion formula can be fitted as:
where x, y, and z are fitting coefficients, among which the speed unit is m3/s, the density unit is kg/m3, the pressure unit is Pa, the unit of d is m, and the viscosity unit is Pa·s.
According to the above linear relationships, Q was calculated after processing the simulation results. A linear Equation (11) was obtained with the given fitting coefficients: ln(A) = −8.40354, A = 2.240727 × 10⁻⁴, x = 0.004568, y = −0.26628, z = 0.076479.
Then, the empirical formula becomes:
And:
This is the result of numerical simulation data fitting considering the influencing factors on the liquid phase incorporation such as fuel combustion, evaporation phase transition and gas-solidification; these results are relatively accurate. In practical production, the production of CeO2 can be estimated by the empirical formula to calculate the amount of liquid material in the pyrolysis reaction process under different experimental conditions.
Figure 3 shows the comparison of liquid phase material entrainment calculated by the numerical simulation and empirical formula under different drainage tube diameters. According to the figure, the relative error between the results obtained respectively by the numerical simulation and the empirical formula is less than 15%, indicating the empirical formula obtained by dimensional analysis is more accurate.
3.2. Reactor Ampification
This paper focuses on the effects of various related factors on the amount of material entering in the reactor. In order to find a suitable design method to amplify the reactor, the same materials (fixed physical property parameter (p)) were selected according to above-mentioned Equation (13); the jet pyrolysis reactor was amplified with the same geometrical ratio with a fixed n = 10/5, μ = 0.0000172 Pa·s, and the following can be obtained:
According to the relationship between the amount of replenished material and the additional pressure and gas phase inlet flow, P = 1.62V2 − 1.55V − 0.97, the P and V factors should be combined [23]. In order to increase the reactor input by a factor of 1000, the required amount of CeCl3 was 42.96 kg/h, and the material intake was 826.1538 kg/h. To calculate the corresponding values of different gas phase inlet velocities V and reactor draft pipe diameters d:
Three schemes of the reactor amplification selection correspond to the three groups of models for the simulation study; the diameter of the drainage tube was expanded by factors of 8, 10 and 12 to 0.08 m, 0.1 m and 0.12 m, respectively. According to the relationship detailed in Equation (15) and P = 1.62υ2 − 1.55υ − 0.97, the parameters of V and P were selected from Table 3; the added chemical density was kept at 1038.449 kg/m3 and the ratio of the straight tube diameter to the throat of the jet reactor was 10/5.
As shown in Figure 4, the error between the theoretical and simulated values of material in the amplified reactor was less than 10%, and the error between the theoretical and the numerical simulation value of cerium oxide production was less than 10%. Therefore, it is feasible to select geometrical similarity amplification and set the initial and boundary conditions according to the parameters obtained by the dimensional analysis.
As shown in Figure 5, the temperature distribution trend in the cerium chloride reactor after amplification can be seen; the maximum temperature in the reactor remains unchanged when the ratio of methane to oxygen is fixed, as combustion of CH4 provides the heat for the reaction. When the reactor was magnified by 12 times, the ratio of the high temperature region in the reactor was smaller than the other two situations and was attributed to the affected process of the space volume increase and the heat energy transfer in the amplified reactor. One reasonable solution is to increase the amount of fuel to provide sufficient heat generated via combustion. The low temperature zone was caused by the action of phase-to-phase heat transfer, evaporation phase change and endothermicity of pyrolysis after cerium chloride solution loading into the reactor. From the temperature change trend, the larger reactor amplification ratios led to a smaller proportion of the space that the fluid can reach in the reactor, a smaller proportion of the reaction zone in the reactor and a smaller low temperature region.
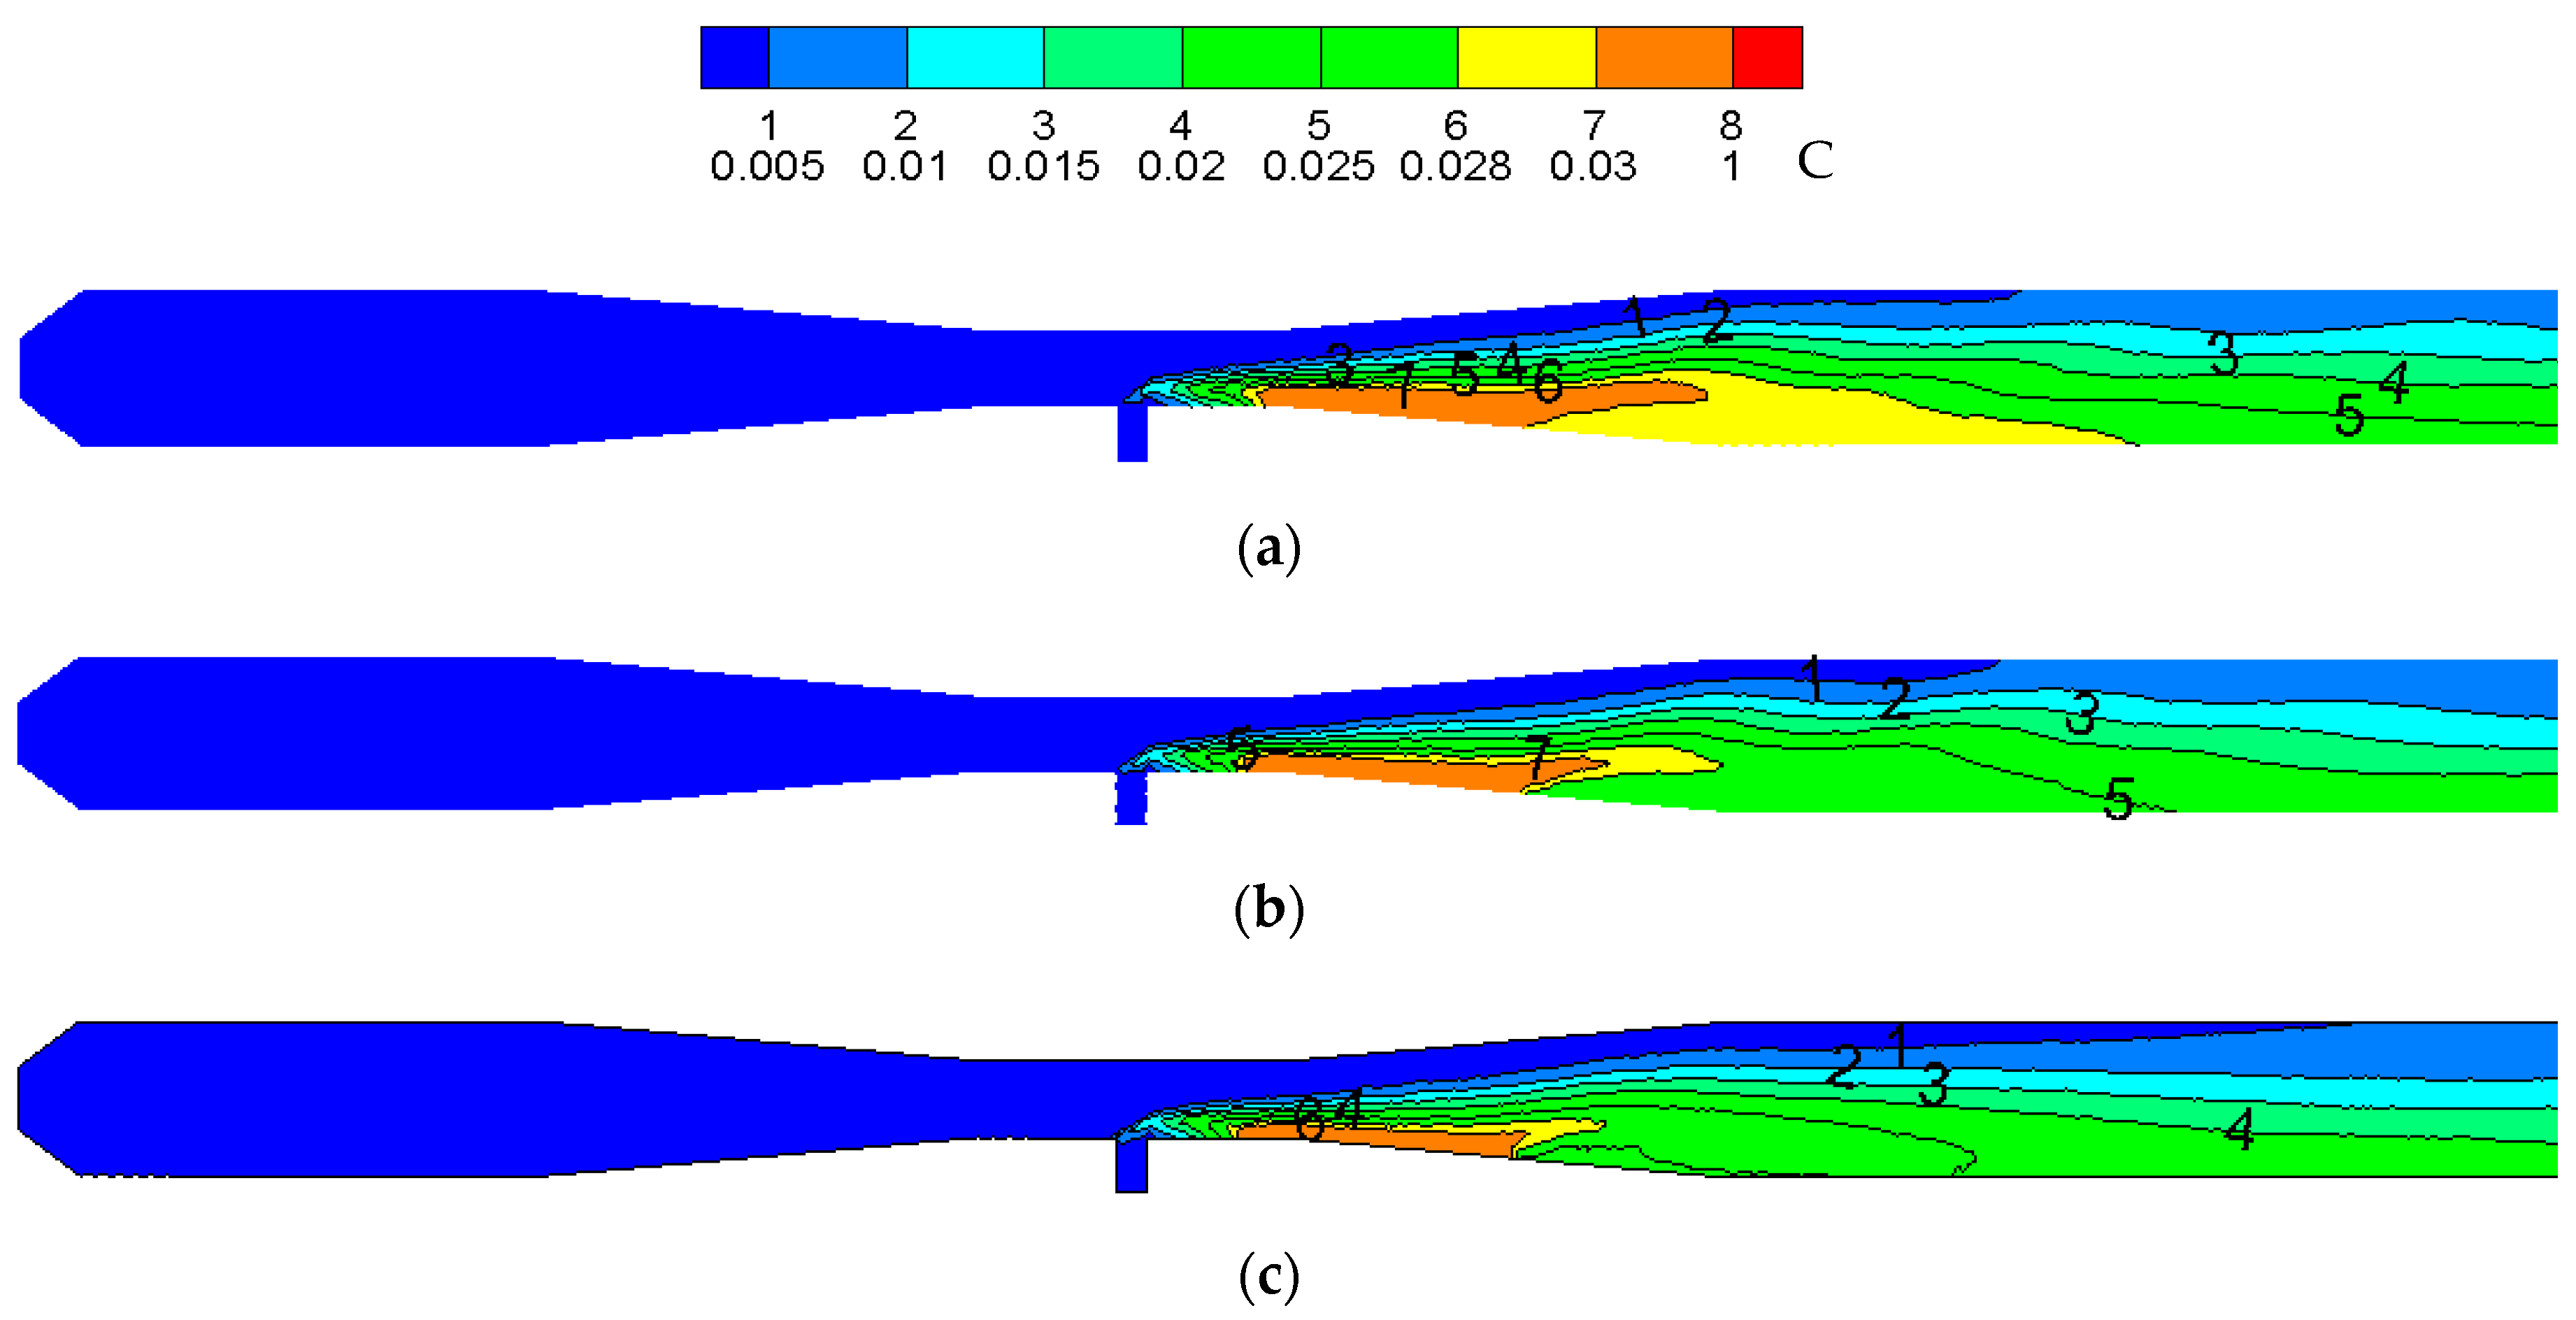
As shown in Figure 6, the larger the reactor magnification, the smaller the ratio of CeCl3 in the high concentration region of the reactor (the concentration of the yellow region in the figure is 0.03 to 0.05) and the narrower the distribution of CeCl3 at the throat. However, the larger the reactor magnification, the larger the volume inside the reactor, and the worse the heat transfer effect between the phases; therefore, the proportion of unreacted CeCl3 (the concentration in the figure was between 0.0005 and 0.001) was larger.
As shown in Figure 7, a larger reactor amplification causes a smaller proportion of CeO2 in the high concentration region of the reactor; this is because as the reactor magnification increases, the volume inside the reactor increases which worsens the heat transfer between the phases. Therefore, the larger the area where CeCl3 is not completely reacted decreases the high concentration region of CeO2.
4. Conclusions
- (1)
- The empirical formula obtained from dimensional analysis based on numerical simulation data is Q = 2.240727 × 10⁻⁴P0.004568ρ0.26223d−0.24801V1.25714n0.076479μ−0.26628. The reactor can be geometrically scaled up. The relationship between the gas-phase inlet velocity V and the reactor pipe diameter d in the pyrolysis of cerium chloride follows the formula: V = 0.0209d0.196.
- (2)
- The temperature distribution trend in the reactor and the maximum temperature in the reactor remains unchanged after amplification. With an increase in the amplification magnitude, CeCl3 has a smaller ratio in the high concentration region of the reactor, a narrower distribution at the throat region and a smaller proportion of CeO2 in the high concentration region.
- (3)
- The reactor amplification experiment will be carried out next to verify the accuracy of the amplification conditions obtained by the simulation, and to summarize the rules to be followed in the reactor amplification process.
Author Contributions
Writing—original draft preparation, C.L.; writing—review and editing, C.L.; supervision, T.Z.; funding acquisition, B.H.
Funding
This research was funded by the National Natural Science Foundation of China (51904069); the Natural Science Foundation of Hebei Province of China (E2019501085); the Colleges and universities in Hebei province science and technology research youth fund (QN2019312); the Fundamental Research Funds for the Central Universities (N172303012); the Key Defense Fund Projects (61409230103).
Acknowledgments
The article was prepared thanks to the Key Defense Fund Projects (61409230103).
Conflicts of Interest
We declare that we do not have any commercial or associative interest that represents a conflict of interest in connection with the work submitted.
References
- Hou, Z.Y.; He, Y. General Situation and Application Prospect of Rare Earth Resources in China. Inner Mong. Sci. Technol. Econ. 2017, 7, 28–33. [Google Scholar]
- Wang, Z.F.; Fei, P.Y.; Xiong, H.Q.; Qin, C.L. CoFe2O4 nanoplates synthesized by dealloying method as high performance Li-ion battery anodes. Electrochim. Acta 2017, 252, 295–305. [Google Scholar] [CrossRef]
- Zhu, W.J.; Huang, H.; Zhang, W.K.; Tao, X.Y.; Gan, Y.P.; Xia, Y.; Yang, H.; Guo, X.Z. Synthesis of MnO/C composites derived from pollen template for advanced lithium-ion batteries. Electrochim. Acta 2015, 152, 286–293. [Google Scholar] [CrossRef]
- Lv, C.; Zhang, T.A.; Dou, Z.H.; Zhao, Q.Y. Simulation of Process and Reactor Structure Optimization for CeO2 Preparation from Jet-Flow Pyrolysis. JOM 2019, 71, 1660–1666. [Google Scholar] [CrossRef]
- Lv, C.; Zhang, T.A.; Dou, Z.H.; Zhao, Q.Y. Numerical Simulations of Irregular CeO2 Particle Size Distributions. JOM 2019, 71, 34–39. [Google Scholar] [CrossRef]
- Vijayaraghavan, V.; Wong, C.H. Transport characteristics of water molecules in carbon nanotubes investigated by using molecular dynamics simulation. Comput. Mater. Sci. 2014, 89, 36–44. [Google Scholar] [CrossRef]
- Vijayaraghavan, V.; Garg, A.; Gao, L.; Vijayaraghavan, R. Finite Element Based Physical Chemical Modeling of Corrosion in Magnesium Alloys. Metals 2017, 7, 83. [Google Scholar] [CrossRef]
- Coppens, M.O. A nature-inspired approach to reactor and catalysis engineering. Curr. Opin. Chem. Eng. 2012, 3, 281–289. [Google Scholar] [CrossRef]
- Smith, K.B.; Mackley, M.R. An Experimental Investigation into the Scale-up of Oscillatory Flow Mixing in Baffled Tubes. Chem. Eng. Res. Des. 2006, 84, 1001–1011. [Google Scholar] [CrossRef] [Green Version]
- Rossetti, I.; Compagnoni, M. Chemical reaction engineering, process design and scale-up issues at the frontier of synthesis: Flow chemistry. Chem. Eng. J. 2016, 296, 56–70. [Google Scholar] [CrossRef]
- Coppens, M.O. Scaling-up and -down in a Nature-Inspired Way. Ind. Eng. Chem. Res. 2005, 44, 5011–5019. [Google Scholar] [CrossRef]
- Underwood, N.; Inouye, P.H.D. Large-Scale Questions and Small-Scale Data: Empirical and Theoretical Methods for Scaling up in Ecology. Oecologia 2005, 145, 177–178. [Google Scholar] [CrossRef] [PubMed]
- Labík, L.; Vostal, R.; Moucha, T.; Rejl, F.; Kordac, M. Volumetric mass transfer coefficient in multiple-impeller gas–liquid contactors. Scaling-up study for various impeller types. Chem. Eng. J. 2014, 240, 55–61. [Google Scholar] [CrossRef]
- Geem, K.M.V.; Robert, Z.; Reyniers, M.F.; Marin, G.B. Dimensional analysis for scaling up and down steam cracking coils. Chem. Eng. J. 2007, 134, 3–10. [Google Scholar] [CrossRef]
- Garcia-Ochoa, F.; Gomez, E. Bioreactor scale-up and oxygen transfer rate in microbial processes: An overview. Biotechnol. Adv. 2009, 27, 153–176. [Google Scholar] [CrossRef] [PubMed]
- Yang, S.Z. Biochemical Reaction Engineering. Prog. Chem. Ind. 1991, 3, 33–39. [Google Scholar]
- Safoniuk, M.; Grace, J.R.; Hackman, L.; Mcknight, C.A. Use of dimensional similitude for scale-up of hydrodynamics in three-phase fluidized beds. Chem. Eng. Sci. 1999, 54, 4961–4966. [Google Scholar] [CrossRef]
- Krishna, R.; Baten, J.M.V.; Urseanu, M.I.; Ellenberger, J. A scale up strategy for bubble column slurry reactors. Catal. Today 2001, 66, 99–207. [Google Scholar] [CrossRef]
- Šoltys, M.; Balouch, M.; Kašpar, O.; Lhotka, M.; Ulbrich, P.; Zadrazil, A.; Kovacik, P.; Stepanek, F. Evaluation of scale-up strategies for the batch synthesis of dense and hollow mesoporous silica microspheres. Chem. Eng. J. 2017, 334, 1135–1147. [Google Scholar] [CrossRef]
- Gong, J.B.; Wei, H.Y.; Wang, J.K.; Garside, J. Simulation and Scale-up of Barium Sulphate Precipitation Process Using CFD Modeling. Chin. J. Chem. Eng. 2005, 13, 167–172. [Google Scholar]
- Nauha, E.K.; Kálal, Z.; Ali, J.M.; Alopaeus, V. Compartmental modeling of large stirred tank bioreactors with high gas volume fractions. Chem. Eng. J. 2018, 334, 2319–2334. [Google Scholar] [CrossRef] [Green Version]
- Liu, Z.D.; Lu, Y.C.; Wang, J.W.; Luo, G.S. Mixing characterization and scaling-up analysis of asymmetrical T-shaped micromixer: Experiment and CFD simulation. Chem. Eng. J. 2012, 181, 597–606. [Google Scholar]
- Lv, C.; Zhang, T.A.; Dou, Z.H.; Zhao, Q.Y. Numerical simulation of preparing ultrafine cerium oxides from jet-flow pyrolysis. Rare Met. 2019, 38, 12. [Google Scholar]
Figure 1.
Dimension of jet-flow pyrolysis reactor (unit: mm). The total length of the jet reactor was 850 mm; the left gas-phase inlet has a fuel inlet (inlet 1) and an oxygen inlet (inlet 2) [4]. A chemical inlet (inlet 3) had a cross-section diameter of d = 10 mm, straight pipe cross-section diameters of d1 = d2 = 50 mm, the front throat straight pipe length was L3 = 150 mm, a rear throat straight pipe length of L4 = 300 mm, a throat diameter de = 25 mm and length Le = 100 mm, and the variable diameter pipe lengths were L1 = L2 = 140 mm, L5 = 20 mm. The outlet (outlet) section diameter was 50 mm.
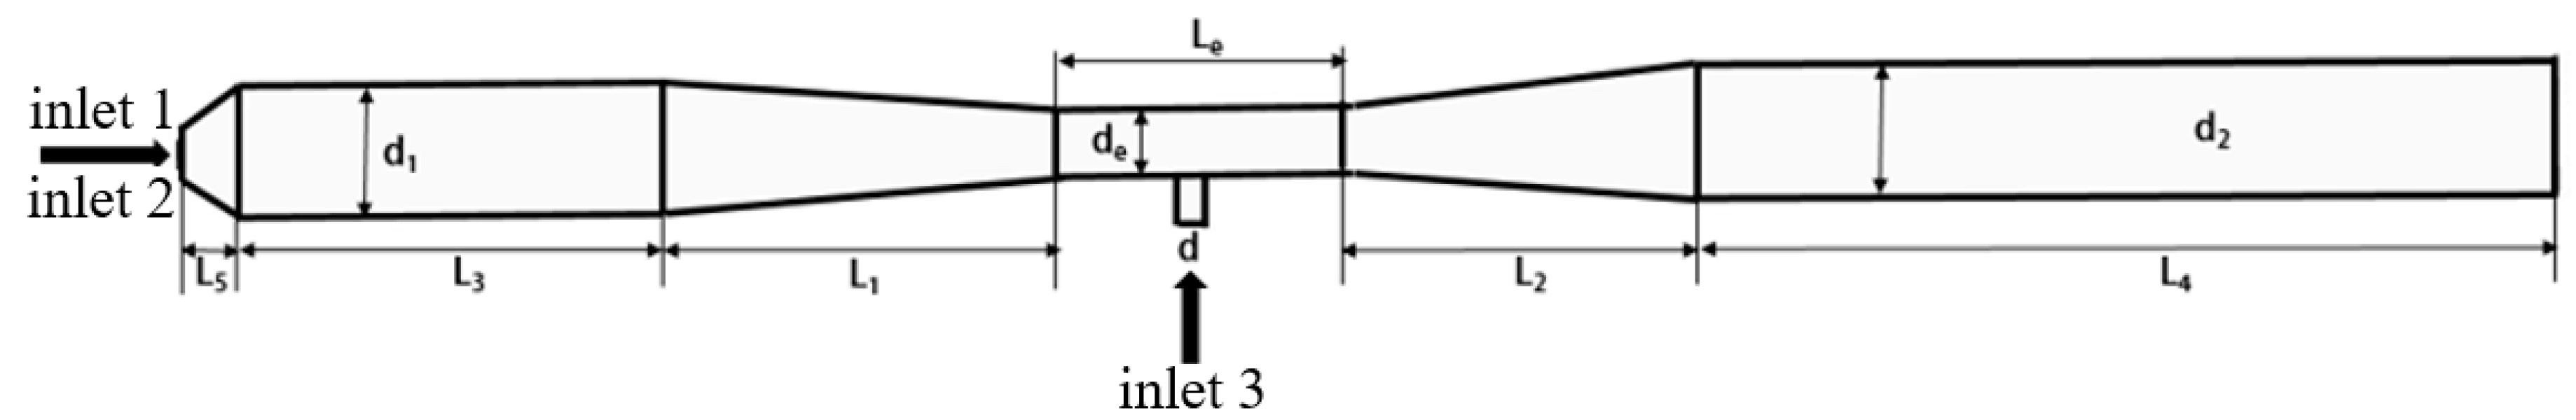
Figure 2.
Comparison of numerical simulation results and experimental results (HCl outlet and CeO2).
Figure 2.
Comparison of numerical simulation results and experimental results (HCl outlet and CeO2).

Figure 3.
The comparison of simulation results and formula calculation results of the value of the feed at different drainage tube diameters.
Figure 3.
The comparison of simulation results and formula calculation results of the value of the feed at different drainage tube diameters.

Figure 4.
The comparison of the theoretical and simulated results of the value of feed and product in the enlarged cerium chloride reactor.
Figure 4.
The comparison of the theoretical and simulated results of the value of feed and product in the enlarged cerium chloride reactor.
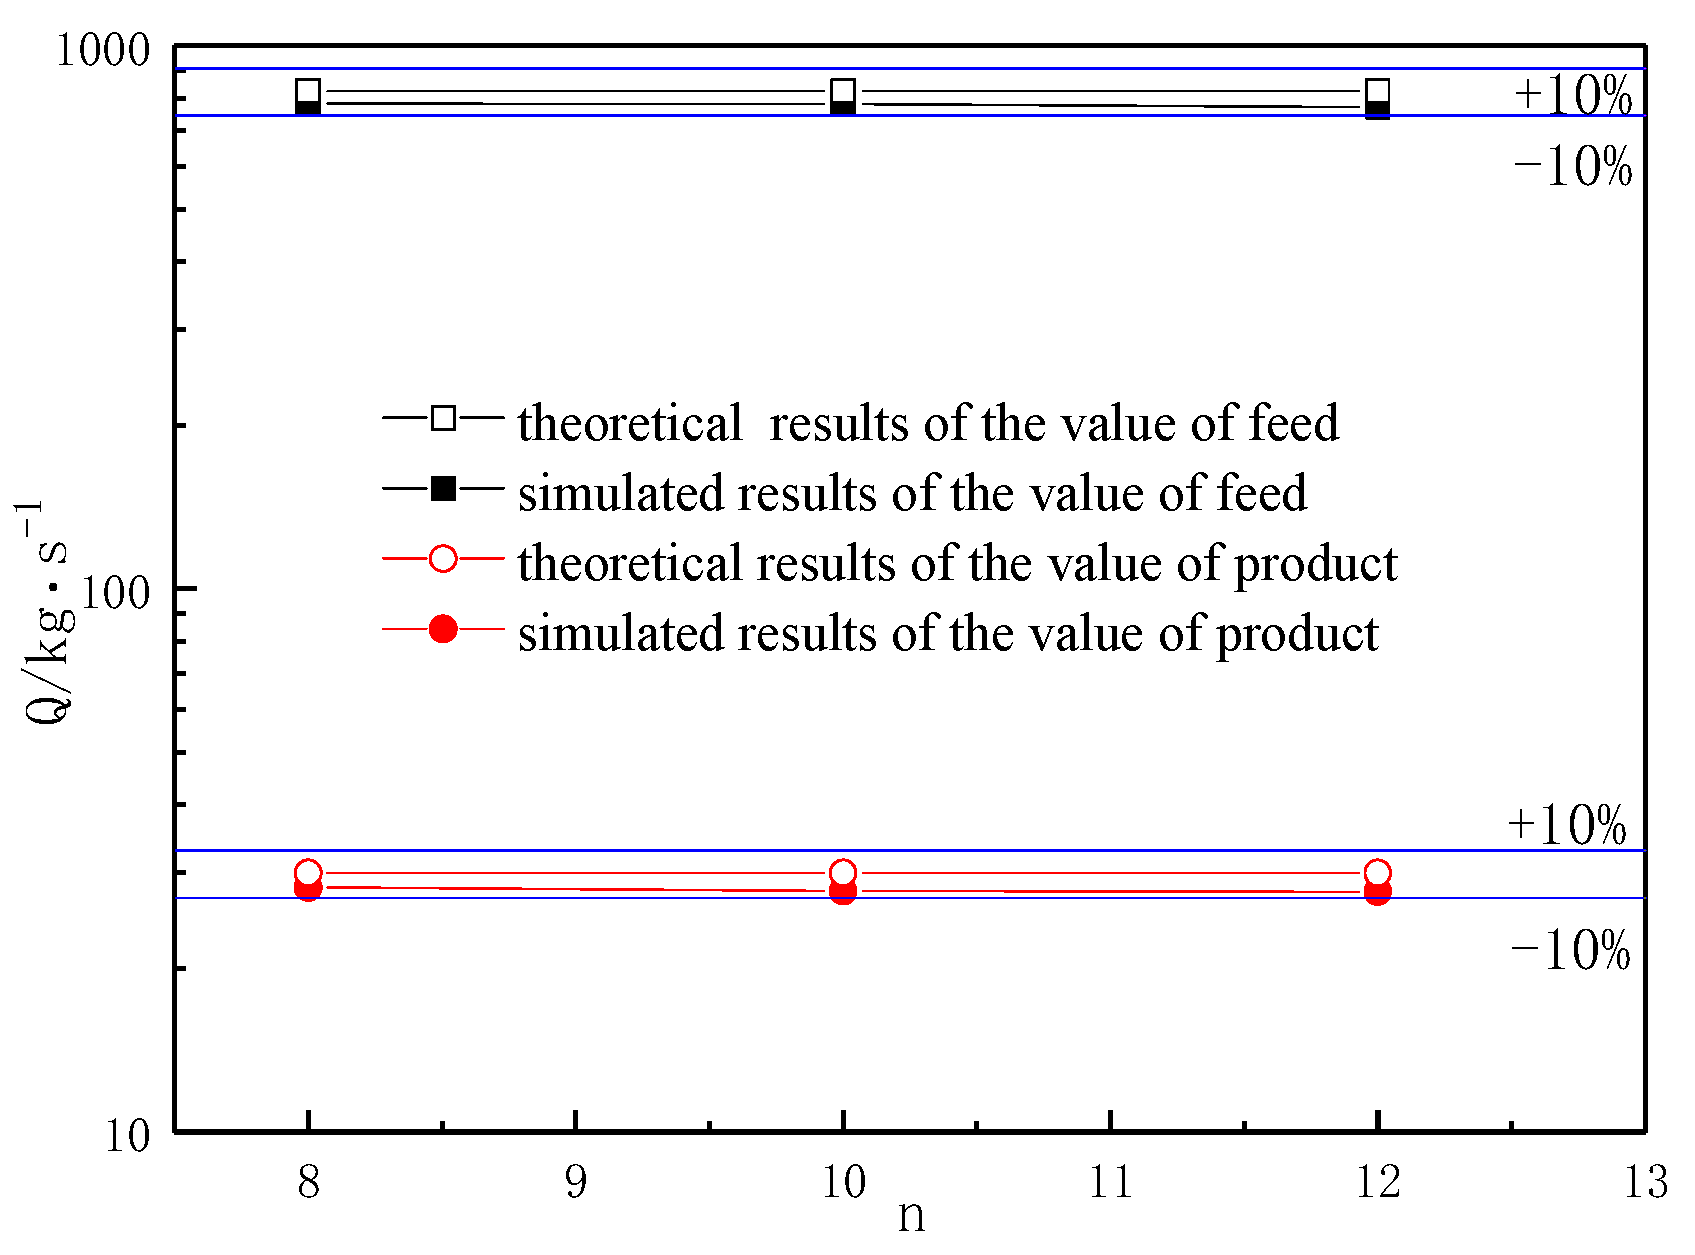
Figure 5.
The comparison of temperature distribution in the reactor after amplification: (a) magnified by 8 times (b) magnified by 10 times (c) magnified by 12 times.
Figure 5.
The comparison of temperature distribution in the reactor after amplification: (a) magnified by 8 times (b) magnified by 10 times (c) magnified by 12 times.
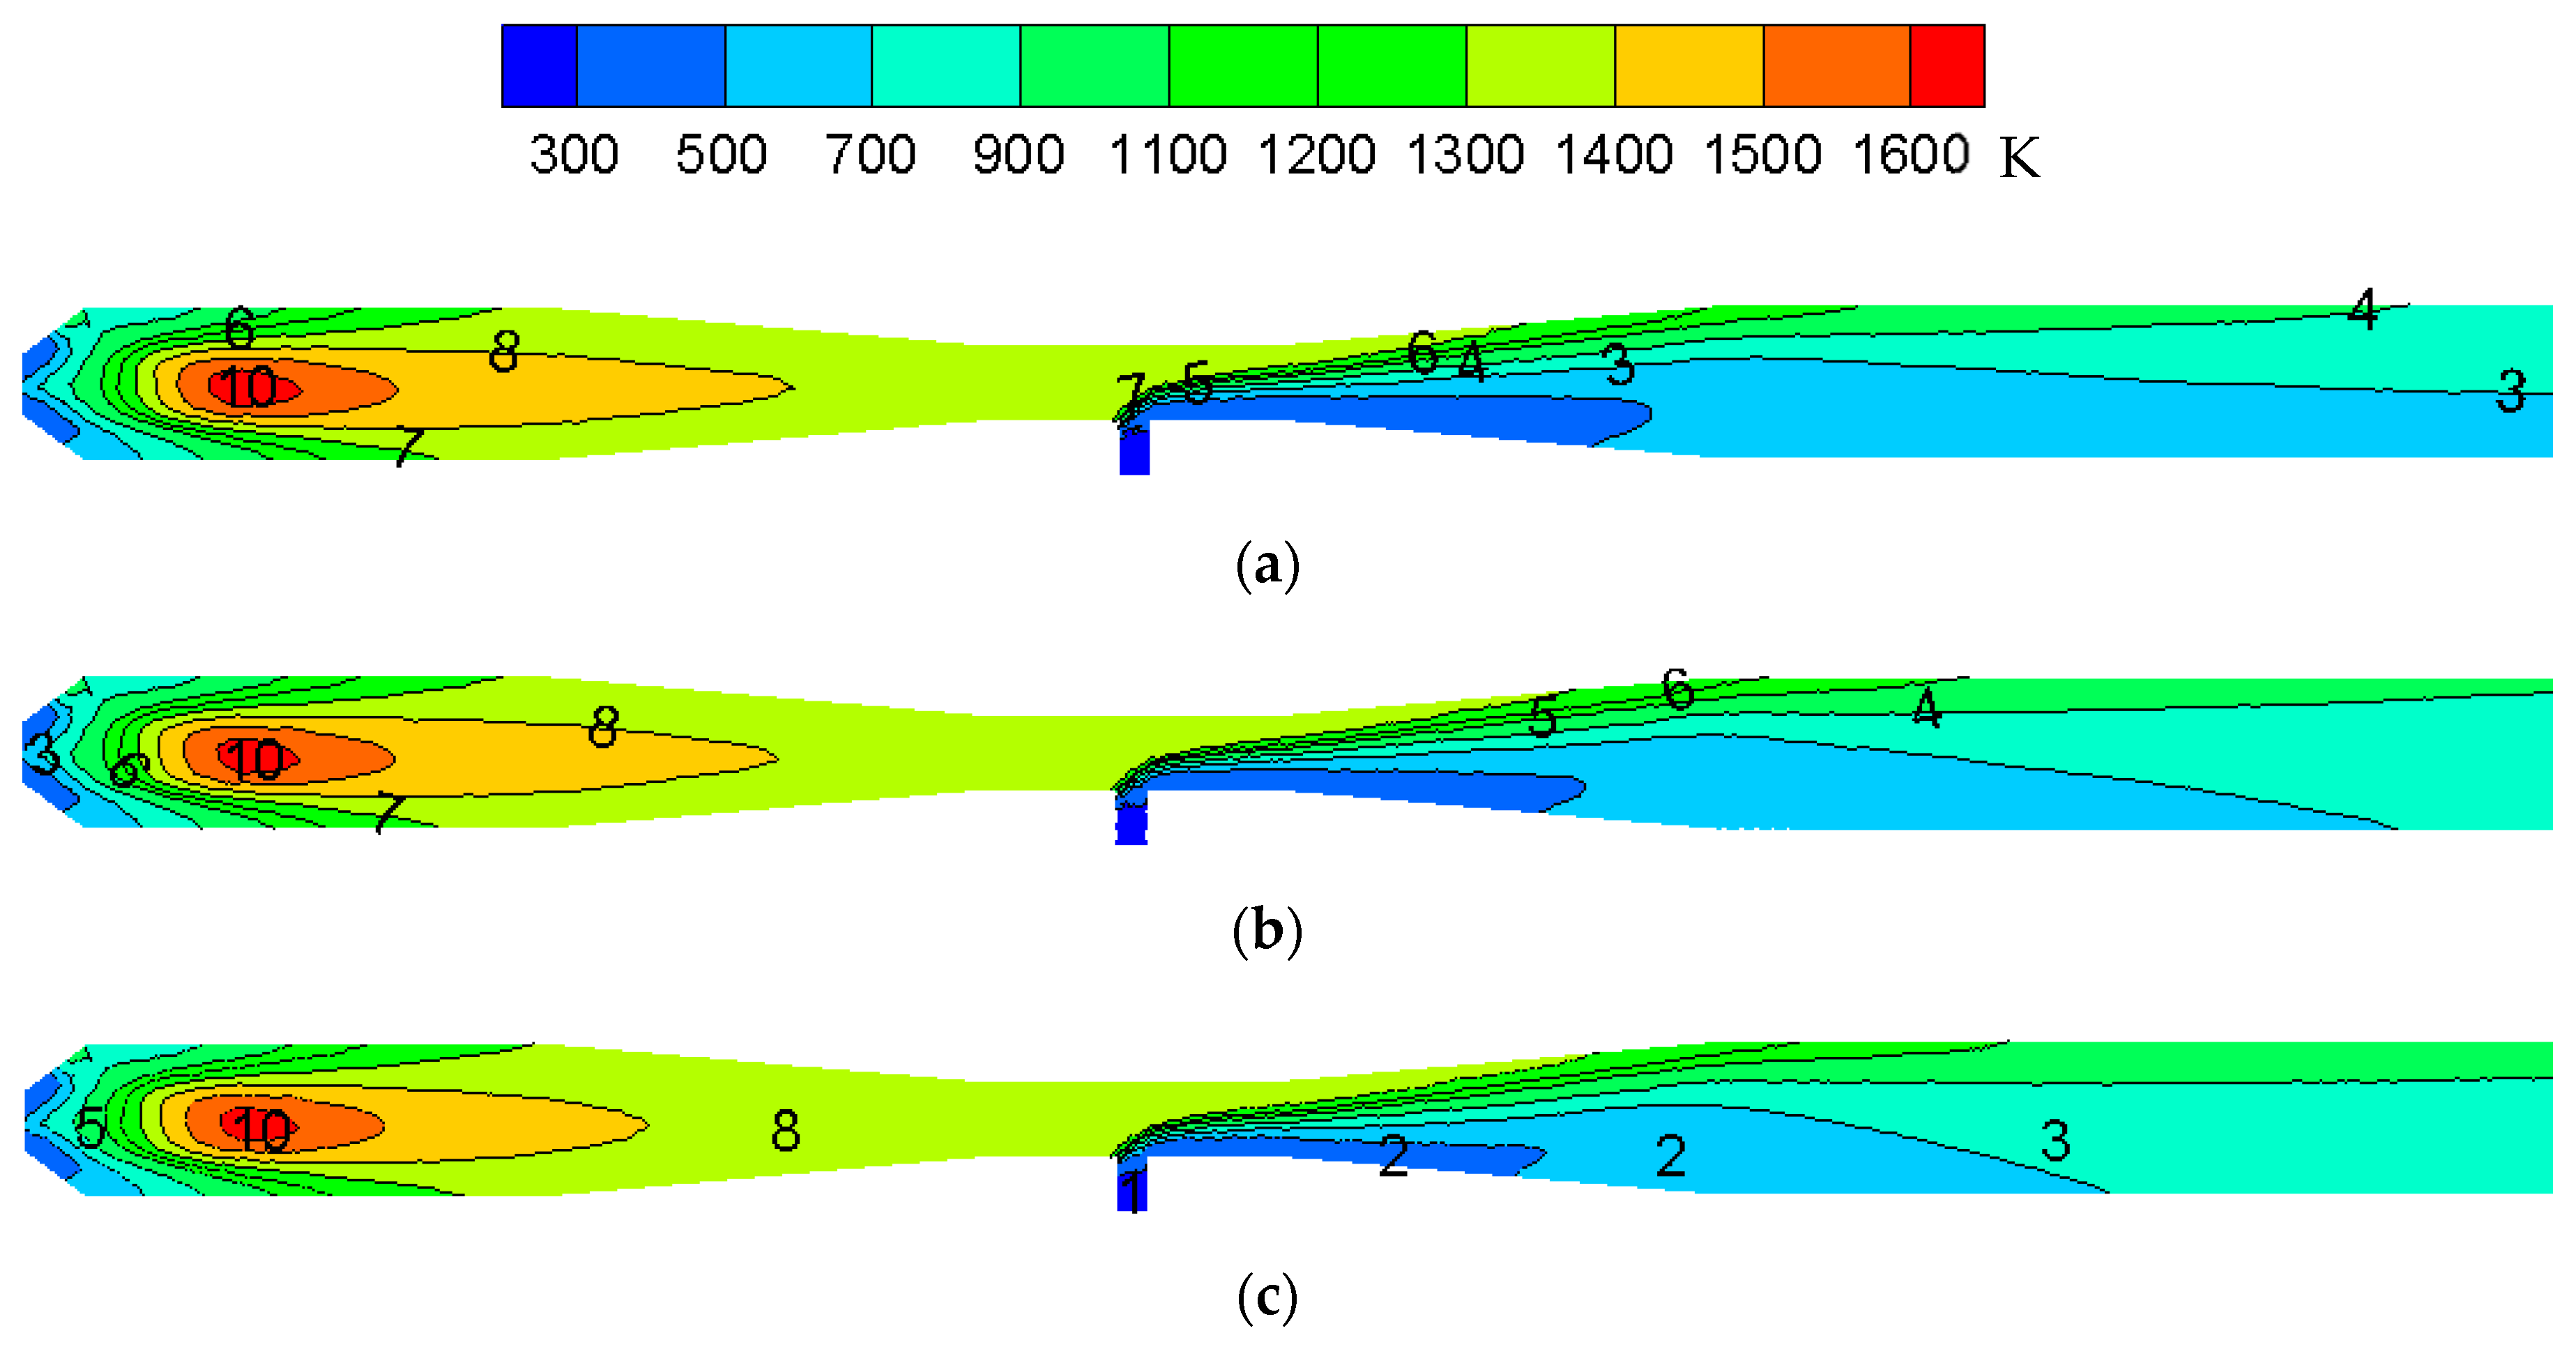
Figure 6.
The comparison of concentration distribution of CeCl3 in the reactor after amplification: (a) magnified by 8 times (b) magnified by 10 times (c) magnified by 12 times.
Figure 6.
The comparison of concentration distribution of CeCl3 in the reactor after amplification: (a) magnified by 8 times (b) magnified by 10 times (c) magnified by 12 times.
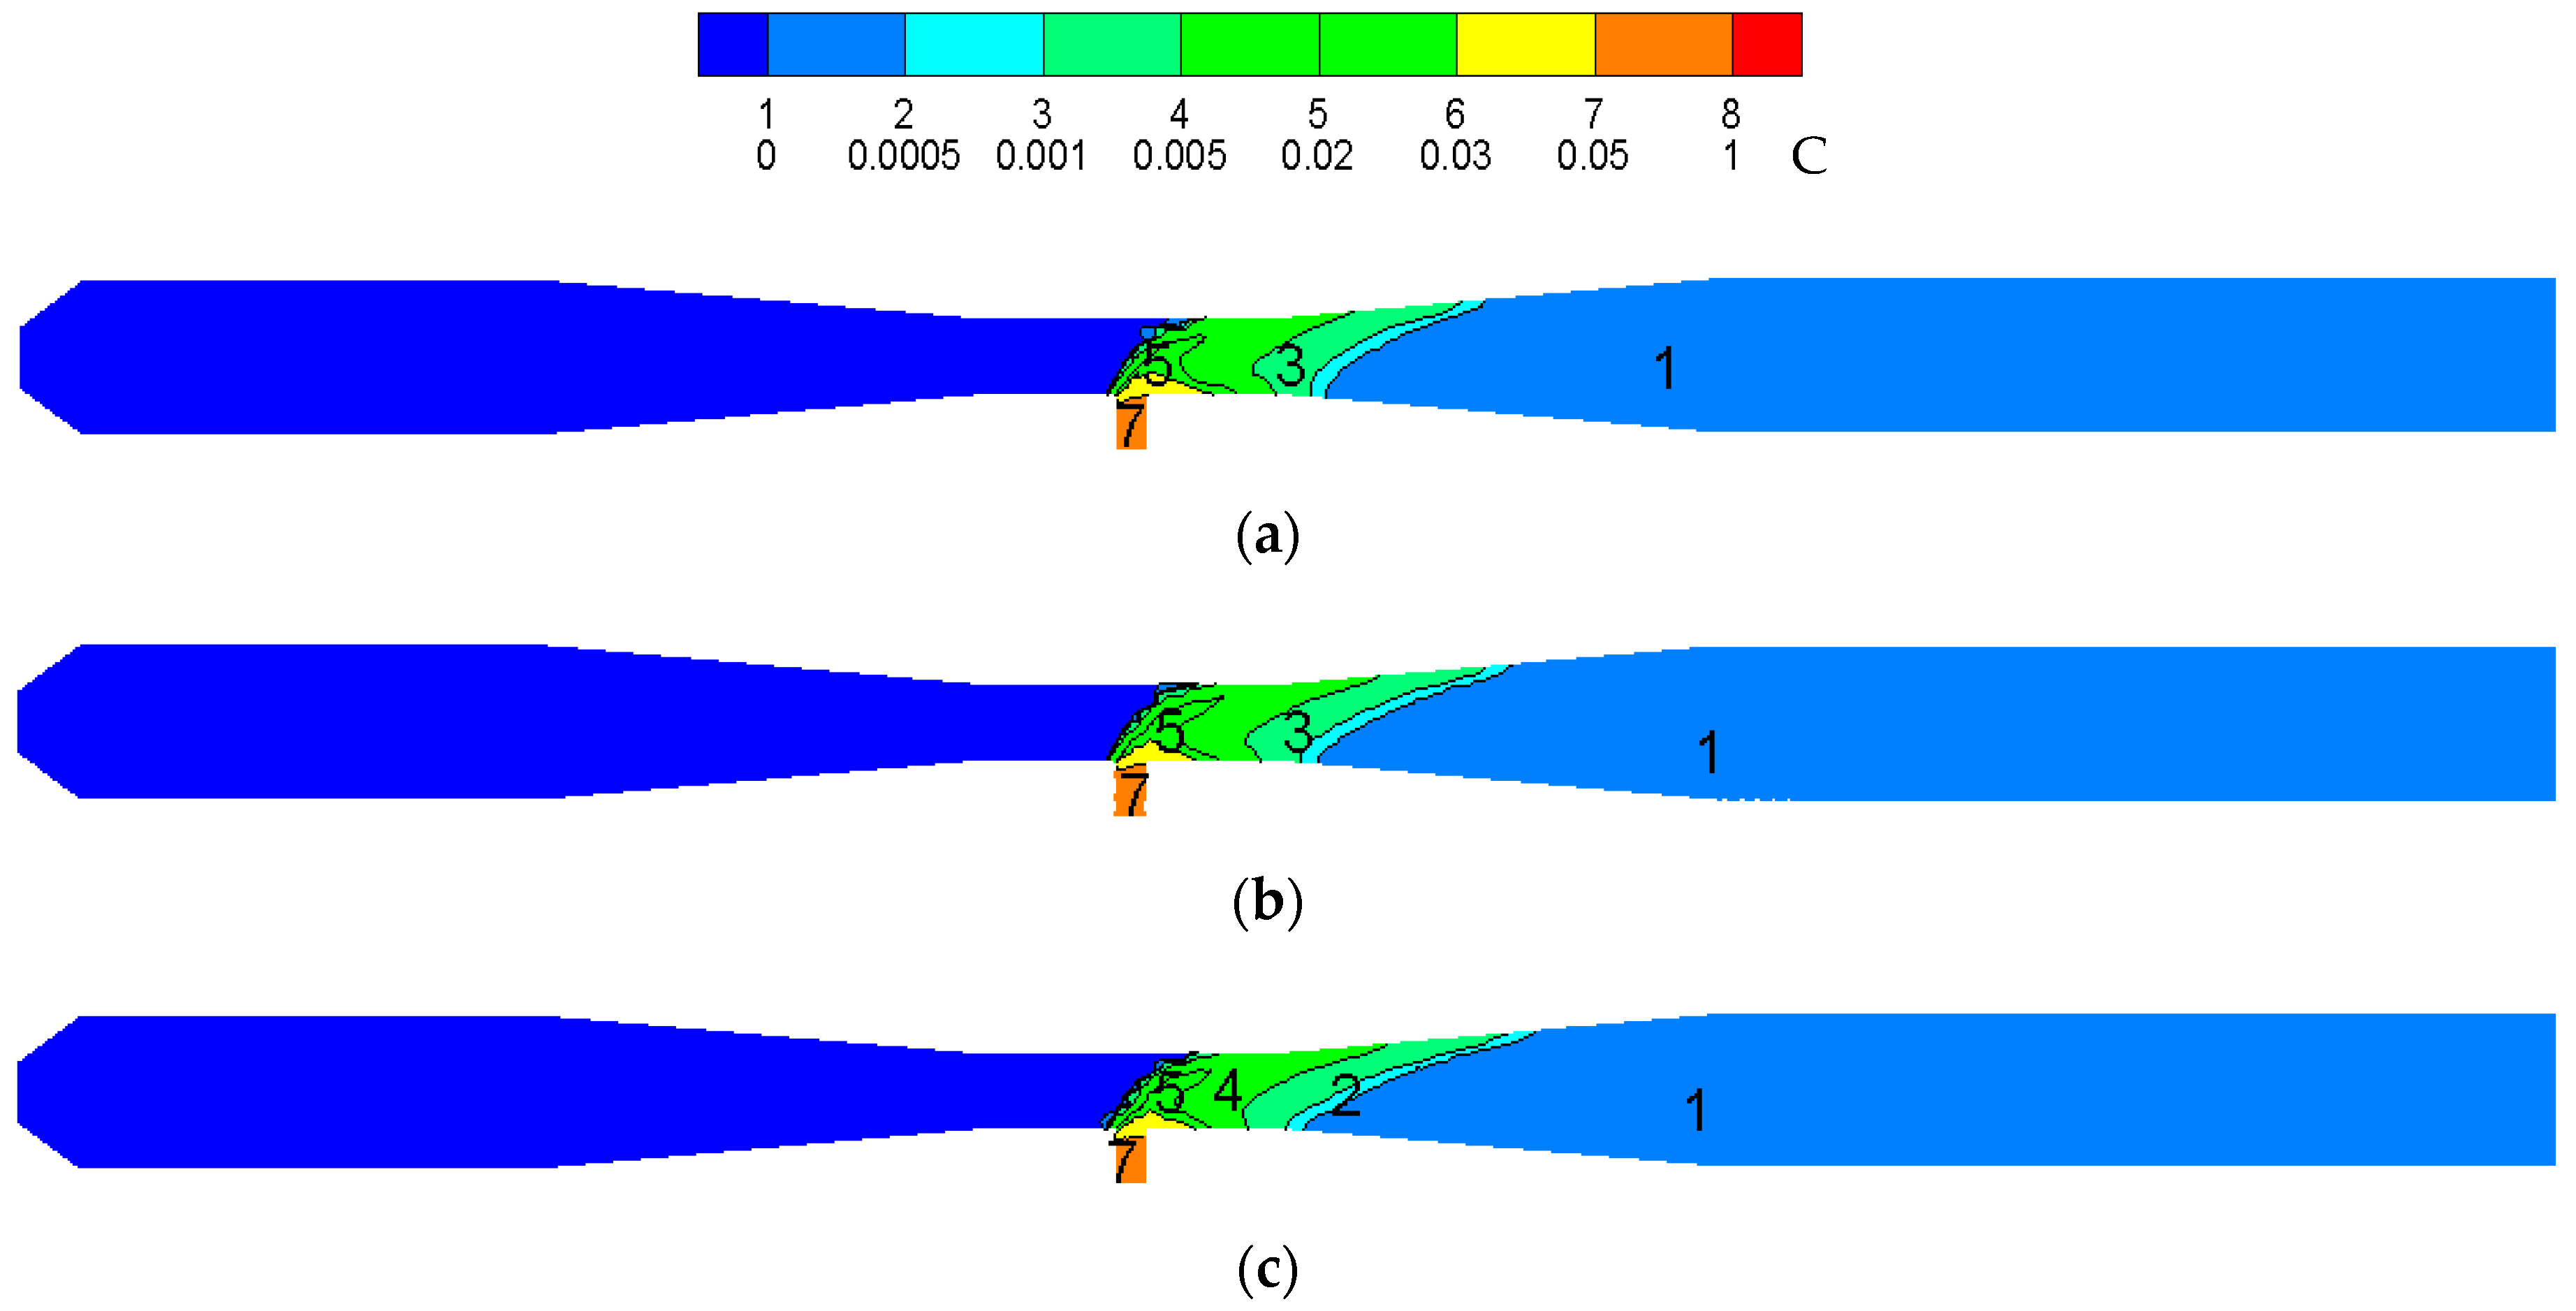
Figure 7.
The comparison of concentration distribution of CeO2 in the reactor after amplification: (a) magnified by 8 times (b) magnified by 10 times (c) magnified by 12 times.
Figure 7.
The comparison of concentration distribution of CeO2 in the reactor after amplification: (a) magnified by 8 times (b) magnified by 10 times (c) magnified by 12 times.

Table 1.
Boundary conditions.
| Types | CH4 Inlet | O2 Inlet | CeCl3 Inlet | Outlet |
|---|---|---|---|---|
| Boundary conditions | Velocity-inlet | Velocity-inlet | Velocity-inlet | Outflow |
| Value (m/s) | 1.44–14.4 | 10.575–105.75 | 0.03 |
Table 2.
Chart of dimension variables.
| Variables | Ρ (kg/m3) | Q (m3/s) | D (m) | V (m3/s) | P (Pa) | µ (Pa·s) |
|---|---|---|---|---|---|---|
| M (kg) | 1 | 0 | 0 | 0 | 1 | 1 |
| L (m) | −3 | 3 | 1 | 3 | −1 | −1 |
| T (s) | 0 | −1 | 0 | −1 | −2 | −1 |
Table 3.
Determination of the parameters of the enlarged model of a cerium chloride pyrolysis reactor.
Table 3.
Determination of the parameters of the enlarged model of a cerium chloride pyrolysis reactor.
| Types | P (Pa) | ρ (kg/m3) | d (m) | V (m3/s) | n |
|---|---|---|---|---|---|
| Model 1 | 42,413.25 | 1038.449 | 0.08 | 0.0127 | 10/5 |
| Model 2 | 46,302.17 | 0.1 | 0.0133 | ||
| Model 3 | 49,742.49 | 0.12 | 0.0138 |
© 2019 by the authors. Licensee MDPI, Basel, Switzerland. This article is an open access article distributed under the terms and conditions of the Creative Commons Attribution (CC BY) license (http://creativecommons.org/licenses/by/4.0/).
Share and Cite
MDPI and ACS Style
Lv, C.; Zhang, T.; Hao, B. Simulation of the Scale-up Process of a Venturi Jet Pyrolysis Reactor. Metals 2019, 9, 979. https://doi.org/10.3390/met9090979
AMA Style
Lv C, Zhang T, Hao B. Simulation of the Scale-up Process of a Venturi Jet Pyrolysis Reactor. Metals. 2019; 9(9):979. https://doi.org/10.3390/met9090979
Chicago/Turabian StyleLv, Chao, Tingan Zhang, and Bo Hao. 2019. "Simulation of the Scale-up Process of a Venturi Jet Pyrolysis Reactor" Metals 9, no. 9: 979. https://doi.org/10.3390/met9090979
Note that from the first issue of 2016, this journal uses article numbers instead of page numbers. See further details here.