1. Introduction
Crime is a major social and economic issue in poor countries across Latin America and the Caribbean (LAC). The abnormally high levels of crime constitute a key obstacle to the development of the region. The cost associated with these levels of crime is estimated at 14.2 percent of regional GDP [
1]. The increase in crime threatens social stability and is becoming a major obstacle to development in many poor countries in the region. Evidence shows that crime and violence consistently undermines development efforts at various levels and that it drives the depreciation of physical, human, and social capital
1. A number of studies have shown a strong negative relationship between crime and economic growth and development, with some arguing that high crime rates cause low growth (e.g., [
3,
4,
5]). The strong negative association between crime and economic growth and development sparks our interest in analyzing the effects of crime in poor countries.
A major problem associated with interpreting the empirical relationship between crime and economic growth and development concerns the direction of causation. To the extent that an increase in real per capita income and/or an increase in real GNP are correlated with crime, low development may cause more crime. A natural experiment would be a good way to examine causality. A good example of such a natural experiment is the relationship between the increase in the number of criminals deported from the US—due to changes in US immigration laws—and homicide rates in the receiving countries. Studies of this relationship between criminal deportation and crime have yielded mixed results [
6,
7,
8,
9,
10]
2. The most relevant of these studies is Blake, which uses cross-country five-year averaged panel data for a sample of developed and developing countries, to show a positive relationship between crime and criminal deportation.
The primary innovation of the paper is the approach use to break the simultaneity between crime and economic growth and development. The instrument (the increase in the number of criminal deportees from the US) identified by Blake [
10] provides a plausible
exogenous source of variation in crime rates and is used to study the effects of crime in poor countries. Estimated effects of crime on economic growth and development using this instrument allow us to suggest a clear policy including the abandonment of the activity that is contributing to the increase in crime rates and thus the hampering of development across developing countries.
In 1986, the US adopted legislation that changed US treatment of foreigners convicted of crimes in the US. While criminal activity has always been a basis for deportation of an individual, it was mostly a discretionary action based on the severity of the crime and the length of the prison sentence. Hence, before 1986, the majority of foreigners convicted of crimes in the US were held in US prisons. Starting in 1986, with the change of criminal deportation from a discretionary to an obligatory action, all foreigners convicted of crimes were deported to their home countries. The terms of the deportation specified that they—including those convicted of violent crimes—were not to be incarcerated at home. Thus criminal deportees generally arrive as free citizens in their home countries, usually with little or no money, and with no prospects of work because they are often stigmatized in the legal labor market.
Various studies have shown that a person’s propensity for criminal behavior increases as wages and the probability of finding legal employment fall
3. Contagion models of crime suggest that the behavior of criminal deportees may also substantially affect the behavior of non-deportees. Case and Katz [
14] find that a person’s propensity to commit crime rises when his peers are also engaged in criminal activities. Glaeser
et al. [
15] explainthe very high variance of crime rates across US cities through a model in which agents propensity to engage in crime is influenced by neighbor’s choices. In his analysis of the escalation of violent crime in Colombia during the 1980s and 1990s, Gavira [
16] develops several models that isolate different types of externalities among criminals, supporting the hypothesis that an inflow of criminal deportees contributes to a country’s crime rate. It is important to note that the US legislation was a response to events in the US and not events in the receiving countries. The fact that some countries received more deportees (measured as a fraction of home population) than others is also important.
The remainder of this paper is organized as follows.
Section 2 summarizes the data set used in the analysis.
Section 3 establishes a positive relationship between the size of the criminal deportee population and home country homicide rates. A positive reduced-form correlation between the size of the deportation population and homicide rate is also demonstrated.
Section 4 estimates a relationship between homicide rate and measures of economic growth and development, using changes in deportation population as an instrument.
Section 5 concludes.
2. Data and Descriptive Statistics
The data set used in this paper is a panel of 30 LAC countries with observation running from 1985 to 2009
4. Throughout the paper all deportation and homicide rates are defined on a per-capita basis. Data on the number of criminal deportees are taken from the
Yearbook of Immigration Statistics issued by the US Department of Homeland Security, and are available annually on a country level basis. Criminal deportations from the US are distinct from deportations for simple immigration violations like entering the country without a visa or permit. However, the ranks of criminal deportees do include those deported for crimes that are related to immigration, for example, smuggling or aiding illegal entry.
Data on homicide rates are based on the number of homicides reported to the police over the course of a year, as compiled annually by the various crime investigative units in each country and reported to the
United Nations World Crime Surveys. Homicides instead of overall crime rates are used because there is comparatively less underreporting for homicides than other crimes
5. The use of reported (as opposed to actual) homicide rates can be a clear source of measurement error. However, since the homicide rate is the left-hand side variable in the analysis, such measurement error (if present) will not lead to bias in the parameter estimates unless the measurement error is correlated with the right hand side variables
6.
Increasingly, development economists have become aware that the growth of output by itself is not an adequate indicator of development, and that the reduction of poverty and the satisfaction of basic human needs are goals that should show up in a measure of development
7. As a result, the indicators of development used in this study are the average annual growth rate of real GNP per capita, which is calculated on the basis of data expressed in 2007 prices, and the Human Development Index (HDI)
8. My control set consists of six variables that are frequently cited in the empirical growth literature as traditional long-run determinants of economic growth: openness to trade, domestic investment, income, years of schooling, Foreign Direct Investment (FDI), and government spending. I also collected information on a few other variables that are frequently cited in the crime literature: unemployment, and income inequality
9.
Appendix A describes in detail the data and sources.
Table 1 gives summary statistics for all 30 countries for the data described above, as well as for additional variables (economic factors, and demographic controls) used in the analysis.
Table 1.
Summary statistics.
Table 1.
Summary statistics.
| Variable | Mean | Standard Deviation | Minimum | Maximum |
|---|
| Population | 1,310,000 | 3,004,000 | 40,833 | 19,300,000 |
| Deportees per 100,000 | 11.6 | 15.7 | 0.002 | 102.6 |
| Homicides per 100,000 | 19.3 | 16.4 | 1.4 | 78.0 |
| HDI | 0.71 | 0.07 | 0.88 | 0.50 |
| Growth rate | 3.3 | 4.4 | −14.9 | 23.5 |
| Average Income | 8088.3 | 5645.5 | 1027.1 | 31,305.43 |
| Openness to Trade | 78.2 | 41.7 | 9.1 | 260.4 |
| Domestic Investment | 22.3 | 10.9 | 1.1 | 63.4 |
| Government Spending | 16.1 | 12.6 | 3.6 | 71.6 |
| FDI | 4.7 | 5.4 | −12.2 | 39.8 |
| Education | 4.0 | 1.6 | 0.4 | 14.0 |
| Income inequality | 52.0 | 5.6 | 34.4 | 69.2 |
| Unemployment rate | 10.5 | 5.3 | 1.3 | 28.5 |
3. US Deportation Rates as an Instrumental Variable
3.1. US Legislation and Deportation
During the past 26 years, US immigration law has evolved in response to public perceptions of a link between immigration and criminal activity
10. Before 1986, deportation was reserved for violent crimes and those crimes that carried long prison sentences. The Immigration Reform and Control Act (IRCA) of 1986 require the Attorney General to begin deportation procedures once a person has been convicted of a deportable crime. This policy changed criminal deportation from a discretionary to a mandatory action. With the passage of the Anti-Drug Abuse Act (ADA) in 1988, Congress increased the range of crimes that could render someone deportable, and limited the procedures available to non-citizens who wished to challenge their deportation. Before 1988, non-citizens could be deported from the United States only after a hearing before an immigration judge in which the non-citizen could raise one of several bases for canceling their deportation orders.
The Immigration Act of 1990 expanded the category of crimes that required mandatory deportation to include crimes of violence for which the term of imprisonment that the court may impose is at least five years, as well as money laundering and trafficking in any controlled substance. The Immigration and Technical Corrections Act of 1994 added additional weapons offenses, some theft and burglary offenses, prostitution, tax evasion, and several categories of fraud as aggravated felonies. The Illegal Immigration Reform and Immigration Responsibility Act (IIRIRA) of 1996 was applied retroactively to all persons convicted of deportable offenses, including US citizens who committed minor offenses decades ago as non-citizens but have been naturalized since. Under the 1996 law, every non-US citizen who is sentenced to a year or more in prison is subject to deportation, even if the sentence is suspended. The Real ID Act of 2005 updates and tightened the laws on application for asylum and deportation of aliens for terrorist activity. Between 1996 and 2009, the average number of annual criminal deportations more than tripled. Morawetz [
22] argues that most of the increase occurred as a result of the IIRIRA of 1996.
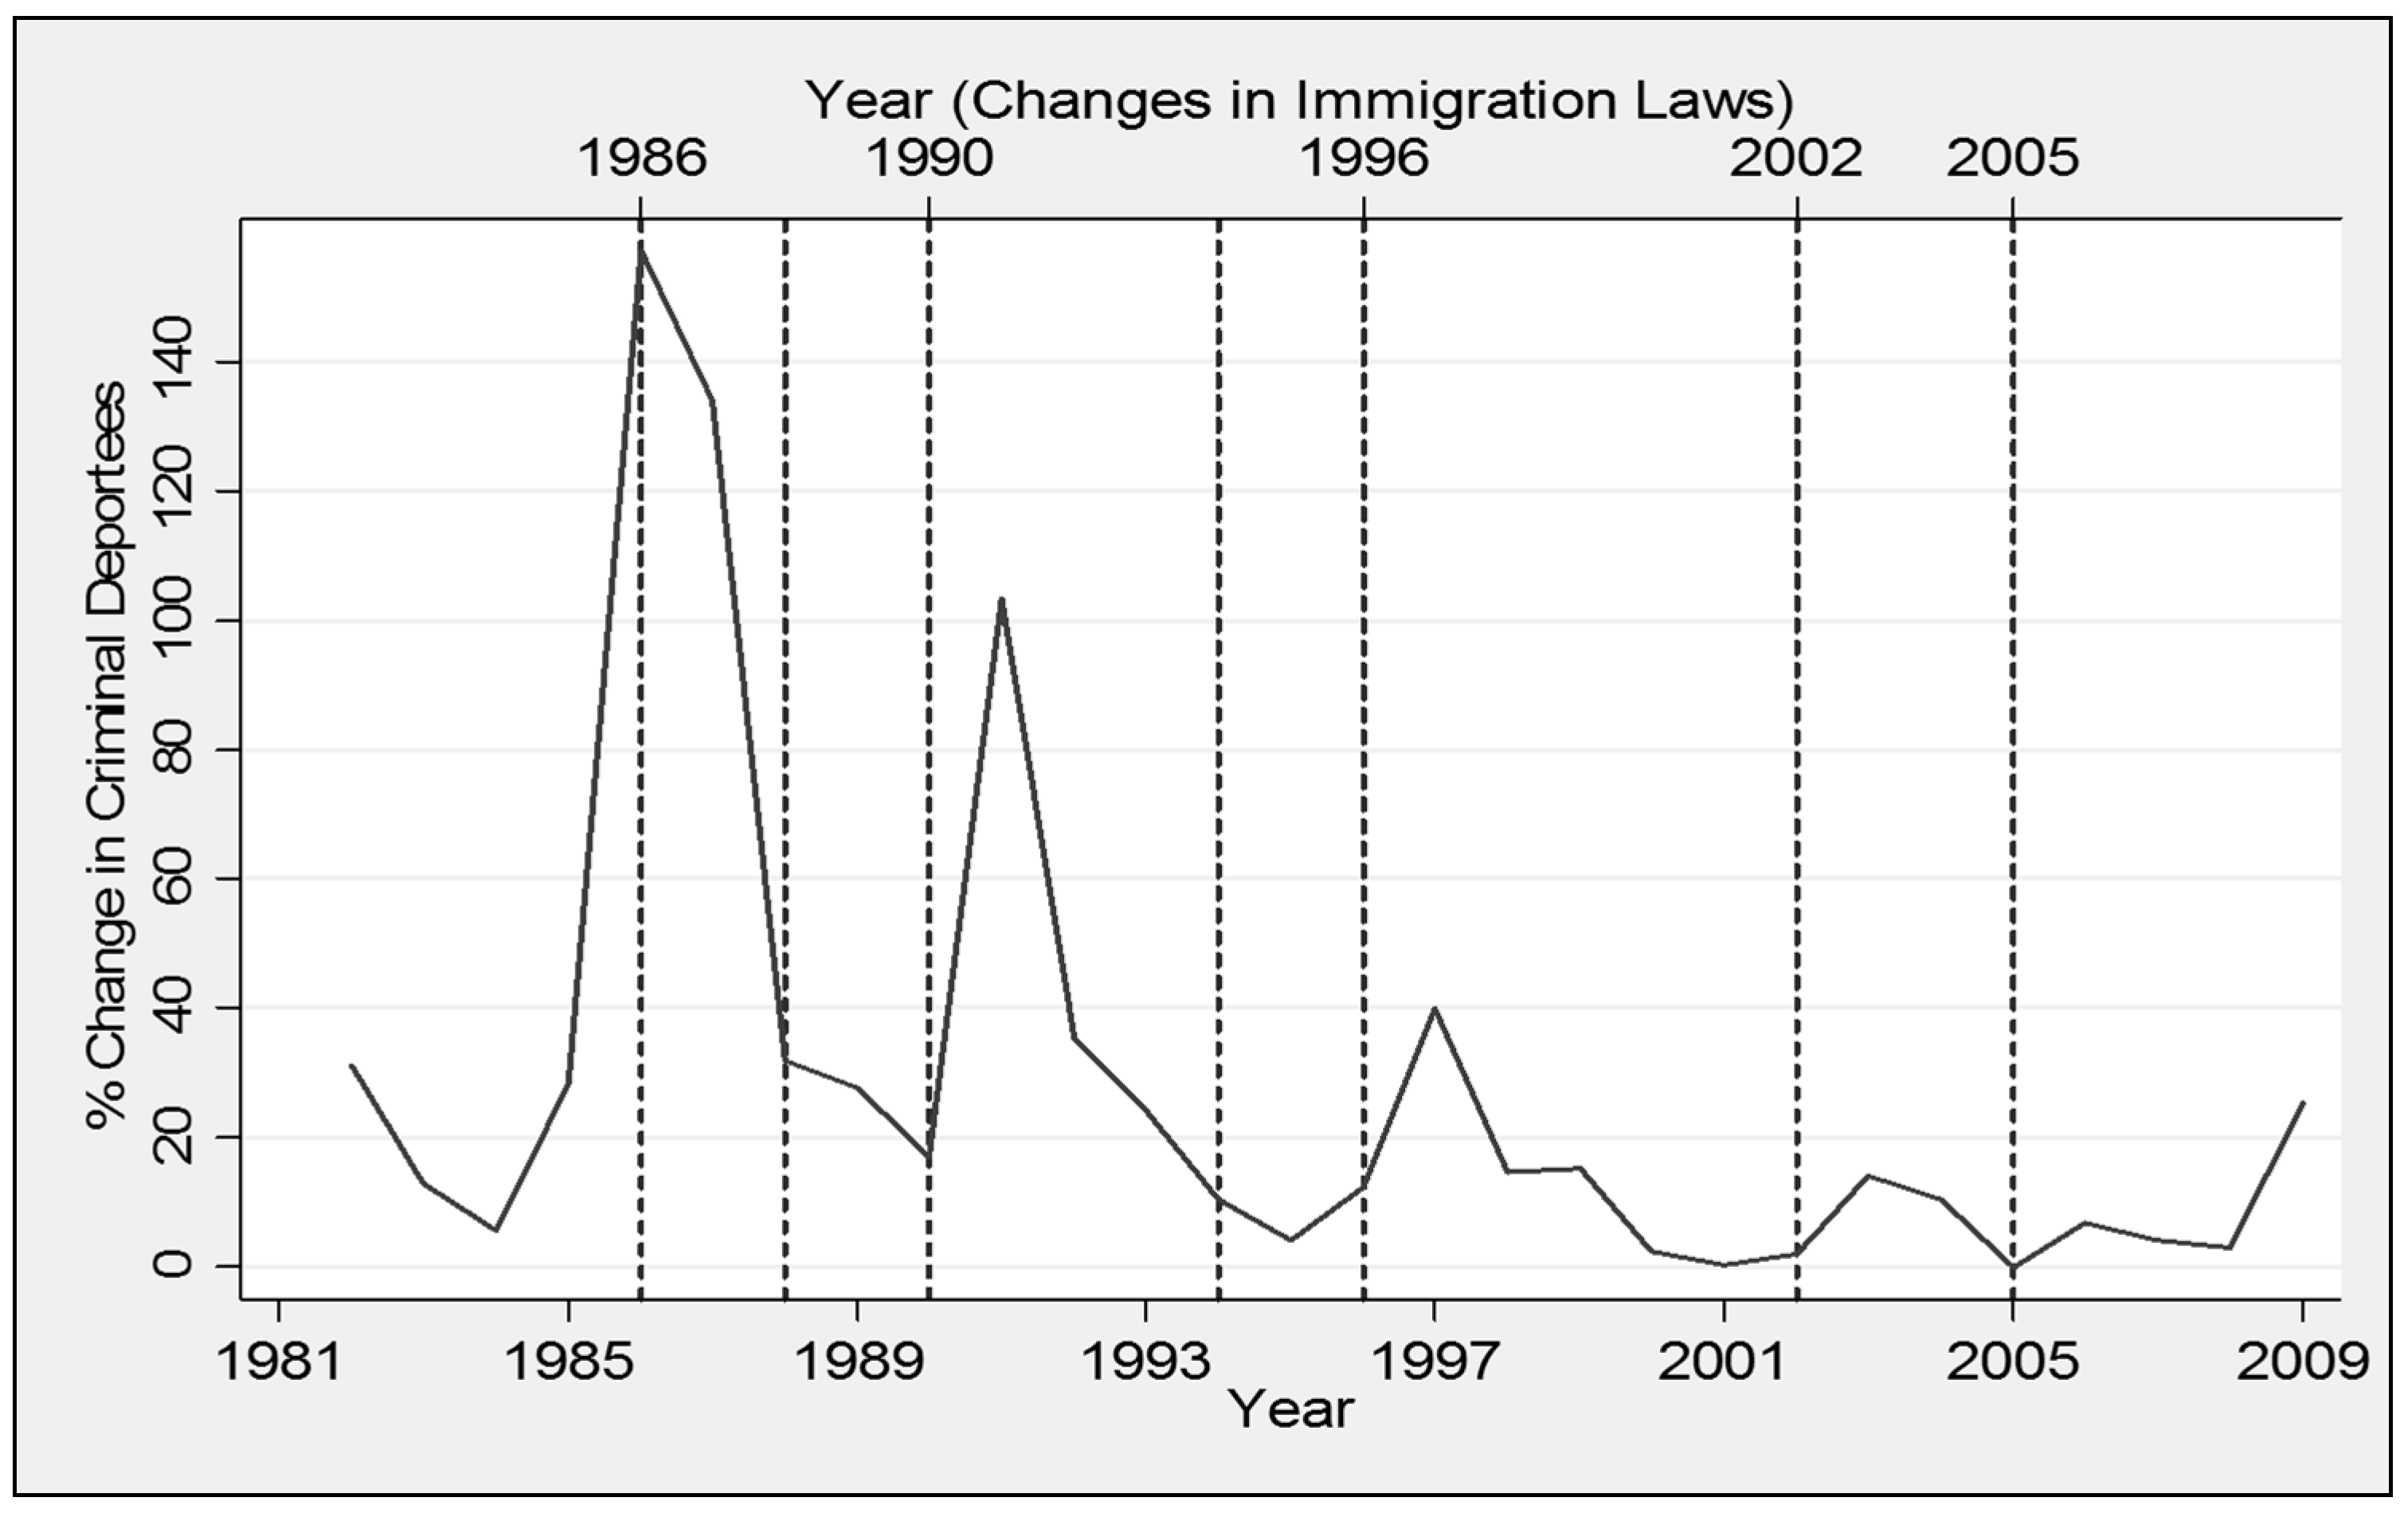
Figure 1 provides an analysis of year-to-year changes in increases in the number of criminal deportees for immigration years
versus non-immigration years. It is clear that the average change in the number of criminal deportees exhibit significantly higher rates of increase in five of the seven events.
Figure 1.
Yearly Changes in Criminal Deportation (1980–2009). Sources: U.S. Department of Homeland Security.
Figure 1.
Yearly Changes in Criminal Deportation (1980–2009). Sources: U.S. Department of Homeland Security.
3.2. Home Country Homicide and US Deportation Rate
The rate of intentional homicides in many developing countries increased significantly between the mid-1980s and the late 1990s. During the same time, the number of criminal deportees from the US increased by more than 370 percent.
Table 2 shows the relative size of the deportee population to the domestic prison population for the countries in the sample for the year 2009. For example, the inflow of criminal deportees into Honduras was equivalent to releasing 59 percent of the prison population into the society that year. Similarly, the number of criminal deportees into Guatemala was equal to 45 percent of Guatemala’s prison population. The inflow of criminal deportees in El Salvador and Jamaica exceeded 24 percent of their respective prison populations. In Antigua, Bahamas, Grenada, Dominica, Dominican Republic, Trinidad and Tobago, Belize, and Nicaragua, the inflow of criminal deportees was at least five percent of their prison population. Thus, in many of the receiving countries, incoming criminal deportees are a sizeable percentage of the countries’ overall prison population representing a sizeable danger.
Table 2.
Relative size of deportee population to the entire criminal population: 2009.
Table 2.
Relative size of deportee population to the entire criminal population: 2009.
| Country | Prison Population per 100,000 Persons | Criminal Deportees per 100,000 Persons |
|---|
| Antigua | 389 | 32.4 |
| Bahamas | 379 | 27.9 |
| Barbados | 529 | 12.9 |
| Cuba | 510 | 0.76 |
| Grenada | 430 | 20.1 |
| Dominica | 369 | 25.4 |
| Dominican Republic | 248 | 22.3 |
| Haiti | 95 | 4.8 |
| Jamaica | 152 | 46.2 |
| St Kitts | 611 | 15.5 |
| St Lucia | 321 | 11.4 |
| St Vincent | 422 | 14.7 |
| Trinidad and Tobago | 362 | 19.5 |
| Belize | 495 | 41.9 |
| Costa Rica | 347 | 2.7 |
| El Salvador | 432 | 102.6 |
| Guatemala | 105 | 46.8 |
| Honduras | 160 | 93.7 |
| Nicaragua | 153 | 10.8 |
| Panama | 398 | 2.2 |
| Argentina | 161 | 0.3 |
| Bolivia | 138 | 0.5 |
| Brazil | 275 | 0.2 |
| Chile | 250 | 0.4 |
| Colombia | 238 | 2.5 |
| Ecuador | 156 | 4.1 |
| Guyana | 269 | 27.7 |
| Peru | 222 | 1.3 |
| Uruguay | 281 | 1.5 |
| Venezuela | 174 | 0.5 |
Graphically, changes in home country homicide rates tend to mirror changes in the number of criminal deportees, as demonstrated in
Figure 2. Over the same period that the number of deportees from the US more than tripled, homicides in a sample of countries, representative of the population, more than doubled.
Figure 2.
Trends in Homicides and Criminal Deportation (1980–2009). Sources: US Department of Homeland Security, DACS and the United Nations World Crime Survey [
24].
Figure 2.
Trends in Homicides and Criminal Deportation (1980–2009). Sources: US Department of Homeland Security, DACS and the United Nations World Crime Survey [
24].
Another way of examining the robustness of the relationship between home country homicide rates and criminal deportees is to analyze the data on a country-by-country basis. A list of the countries, along with information on mean changes in homicides and criminal deportees per capita in immigration years and non-immigration years, is provided in
Appendix A. Countries in the sample with higher average increase in criminal deportees also have higher average homicides (See
Figure 3).
Figure 3.
Home Country Homicide and Criminal Deportation (1980–2009). Sources: US Department of Homeland Security, DACS and the United Nations World Crime Survey [
24].
Figure 3.
Home Country Homicide and Criminal Deportation (1980–2009). Sources: US Department of Homeland Security, DACS and the United Nations World Crime Survey [
24].
Those simple averages, of course, do not take into account possible correlation between the changes in the number of criminal deportees from the US and other factors that might influence homicide rates in the home country, such as the state of the economy. To allow for such considerations, the relationship between a receiving country’ homicide rates and criminal deportees from the US is modeled more formally as follows:
where
is the number of homicides per capita for country
i in year
t;
is the number of criminal deportees per capita for country
i in year
t; and X is a matrix of covariates including demographic and economic variables, and year dummies.
Table 3 presents regression estimates for three variations of Equation (1). Column (1) includes only criminal deportees and year dummies as covariates. Column (2) adds demographic and economic controls. Column (3) adds country-fixed effects. The country-fixed effects in column (3) capture country-level trends in homicides because the left-hand-side variable is differenced. A 10 percent increase in criminal deportees from the US is associated with 2.5 percent more homicides in the receiving country. The criminal deportee coefficient is statistically significant. The other covariates are statistically significant and carry an expected sign.
Table 3.
Changes in Criminal Deportees as a Predictor of Changes in Home Country Homicides.
Table 3.
Changes in Criminal Deportees as a Predictor of Changes in Home Country Homicides.
| Variable | (1) Homicides | (2) Homicides | (3) Homicides | (4) HDI |
|---|
| ln Criminal deportees | 0.149 *** | 0.221 *** | 0.250 *** | 0.001 *** |
| (0.019) | (0.021) | (0.038) | (0.000) |
| ln Average income | | −0.010 | −12.29 *** | 0.096 *** |
| | (0.062) | (2.99) | (0.003) |
| Income inequality | | 0.014 *** | −0.129 ** | 0.002 *** |
| | (0.004) | (0.066) | (0.0002) |
| Unemployment rate | | −0.021 *** | 0.479 *** | 0.0002 |
| | (0.005) | (0.108) | (0.0003) |
| Years of Schooling | | 0.016 | 0.911 * | 0.002 ** |
| | (0.021) | (0.013) | (0.001) |
| Year Indicators? | Yes | Yes | Yes | Yes |
| Country-fixed effects? | No | No | Yes | Yes |
| Data differenced? | No | No | Yes | Yes |
| R-squared | 0.886 | 0.360 | 0.842 | 0.886 |
Given that home country homicide rates increases when the number of criminal deportees from the US increases, then if home country homicides affect economic growth and development (measured by the growth in income and HDI, respectively), reduced-form relationship between increases in criminal deportees and economic growth and development should emerge. In the two reduced-form specifications, the dependent variables examined are the growth in income and the level of the receiving countries’ HDI:
where HDI and GDP is the Human Development Index and Gross Domestic Product in country
i in year
t, respectively. The other right-hand-side variables in Equation (2) are identical to those in Equation (1). However, in Equation (3),
is the number of criminal deportees per capita for country
i in year
t; and Z is a matrix of covariates including the six traditional long-run determinants of economic growth listed in
Section 2 and year dummies.
Column (4) of
Table 3 presents the results of estimating Equation (2) for the HDI. An increase in deportation is associated with a reduction in the receiving country’s HDI. The point estimate implies that the HDI is 0.1 percent lower than otherwise would be expected due to increases in US deportation. The other covariates, with the exception of the unemployment rate and income inequality, are statistically significant and carry an expected sign. In specifications omitting the covariates (not shown in table), similar deportation coefficients are obtained. An estimation of Equation (3) also shows that increases in criminal deportees reduce economic growth
11.
4. Estimating the Effect of Homicide on Economic Growth and Development
The preceding section demonstrates a positive correlation between increases in criminal deportation and home country homicide rates, as well as a negative correlation between home country’s growth and development and the increase in criminal deportees from the US. Together those results suggest a direct relationship between an increase in homicide rates and the impediments to growth and development that is examined in this section using increases in criminal deportees from the US as an instrument for changes in the receiving countries’ homicide rates.
In order for increases in criminal deportees to serve as an instrument to identify the effect of homicide on economic growth and development, it must be the case that increases in criminal deportation is validly excluded from the growth and development “function”. Such exclusion is invalid if there are other variables that are both correlated with growth and development and affected by changes in criminal deportation from the US. In particular, the social and economic performance in the home country might fall in that category since it may have effects on the number of persons leaving the country in search of better opportunity in the US. It is also possible that the proportion of a country’s population residing in the US is likely to be correlated with future economic prospects of the country, which in turn is likely to be correlated with future growth and development. In estimating a relationship between homicides and economic growth and development, therefore, controls are included for a countries social and economic performance. Having controlled for such factors, changes in criminal deportees would appear to be a plausible instrument.
4.1. Homicide and Economic Growth
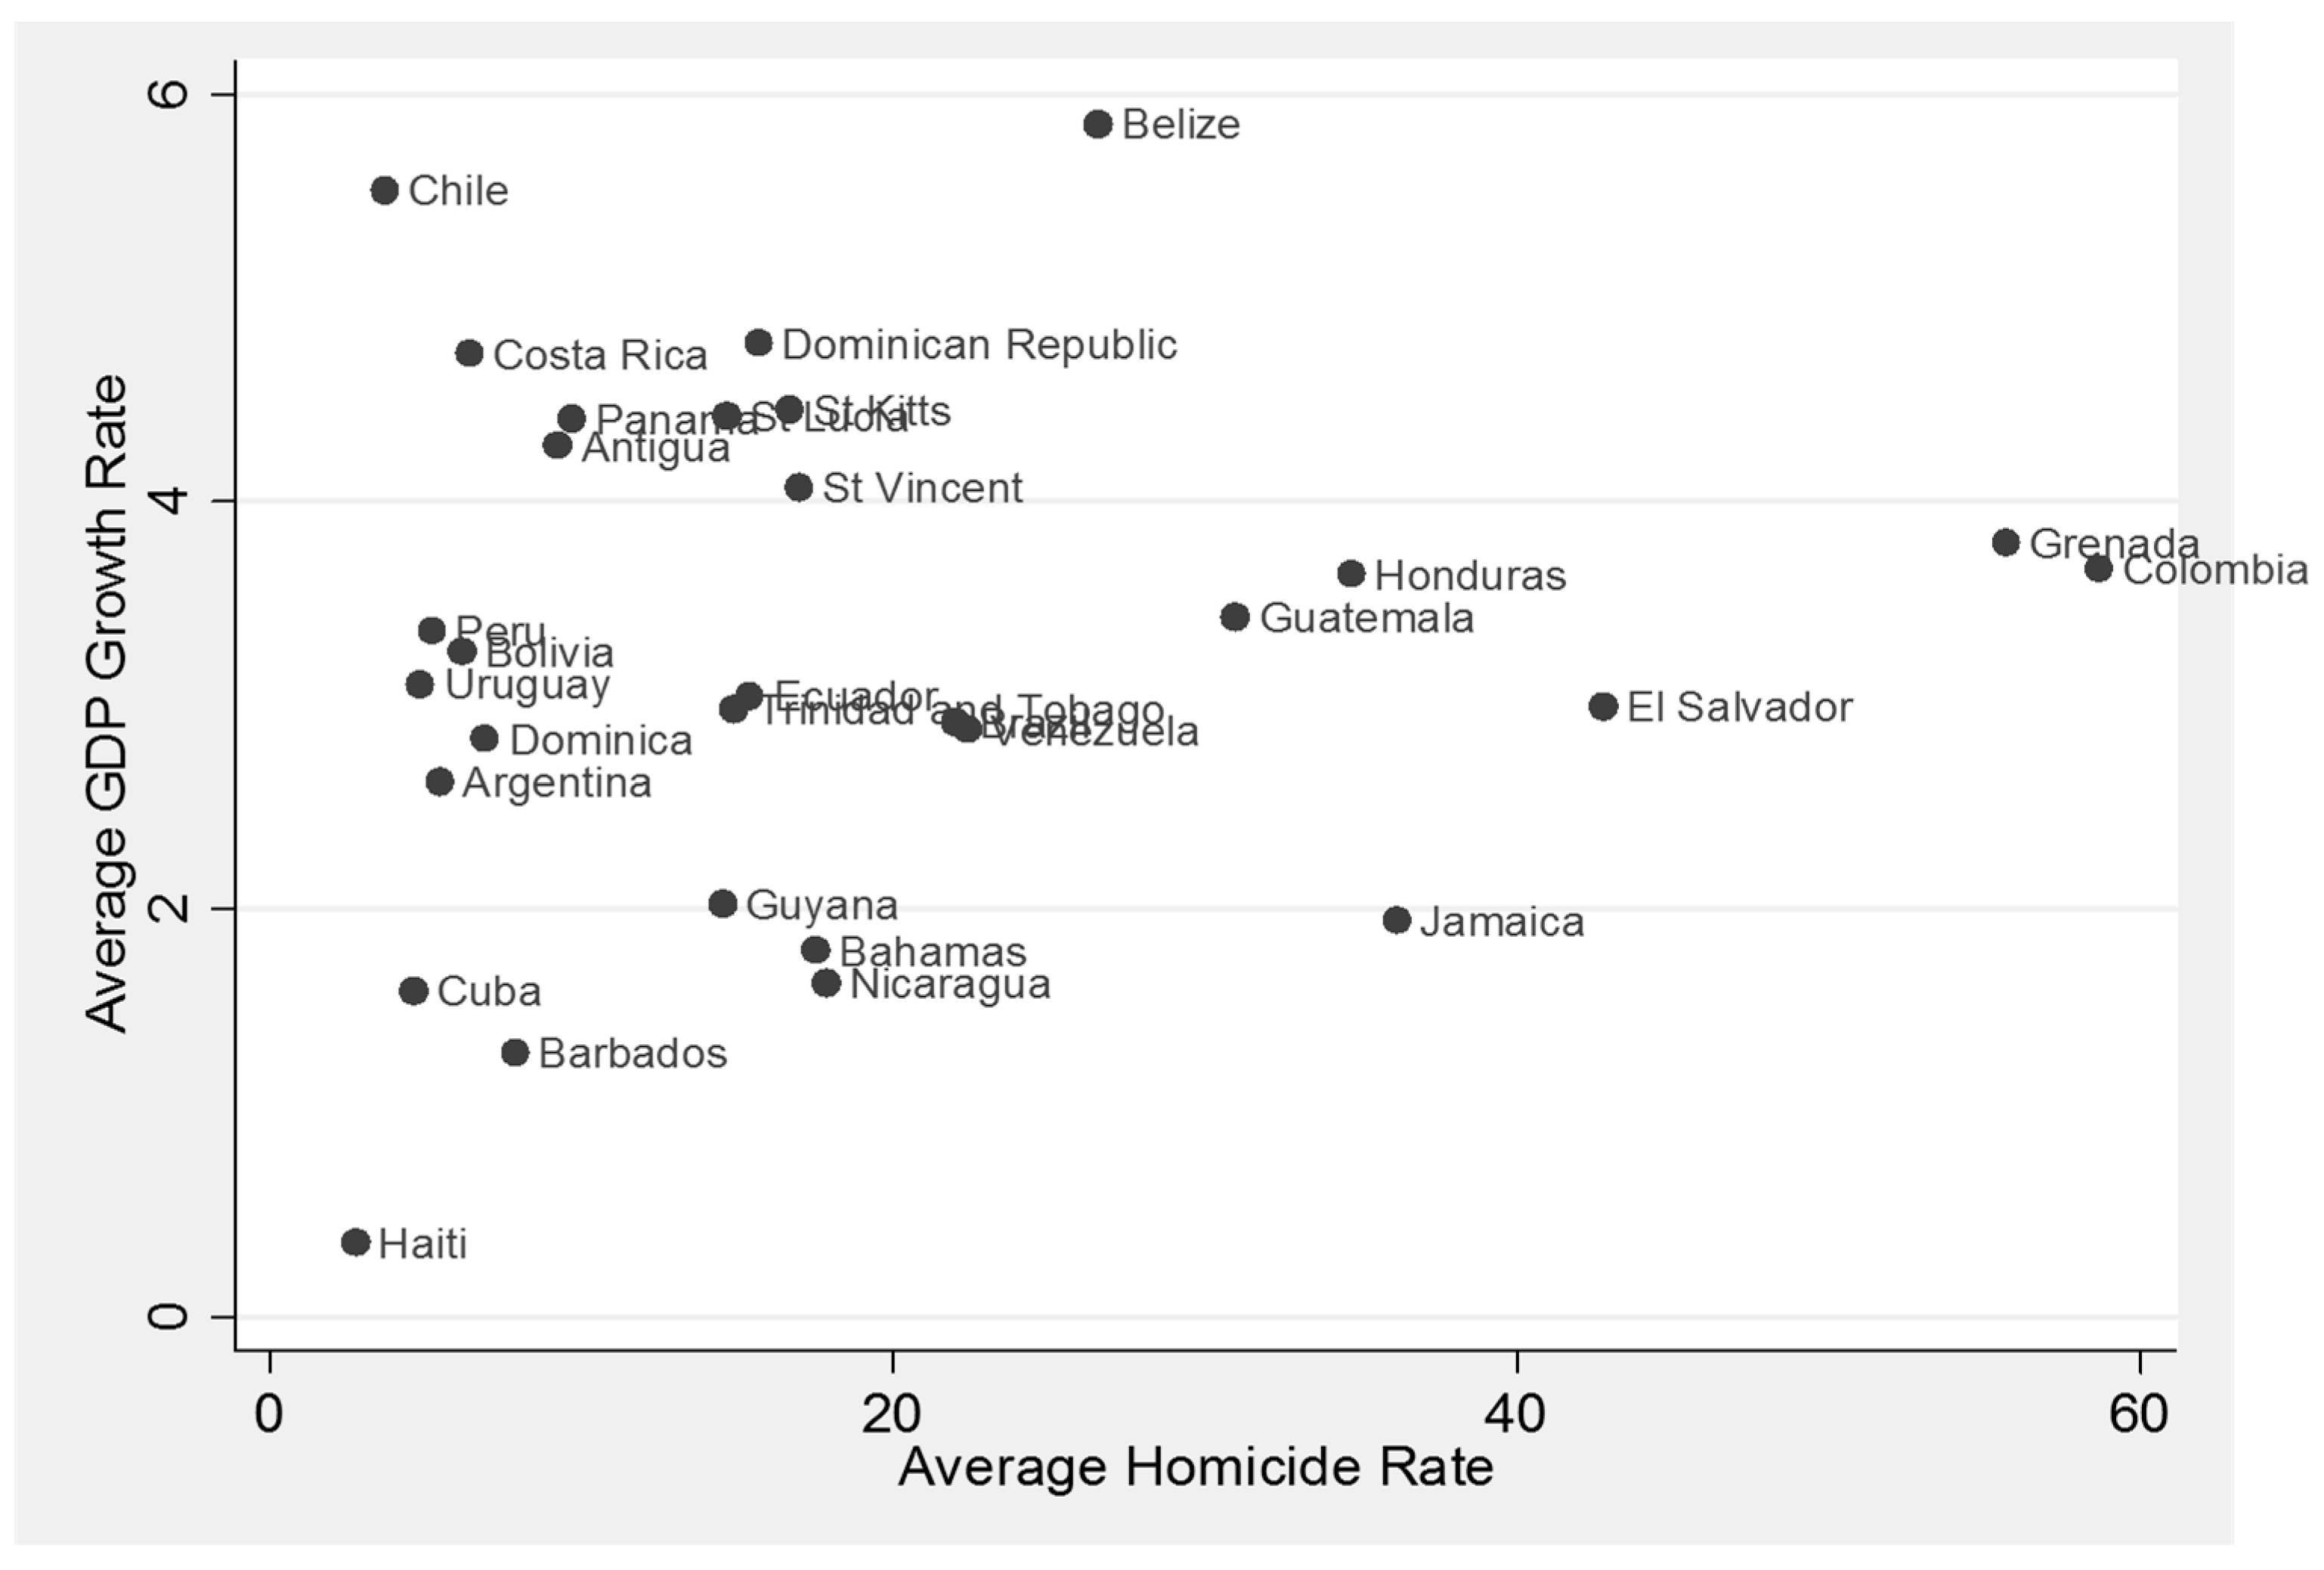
Figure 4 provides a scatter plot of per capita GDP growth rate
versus the homicide rate for the 30 countries over the period of study. The correlation is statistically significant at the five percent level. The impact of homicides on growth is estimated using two-stage least squares (2SLS), treating the homicide variable as endogenous and the other right-hand-side variables as exogenous. The particular form of the growth equation to be estimated is as follows:
where GNP is the gross national product per capita in country
i in year
t; H is the number of homicides per capita in country
i in year
t; and Z is the same matrix of covariates described in the preceding section. With ordinary least squares (OLS) the homicide variable is likely to be correlated with the error term, leading to inconsistent estimates. If the exclusion of the criminal deportation variable from Equation (4) is valid, however, increases in criminal deportees from the US can be used as an instrument to identify the receiving countries’ homicide parameters.
Figure 4.
Homicide and Growth (1980–2009).
Figure 4.
Homicide and Growth (1980–2009).
Table 4 presents results of the OLS and 2SLS analyses. Column (1) presents OLS estimates of Equation (4) in log-levels. The negative coefficient on the homicide rate (−0.056 with standard error of 0.029) implies that more homicides are associated with lower growth rates. Column (2) shows OLS results of Equation (4) in log-differences. By first-differencing, all of the parameters are identified using only within-country variation over time. The homicide coefficient is statistically significant and the 0.01 level and is 50 percent greater than the OLS estimates in column (1).
Table 4.
Estimating of the effect of homicide rate on economic growth.
Table 4.
Estimating of the effect of homicide rate on economic growth.
| | OLS | OLS | 2SLS |
|---|
| (1) | (2) | (3) |
|---|
| Homicide rate | −0.056 * | −0.078 *** | −0.407 ** |
| (0.029) | (0.032) | (0.208) |
| Average income (log GNP per-capita in US$) | 2.419 | 1.813 | 4.319 *** |
| (2.238) | (2.263) | (1.701) |
| Foreign direct investment (FDI) | 0.084 | 0.074 | 0.0889 |
| (0.068) | (0.073) | (0.059) |
| Openness to trade | 0.015 | 0.016 | −0.001 |
| (0.015) | (0.016) | (0.020) |
| Domestic investment | 0.070 | 0.071 | 0.119 *** |
| (0.056) | (0.054) | (0.050) |
| Government spending | −0.201 ** | −0.227 *** | −0.217 *** |
| (0.086) | (0.094) | (0.083) |
| Education (Avg. years of schooling) | −0.115 | −0.226 | −0.372 * |
| (0.308) | (0.328) | (0.223) |
| Country-fixed Effects | Yes | Yes | Yes |
| Data Differenced? | No | Yes | Yes |
| Instruments: | None | None | Deportees |
Column (3) of
Table 4 provide 2SLS estimates of the impact of homicides on economic growth using increases in criminal deportees from the US as an instrument for home country’s homicide rates. The other variables continue to be assumed exogenous. The homicide coefficient estimate remains statistically significant and is almost five times larger than the OLS estimates in columns (1) and (2)
12.
In columns (1) and (2) of
Table 4, with the exception of government spending, all the other coefficients carry the expected sign but are statistically insignificant. In column (3), when the increases in criminal deportees are used to instrument homicide rates, average income, domestic investment, and years of school are all statistically significant with the expected sign. In light of the generally poor performance of the growth variables in columns (1) and (2), it is reassuring that the homicide coefficients are insensitive to the exclusion of those variables.
The instrumental variable results in column (3) suggests that a one percentage point increase in home country homicide rate is associated with a 0.4 percent reduction in economic growth. According to [
10], homicide rate has a high degree of inertia. Therefore, policies of early intervention to prevent crime waves are likely to be particularly helpful.
To put these results into perspective, consider how much of the average growth rate between 1985 and the 2009 in LAC countries can be explained by the increase in homicide. The 2SLS estimate from the instrumental variables model specification in column (3) of
Table 4 yields a conservative estimate of the potential economic stagnation of the increase in the homicide rate. The average number of homicides (per home country population) increased by approximately 50 percent between 1985 and 2009. Assuming that the instrumented elasticities obtained here are generalized to the LAC region as a whole, average growth would be approximately 12.5 percent higher today if the increase in homicides had not occurred.
4.2. Homicide and the HDI
Figure 5 provides a scatter plot of the HDI (used as an indicator for development)
versus the homicide rate for the 30 countries over the period of study. The correlation is statistically significant at the one percent level. The impact of homicides on HDI is estimated using two-stage least squares (2SLS), treating the homicide variable as endogenous and the other right-hand-side variables as exogenous. The particular form of the development equation to be estimated is as follows:
where HDI is the human development index in country
i in year
t; H is the number of homicides per capita in country
i in year
t; and X is the same matrix of covariates described in the preceding section. With ordinary least squares (OLS) the homicide variable is likely to be correlated with the error term, leading to inconsistent estimates. If the exclusion of the criminal deportation variable from Equation (5) is valid, however, increases in criminal deportees from the US can be used as an instrument to identify the receiving countries’ homicide parameters.
Figure 5.
Homicide and Human Development Index (HDI) (1980–2009).
Figure 5.
Homicide and Human Development Index (HDI) (1980–2009).
Table 5 presents results of the OLS and 2SLS analyses. Column (1) presents OLS estimates of Equation (5). The negative coefficient on homicide rate (−0.001 with standard error of 0.0001) implies that more homicides are associated with a lower human development index. Column (2) provides 2SLS estimates of the impact of homicides on the human development index using increases in criminal deportees from the US as an instrument for homicide rates. The other variables continue to be assumed exogenous. The homicide coefficient estimate remains statistically significant and is three times larger than the OLS estimates in column (1).
Table 5.
Estimating the effect of homicide rate on HDI.
Table 5.
Estimating the effect of homicide rate on HDI.
| Variable | OLS | 2SLS |
|---|
| (1) | (2) |
|---|
| Homicide rate | −0.001 *** | −0.003 *** |
| (0.0001) | (0.0003) |
| ln Average income | 0.109 *** | 0.097 *** |
| (0.003) | (0.004) |
| Income inequality | 0.001 *** | 0.001 *** |
| (0.0003) | (0.0003) |
| Unemployment rate | 0.0004 | −0.0003 |
| (0.0003) | (0.0003) |
| Years of Schooling | 0.003 *** | 0.003 |
| (0.001) | (0.001) |
| Year Indicators? | Yes | Yes |
| Country-fixed effects? | No | Yes |
| Instrument? | No | Yes |
| R-squared | 0.859 | 0.803 |
The negative association between homicide rate and the HDI is statistically, socially, and economically significant. The average HDI increased by approximately 20 percent (from 0.66 to 0.79) between 1985 and 2009. Assuming that the instrumented elasticities obtained here are generalized to the LAC region as a whole, average HDI would be approximately 19 percent higher today if the increase in homicides had not occurred. Considering how the HDI is constructed, it means that average life expectancy, average years of schooling, and average income per capita for the LAC region would be higher today were it not for the increase in homicide rates.
5. Conclusions
Using changes to criminal deportees from the US as an instrument for increase in home country homicide rate, this paper attempts to estimate the marginal effect of increased homicide on the growth rate. The result is robust to the model specification, the method of estimation, instrumental variable approach, and the set of control variables explaining economic growth and development. My analysis hasanalyses have shown that high rates of homicide in LAC are undermining growth, threatening human welfare, and impeding social development.
Although there is no one “ideal” approach for homicide prevention, criminal deportees’ rehabilitation initiatives can contribute to reducing homicides. The governments of LAC recognize that it is their obligation to receive their own citizens. However, my analysis indicates that crime and violence do not disappear when criminal offenders are moved from one country to another, and my results show the harmful effect of increased deportation of criminal offenders to countries who are already struggling with high homicide rates. The process of accomplishing deportation can be greatly improved if the US provide the receiving countries with more information on deportees, including more detailed criminal records and increased assistance with the resettlement and reintegration process, especially if they are not allowed to be incarcerated upon returning home.
The United Nations Development Program (UNDP) currently funds a $1 million International Organization for Migration (IOM) project in Haiti to provide deportee reintegration services, including counseling, vocational training, skills development, and micro-credit lending. I am totally in support of the work that the UNDP is doing and strongly suggest that the US use this program as a model for integration programs in LAC countries. Despite the fact that the US saves money by deporting criminals, it is important that they help LAC countries to make “home” comfortable for the returning criminals.


