A Counterfactual Impact Analysis of Fair Use Policy on Copyright Related Industries in Singapore: A Critical Review


Phoenix Center for Advanced Legal & Economic Public Policy Studies, Washington, DC 20015-2034, USA
Laws 2018, 7(4), 34; https://doi.org/10.3390/laws7040034
Submission received: 28 July 2016
/
Revised: 18 October 2016
/
Accepted: 12 September 2018
/
Published: 5 October 2018
Abstract
:In a 2014 article appearing in Laws, Ghafele and Gibert presented evidence on the economic impacts of Singapore’s change in its fair use policies showing a large effect on industries that manufacture goods useful for private copying of copyrighted works and no effect on the copyright industries. As detailed in this Comment, Ghafele and Gibert’s empirical analysis fails to shed light on the consequences of modifications to fair use policies.
1. Introduction
In an article published in Laws in 2014—A Counterfactual Impact Analysis of Fair Use Policy on Copyright Related Industries in Singapore—authors Roya Ghafele and Benjamin Gibert claim to estimate the economic effects of changes to Singapore’s copyright law in 2005 expanding the fair use exception to copyright infringement (Ghafele and Gibert 2014; WIPO 2006). The authors conclude their “difference-in-differences” methodology “seems to support” that the legal change was responsible for substantial economic gains in Singapore for those industry segments facilitating private copying of copyrighted content (e.g., disk drives and media), though the authors explicitly reject any causal interpretation to the findings (Ghafele and Gibert 2014, p. 327). A large reduction in economic activity was observed for those industry segments believed to rely heavily on copyright protections (e.g., radio, television, and books). In this Comment, I describe a number of conceptual and empirical flaws in Ghafele and Gibert’s Fair Use Study, rendering the findings reported in that study incapable of informing copyright policy.
First, there were many changes in Singapore’s copyright law coincident with the modifications to fair use (or, properly, the similar concept of fair dealing), including an extension of copyright term and the addition of statutory damages, as well as changes in the nation’s trademark and patent laws. It is difficult to quantify the independent effects of any particular number of the 2005 legal reforms to intellectual property law in Singapore using the Fair Use Study’s methodology. Second, while the authors claim to “test this hypothesis using a difference-in-differences methodology,” they neither test a hypothesis nor employ a proper difference-in-differences methodology. Hypothesis testing is precluded by an unnecessary aggregation of data that reduces sample sizes to seven observations. Third, in avoiding standard methods, Ghafele and Gibert fail to adjust the data for the sizeable differences in the levels of the outcomes across groups, rendering comparisons across the groups invalid. Fourth, and most critically, the authors admit that the control group fails to meet the most basic and necessary requirement of the difference-in-differences method (i.e., the parallel paths assumption).
In an effort to remedy some of the shortcomings of the Fair Use Study, I apply the standard regression-based difference-in-differences test to Ghafele and Gibert’s data and a general model so that statistical testing can be performed (Meyer 1995; Angrist and Pischke 2008; Angrist and Krueger 1999; Lechner 2011). I am unable to reject the hypothesis that the changes in Singapore’s laws had “no effect” on industry groups.
Finally, one could easily argue that the results of the Fair Use Study show why relaxed fair use policies are a bad idea. In effect, the results of the Fair Use Study (taken as they are) suggest that Singapore’s expanded fair use policies coincided with a massive expansion in the production of technologies that permit widespread copying of intellectual property but had no effect on the creation of new, transformative works. Fair use is not about the wholesale copying of intellectual property; fair use is mostly about the use of very limited pieces of existing content to create something new (i.e., transformative), or perhaps limited use in educational or research settings (Intellectual Office of Singapore 2016; Leval 1990; Aufderheide and Jaszi 2011; Stanford University Library 2016). Under Ghafele and Gibert’s logic, however, the massive rise in the production of copying technologies would suggest that Singapore’s new copyright law was taken to be a license to pirate copyrighted content with impunity. Notably, less than a decade after the new fair use policy was codified, Singapore’s Ministry of Law initiated a consultation regarding widespread digital piracy in that country; the law was subsequently amended to address these concerns (Mann 2014; TBO 2014).
2. Background on the Difference-in-Differences Estimator
In testing the efficacy of a new medication, researchers gather a sample of persons, split them randomly into two groups, and then give half the group the “treatment” of a real drug and the other half a placebo (or nothing at all) (Meyer 1995; Angrist and Pischke 2008; Angrist and Krueger 1999). Changes in health outcomes—both those intended and any side effects—between the treated and control groups are then measured to determine whether the treatment is effective and safe. The approach is scientifically valid because of the random assignment of the groups, implying the two groups are, for all practical purposes, identical.
Randomization experiments are typically not possible in legal and economic environments; treatments are not randomly assigned. On occasion, however, some quasi-experimental situations do arise in the course of economic activity. Say, for example, a regulation is imposed in one set of cities but not another (Galiani et al. 2005; Card 1990). If a sample of otherwise identical cities can be obtained to serve as a control group for the newly regulated cities, then the potentially causal effect of the regulatory change can be quantified by looking for changes in economic outcomes over time between the two types of cities—the treated group and the control group.
This procedure is called a difference-in-differences approach, and the treatment effect is computed using:
where δ is the difference-in-differences estimator, YT is the outcome of the treated group and YC the control group (Meyer 1995, p. 155). The subscripts 0 and 1 indicate, respectively, the outcomes before and after the treatment. Equation (1) shows clearly why the method is referred to as a difference-in-differences estimator; it is literally the difference between two differences.
As an example, say there are two sets of cities, both having a 10% infant mortality rate (Galiani et al. 2005). In one set of cities—the treatment group—a policy is implemented (say, privatization) with the hope of improving the quality of water filtration and thereby improve health outcomes. No change in policy occurs in the other group, which serves as the control group. Five years after the policy change, mortality is measured and the treated cities are found to have a mortality rate of only 5%, but the mortality rate of the control group is 9%. The improvement in mortality over the five-years for the treated group is 0.05 (=0.10 − 0.05), but for the control group is only 0.01 (=0.10 − 0.09). The difference-in-differences estimator (see Equation (1)) is 0.04 (=0.05 − 0.01). This difference—often referred to as the Average Treatment Effect (“ATE”)—may be plausibly assigned to the change in water treatment policy if the two sets of cities are identical in all respects save the treatment (Imbens and Wooldridge 2009).
A key component of the difference-in-differences approach is the quality of the control group. One critical assumption regarding the control group is the parallel paths assumption (Angrist and Krueger 1999). This assumption holds that the pattern of outcomes for the control group after the treatment is an unbiased estimate of what would have happened to the treated group had the treated group not received the treatment. Ideally, the only difference between the control and treated groups is that one receives the treatment and the other does not. Theoretically, the comparison here is not simply between the outcomes of the two groups. Rather, the control group is being used as a proxy for the treated group in the case where the treated group does not receive the treatment. This proxy (or counterfactual) is necessary because we only observe the outcomes of the treated group when it is treated. Obviously, the selection of the control group is really important. Say, for example, the control cities from the water-treatment example were all from a country that experienced a famine following the change in policy for the treated group, altering child mortality. If so, then the control group is invalid and the measured treatment effect of privatization is biased (i.e., inaccurate). The strength of the evidence from a difference-in-differences analysis depends to a large extent on the legitimacy of the control group.
Since it is not possible to observe the outcomes of the treated group as if they were not treated (thus requiring a counterfactual from the control group), this parallel paths assumption cannot be formally tested. Nevertheless, some less formal validation of the assumption is common and essential to good empirical practice (Meyer 1995; Angrist and Pischke 2008; Angrist and Krueger 1999). For instance, the similarity of pre-treatment trends is evaluated using trends analysis and statistical testing. If pre-treatment trends are not equal across the two groups, then there is no reason to expect the control group to serve its purpose. Or, if the control group’s outcomes change substantially after the treatment, then there is good reason to believe that some factor influenced the control group around the same time as the treatment. Plainly, the control group must be very carefully selected and the statistical methods must be properly applied and suited to the nature of the data.
3. Summarizing the Fair Use Study
Difference-in-differences estimators are valid in true experimental settings, but social scientists have adopted the estimator to observational data in quasi-experimental settings (e.g., legal changes). Uses of this method recognize the inherent limitations of doing so and are therefore attentive to the quality of control group, the use of sound statistical methods, and robustness checks. Ghafele and Gibert argue that the fair use reform in Singapore, when the country more broadly applied and modified the language of the pre-existing multi-factor test for fair dealing (now §35 of the Singapore Copyright Act), constitutes a quasi-experiment for fair use. The Fair Use Study lays out its empirical approach as follows,
We posit that flexible fair use in copyright law has two additional effects in the economy beyond those posited by traditional fair use analyses. Flexible fair use exemptions may: (1) increase the growth rate of private copying technology industries; and (2) increase the growth rate of copyright markets. We test this hypothesis using a differences-in-differences methodology that is applied to the 2005 fair use amendments to the Singapore Copyright Act and test its implications on private copying technology and copyright sectors in Singapore.
The time series data used in the report spans from 1999 to 2010, and the Fair Use Study marks the year 2005 as the treatment year. Value-added as a percentage of Gross Domestic Product (“GDP”) is the outcome of interest. The three industry groups represented include: (1) Private Copying Technology Industry Group; (2) Copyright Industry Group; and (3) Control Industry Group. The Private Copying group includes sectors of the economy that produce and sell technologies—e.g., disk drives and media—that may benefit from fair use in that it permits more copying of copyrighted content without permission. The Copyright group includes industry segments—e.g., recordings, books, magazines, and movies—that may be harmed by fair use since the fair use exception may impact sales. Finally, a single Control group is constructed from industry segments—e.g., office equipment—believed to be unaffected by fair use policies (though these industries received the treatment, as did the entire economy).
The empirical approach used by Ghafele and Gibert in the Fair Use Study is as follows. Using six years of data prior to 2005, the following linear regression is estimated:
where yt is the value-added figure and t is a time indicator (t = 1, 2, …, 6). Using the estimated β0 and β1 coefficients from Equation (2), the authors compute the value of y in the final period (y12, six years later in the year 2010, ignoring the data from 2005 through 2009), and this prediction serves as the pre-treatment value (or untreated value) of y (or from Equation (1)). For example, data from the Private Copying group produces the “prediction” equation:
Inserting the value of 12 for t, the prediction for 2010 (five years into the future) is 0.0168. The actual value for 2010, however, was 0.0502 (or ), so the authors conclude the “difference” of the change in fair use law for the Private Copying group was 0.0334, or 3.34%.
yt = β0 + β1t + et
yt = 0.06338 − 0.00388t
Ghafele and Gibert did not consider that the extrapolated value for the year 2010 is a predication subject to statistical error. In fact, this difference between the extrapolated and the actual value may also be properly described as a forecast error based on out-of-sample information (2010 is not in the estimation sample). Forecasters often test the validity of forecast models by seeing how well the models predict known future values that are purposely left out of the sample so that such calculations can be made. Equation (3) suggests that the linear model is not a good choice for this data. If a forecast value is used as , attention should be paid to the quality of the forecasting method and well as the statistical consequences of using a prediction in a statistical test (though the Fair Use Report contains no statistical tests).
These same computations are made for the Control and Copyright groups. For the Control group, the difference is very small (0.0044 − 0.0043 = 0.0001). The difference-in-differences estimator for the Private Copying group is, then, 0.0333 (=0.0334 − 0.0001). Ghafele and Gibert conclude that the addition of fair use to Singapore’s copyright law was “correlated with a 3.33% increase in value–added (as a % of GDP) for private copying technology industries.” (Ghafele and Gibert 2014, p. 340) The calculations are summarized in Table 1. The Fair Use Study reports “no significant change in growth rates for the copyright group in the pre- and post-intervention time-periods in terms of real economic growth” (Ghafele and Gibert 2014, p. 341). Notably, “significant” does not imply statistical significance since no statistical tests are performed. Also, the Copyright group was 30% below prediction, so it is not clear what “significant” means for Ghafele and Gibert. Nevertheless, based on these findings, the conclusion of the Fair Use Study is that expanded fair use is good for the Private Copying group and does not harm rights holders.1
While evidence on the impacts of changes to fair use policies is desirable, the question remains as to whether Ghafele and Gibert’s empirical analysis is properly done so as to render any meaningful evidence. For the reasons discussed already and detailed more below (among many others), in my view, it was not. Some problems can be seen in Table 1. First, the mean of the Private Copying group is 5.02% and the Control group is 0.44%. In order to offset the change in the Private Copying group, the Control group would have to change many multiplies of its mean. A difference-in-differences analysis should adjust for differences in the means of the relevant series. Second, the same control group is used for two very different industries. Unless the Copyright and Private Copying groups respond identically to economic stimulus, then a single control group cannot serve as a valid counterfactual for both (there is an absence of a demonstration that the control group satisfies the parallel paths assumption). I discuss these problems and some others below.
4. The Empirical Analysis
4.1. Multiple Treatments
Returning to the drug testing example for the moment, imagine a drug company wishing to test the efficacy of a new treatment. Once more, following standard protocol, they gather a group of test subjects and then randomly divide them into treatment and control groups. So far, so good, but now say that the company then administers four different drugs to the treatment group—the drug of interest and three others. After the allotted time, the outcomes are measured and it is found that the treated group has some improvement in the condition of interest. This evidence is presented to the government for approval of the treatment. Of course, the government agency would instantly reject the study—the observed outcomes and side effects are the result of taking four medications, and it is impossible to determine which drug is responsible for what outcomes.
The problem of multiple treatments is obvious enough, though apparently undetected by the authors of the Fair Use Study. There were many significant changes in the 2005 revision of Singapore’s copyright law (WIPO 2006), including an extension of the copyright term from 50 to 70 years after death (§28) and the introduction of statutory damages (§119), both thought to be a strengthening of copyright. In addition, Singapore’s patent and trademark laws were updated at this same time (WIPO 2005a, 2005b), and at least some of the industry groups (e.g., electronics) analyzed in the Fair Use Study depend on these forms of intellectual property. On top of these changes in intellectual property law, there was a bursting technology bubble in 2001 and a global recession in 2008, though while acknowledged in the Fair Use Study, were completely ignored in the empirical analysis (Ghafele and Gibert 2014, p. 343). So, while fair use policy did change in 2005, it was only one of many changes that occurred at that time and over the period analyzed in the Fair Use Study. To separate the effects, the researchers would need control groups for each of the “treatments” administered.
4.2. Hypothesis Testing and Sample Sizes
Though the Fair Use Study considers 23 different industry classifications with 12 years of data each, it aggregates these industries into three groups. No explanation is provided as to why tossing out data in this way is helpful, and there are many reasons to believe it is harmful. For example, aggregating the data reduces the sample size to a small number (i.e., six observations are used to forecast a single observation, so only seven observations are employed per group). If, using all the data, these seven observations were increased to 96 observations for the Private Copying group, it would permit the computation of a test statistic.
Another problem with aggregation is that it combines large industry segments with small ones. In effect, many of the segments are all but lost in aggregation with their relatively large companions (Barker 2013; Barker and Png 2013). For example, two of the industry segments in the Private Copying group account for 70% of the total. Four segments account for less than 4% of the total, so the variation in these smaller segments is essentially washed out in the aggregation. Yet, if the impact of fair use is as Ghafele and Gibert presume, then these impacts should be detectable in all (or most) of the individual industry segments (i.e., each SSIC, or Standard Subject Identification Code). Aggregation prohibits such measurements, masking the effects on smaller components with the effects on bigger ones.
4.3. Dimension Problems
Another important defect is the dimension problem, discussed briefly above. In computing the treatment effect, Ghafele and Gibert subtract the changes in the Control group from that of the Private Copying group using the formula from Equation (1). But, notice from Table 1 that the mean value of the Private Copying group is 0.05 while the mean value of the Control group is only about 0.005—a ten-fold difference. By Equation (1), in order to offset the 0.0334 change in the Private Copying group (thus rendering a zero difference), the Control group’s outcome would also need to change by 0.0334. Given its relatively small mean, the Control group’s outcome must increase by 759% (=0.0334/0.0044 = 7.59) to offset the 67% increase in the Private Copying group’s outcome (=0.0334/0.05 = 0.67). Thus, it is practically impossible for the Control group to offset a change in the Private Copying group. This type of scale effect is well covered in the literature on difference-in-differences estimators (Meyer 1995; Angrist and Pischke 2008; Angrist and Krueger 1999). Data transformations and econometric methods (e.g., fixed effects regression) are available to correct for such scale differences, if necessary.
Consider an analogy. Say a pharmaceutical company wishes to test a new weight-loss drug for dogs. For the treated group, the company gathers a sample of fifty Great Danes with an average weight of 150 pounds. As a control, the company chooses a group of fifty Chihuahuas with an average weight of 5 pounds. Three months after the Great Danes are treated (the Chihuahuas get a placebo), we find that the larger breed has lost 15 pounds. The Chihuahuas, however, have lost only 0.5 pounds, on average, over the period. Looking at these results, the company concludes the drug is effective, reducing weight by 14.5 pounds (=15 − 0.5). In fact, the percentage change in weight are identical across the two dogs, suggesting no discernable effect. This error was made by Ghafele and Gibert in the Fair Use Study.
4.4. The Parallel Paths Assumption
In my view, Ghafele and Gibert make an inappropriate choice of control group. As stated in the study, the control group is selected because these industry segments are “non-beneficiaries of the fair use policy intervention.” (Ghafele and Gibert 2014, p. 338) That is not to say that the control group did not receive the treatment—copyright law in Singapore applies to all industries in Singapore. The control group is treated, it is just that Ghafele and Gibert assume, without support, that these industry segments are unaffected by the policy intervention despite subjected to it. A valid control, however, is given a placebo, not the treatment. For this group to be a valid control, we must believe that those industry segments in the control group are identical to the treated group in all respects but one—the response to fair use. Such a scenario is implausible as the industry groups in the control group are nothing like those in the treated group.2
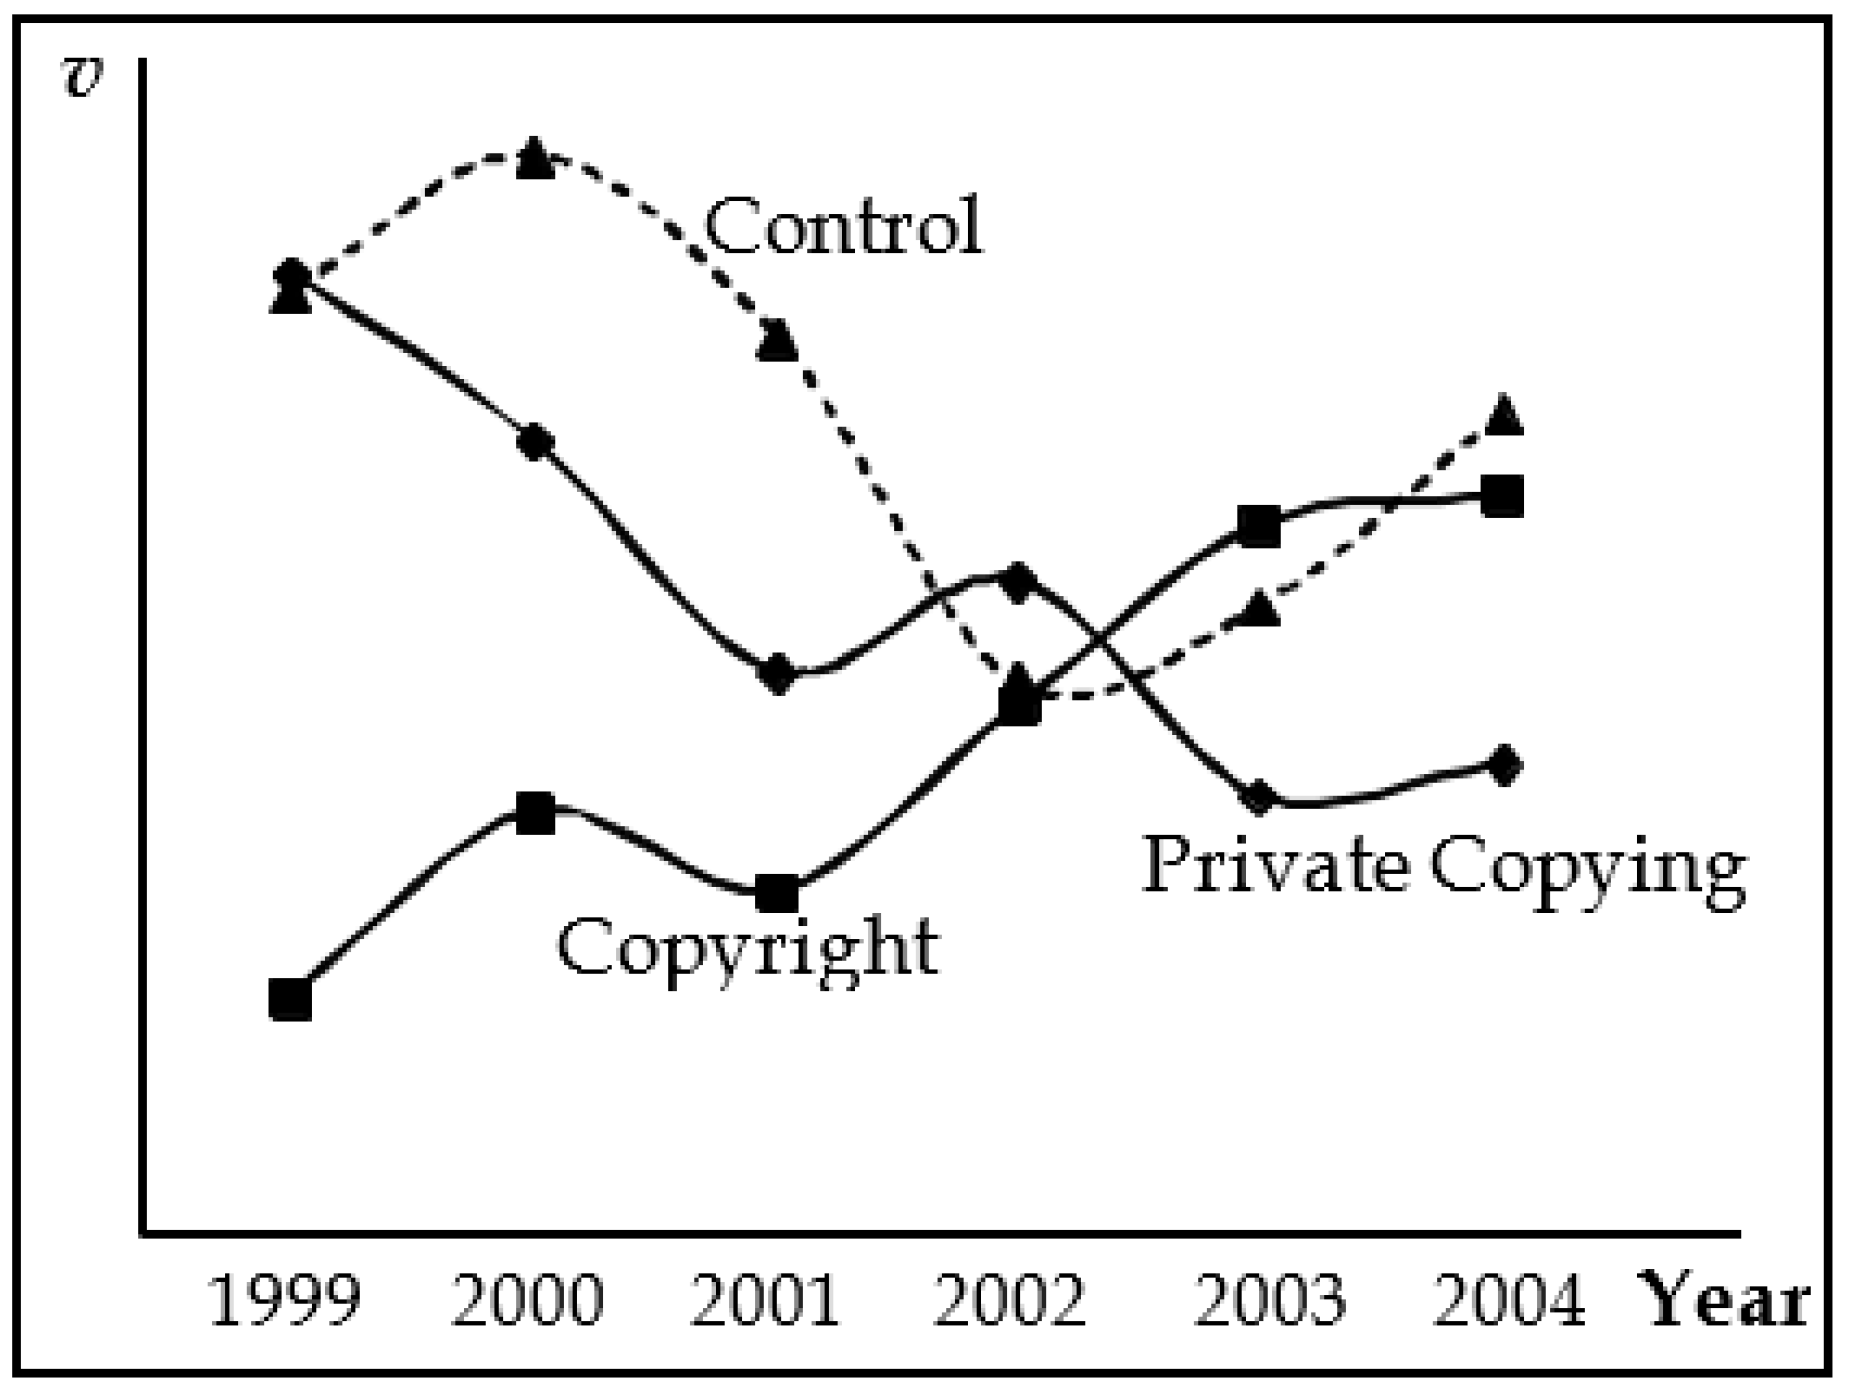
When researchers choose a control group (say, by carefully choosing a set of cities, schools, persons, and so forth), it is common practice to evaluate the trends in the data prior to the treatment to see if they are the same (Autor 2003) (Angrist and Krueger 1999, p. 1299). Visual inspection of pre-treatment trends is made possible by Figure 1.3 From the figure, it is apparent that the Control group has a different trend than either of the treated groups. Thus, based on visual inspection, the parallel paths assumption is not satisfied for either the Private Copying or Copyright groups. Figure 1 also shows that the Control group is not appropriate as a valid control for both the Private Copying and Copyright groups. The pre-treatment trends of the Private Copying and Copyright groups are inconsistent, one rising and one falling over much of the pre-treatment period. The Control, in contrast, is rising, then falling, then rising, over the pre-treatment period.
The authors of the Fair Use Study acknowledge that the parallel paths assumption—a necessary condition for a valid difference-in-differences estimate—is violated, stating the “analysis of growth rates shows that the parallelism assumption does not hold. The private copying group was shrinking at a faster rate before 2005 than the control group.” (Ghafele and Gibert 2014, p. 343) The parallel trends assumption is a necessary condition for the validity of the difference-in-differences estimator, and Ghafele and Gibert reject the validity of this assumption (Botosaru et al., Mora et al.) (Angrist and Krueger 1999, p. 1299). Perhaps recognizing this fact, Ghafele and Gibert repeatedly qualify their findings with the statement: “assuming parallel growth rates between beneficiaries and non-beneficiaries …,” (Ghafele and Gibert 2014, p. 38) and do so despite their own rejection of the parallel paths assumption.
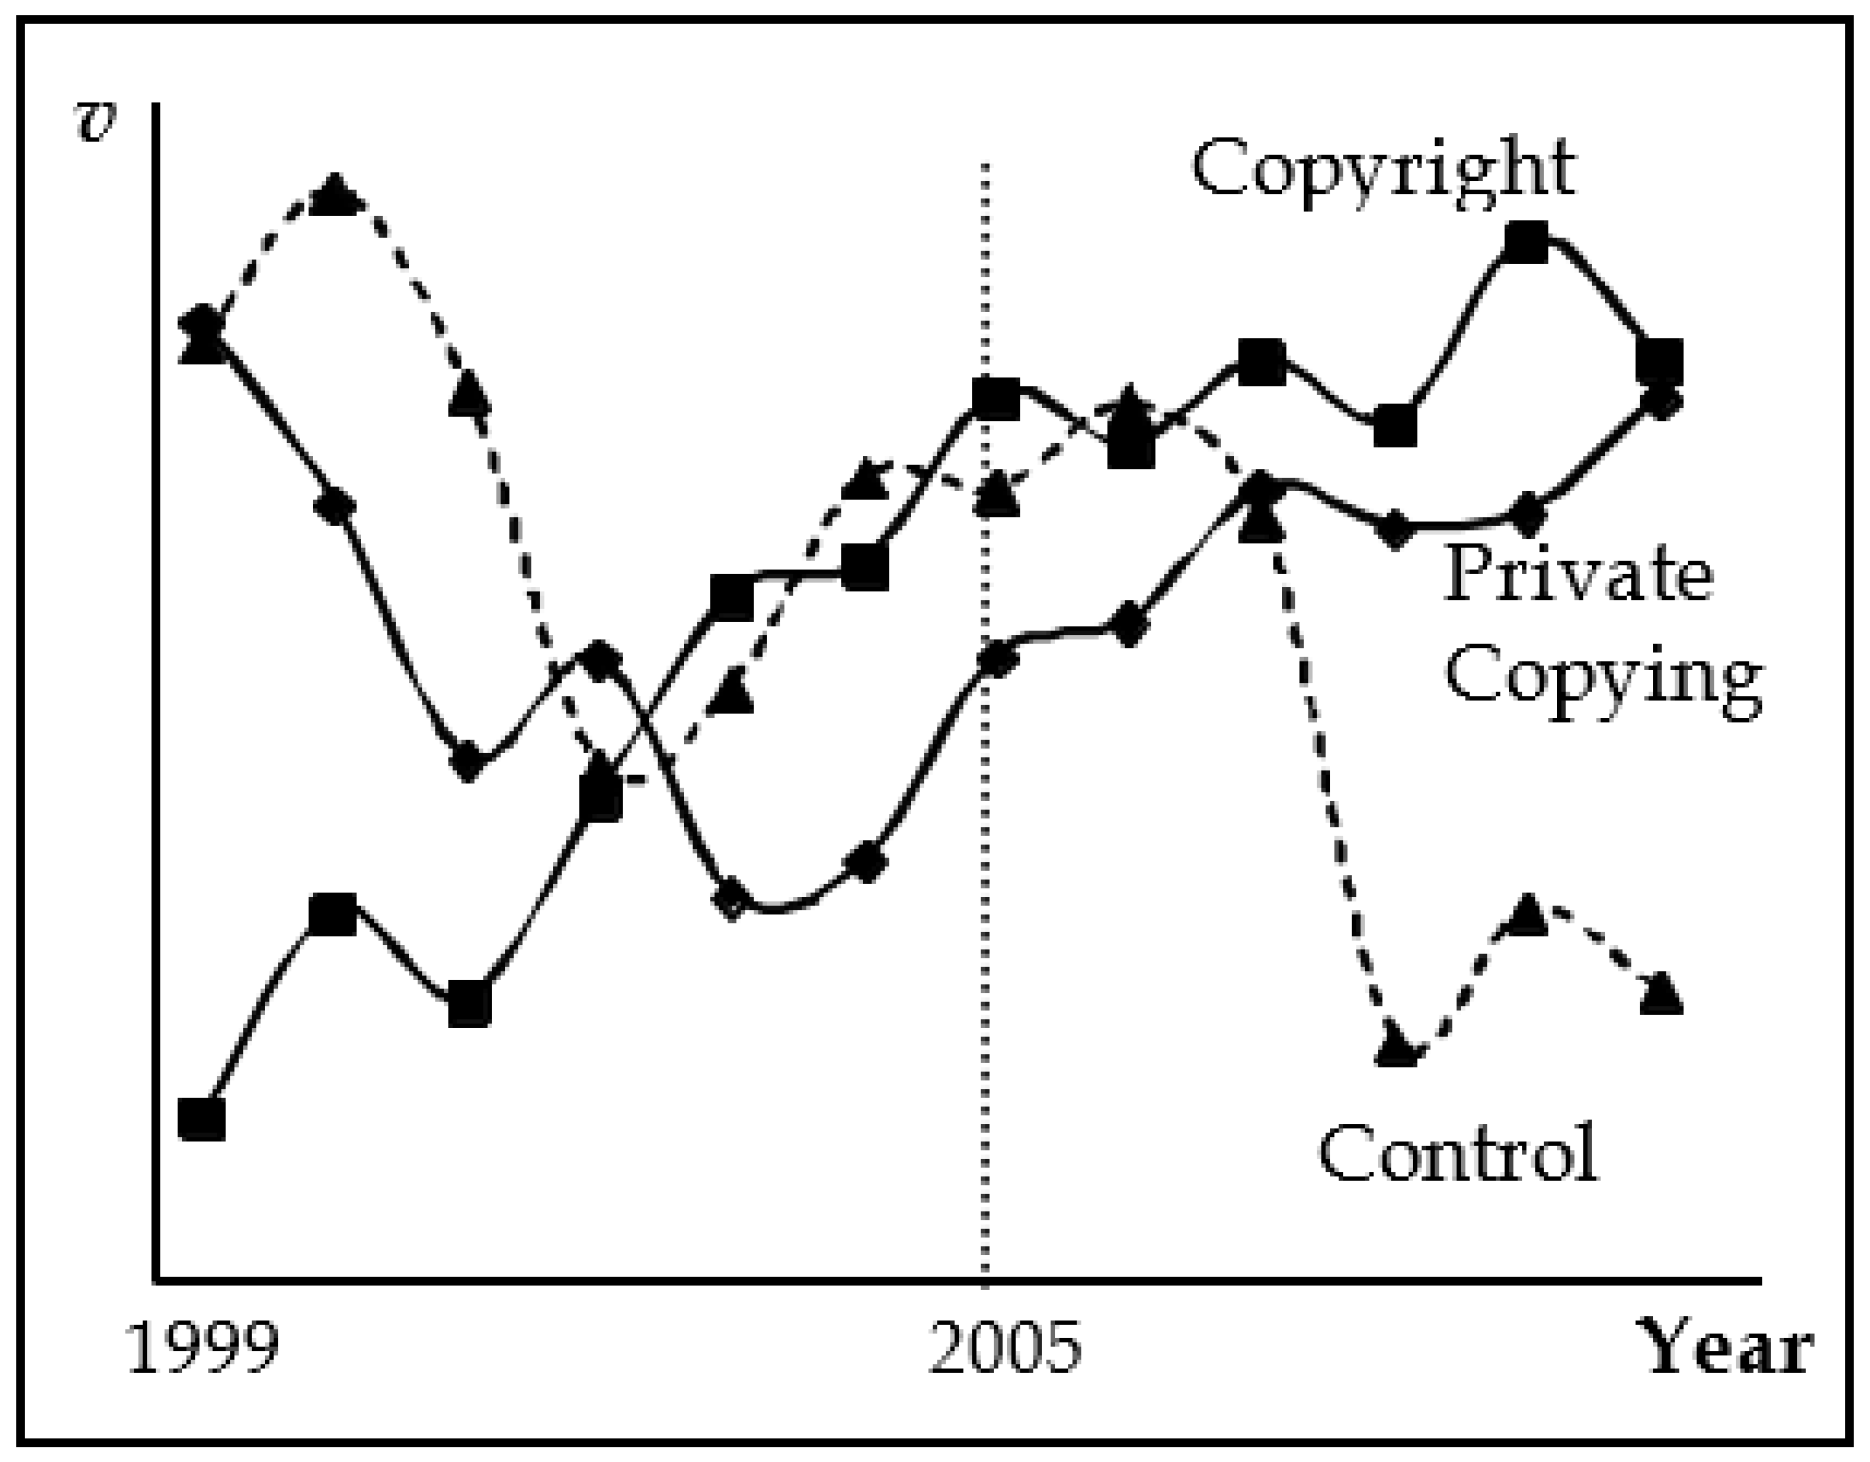
We can also look at post-treatment behaviors to compare trends. In Figure 2, the data for all years of the three groups is illustrated. Over the entire period, the Copyright group has a generally positive trend. The trend for the Private Copying group turns positive prior to 2005 (regression analysis indicates a 2004 change in direction), another signal that the treatment effect may be biased. For both the Private Copying and Copyright groups, the upward trends in the pre-treatment period are generally continued into the treatment period. If a change in activity is detected prior to the treatment and carried over into the treatment period, it may provide evidence that the policy change did not cause the change in activity.
There appears to be no visible change after 2005 for either group, other than perhaps a slowed growth for the Copyright group. In contrast, three years after the treatment period begins, value added for the Control plummets. Since only the 2010 data are used from the post-treatment period, this apparent shock to the control group greatly influences the reported outcomes in the Fair Use Study. Overall, these data suggest neither a strong treatment effect nor a meaningful control group.
4.5. Additional Issues
In Appendix Tables A4 and A5 of the Fair Use Study, Ghafele and Gibert present econometric results that play no discernable role in their analysis. These reported regression results in Table A4, and the data in Table A5, do not serve as the basis for the estimated impacts, nor are the results discussed in the paper. What purpose the tables serve is unclear.
An additional issue relates to Table A5 (“Data Used in the Regression Analysis”). The study has data for the period 1999 through 2010. In the regression analysis from Table A4, the authors estimate a first-difference model (not related to the difference-in-differences estimation), which simply means that the data used in the estimation is calculated by subtracting each year’s data from the prior year’s data (yt − yt−1). Without data from 1998, this produces a missing value for year 1999, which reduces the sample size from 12 years to 11 years. Looking at Table A5, however, rather than excluding 1999 from the data as a missing value, the authors have inserted “0” as a data point for that year. The regression results from Table A4 indicate there are 12 observations in the regression, which implies that the “0” observation for 1999 was, in fact, included in the estimation (I was able to replicate the results to confirm this error).
5. A Standard Estimation Technique
I have used the data from the Fair Use Study to conduct a statistical test to see if there is a meaningful and quantifiable difference like that reported in the Fair Use Study. The standard format for the difference-in-differences regression is:
where yit is the outcome for observation i at time t, Dit is a dummy variable that equals 1 if the observation is treated in year t (0 otherwise), Xit is a vector of control variables that vary by observation and time, μi is a fixed effect for each observation i, λt is a time effect common to all observations in time t, and εit is the econometric disturbance term that is assumed to be distributed independently of all μ and λ (Angrist and Krueger 1999, p. 1294). The δ and β1 are also estimated parameters. This model is a two-way fixed effects model (that is, there are dummy variables for each series and each time period). These dummy variables address the dimension problem and account for broader economic shocks (Angrist and Krueger 1999, pp. 1293–99).
yit = δDit + βXit + λt + μi + εit,
In the Fair Use Study, all the data is national data from Singapore and the analysis includes no other exogenous factors, so the Xit falls out of Equation (4). The data is measured as “value added” of various sectors in the economy, which I label vit. Thus, Equation (4) can be simplified to:
where i is a SSIC-level industry group and Dit is a dummy variable equal to 1 for the Private Copying or Copyright groups beginning in year 2005 (0 otherwise). The regression is a two-way (SSIC, time) fixed effects regression with a dummy variable that equals 1 for the treatment groups during the treatment period (2005 to 2010). Standard errors are clustered on the SSICs, as is recommended in the literature (Bertrand et al. 2004).
vit = δDit + λt + μi + εit,
There are 23 SSICs in the sample: (a) eight for Private Copying; (b) ten for Copyright; and (c) five for the Control group. With twelve years of data (with two observations missing for 1999), the estimation sample includes 274 observations. The R2 of the regression is 0.05 and the F-statistic is 4.34 (prob < 0.01). The estimated treatment effect (δ) for the Private Copying group is 0.00074 with a t-statistic of 0.30 (prob = 0.77); the effect is not statistically different from zero. The null hypothesis of “no change” in the Private Copying group’s outcomes before and after 2005 cannot be rejected. For the Copyright group, the estimated treatment effect (δ) is equal to 0.00034 with a t-statistic of 0.81; the effect is not statistically different from zero (prob = 0.43). The null hypothesis of “no change” in the Copyright group’s outcomes before and after 2005 cannot be rejected. Thus, the modifications to Singapore’s copyright law are found to have had no effect on the economic outcomes that Ghafele and Gibert deemed of interest.4
6. What if the Results Were Right?
Assume, for the moment, that the results reported in the Fair Use Study are legitimate in the sense that Singapore’s fair use reform led to growth in manufacturing of copying technologies (+67%) yet reduced growth in the copyright industries (−30%). What do the findings of the Fair Use Study imply about greater flexibility of fair use policies?
Fair use is not about the wholesale copying of intellectual property; instead, fair use grants rights to the limited use of prior works to create something new (i.e., transformative) out of existing content, or perhaps limited use in educational settings without having to compensate the rights’ holder. Singapore’s laws are no different in that regard. For example, one of the factors applied in Singapore’s fair dealing law is the “amount and substantiality of the part copied taken in relation to the whole work” and the “effect of the dealing upon the potential market for, or value of, the work” (Intellectual Office of Singapore 2016). When using copyrighted content for research or study, Singapore’s fair dealing law limits the copying to 10% of the published work. Fair use is a somewhat limited exemption.
What a well-designed fair use policy should do is lead to the creation of new, transformative works, thereby growing the copyright sector. Fair use policies should not, if properly designed, lead to a massive increase in the sale of pirating technology, driven in part perhaps by purchasing technologies to circumvent Digital Rights Management (DRM) measures. Yet, according to Ghafele and Gibert, Singapore’s new law led to exactly that perverse outcome; their results imply that subsequent to the increase in the flexibility of fair use in Singapore, while consumers rushed out and purchased vast quantities of technology used to copy intellectual property (the Private Copying group) such increased flexibility had no effect on the creation of new works. I can think of no plausible explanation for these results for a legitimate application of fair use.
Thus, there is an alternative and more troubling take away from the results of the Fair Use Study: consumers took Singapore’s new law as a license to copy and distribute copyrighted content (i.e., piracy) without consequence. One could read Ghafele and Gibert’s study as evidence that expanded fair use laws encourages digital piracy of intellectual property without expanding the creation of new, transformative works. The evidence presented in the study would confirm such a hypothesis. Also, Singapore amended its copyright law less than a decade subsequent to modifying its fair use policy to address rampant digital piracy. Thus, if the Fair Use Study tells us anything, then it is that Singapore’s 2005 copyright law was a bad one.
7. Conclusions
The Fair Use Study by Ghafele and Gibert on the economic impacts of Singapore’s change in its fair use policies claims to show a positive effect (+67%) on industries that manufacture goods useful for private copying of copyrighted works and a negative effect (−30%) on the copyright industries. While evidence on fair use policies is welcome and critical to informed policy reform, Ghafele and Gibert’s flawed empirical analysis, in my view, fails to shed light on the consequences of modifications to fair use policies.
Protections offered by intellectual property laws support substantial economic activity and employment (Blank and Kappos 2012). Such laws do much to encourage the creative activity of humankind. But laws are man-made, imperfect, and in need of an occasional update. The evidence used to inform legal reform must be relevant and carefully conducted. Since policymakers are rarely skilled in statistical analysis, there is a trust that must be built between the research and the policymaking communities. Unskilled analysis threatens that trust. The formulation of public policy, especially when the economic consequences are large, deserves skilled and dispassionate empirical work.
Funding
No financial support was received for the production or publication of this Comment or its development.
Conflicts of Interest
The Phoenix Center is a 501(c)(3) corporation (non-profit) located in the United States that receives donations only for general support unless the patron is a government entity with particular interests. Center patron interests are broad and patrons may or may not have interests in this research. The author has in the past served as a private consultant to the music and video rights collectives and industry groups, including as an expert before the copyright boards of the United States and Canada in relation to compulsory licenses and the United States Copyright Office.
References
- Angrist, Joshua D., and Alan B. Krueger. 1999. Empirical Strategies in Labor Economics. In Handbook of Labor Economics. Edited by Orley Ashenfelter and David Card. Amsterdam: Elsevier Science, vol. 3A. [Google Scholar]
- Angrist, Joshua D., and Jörn-Steffen Pischke. 2008. Mostly Harmless Econometrics: An Empiricist’s Companion. Princeton: Princeton University Press. [Google Scholar]
- Aufderheide, Patricia, and Peter Jaszi. 2011. Reclaiming Fair Use. Chicago: Chicago University Press. [Google Scholar]
- Autor, David H. 2003. Outsourcing at Will: The Contribution of Unjust Dismissal Doctrine to the Growth of Employment Outsourcing. Journal of Labor Economics 21: 1–42. [Google Scholar] [CrossRef] [Green Version]
- Barker, George Robert. 2013. Agreed Use and Fair Use: The Economic Effects of Fair Use and Other Copyright Exceptions in the Digital Age. Unpublished Working Paper. Available online: http://ssrn.com/abstract=2298618 or http://dx.doi.org/10.2139/ssrn.2298618 (accessed on 9 July 2013).
- Barker, George R., and Ivan Png. 2013. ALRC Inquiry into Copyright and the Digital Economy Submission in response to Discussion Paper 79: Unreliable Evidence on Fair Use. Submission Received by the Australian Law Reform Commission, Copyright and the Digital Economy (DP 79). Available online: https://www.alrc.gov.au/sites/default/files/subs/507._g_r_barker__prof_i__png.pdf (accessed on 14 September 2018).
- Bertrand, Marianne, Esther Duflo, and Sendhil Mullainathan. 2004. How Much Should We Trust Differences-In-Differences Estimates? Quarterly Journal of Economics 119: 249–75. [Google Scholar] [CrossRef]
- Blank, Rebecca M., and David J. Kappos. 2012. Intellectual Property and the U.S. Economy: Industries in Focus. U.S. Patent & Trademark Office. Available online: http://www.uspto.gov/sites/default/files/news/publications/IP_Report_March_2012.pdf (accessed on 14 September 2018).
- Card, David. 1990. The Impact of the Mariel Boatlift on the Miami Labor Market. Industrial and Labor Relations Review 13: 245–57. [Google Scholar] [CrossRef]
- Galiani, Sebastian, Paul Gertler, and Ernesto Schargrodsky. 2005. Water for Life: The Impact of the Privatization of Water Services on Child Mortality. Journal of Political Economy 113: 83–123. [Google Scholar] [CrossRef]
- Ghafele, Roya, and Benjamin Gibert. 2014. A Counterfactual Impact Analysis of Fair Use Policy on Copyright Related Industries in Singapore. Laws 3: 327–52. [Google Scholar] [CrossRef] [Green Version]
- Imbens, Guido W., and Jeffrey M. Wooldridge. 2009. Recent Developments in the Econometrics of Program Evaluation. Journal of Economic Literature 47: 5–86. [Google Scholar] [CrossRef] [Green Version]
- Intellectual Office of Singapore. 2016. Asking Permission and Using Copyright. Available online: http://www.ipos.gov.sg/AboutIP/TypesofIPWhatisIntellectualProperty/Whatiscopyright/Askingpermissionandusingcopyright.aspx (accessed on 22 January 2016).
- Lechner, Michael. 2011. The Estimation of Causal Effects by Difference-in-Difference Methods. Foundations and Trends® in Econometrics 4: 165–224. [Google Scholar] [CrossRef]
- Leval, Pierre N. 1990. Toward a Fair Use Standard. Harvard Law Review 103: 1105–36. Available online: http://www.pijip.org/wp-content/uploads/2015/11/103HarvLRev.pdf (accessed on 14 September 2018).
- Mann, Colin. 2014. Singapore Proposes Copyright Amendments. Advanced Television. April 9. Available online: http://advanced-television.com/2014/04/09/singapore-proposes-copyright-amendments/ (accessed on 14 September 2018).
- Meyer, Breed D. 1995. Natural and Quasi-Experiments in Economics. Journal of Business & Economic Statistics 13: 151–61. [Google Scholar]
- Stanford University Library. 2016. What is Fair Use? Available online: http://fairuse.stanford.edu/overview/fair-use/what-is-fair-use (accessed on 22 January 2016).
- TBO. 2014. Singapore Passes Copyright Amendment. Trademarks & Brands Online. Available online: http://www.trademarksandbrandsonline.com/news/singapore-passes-copyright-amendment-4011 (accessed on 14 September 2018).
- WIPO. 2005a. Trade Marks Act (Singapore), Chapter 332, Revised Edition 2005. Available online: http://www.wipo.int/wipolex/en/text.jsp?file_id=187981 (accessed on 14 September 2018).
- WIPO. 2005b. Patents Act (Singapore), Chapter 221, Revised Edition 2005. Available online: http://www.wipo.int/wipolex/en/details.jsp?id=5296 (accessed on 14 September 2018).
- WIPO. 2006. Copyright Act (Singapore), Chapter 63, Revised Edition 2006. Available online: http://www.wipo.int/wipolex/en/text.jsp?file_id=187737 (accessed on 14 September 2018).
| 1 | An alternative interpretation of the results is that the analysis shows a huge forecast error for the Private Copying group and small errors for the Copyright and Control groups. |
| 2 | A possible case where both the treated and control groups receive the treatment but the control group remains valid (possibly) is if the control group is genetically immune from the disease being treated (or the treatment itself). Even so, the control group would be suspect. |
| 3 | Each series is mean-centered (on unity) for illustration purposes. |
| 4 | Given problems with the data, control group, and the parallel paths assumption, I do not contend that these findings are actually valid. Rather, if I take Ghafele and Gibert’s general approach and apply proper statistical test, no effect is found. |
Figure 1.
Pre-treatment trends.

Figure 2.
Full data trends.


Table 1.
Estimated Effects from the Fair Use Study (Value added as Percent of GDP).
| Industry Group | 2010 Actual | 2010 Predicted | Diff. | Impact (Adj. for Control) |
|---|---|---|---|---|
| Private Copying | 5.02% | 1.68% | 3.34% | 3.33% |
| Copyright | 0.55% | 0.78% | −0.23% | −0.25% |
| Control | 0.44% | 0.43% | 0.01% | … |
© 2018 by the author. Licensee MDPI, Basel, Switzerland. This article is an open access article distributed under the terms and conditions of the Creative Commons Attribution (CC BY) license (http://creativecommons.org/licenses/by/4.0/).
Share and Cite
MDPI and ACS Style
Ford, G.S. A Counterfactual Impact Analysis of Fair Use Policy on Copyright Related Industries in Singapore: A Critical Review. Laws 2018, 7, 34. https://doi.org/10.3390/laws7040034
AMA Style
Ford GS. A Counterfactual Impact Analysis of Fair Use Policy on Copyright Related Industries in Singapore: A Critical Review. Laws. 2018; 7(4):34. https://doi.org/10.3390/laws7040034
Chicago/Turabian StyleFord, George S. 2018. "A Counterfactual Impact Analysis of Fair Use Policy on Copyright Related Industries in Singapore: A Critical Review" Laws 7, no. 4: 34. https://doi.org/10.3390/laws7040034
Note that from the first issue of 2016, this journal uses article numbers instead of page numbers. See further details here.