Increasing Green Infrastructure in Cities: Impact on Ambient Temperature, Air Quality and Heat-Related Mortality and Morbidity


1
Anita Lawrence Chair High Performance Architecture, School Built Environment, University of New South Wales, Sydney, NSW 2052, Australia
2
School Built Environment, University of New South Wales, Sydney, NSW 2052, Australia
*
Author to whom correspondence should be addressed.
Buildings 2020, 10(12), 233; https://doi.org/10.3390/buildings10120233
Submission received: 9 November 2020
/
Revised: 27 November 2020
/
Accepted: 2 December 2020
/
Published: 7 December 2020
(This article belongs to the Special Issue Buildings: 10th Anniversary)
Abstract
:Urban vegetation provides undeniable benefits to urban climate, health, thermal comfort and environmental quality of cities and represents one of the most considered urban heat mitigation measures. Despite the plethora of available scientific information, very little is known about the holistic and global impact of a potential increase of urban green infrastructure (GI) on urban climate, environmental quality and health, and their synergies and trade-offs. There is a need to evaluate globally the extent to which additional GI provides benefits and quantify the problems arising from the deployment of additional greenery in cities which are usually overlooked or neglected. The present paper has reviewed and analysed 55 fully evaluated scenarios and case studies investigating the impact of additional GI on urban temperature, air pollution and health for 39 cities. Statistically significant correlations between the percentage increase of the urban GI and the peak daily and night ambient temperatures are obtained. The average maximum peak daily and night-time temperature drop may not exceed 1.8 and 2.3 °C respectively, even for a maximum GI fraction. In parallel, a statistically significant correlation between the peak daily temperature decrease caused by higher GI fractions and heat-related mortality is found. When the peak daily temperature drops by 0.1 °C, then the percentage of heat-related mortality decreases on average by 3.0% The impact of additional urban GI on the concentration of urban pollutants is analysed, and the main parameters contributing to decrease or increase of the pollutants’ concentration are presented.
1. Introduction
Rapid urbanisation in combination with climate change cause serious environmental hazards such as increase of the urban temperature, elevated concentration of air pollutants, storms, increased droughts or excessive precipitation, and poses serious health problems in cities. In 2017, the global urban population reached 4 billion, representing almost 55% of the world population, and it is expected to increase to close to 68% by 2050 [1].
Urban overheating is the most documented phenomenon of climate change. Increased urban temperatures compared to the surrounding rural or suburban built environment are experimentally documented for more than 450 large cities in the world [2]. The magnitude of the urban overheating may be as high as 10 °C, with an average value close to 5–6 °C [3]. Recent research has shown that the magnitude of urban overheating increases considerably during heatwaves because of the important local climatic synergies [4].
Urban overheating negatively affects the cooling energy demand of buildings, peak electricity demand, concentration of air pollutants, heat-related mortality and morbidity and urban vulnerability levels [5]. It is well-documented that urban overheating is associated with an additional cooling energy penalty close to 0.7 kWh/m2 of city surface and degree of temperature increase, while the additional required peak electricity demand is estimated close to 21 (±10.4) W per person and degree of temperature increase [6,7].
The impact of urban overheating on health is reasonably well-documented. Higher levels of ambient temperature are associated with increased mortality and morbidity as the human thermoregulation system cannot offset very high ambient temperatures [8]. As a result, numerous recent researches have shown that the health risk is substantially higher in urban than in rural environments, while the risk of heat-related mortality in warmer urban neighbourhoods is 6% higher than in cooler precincts [9,10]. Heat-related health issues combined with epidemic and non-communicable diseases, such as cancer, diabetes, mental disorders, cardiovascular and respiratory diseases, increase the health burden in cities and are expected to increase considerably in the low- and middle-income societies in the near future [11,12].
Urban overheating has a serious impact on air quality. Elevated ambient temperatures enhance photochemical reactions with hydrocarbons and NOx generating ozone [13]. In parallel, the increased operation of power plants during the warm season considerably increases the emission of harmful pollutants [14].
Outdoor air pollution is the most serious environmental hazard for human health and citizens’ wellbeing. Exposure to air pollutants like the ground-level ozone, particulate matter, NOx and SO2, may result in serious respiratory and cardiovascular health problems and increased mortality [15]. According to the World Health Organisation, outdoor pollution is responsible for about 8 million deaths per year, while in about 56% of cities in the developed world and 98% in the developing countries, the concentration of harmful pollutants like ozone, particles and NOx exceeds the thresholds of the World Health Organisation (WHO) [14,16]. Ozone is a highly toxic pollutant strongly affecting human health, contributing in 2010 to about 1.2 million premature respiratory deaths, equivalent to 20% of total respiratory deaths [17]. While systematic environmental policies have resulted in a considerable decrease of the concentration of most of the atmospheric pollutants, the concentration of ground-level ozone continues to rise as a result of intensive urbanisation and temperature increase. It is characteristic that in 75 Chinese cities, ozone concentration increased from 69 to 75 ppbv between 2013 and 2015, while the percentage of non-compliant cities increased from 23% to 39% [18]. Urban overheating has a serious impact on the concentration of ground-level ozone [19,20]. Several studies have documented that during extreme climatic conditions, the ozone concentration increases up to 20%, while studies in Japan have shown that the long-term variability of the peak ground-level ozone is related to the variation of the ambient temperature and wind speed [21,22,23]. Considerably higher ozone concentrations and frequencies of extreme ozone episodes are forecast for the coming years because of the expected temperature increase, and the corresponding modification of the chemical reaction rates [24]. It is predicted that the average background concentration of ground-level ozone may increase in the mid-latitudes of the Northern Hemisphere, by close to 85 ppb in 2100 compared to the current levels of 35–50 ppb [25]. Much higher frequencies of high ozone events are also predicted by other studies. In particular, it is foreseen that in four major Canadian cities, the frequency of future ozone episodes may increase by 50% by 2050 and 80% by 2080, while in Tucson Arizona, the predicted increase by the end of the century may reach 400% [26,27].
To prepare efficient responses to the above threats and challenges and to minimise vulnerability and associated risks, actions involving efficient mitigation and adaptation policies based on multisector approaches are necessary [28]. Several mitigation technologies to counterbalance the impact of urban overheating have been proposed and implemented in numerous large-scale projects [29]. Mitigation technologies involve the use of reflecting and super-cool materials, additional greenery, use of evaporative and transpiration cooling systems, solar control and shading devices, and the use of low-temperature natural sinks [30,31,32,33]. Monitoring of a high number of large-scale mitigation projects has demonstrated that the implemented technologies can reduce the peak ambient temperature up to 2.5 °C and may contribute significantly to decrease building cooling energy demand, peak electricity load and heat-related mortality and morbidity [34,35,36].
There are many definitions of the term Green Infrastructure (GI). According to the European Environmental Agency, “Green infrastructure as a term is used for a network of green features that are interconnected and therefore bring added benefits and are more resilient” [37], while Connop et al. [38] define GI as “a network of natural and semi-natural green spaces such as forests, parks, green roofs and walls that can provide nature-based and cost-effective solutions”. It is widely accepted that an increase of the green urban infrastructure, and particularly tree cover, improves urban resilience [39,40]. Trees provide urban overheating reduction, pollutant removal, carbon sequestration, retention and detention of stormwater runoff, while improving residents’ health [41,42,43,44,45].
Given the multiple benefits of increased GI, large-scale projects aiming to increase the fraction of tree cover occur in many cities. Large tree planting initiatives are undertaken in cities like New York, Chicago, Los Angeles, Sydney, Melbourne, etc. [46,47,48]. However, there is an uncertainty on the magnitude of the benefits provided by increased GI policies, and the associated disservices, like the emission of biogenic volatile organic compounds (VOCs), the increased use of water and the additional economic cost [49]. There is a clear need to evaluate the extent to which increased GI mitigates urban heat, reduces urban pollution and decreases health problems; in parallel, it is important to provide additional holistic information and knowledge to optimise future planting strategies in cities.
The present article aims to investigate in a global way the biophysical effects on regional urban climate, air quality and heat-related mortality and morbidity triggered by the increase of urban green infrastructure and tree cover. In parallel, it aims to quantify the mitigation potential of increased tree cover during the daytime and night-time, the potential decrease of heat-related mortality and to analyse the impact of additional tree cover on air pollution.
2. The Nature of the Study
Twenty-nine articles investigating the impact of increased green infrastructure on the ambient temperature, air pollution and heat-related mortality and morbidity were reviewed and analysed. The studies reported 55 fully evaluated scenarios of increased GI for 29 cities and precincts (see the Map Figure S1 in the Supplementary Materials). Nineteen of the cities are in North America, eight in Australia, seven in Europe, three in Asia and one in South America. Two of the studies reported the combined impact of GI on ambient temperature levels and heat-related mortality and morbidity, 11 studies on the ambient temperature and heat-related mortality, 5 on ambient temperature and heat-related morbidity, 4 on ambient temperature and air quality, 10 on air quality while 25 studies investigated only the impact on the ambient temperature. All the characteristics and results of the 55 scenarios of increased GI are reported in Table 1.
Existing literature provides information on the climatic, air quality and health impact of potential additional green infrastructure. We considered and analysed all studies evaluating the specific impact of GI in quantitative terms. Unfortunately, no quantitative studies are available on the other potential benefits of GI.
The overall article is divided into three parts. The first part analyses and discusses the impact of the potential increase of urban tree cover on the ambient temperature. Specific analysis on the temperature drop during the daily peak at 15:00 and at night is performed. Concerning the few studies reporting the afternoon (17:00) daily temperature drop, local temperature data are used to estimate the peak daily temperature at 15:00. The second part of the analysis investigates the impact of additional GI on the concentration of urban pollutants, focusing mainly on ground-level ozone and particulate matter. Finally, the third part of the study investigates the relation between the additional GI and health and with the levels of heat-related mortality and morbidity.
3. The Impact of Increased Green Infrastructure on Ambient Temperature-Mitigation Potential
3.1. Identity of the Existing Studies
Trees contribute to decrease the ambient temperature through evapotranspiration and shading. In parallel, when impervious surfaces like asphalt and concrete are replaced by vegetation, the stored heat during the day and the emitted sensible heat during the day and night are seriously reduced. The potential temperature decrease because of the increased GI fraction depends on the difference of the thermal balance between the non-vegetated control/reference scenario and the vegetated one. It is mainly affected by the specific climatic conditions, the availability of soil moisture, the type of vegetation and the way it is distributed in a city. As a result, increased vegetation fractions may contribute to reduce the ambient temperature during the night or the day or both, or even cause some warming effects under specific conditions.
Forty-six studies evaluating the impact of increased tree fraction in 30 cities and locations were analysed and evaluated. The study refers to seven North American cities and their suburbs (New York, Philadelphia, New Orleans, Detroit, Dallas, Toronto and the North Eastern part of the US), five Australian cities (Melbourne, Sydney, Brisbane, Darwin and Parramatta), three European cities (Vienna, Austria, Bochum and Stuttgart, Germany), three Asian cities (Hong Kong, Singapore and Tehran), and Sao Paolo in South America. The considered tree cover varies between 1.3% in Bronx NY to 100% in Hong Kong and Melbourne, Australia, with an average GI value close to 16%. The average increase of the GI for all case studies is close to 22% and the average final GI is close to 38%. Most of the assessments are performed using mesoscale modelling techniques like the Weather Research Forecast (WRF), or MM5, while four studies are based on microscale modelling like ENVI-met and i-Tree. These studies considered either a homogeneous increase of the tree fraction across the city or have considered potential additional parks in specific urban zones. Although the assumptions and the computational methods may differ substantially between the studies, there is a minimum homogeneity concerning the outputs and the results permitting comparison of the assessments. All the relative details of the considered studies are given in Table 1.
The impact of central and pocket parks as well as of trees distributed in streets on the ambient temperature of a district in Central Sao Paolo, Brazil, is discussed in Reference [50]. The tree cover is considered to increase from zero to 11%. Simulations were performed using the ENVI-met microscale climatic model and it was found that during the summer, trees in urban canyons can reduce the average peak daily ambient temperature in the area by 0.6 °C, and in the central and pocket parks by 0.4 °C.
The potential impact of the tree cover increases from 24.9% to 26.2% in Bronx, New York, NY, USA, is discussed in Reference [51]. Using the i-Tree software, it is found that the average peak daily temperature decrease may not exceed 0.09 °C. A second study aiming to investigate the cooling potential of various mitigation measures in numerous urban zones of NY City USA is presented in Reference [52]. The study used the MM5 mesoscale model to assess the potential decrease of the peak ambient temperature when hard urban surfaces are replaced by trees. A spatially variable increase of the tree fraction among the various urban precincts, from 6.2% to 14.4%, was considered. It was found that at 15:00, additional tree cover may drop the ambient temperature between 0.2 to 0.5 °C. A third study for NY, USA, investigated the impact of increased tree fraction from 10% to 20% and 30% using the MM5 mesoscale climatic tool [53]. It found that the average temperature drop during the peak daily period is close to 0.15 and 0.4 °C for the two considered scenarios. A quite similar study for Dallas, TX, USA, estimated the impact when GI increases by 7.5% from a base value of 27.5%, and found that the peak daily temperature drop is close to 0.38 °C [54]. Simulations for several US cities in the North Eastern part of the country considering a 20% increase of the tree cover to almost 40% are reported in References [55,56]. Using the WRF mesoscale climatic model, it was calculated that the maximum temperature decrease is close to 0.4 °C. A study performed for two suburban areas of Toronto, Canada, is presented in Reference [57]. Mesoscale, WRF and a microscale models were used to simulate the climatic impact when the tree fraction increases from 18% to 27%. The estimated average drop of the peak ambient temperature was 0.2 and 0.3 °C for the two precincts, while for the high greenery scenario, the corresponding temperature drop was 1.61 and 1.29 °C, respectively. Considerably higher temperature drop values were estimated for the night period. Simulations using WRF were performed during heatwave periods, to assess the impact of the GI increase by 10% in the cities of New Orleans, Philadelphia and Detroit [58]. The initial tree cover varied between 15 and 25% and the final between 25% to 35%. It was found that the average afternoon temperature may decrease by 0.21 °C in New Orleans, 0.32 °C in Philadelphia and 0.1 °C in Detroit.
In Australia, the potential decrease of the ambient temperature in the City of Melbourne was investigated in three studies [59,60,61]. Five specific scenarios considering a final tree cover of 5%, 36%, 38%, 49% and 100%, compared with an initial tree cover of 15%, were analysed in Reference [59]. Simulations were performed using the mesoscale model UCM-TAPM. It was calculated that the average peak daily temperature drop may vary between 0.25 and 1.8 °C, while the decrease of the tree cover from 15% to 5% may raise the average peak daily temperature by 0.2 °C. The study reported in Reference [60] considered an increase of the mixed forest fraction in the city from zero to 20% and 50%. Simulations were performed for the January 2009 heatwave using the mesoscale climatic model WRF [60]. It was reported that during the night-time, the amplitude of the Urban heat island (UHI) decreased between 0.5 °C and 5.0 °C for a 20% to 50% rise of the GI. The daytime decrease of the ambient temperature as well as the impact on the daily magnitude of the UHI was found to be almost negligible. However, a very significant decrease of the ambient temperature ranging between 1 °C and 3.5 °C was calculated for the night period. A third study for the City of Melbourne evaluated the impact of increasing the trees fraction from an initial value of 24% to 28%, 32% and 40% during the period of several recent heatwaves [61]. It reported that the maximum temperature reduction occurs during the night-time because of the reduced daytime heat storage and the decreased release of sensible heat by the greenery during the night. The maximum temperature drop during the night period was close to 0.28, 0.38, and 1.08 °C for the three greenery scenarios. The temperature drop during the daytime was considerably lower and did not exceed 0.25 °C [61]. The impact of an increased urban trees fraction on the ambient temperature of a subtropical Australian city, Brisbane, is discussed in Reference [62]. The study considered a decrease of the tree cover from 45% to zero, ‘no vegetation’, during a ten-year period using the CCAM CSIRO mesoscale climatic model. It calculated that the maximum temperature decrease happens during the night-time and is close to 1.83 °C. The daily average temperature decrease was estimated close to 0.99 °C, while the decrease during the peak hours was close to 0.44 °C. Similar results were obtained for the suburban areas of Archerfield and Logan. Two studies aiming to investigate the mitigation potential of additional greenery in Sydney, Australia are reported in References [63,64]. Using the WRF climatic tool, it was estimated that when two million additional trees are added to the city, the decrease of the peak daily temperature in Parramatta, Western Sydney, is close to 1 °C [64]. The second study estimated the temperature drop in the City of Sydney considering an increase of the trees fraction by 55%, from 20% to 75% [63]. Using ENVI-met, it was calculated that the potential drop of the peak daily temperature was close to 1.2 °C. ENVI-met was also used to calculate the mitigation potential of increased green infrastructure, from 19% to 39% in the tropical Australian city of Darwin. The average estimated daily maximum drop of the peak temperature was close to 0.5 °C [65].
In Europe, the impact on the urban climate of a central park covering 25% of the city of Bochum, Germany, was assessed in Reference [66]. Using WRF simulations, it was estimated that the new park may decrease the average peak daily ambient temperature by 0.45 °C. A similar study for the city of Stuttgart, Germany, also based on WRF, found that an increase of the GI from 18% to 30% may decrease the average peak daily temperature by 0.13 °C, while close to the new parks, the temperature drop may be as high as 2.0 °C [67]. In a similar study carried out for the city of Vienna, the MICLIMA 3 tool was used to assess the impact of increasing the size of urban parks by 20% [68]. A maximum night-time temperature drop of 1 °C was found.
Simulations using the WRF model were carried out for the city of Singapore, to estimate the cooling capacity of a potential increase of the average urban forestry from 15% to 35%, or 40% of the dense urban areas [69]. During the average peak daytime hours, the temperature decrease was found close to 0.3 °C, while it was considerably higher during the night and close to 1.0–2.0 °C. A significant increase of the humidity levels was also calculated as a result of the higher tree cover. The climatic impact of a potential increase of tree fraction by 20%, from almost 8% to 28%, in Tehran, Iran, was assessed in Reference [70]. Using WRF, it was estimated that the maximum daily drop of the ambient temperature was close to 0.6 °C, while phenomena of night-time warming, compared to the reference scenario, were reported. In a similar study for the city of Hong Kong, China, it was calculated that an increase of tree cover from zero to 100% could decrease the peak ambient temperature by 1.6 °C [71].
3.2. Association of the Temperature Drop and GI
The analysis of all the studies provided information on the potential drop of the average peak daily and the night-time temperature for 40 and 25 case studies, respectively. Also, 20 studies provided information on the drop of the ambient temperature during both the day and night-time. We have selected to use the temperature drop at 15:00 as a proxy, given that it corresponds to the time of the day that presents the maximum ambient temperature and potentially the maximum overheating load. Such a proxy helps to identify the potential temperature drop caused by GI during the peak time. In parallel, this proxy is the most frequently reported parameter by the relevant studies.
The potential temperature drop during the night-time caused by the GI is of specific interest as it helps to cool down the city and reduce the ambient temperature during the next day. It also highly affects comfort and energy conditions during the night-time. To characterise the cooling potential of GI during the night-time, we propose to use as a proxy the maximum achieved temperature drop between the sunset and sunrise time. Such a proxy helps to identify the maximum cooling potential of GI during the night-time and is usually reported by all relevant articles.
The relation between the average peak daily temperature drop, ΔT15, and the initial, GIin, and final considered tree cover, GIfin, can be described by a multiparameter correlation as below:
where a = −0.0145, b = −0.01068 and c = 0.0167. The R2 of the correlation is equal to 0.83, the p-value for both independent parameters is very low, and the correlation is statistically significant. Figure 1 plots the reported against the predicted values, from Equation (1), of the average daily peak temperature drop. Supplementary Table S1 provides in detail all statistical indicators of the correlation given in Equation (1).
ΔT15 = a + b GIin + c GIfin,
The relation between the reported drop of the average peak daily temperature and the increase of the tree cover is shown in Figure 2. As shown, the average peak daily decrease of the ambient temperature, ΔT15, may be expressed as a linear function of the increase of the tree cover ΔGI:
where d = 0.0181. The R2 of the correlation is equal to 0.90, and the p-value is very close to zero. Supplementary Table S2 provides all the statistical characteristics of Equation (2). To minimize the impact of outliers in the correlation, the available data of ΔT15 are grouped into four clusters of ΔGI, as shown in Figure 3. When the average value of ΔT15 for each cluster is correlated against the corresponding mean ΔGI value, the resulting correlation can be better presented by a second-degree polynomial:
with an R2 equal to 0.98. The statistical characteristics of Equation (3) are given in Supplementary Table S3.
ΔT15 = d·ΔGI
ΔT15mean = 0.00013 ΔGI2 + 0.0079 ΔGI
The observed non-linearity between the temperature decrease and the tree cover is in agreement with the experimental results reported in Reference [72], where it was found that the temperature decrease caused by greenery was a nonlinear function of the increasing canopy cover, with the higher cooling when the tree cover exceeded 40%.
A similar expression as Equation (1) was also obtained between the average maximum temperature drop during the night-time period and the initial and final GI values. In particular,
where a1 = 0.4123, b1 = −0.0355 and c1 = 0.0262. The R2 of the correlation is equal to 0.86, the p-value for both independent parameters is very low, and the correlation is statistically significant. The statistical characteristics of Equation (4) are given in Supplementary Table S4.
ΔTngt = a1 + b1 GIin + c1 GIfin
Figure 4 presents the correlation between the average maximum drop of the ambient temperature at night, ΔTngt, and the corresponding increase of GI.
where d1 = 0.0344. The R2 of Equation (3) is equal to 0.76, and the p-value is very close to zero. As observed, the slope of the ambient temperature drop is considerably higher during the night than the daytime. This is clearly shown in Figure 5 comparing the slope of the temperature drop during the day, left, and night-time, right. Figure 5 includes data only from case studies reporting both the day and night-time temperature drop.
ΔTngt = d1·ΔGI
3.3. Discussion and Conclusions on the Mitigation Potential of GI
Analysis of the case studies may lead to the following conclusions:
- (a)
- The maximum potential drop of the average daily peak temperature caused by the increased tree cover in cities may not exceed 1.8 °C even if the green infrastructure increases up to 100%. For a reasonable increase of the GI by 20%, the average expected peak temperature drop is close to 0.3 °C.
- (b)
- During the night, the maximum ambient temperature decrease corresponding to a GI rise of 80% may not exceed 2.3 °C, while the temperature drop for a GI increase by 20% is close to 0.5 °C.
- (c)
- Of the 22 studies reporting both the daytime and night-time temperature drop, 19 studies reported a higher temperature drop during the night than the day. This is due to two main reasons: (a) increased tree cover considerably reduces the daytime stored heat in the ground and the corresponding release of heat by the ground during the night, and (b) the released sensible heat by the trees during the night is considerably lower than the corresponding heat released by impervious urban surfaces [59,61]. During the daytime, evapotranspiration is the main cooling mechanism, however its impact on the surface energy budget may not be enough to compensate and counterbalance heat fluxes due to advection and sensible heat released by the impervious surfaces. The calculated magnitude of evaporation losses depends highly on the humidity of the ground assigned by the models and the humidity content of the atmosphere [73,74].
- (d)
- Several articles report warming effects during the night because of the increased tree cover [60,70]. Increase of the night-time temperature may be as high as 2 °C and is explained by the decreased sky view factor in the urban canyons where trees are located, reducing the escape of long-wave radiation [75].
- (e)
- The calculated magnitude of the temperature drop highly depends on the considered urban landscape assumptions about the location and the sizing of the additional tree cover. Simulations considering patches of urban greenery fully covering several grid cells, when compared to simulations considering a mixture of impervious and green surfaces in the grid cells, present higher evapotranspiration and less heat storage during the day, and thus a considerably lower night-time temperature. In parallel, when urban trees are surrounded by other quite warm urban impervious surfaces and/or zones of high anthropogenic heat release, they present a considerably lower cooling potential [76]. However, it has to be recognised that it is difficult to evaluate sources of uncertainty regarding the simulation assumptions and accuracy around the coupling and evaluation of the specific land conditions in cities.
- (f)
- Simulations carried out with the WRF mesoscale model are highly influenced by the considered parameterisation scheme. The tool offers four parameterisation schemes presenting different ways to characterise the interaction between the land surfaces and the lower atmosphere: The bulk urban parameterisation, the single layer and the multi-layer parameterisation schemes [77,78,79], and another multilayer scheme considering outdoor–indoor interactions [80]. Simulations carried out for the city of Stuttgart using different parameterisation schemes revealed important differences in the obtained results [67].
- (g)
- Deployment of additional trees in cities may raise the levels of ambient relative humidity and deteriorate the levels of thermal comfort. Especially in tropical cities where relative humidity is considerably high, a further rise of the ambient humidity levels may be a serious problem. Simulations for Singapore have shown that deployment of additional greenery may increase the levels of relative humidity by up to 8% [69].
4. Impact of Increased Green Infrastructure on Urban Pollution Levels
4.1. Introduction and Identity of the Studies
Increase of urban tree cover is associated with multiple dynamic and chemical changes in the lower atmosphere. Vegetation accumulates particulate matter by sedimentation, interception and impaction, while it also absorbs gaseous pollutants such as NOx and O3 mainly through the stomata of the leaves [81]. Absorption of pollutants varies significantly between tree species, while removal of the pollutants depends on several parameters like the concentration of the pollutants, tree species traits such as leaf area, stickiness, porosity and roughness, length of growing season, the canopy structure, the size of pollutant particles, meteorological conditions and possible precipitation [82,83]. In parallel, trees emit biogenic VOCs (BVOCs), like isoprenoids, monoterpenes and sesquiterpenes, which are much more reactive than the anthropogenic VOC emissions, and about 2–3 times more reactive than the weighted average emissions from petrol combustion [84,85,86]. Isoprenoids interact with nitrogen oxides and seriously affect the concentration of ground-level ozone, while monoterpenes and sesquiterpenes increase the production of airborne particles during the hot summer period [70]. As already discussed, increase of tree cover results in lower ambient and surface temperatures, which may have either a positive or negative impact on pollutant concentration. Positive impacts include the reduction of BVOC emission rates [87,88] and the decrease of the rate of photochemical reactions [89]. Negative impacts are related to reduced buoyancy and turbulent mixing caused by trees, resulting in lower Planetary Boundary Layer Heights (PBLH), where pollutants are mixed, which may increase the concentration of the primary gaseous pollutants like NOx, and primary airborne particles [90].
Apart from the reduced surface temperature, trees may decrease wind speed in the built environment, vertical mixing and atmospheric dispersion, increasing the concentration of pollutants in the urban canyons and canopies, while it may affect the circulation of sea breezes in coastal areas and the transport of precursors and pollutants in the city domain [91,92,93].
It is widely accepted that additional urban green infrastructure has a non-linear feedback on urban pollution levels, while the impact may be either positive or negative depending on the urban form and vegetation characteristics.
Eleven studies assessing the potential impact of increased urban green infrastructure on pollutant concentrations were analysed [51,55,56,93,94,95,96,97,98]. The main characteristics and results of the studies are depicted in Table 1. Seven of the studies refer to USA cities or regions (Bronx, NY, Kansas City, New York, Atlanta, California South Coast Air Basin and two studies for North Eastern cities), three studies are for UK cities and regions (Greater London area, West Midlands and Glasgow), and one study for Melbourne, Australia. Seven of the studies analyse the potential impact of increased urban green infrastructure on ground-level ozone, six on particulate matter (PM10, PM2.5) and one on NO2, SO2 and CO. The characteristics and the findings of the studies are analysed below.
4.2. Impact of Additional Greenery on Particulate Matter
Relevant studies can be classified in two groups: Those focusing on the estimation of the removal rate of particulate matter mainly because of the deposition of the particles [51,83,98], while the second group of studies focuses on the impact of the additional trees on the spatial concentration of particles in a city or region taking into account the global phenomena influencing pollutant concentration [84,97].
The potential impact of enhanced urban green infrastructure in Bronx, New York, NY, USA, was investigated in Reference [51]. A well-defined planting program for each census block of the city was presented and its impact on the actual and future (2030) PM2.5 concentration was evaluated for three different tree mortality scenarios: no mortality, 4% and 8% annual mortality. While the current tree cover in the city is 2470 ha, or 22.7% of the total land, it is estimated that by 2030, it will increase up to 24.9%. The i-Tree assessment tool was used to estimate and characterise the benefits of the additional green infrastructure [99]. It was reported that during 2010, trees removed 5.1 tonnes/year of PM2.5, while the increase of the green infrastructure by 2030 may raise the removal of pollutants to between 5.6 and 6.2 tonnes/year, corresponding to an increase of between 9.8% and 21.6% depending on the selected tree mortality scenario.
The impact of increased tree cover from 20 to 80 trees per ha on six atmospheric pollutants including PM2.5 and PM10, in the Brooklyn industrial precinct of Melbourne, Australia, was assessed in Reference [83]. Calculations were also performed using the i-Tree assessment tools. It was estimated that the existing trees remove up to 7 kg of PM2.5 and 225 kg of PM10 per year. When new trees were considered, the removed quantities rise to 43 kg/year of PM2.5 and 1474 kg/year of PM10. This corresponds to an increase of the removed pollutants close to 514% for PM2.5 and 555% for PM10.
The impact of an increase of tree cover from 20% to 30% on the removal of PM10 in the Greater London Area, UK, was investigated in Reference [98]. Calculations were performed using the Urban Forest Effect Model, UFORE. It is calculated that by 2050, between 1109 to 2379 tonnes of particles can be removed by the urban greenery. This corresponds to a removal rate of between 1.1% and 2.6%.
The potential impact of enhanced green infrastructure on the concentration of PM2.5 and ground-level ozone in Kansas City, USA, was investigated in Reference [84]. A detailed greening scenario was considered and evaluated using the coupled WRF-CMAQ mesoscale climatic simulation model. It was calculated that the increase in tree cover may raise the concentration of PM2.5 in the city’s downtown area by about 10% or 1.1 μg per cubic meter during the night-time. The calculated increased concentration of PM2.5 is associated with the decrease of surface temperature caused by the additional trees that lowers the height of the Planetary Boundary Layer (PBL), limits the ventilation potential and increases the concentration of primary PM2.5 close to the ground. During the daytime, the concentration of airborne particles may decrease in specific parts of the city because of the slower rate of chemical reactions caused by the lower ambient temperature.
The potential impact of additional greenery on the concentration of PM10 in West Midlands and Glasgow in the UK, was investigated in Reference [97]. Simulations of the pollutant concentration were performed using the atmospheric transport model FRAME. Two greening scenarios were investigated for West Midlands, involving increase of the tree cover from 3.75% to 16.5% and 54% For the low greening scenario. It was calculated that about 110 tonnes/year of airborne particles are removed from the atmosphere, while the average concentration of the primary pollutants decreases by 10% from 2.3 mg/m3 or 18.0 mg m−3 of total PM10, to 2.1 mg/m3 of primary PM10. When the tree cover increases to 54%, it was calculated that about 200 tonnes/year of PM10 are removed from the atmosphere and the total concentration may decrease by 26%.
Two scenarios of greenery increase from 3.75% to 8.0% and 14% were also investigated for the city of Glasgow. It was calculated that the moderate increase of greenery may contribute to remove 4 tonnes/year of PM10, resulting in a reduction of the average PM10 concentration by 2%. Under the high greenery increase scenario, about 13 tonnes/year of PM10 are removed and average concentration decreases by 7%. Most of the pollution reduction is estimated to happen in the outskirts of the city, while a quite limited decrease of the PM10 concentration is calculated for the city centre because of the limited space for additional tree planting.
Analysis of the above studies leads to the following conclusions:
- (a)
- Additional urban green infrastructure substantially increases the removal of particles from the atmosphere mainly through deposition processes. The magnitude of the removal depends on several parameters like the type and size of trees, the type of tree cover, the concentration of the particles in the atmosphere and the specific transport and climatic conditions. Particle size determines the magnitude and the process of deposition. While large particles, >10 mm in diameter, fall in the soil below the trees by sedimentation, particles with diameter between 1 to 10 mm are deposited as trees force the air flow to bend, while ultrafine particles below 1 mm are deposited by diffusion [100,101]. Numerical simulations have shown that increased greenery in canyons contributes to reduce the concentration of airborne particles in canyons up to 60%, which seems a quite high value [102].
- (b)
- Dispersion because of the aerodynamic impact of trees may considerably decrease the concentration of airborne particles. Simulations carried out for the city of Leicester, UK, showed that aerodynamic dispersion resulted in a 9.0% reduction of PM2.5 concentration, while deposition on trees resulted in a reduction close to 2.8% [103]. However, several studies have reported that in urban canyons, trees may change the roughness properties, resulting in a considerable increase of the concentration of particulate matter [104,105,106].
- (c)
- Although additional tree cover is associated with a higher removal of particles, the concentration of particulate matter in the atmosphere may increase as additional greenery reduces the surface temperature, affecting the height of the PBL and trapping the particles in the lower atmosphere, thereby reducing ventilation and transport of pollutants. Increase of particle concentration was predicted for Kansas City but not for West Midlands and Glasgow. Analysis of relevant data from Montreal has also found that increase of the PBLH resulted in a negligible increase of the PM2.5 daily average concentration [107]. It is evident that meteorological as well as landscape parameters determine the potential decrease of the PBL and the corresponding rise of pollutant concentration in a city. Given that most of the information is from simulation studies and not systematic in situ measurements, the accuracy of the used models to describe the complex phenomena is a serious issue to be considered.
4.3. Impact of Additional Greenery on Ground-Level Ozone
Of the seven studies evaluating the impact of additional urban green infrastructure on ground-level ozone, one study focuses on the potential removal of O3 in Melbourne, Australia, while the rest of the studies analysed the global impact on the atmospheric concentration of ozone [83]. The Australian study found that an increase of tree cover at the Brooklyn industrial area of Melbourne from 20 to 80 trees per hectare may improve the removal of the ground-level ozone from 246 to 1885 kg per year [83].
Evaluation of the potential impact of additional greenery on ground-level ozone in Kansas City, USA, concluded that the ozone concentration may decrease in the downtown area up to 2.0 ppbv (PARTS PER BILLION BY VOLUME) during the daytime [84]. This happens as the higher vegetation fraction increases dry deposition and decreases the ambient temperature, resulting in slower rates of the relevant chemical reactions. Much higher reductions of the ozone concentration, up to 5.2 ppbv, are calculated during the night, mainly because of the titration phenomena associated with the increased NOx concentration caused by the significant reduction of the PBLH. Increase of the ozone concentration was also calculated for some areas of the city and some parts of the overall calculation domain.
The potential impact of increased greenery cover, from 20% to 40%, on the concentration of ground-level ozone in North-Western cities of USA, and in particular from Washington DC to central Massachusetts, was investigated in References [55,56]. Simulations were performed using the Colorado State University Mesoscale Model (CSUMM) and Urban Airshed Model (UAM-IV). Calculations demonstrated a decrease of the average daytime ozone concentration close to 1 ppb, or 2.4%, and a peak decrease close to 2.4 ppb, or 4.1%. In parallel, some domains of the model calculated an increase of the average ozone concentration of up to 0.26 ppb. During the night, the ozone concentration was found to increase because of the higher deposition of NOx and reduced wind speeds. During the day, it was calculated that both the concentration of NOx and BVOCs increased, while the height of the PBL decreased slightly following the variation of the ambient temperature and wind speeds. Despite the increase of BVOCs caused by the higher tree cover, the increase of deposition as well as the slower chemical reactions and the higher NOx concentrations contributed to lower the ozone concentration.
The OZIPM4 Computer Program was used to calculate the impact of tree losses in Atlanta, GA, USA, by 20% [85]. It found that decreased tree cover in the city may slightly raise the ozone concentration.
Two scenarios considering an increase of the tree cover by 10% and 30% were investigated for the city of New York, USA. Simulations were performed using the MMA mesoscale climatic model [86]. A slight decrease of the average ozone concentration, up to 4 ppb, was calculated for both the moderate and high greenery scenarios, while in several parts of the computational domain, the ozone concentration slightly increased. Given that the average benefits are similar for both the moderate and high scenarios, the authors concluded that an increase of tree cover above 10% may not offer additional benefits if the criteria are limited to the 1 h ozone maximum values.
The impact of increased tree cover on the ozone concentration in California’s South Coast Air Basin, USA, was investigated in Reference [89]. Two scenarios considering an increase of the tree cover by 6% and 12% were studied. Simulations were performed using the Colorado State University Mesoscale Model (CSUMM) and the Urban Airshed Model (UAM). It was calculated that increase of tree cover contributes to a net reduction of ozone concentration up to 30 ppb, provided that the new trees are low emitters of biogenic hydrocarbons. On average, the domain-wide population-weighted exceedance exposure to ozone above the threshold of the California standard decreased by up to 14% during the afternoon hours. While most of the simulated areas presented a decrease of ozone concentration, several domains exhibited a rise of ozone concentration of up to 20 ppb. Simulations also showed that when moderate and high emission trees are considered, the ozone concentration increases considerably because of the higher BVOC emissions.
Analysis of the considered studies leads to the following conclusions:
- (a)
- The chemistry and atmospheric dynamics determining the concentration of ground-level ozone is complex and the relationship between increased tree cover and ozone concentration is not simple. Ozone is generated as a result of photolysis of NO2 when VOCs are present [85]. More urban green infrastructure increases the emission of BVOCs to the atmosphere. In parallel, it results in a higher dry deposition and absorption of ozone and NOx and lower ambient temperatures that decrease the emission rate of BVOCs and slow the photochemical reactions. Lower surface temperature usually decreases the height of the PBL, blocking pollutants in the lower atmosphere like NOx that may result in decreased ozone concentrations because of titration processes. However, an analysis carried out for Montreal, Canada, found that the decrease of the PBLH caused a negligible decrease of the ozone concentration [107]. More tree cover may result in a decrease of the wind speed in the lower atmosphere and a reduced removal of ozone.
- (b)
- The magnitude of the dry deposition of ground-level ozone considerably affects its balance in the atmosphere [15]. It is estimated that during 2010, urban trees removed almost 523 kilotonnes/year of ozone in 55 US cities [108] and 12.87 kilotonnes/year in 87 cities in Canada [109]. The standardised removal rates of ozone can be as high as 0.4 g/m2/y/ppb [15], while the mean annual reduction of the ozone hourly concentration varies from 0.1% to 1.5% [15]. In parallel, trees absorb ozone and assimilate NOx. Their assimilation capacity differs up to a factor of 122 between different species [110,111]. Although important models have been developed to assess the removal capacity of trees, there is considerable uncertainty regarding the reported values [15].
- (c)
- The chemistry between NOx and O3 is quite complex and depends on their relative concentrations. High concentration of NOx, mainly generated from motor traffic, react with O3, converting it to O2, decreasing its concentration through a titration effect. This is a potential source of uncertainties resulting in significantly contrasting results reported from experimental studies. Measurements carried out in parks and green zones found a low concentration of NOx and a high or equal concentration of ozone compared to adjacent non-vegetated zones, while in some experiments, lower ozone concentrations were observed in green areas only after rainfall [81,112,113,114,115]. Contrary to the above studies, measurements performed in Baltimore, MD, USA, did not find substantial differences in NOx concentration in green and adjacent open residential spaces, while the concentration of ozone was considerably lower in the green zones [116]. Similar conclusions were drawn in Reference [117], reporting measurements in Spain. As concluded in Reference [118], urban parks and forests do not significantly affect the concentration of NOx, and a potential decrease of the ozone concentration may be the result of the increased absorption by the trees and also of the reduced surface temperature and solar radiation in parks that slows down the photochemical reactions. Differences of NOx concentration between green and non-green zones may result because of the proximity to high-traffic areas.
- (d)
- Chemical reactions associated with the titration of ozone are less temperature-sensitive than photochemical reactions generating the atmospheric ozone. According to Reference [55], titration is the dominant mechanism depleting ozone at the ground level, while at the upper levels of the atmosphere, ozone is created through photochemical reactions, and then is transferred to the ground level because of the vertical diffusion. It was observed that high vertical diffusion values correspond to days with the highest ozone concentration.
- (e)
- Almost all studies concluded that increased urban tree cover results in a net decrease of the ozone concentration, however several urban zones may exhibit an increase. Most of the studies investigating the balance of ozone uptake and formation concluded that urban trees generally contribute to decrease the concentration of ground-level ozone [112,118]. However, numerous experimental studies have not found reduced ozone concentration in tree canopies compared to adjacent non-vegetated open zones [115,119].
- (f)
- The rate of BVOC emissions from the additional trees seems to be the determinant factor regulating the atmospheric concentration of ozone. Low emitters, emitting under 2 µg/g/h of isoprene and 1 µg/g/h of monoterpenes, may result in a net decrease of the atmospheric ozone [89]. On the contrary, moderately or highly emitting trees may result in increased ozone concentrations.
5. The Impact of Increased Green Infrastructure on Health
5.1. Introduction and Identity of the Studies
Green infrastructure in the built environment supports human health mainly through urban temperature mitigation and modulation of heatwaves, decrease of pollutants and air quality improvements, aesthetic and psychological benefits, provision of spaces for social interaction and social activity [120].
There is an increasing number of studies aiming to evaluate the relationship between green infrastructure in the built environment and health [121,122,123,124]. Systematic reviews of numerous relevant articles concluded that natural environments have a positive impact on wellbeing, while there is a significant positive association between the characteristics of the green spaces around residences with perceived general and mental health [124,125].
In addition, several studies have investigated the impact of green infrastructure on mortality, morbidity and life expectancy [123,126,127,128,129]. According to Reference [122], there are four mechanisms explaining the beneficial effects of green infrastructure on mortality and life expectancy:
- (a)
- The natural outdoor environment influences health and wellbeing through viewing and observing green outdoor spaces.
- (b)
- Greener spaces are associated with lower pollution levels and reduced temperature in healthier environments that affect the human immune system.
- (c)
- Natural and green outdoor spaces offer higher opportunities to perform physical activity.
- (d)
- Natural and green outdoor spaces offer higher opportunities for social interactions.
Although the existing studies assessing the impact of green infrastructure on human mortality are based on different assumptions, assessment methodologies and the reported results are heterogenous. Systematic reviews and meta-analyses have shown that a higher proportion of residential green is associated with reduced risk of mortality from cardiovascular disease, while no impact of GI on lung cancer was found [122]. Conflicting conclusions are reported about the potential impact of green infrastructure on all-cause mortality. According to a meta-analysis of 10 relative studies, there is limited evidence of an association between reduction of all-cause mortality and residential green spaces. A second systematic review analysing six relevant articles concluded that there is limited or suggestive evidence of higher mortality risk in less green areas [130]. A third systematic review assessing five relevant papers concluded that there is strong evidence that residential greenness reduces all-cause mortality, while an analysis of the impact of neighbourhood-level factors on heat-related mortality in London, UK, concluded that the odds of mortality increase significantly in urban areas with less greenery cover [124,131]. Similar results are reported for Seoul, Korea [132].
The impact of greenery on air quality and its association with mortality and morbidity in the United States was assessed in References [133,134]. It was reported that the removal of particulate matter from trees was directly linked to health benefits and in particular, reduced mortality and morbidity, as well as reduced respiratory symptoms. It was estimated that the health benefits per hectare values are close to US$1600, while in Portland, Oregon, lower pollution levels caused by urban greenery considerably decreases respiratory problems, offering a total financial benefit of close to US$7 million/year. It was reported that one percent improvement of air quality caused by greenery may save 850 deaths per year and about 670,000 incidences of acute respiratory problems. Other similar studies have reported that urban forests in Rome decrease the concentration of ozone by 3% and contribute to save 4 deaths per year [135]. In Madrid, Spain, it was estimated that a peri-urban park contributes to decrease the concentration of ozone up to 10 μg/m3, decreasing the relative risk of mortality by 0.9%, corresponding to about one premature death per year [136]. In London, UK, it was calculated that a greenspace of 1 × 10 km in Eastern London, contributes to remove 90.4 tonnes/y of PM10, decreasing mortality and hospital admissions by 2 deaths per year [137]. A study focussing on the impact of pollutant removal by woodlands on heat-related morbidity and mortality in Britain has employed existing assessments on the capacity of trees to remove atmospheric pollutants like particulate matter, ozone and SO2, and also identified correlations between morbidity levels and pollutant concentrations [138]. It was estimated that in Britain, woodland contributes to avoid between 4 to 6 hospital admissions and 5–7 deaths per year. Finally, a study in Melbourne, Australia, found that the odds of hospital admissions for heart disease or stroke were 37% lower among adults living in neighbourhoods with the highest tertiles of greenery compared to those living in the lowest tertiles [139].
5.2. Impact of Increased Green Infrastructure on Heat-Related Mortality
There are five studies assessing the impact of a potential increase or decrease of urban green infrastructure on heat-related mortality [58,59,64,65,140]. The impact of additional tree cover on health was assessed in terms of the potential temperature decrease, while the impact on air quality was not considered. The studies present 13 different scenarios for seven cities: New Orleans, Dallas, Philadelphia and Detroit, USA, and Melbourne, Parramatta and Darwin, Australia. The studies for New Orleans, Detroit and Philadelphia focus on the impact of increased tree cover during specific heatwaves, while the rest of the studies concentrate on the whole summer period. All studies assessed the potential decrease of the ambient temperature caused by the increased or decreased tree covering using microscale (Darwin) and mesoscale climatic modelling (all the rest). The accuracy of the mesoscale modelling highly depends on the exact description of the land use in the selected place, the size of the grid, the assumed boundary and initial conditions, the characteristics and accuracy of the sub-models used and the validation against existing climatic data in the area. Table 1 provides information on the type of mesoscale model used and the size of the considered grid. As shown, newer studies used a finer grid up to 500 × 500 m, while past studies were based on coarser grid sizes up to 2 × 2 km. All studies were validated against existing climatic data.
At a second phase, correlations between historical data of heat-related mortality and climatic parameters were used to assess the potential increase/decrease of mortality. Correlations excluded deaths not related to heat, while assessments were adjusted to consider demographic changes. The excess or anomalous daily mortality was then assessed as the difference against the expected mortality. Two different methods to calculate the excess mortality were used. For all the American cities, the mortality levels were evaluated during the oppressive hot and very hot synoptic conditions, and empirical correlations between the excess mortality and climatic parameters were obtained for each type of synoptic conditions [141]. The second method used in all Australian cities was based on global correlations between the excess heat-related mortality and the climatic conditions during the whole summer period. In both cases, the same empirical relations were used to assess mortality before and after the increase or decrease of the tree cover in each city.
All studies provided data on the potential decrease of the maximum or mean daily temperature as well as information on the mortality levels before and after the potential change of the tree cover in the cities. The results follow a relatively similar format and comparisons are possible.
Analysis of the 13 cases shows that increase of tree cover in cities may contribute to reduce the levels of heat-related mortality (HRM) between 1.5% and 49% (Supplementary Tables S1 and S6). The lowest decrease of HRM is observed in the city of Detroit, USA, and the maximum in Parramatta, Australia. A quite strong linear correlation is observed between the calculated decrease of the maximum daily temperature at 15:00 and the percentage of HRM decrease (Figure 6). On average, it is observed that decrease of the maximum ambient temperature by 1 °C reduces the HRM by about 30.5%, as in the following relation:
where DTmax is the decrease of the maximum daily temperature. The correlation is statistically significant, p = 2.9 × 10⁻⁷ and R2 = 0.896. Sensitivity analyses excluding one study at a time showed similar results, while the slope of the curve varied between 27.0 and 31.1. The statistical characteristics of Equation (6) are given in Supplementary Table S6.
Percentage Decrease of HRM = 39.45 × DTmax
Previous research has found that socioeconomic and demographic parameters, like urban poverty and the size of the city, significantly affect the levels of heat-related mortality [142,143]. The possible association of the percentage decrease of the heat-related mortality caused by the increase of the GI was shown in Figure 6. A city with local poverty rates and population size was investigated, however, the association was not found to be strong or statistically significant.
While it is evident that there is a positive association between increased tree cover and mortality, several issues need to be considered to quantify in a more precise way the benefits in terms of mortality and morbidity.
- (a)
- New green infrastructure in cities needs several years to grow and contribute substantially to lower urban temperatures and heat-related mortality and morbidity. According to the greening plans developed for several cities, the growing period may exceed 20 or even 30 years [140]. It is reasonable to consider that the future demographic and socioeconomic conditions will change considerably compared to the past and current times. Additionally, human technological and physiological adaptation may alter the existing relationship between the ambient temperature and heat-related mortality and morbidity [144,145]. Thus, the use of correlations between the ambient conditions and the heat-related mortality and morbidity based on past health data induces a very significant uncertainty regarding future health assessments. It is of considerable interest that new assessment studies should investigate and integrate the issues of altered socioeconomic, demographic and adaptation conditions in the global models.
- (b)
- It is well-documented that the frequency of heatwaves and extreme summer weather events is increasing constantly [146]. In parallel, heatwaves have a synergetic effect with the urban heat island, further increasing urban temperatures and drought conditions [147,148]. Recent research has shown that during extreme or high summer ambient temperatures, the cooling potential of trees is seriously reduced or even minimised [41,149]. During excessive temperature and drought conditions, trees may close their stomata while the surface temperature of leaves increases, contributing more sensible heat to the atmosphere and increasing the ambient temperature [150,151]. Incorporation of the new stomata model of trees into global climate models has shown that the maximum ambient temperature during heatwaves may increase up to 5 °C, on top of the temperature increase caused by the increase of greenhouse gases [152]. The specific predictions highly exceed previous assessments on the potential contribution of greenery during extreme heat events [153,154]. Given the high growth period of new trees and the expected increase of the ambient temperatures, the existing relations between additional tree cover and ambient temperature may be seriously modified, altering the capacity of urban greenery to reduce heat-related mortality and morbidity. The development of new genetically modified tree species resistant to higher temperatures may offer additional cooling opportunities [155].
- (c)
- Increased tree cover affects the concentration of harmful pollutants like O3, NOx, VOCs and particulate matter, while numerous studies have documented the impact of pollution levels on human health [108,109,156,157]. Existing studies evaluate the potential impact of additional green infrastructure on mortality and morbidity in terms of temperature or pollution decrease caused by the urban trees. However, it is evident that there is a synergetic impact that may enhance the magnitude of the potential benefits to health. It is characteristic that high ozone concentrations are usually observed during extreme heat events [157]. To our knowledge, no studies are available considering both the temperature and pollution variation in a synergetic way.
- (d)
- Increase of urban greenery may affect the concentration of some pollutants in a negative way, like ground-level ozone, which could be detrimental to health [158]. It is characteristic that more than 21,000 premature deaths have been reported in the EU countries because of the increased ozone concentrations [159]. No studies are available on the potential negative impact of additional urban greenery on health, and although the impact may not be particularly high, it is important to be considered and analysed.
5.3. Impact of Green Infrastructure on Heat-Related Morbidity
There is a substantial lack of information on the impact of greenery on heat-related morbidity. Very few studies have investigated the impact of increasing green infrastructure on heat-related morbidity [64,65,160,161]. These studies assessed the impact of the ambient temperature reduction caused by urban green infrastructure on heat-related morbidity. The characteristics and the main results of the five considered scenarios are summarised in Table 1. All studies concluded that existing greenery and potential additional tree cover contribute towards a substantial decrease of heat-related morbidity. However, the research question, as well as the methodology followed by the studies and the format of the reported results, are completely different, are not compatible and cannot be compared.
An analysis of the potential increase of the green infrastructure in Phoenix, Arizona, USA, by 5%, 10%, 15% and 20%, on ambient temperature and heat-related mortality, is presented in Reference [160]. A zero-dimensional energy balance model was used to simulate the distribution of the climatic parameters in the city for the period 2002–2006. It was calculated that when the 30.4% baseline fraction of vegetated area increases by 5%, 10%, 15% and 20%, the average 24 h temperature decreases by 1.7%, 3.6%, 5.4% and 7.2%. Unfortunately, the absolute decrease of the ambient temperature is not reported. Data on emergency calls were collected for the same period and correlations between the emergency calls and the ambient temperature and a heat index were developed. Based on these models, it was estimated that the number of heat-related emergency calls may decrease by 17%, 35%, 53% and 70%, when the fraction of the vegetation in the city increases by 5%, 10%, 15% and 20%, respectively.
The impact of urban greenery on the morbidity levels in Oslo, Norway, was analysed in Reference [161]. The ambient temperature distribution in the city during the summer of 2018 was derived using satellite-measured surface temperature data correlated against the corresponding ambient air temperature. The potential impact of high ambient temperatures on the morbidity levels of the population over 75 years old was investigated and no relation between temperature and morbidity was found except for skin-related problems. Analysis of the combined land use, ambient temperature and skin-related morbidity data, concluded that the threshold of health risk may increase from 23% to 29% in all neighbourhoods of Oslo exceeding 30 °C, in a situation where trees are replaced by the most common non-tree cover. In the case of a non-tree covered city, it was calculated that the potential heat risk exposure rises to about one day for one elderly person per removed tree.
The study reported in Reference [65] analysed and evaluated the impact of overheating as well as of increased tree cover in the tropical city of Darwin, Australia. Analysis of the existing morbidity data revealed that hospital admissions increased by 7% for every 1 °C increase of the daily maximum temperature above 27 °C. The study used microscale modelling methods and found that a possible increase of the greenery by 20% can decrease the peak ambient temperature by 0.5 °C. Using correlations between the ambient temperature and peak daily temperature, it is found that additional tree covering reduces the annual excess hospital admissions of 40.1 to 27.5 per 100,000 population.
The study reported in Reference [64] evaluated the impact of 2 million additional trees on heat-related morbidity for the city of Parramatta and the Greater Sydney area in Australia. Using epidemiological data, it was estimated that increase of the daily maximum temperature by 1 °C, increases the heat-related hospital admissions by 1.1%, while it reaches 4.6% for the days with maximum temperature above 27 °C. Using mesoscale simulations, it was found that the addition of 2 million new trees in the area may decrease the peak ambient temperature by 1 °C. Correlations between the ambient temperature and the excess heat-related morbidity showed that when 2 million trees are added, the daily excess HR morbidity decreases from 3.66 hospital admissions per day to about 2.6 hospital admissions per day and 100,000 population.
6. Conclusions
To counterbalance the continuous increase of the amplitude of urban overheating as well as of the frequency and magnitude of heatwaves, efficient urban mitigation and adaptation policies involving natural and man-made cooling technologies have to be developed and implemented.
Vegetation, and in particular, trees, offer undeniable benefits to the urban climate and urban wellbeing. Among many other benefits, they contribute to decrease ambient temperatures, reduce the concentration of harmful pollutants and limit heat-related mortality and morbidity. There is an enormous literature of experimental and theoretical studies on the potential impact of urban vegetation on urban temperature, thermal comfort, pollution control and health. Although most of the studies conclude that urban greenery offers numerous benefits, very little is known about the holistic and global contribution of urban greenery on urban climate, environmental quality and health, the possible synergies and trade-offs, while the potential problems arising from the deployment of additional greenery in cities is usually overlooked or neglected.
Existing literature provides a plethora of data and information. However, because of a serious heterogeneity in the research question asked, and the methodology followed by each study, the spectrum of the provided answers, results and conclusions is very wide, while in some cases, it is conflicting even for the same city. Thus, it is a serious source of misconceptions leading to an inappropriate sizing and establishment of tree cover in cities, potentially aggravating urban climatic, environmental and health problems.
Analysis of almost all known relevant studies performed by the present study has shown that there is an acceptable correlation between additional tree cover and the temperature drop during the peak day period and at night. The average maximum drop of the peak daily temperature may not exceed 1.8 °C, when the tree fraction reaches its maximum, while the average night-time maximum mitigation potential is much higher and close to 2.3 °C. Given the serious spatial limitations in cities, a potential increase of the tree cover by 20% may initiate a temperature decrease close to 0.3 and 0.5 °C during the daytime and night-time, respectively. The local landscape and climate conditions highly affect the potential temperature drop in a city; however, the order of magnitude of the temperature drop remains close to the previously mentioned levels. Given that most of the cooling demand is during the peak daytime period, the shift of the maximum mitigation potential of trees during the night reduces the expected cooling contribution. Potential problems of night warming and serious increase of humidity levels reported by numerous studies should not be neglected, especially when additional trees are deployed in urban canyons, reducing the sky view factor, and when additional GI is planned in humid climates.
Although the available computational tools, and in particular the mesoscale and microscale climatic prediction models, have evolved significantly, there is a high uncertainty regarding the simulation assumptions and accuracy around the coupling and evaluation of the specific land conditions in cities. Further developments are necessary to improve the description of the specific energy flows in cities, improve spatial resolutions and improve accuracy.
Additionally, for the generation of lower ambient temperatures, urban trees contribute to seriously decrease the concentration of several harmful pollutants but may increase the concentration of some others, like ground-level ozone, because of the released BVOC emissions. Although there are some available studies quantifying the impact of urban trees on heat-related mortality because of the pollutant decrease, the synergetic impact of the temperature drops and pollution control is not yet adequately evaluated and quantified. Future studies should concentrate on the holistic impact of urban greenery on heat-related mortality, also considering the potential negative impact caused by the considerable increase in the concentration of ground-level ozone.
Urban vegetation is the source of serious dynamic chemical changes in the lower atmosphere and affects the concentration of pollutants both in a positive and negative way. It decreases their concentration by accumulating and absorbing pollutants, while it emits very reactive biogenic VOCs that may raise the concentration of ground ozone and decrease the PBLH, resulting in a potential rise of NOx and particulate matter. Existing studies evaluating the impact of additional urban greenery on the concentration of particles provide conflicting findings. Although the absorption and deposition of particles seems to considerably reduce their concentration in many cities, the potential increase of the PBLH caused by the temperature drop is found to raise the concentration in other cities. The potential positive or negative impact of urban greenery on urban particulate matter concentration depends on the specific climatic and landscape parameters in the considered area. However, as most of the reported data are from simulation studies, the considered assumptions as well as the accuracy of the used tools highly determine the final results and conclusions. It is evident that more precise experimental studies are necessary to improve knowledge in this field.
The impact of increased urban greenery on ground-level ozone is the result of complex chemistry and atmospheric dynamics. Higher vegetation fractions increase the emission of BVOCs and the corresponding potential risk for ozone creation. On the other hand, additional greenery increases the deposition and the absorption of ozone and NOx, while because of the temperature decrease, the emission of BVOC is reduced, the speed of the photochemical processes is slowed down and titration processes are more effective, contributing to a decrease of the ozone concentration. While most of the existing theoretical studies conclude that in general, additional greenery in cities contributes to decrease the concentration of ground-level ozone (although with some parts of the cities exhibiting a substantial increase), the conclusions are not always confirmed and validated by existing field measurements. The rate of BVOC emission of the trees seems to determine the local concentration of the pollutants, with moderately or highly emitting vegetation resulting in a considerable increase of the ozone concentration. It is evident that additional experimental studies should be carried out to better understand the impact of urban greenery on ozone levels.
Additional trees in cities considerably decrease the levels of heat-related mortality and morbidity. Analysis of all the available studies has shown that there is a statistically significant correlation between the maximum daily temperature drop caused by greenery and the percentage decrease of the heat-related mortality. On average, it is found that when the peak daily temperature decreases by 0.1 °C, then the percentage of heat-related mortality drops on average by 2.94%. Very few studies are available on the impact of additional urban greenery on heat-related morbidity and solid conclusions cannot be drawn. There is an important need for such studies and statistical data.
It is important to acknowledge that the methodologies employed to estimate the impact of lower ambient temperatures on HRM caused by an increase of the urban GI are of a static nature. Given that the trees need 20 to 30 years to fully mature, and also the continuous engineering and physiological adaptation of humans to higher temperatures, dynamic prediction algorithms are necessary to estimate the potential impact of additional greenery on health. In parallel, estimations have to be performed considering the future climatic conditions and possibly the availability of more heat-tolerating tree species.
Increase of the vegetation fraction in cities offers serious benefits to the urban climate, pollution control and health. It is also associated with adverse phenomena that may affect air quality in cities. Successful deployment of additional greenery in cities requires a full knowledge of the phenomena and complete assessment of the potential benefits and drawbacks performed using advanced and detailed tools. In parallel, scientific knowledge should considerably improve, mainly through detailed and precise experimental studies.
Supplementary Materials
The following are available online at https://www.mdpi.com/2075-5309/10/12/233/s1, Figure S1: Map of the world with cities considered in the study, Table S1: Statistical parameters of Equation (1), Table S2: Statistical characteristics of Equation (2), Table S3: Statistical Characteristics of Equation (3), Table S4: Statistical Characteristics of Equation (4), Table S5: Statistical Characteristics of Equation (6), Table S6: Maximum Daytime Decrease of the Temperature and corresponding percenage of Heat Related Mortality.
Author Contributions
M.S. has collected the material and performed the analysis. P.O. proposed conclusions and review ctitically the whole analysis and the global conclusions. The authors have equally contributed to the preparation of the paper. All authors have read and agreed to the published version of the manuscript.
Funding
This research received no external funding.
Conflicts of Interest
The authors declare no conflict of interest.
References
- World Bank—World Development Indicators. 2018. Available online: http://data.worldbank.org/data-catalog/world-development-indicators (accessed on 14 September 2020).
- Santamouris, M. Analyzing the heat island magnitude and characteristics in one hundred Asian and Australian cities and regions. Sci. Total Environ. 2015, 512–513, 582–598. [Google Scholar] [CrossRef] [PubMed]
- Santamouris, M. Regulating the damaged thermostat of the Cities—Status, impacts and mitigation strategies, energy and buildings. Energy Build. 2015, 91, 43–56. [Google Scholar] [CrossRef]
- Founta, D.; Santamouris, M. Synergies between urban heat island and heat waves in Athens [Greece], during an extremely hot summer. Sci. Rep. Nat. 2017, 7, 10973. [Google Scholar] [CrossRef] [PubMed] [Green Version]
- Santamouris, M. Recent progress on urban overheating and heat island research. Integrated assessment of the energy, environmental, vulnerability and health impact synergies with the global climate change. Energy Build. 2020, 207, 109482. [Google Scholar] [CrossRef]
- Santamouris, M.; Cartalis, C.; Synnefa, A.; Kolokotsa, D. On the impact of urban heat island and global warming on the power demand and electricity consumption of buildings—A review. Energy Build. 2015, 98, 119–124. [Google Scholar] [CrossRef]
- Santamouris, M. On the energy impact of urban heat island and global warming on buildings. Energy Build. 2014, 82, 100–113. [Google Scholar] [CrossRef]
- Johnson, H.; Kovats, R.S.; McGregor, G.; Stedman, J.; Gibbs, M.; Walton, H.; Cook, L.; Black, E. The impact of the 2003 heat wave on mortality and hospital admissions in England. Health Stat. Q. 2005, 25, 6–11. [Google Scholar] [CrossRef] [Green Version]
- Ho, H.C.; Knudby, A.; Walker, B.B.; Henderson, S.B. Delineation of spatial variability in the temperature-mortality relationship on extremely hot days in greater Vancouver, Canada. Environ. Health Perspect. 2017, 125, 66–75. [Google Scholar] [CrossRef] [Green Version]
- Schinasi, L.H.; Benmarhnia, T.; De Roos, A.J. Modification of the association between high ambient temperature and health by urban microclimate indicators: A systematic review and meta-analysis. Environ. Res. 2018, 161, 168–180. [Google Scholar] [CrossRef]
- Vos, T.; Barber, R.M.; Bell, B.; Bertozzi-Villa, A.; Biryukov, S.; Bolliger, I.; Charlson, F.; Davis, A.; Degenhardt, L.; Dicker, D.; et al. Global, regional, and national incidence, prevalence, and years lived with disability for 301 acute and chronic diseases and injuries in 188 countries, 1990–2013: A systematic analysis for the Global burden of disease study 2013. Lancet 2015, 386, 743–800. [Google Scholar] [CrossRef] [Green Version]
- Van den Bosch, M.; Sang, Å.O. Urban natural environments as nature-based solutions for improved public health—A systematic review of reviews. Environ. Res. 2017, 158, 373–384. [Google Scholar] [CrossRef] [PubMed]
- Li, W.L.; Wan, L.C. Air quality influences by urban heat island coupled with synoptic weather patterns. Sci. Total Environ. 2009, 407, 2724–2732. [Google Scholar] [CrossRef] [PubMed]
- Meier, P.; Holloway, T.; Jonathan, P.; Harke, M.; Ahl, D.; Abel, D.; Schuetter, S.; Hackel, S. Impact of warmer weather on electricity sector emissions due to building energy use. Environ. Res. Lett. 2017, 12, 064014. [Google Scholar] [CrossRef]
- Sicard, P.; Agathokleous, E.; Araminiene, V.; Carrari, E.; Hoshika, Y.; De Marco, A.; Paoletti, E. Should we see urban trees as effective solutions to reduce increasing ozone levels in cities?*. Environ. Pollut. 2018, 243, e163–e176. [Google Scholar] [CrossRef] [PubMed]
- World Health Organization. WHO’s Urban Ambient Air Pollution Database—Update 2016; Public Health, Social and Environmental Determinants of Health Department: Geneva, Switzerland, 2016. [Google Scholar]
- Malley, C.S.; Henze, D.K.; Kuylenstierna, J.C.I.; Vallack, H.W.; Davila, Y.; Anenberg, S.C.; Turner, M.C.; Ashmore, M.R. Updated global estimates of respiratory mortality in adults 30 Years of age attributable to long-term ozone exposure. Environ. Health Perspect. 2017. [Google Scholar] [CrossRef] [PubMed] [Green Version]
- Wang, Y.; Shen, L.; Wu, S.; Mickley, L.; He, J.; Hao, J. Sensitivity of surface ozone over China to 2000–2050 global changes of climate and emissions. Atmos. Environ. 2013, 75, 374–382. [Google Scholar] [CrossRef]
- Stathopoulou, E.; Mihalakakou, G.; Santamouris, M.; Bagiorgas, H.S. Impact of temperature on tropospheric ozone concentration levels in urban environments. J. Earth Syst. Sci. 2008, 117, 227–236. [Google Scholar] [CrossRef]
- Pyrgou, A.; Hadjinicolaou, P.; Santamouris, M. Enhanced near-surface ozone under heatwave conditions in a Mediterranean island. Sci. Rep. 2018, 8, 9191. [Google Scholar] [CrossRef] [Green Version]
- Diem, J.E.; Stauber, C.E.; Rothenberg, R. Heat in the southeastern United States: Characteristics, trends, and potential health impact. PLoS ONE 2017, 12, e0177937. [Google Scholar] [CrossRef]
- Zhang, G.; Rao, S.T.; Daggupaty, S.M. Meteorological processes and ozone exceedances in the Northeastern United States during the 12–16 July 1995 episode. J. Appl. Meteorol. 1998, 37, 776–789. [Google Scholar] [CrossRef]
- Ooka, R.; Khiem, M.; Hayami, H.; Yoshikado, H.; Huang, H.; Kawamoto, Y. Influence of meteorological conditions on summer ozone levels in the central Kanto area of Japan. Procedia Environ. Sci. 2011, 4, 138–150. [Google Scholar] [CrossRef] [Green Version]
- Mika, J.; Forgo, P.; Lakatos, L.; Olah, A.B.; Rapi, S.; Utasi, Z. Impact of 1.5 K global warming on urban air pollution and heat island with outlook on human health effects. Curr. Opin. Environ. Sustain. 2018, 30, 151–159. [Google Scholar] [CrossRef]
- IPCC. Intergovernmental panel on climate change: Summary for policy- makers. Climate Change 2014: Impacts, Adaptation and Vulnerability. In Contribution of Working Group II to the Fifth Assessment Report of the Inter- governmental Panel on Climate Change; Cambridge University Press: Cambridge, UK, 2014. [Google Scholar]
- Jacob, D.J.; Darrell, A. Winner: Effect of climate change on air quality. Atmos. Environ. 2009, 43, 51–63. [Google Scholar] [CrossRef] [Green Version]
- Wise, E.K. Climate-based sensitivity of air quality to climate change scenarios for the southwestern United States. Int. J. Clim. 2009, 29, 87–97. [Google Scholar] [CrossRef]
- McMichael, A.J. Population health: A fundamental marker of sustainable development. In Routledge International Handbook of Sustainable Development; Redclift, M.S.D., Ed.; Taylor and Francis Inc.: Oxford, UK, 2015. [Google Scholar]
- Akbari, H.; Cartalis, C.; Kolokotsa, D.; Muscio, A.; Pisello, A.L.; Rossi, F.; Santamouris, M.; Synnefa, A.; Wong, N.H.; Zinzi, M. Local climate change and urban heat island mitigation techniques—The state of the art. J. Civil Eng. Manag. 2016, 22, 1–16. [Google Scholar] [CrossRef] [Green Version]
- Gao, K.; Santamouris, M. On the cooling potential of irrigation to mitigate urban heat island. Sci. Total Environ. 2020, 740, 139754. [Google Scholar] [CrossRef]
- Santamouris, M.; YoungYun, G. Recent development and research priorities on cool and super cool materials to mitigate urban heat island. Renew. Energy 2020, 161, 792–807. [Google Scholar] [CrossRef]
- Santamouris, M.; Synnefa, A.; Karlessi, T. Using advanced cool materials in the urban built environment to mitigate heat islands and improve thermal comfort conditions. Sol. Energy 2011, 85, 3085–3102. [Google Scholar] [CrossRef]
- Santamouris, M. Cooling the Cities—A Review of reflective and green roof mitigation technologies to fight heat island and improve comfort in urban environments. Sol. Energy 2014, 103, 682–703. [Google Scholar] [CrossRef]
- Santamouris, M.; Ding, L.; Fiorito, F.; Oldfield, P.; Osmond, P.; Paolini, R.; Prasad, D.; Synnefa, A. Passive and active cooling for the outdoor built environment—Analysis and assessment of the cooling potential of mitigation technologies using performance data from 220 large scale projects. Solar Energy 2017, 154, 14–33. [Google Scholar] [CrossRef]
- Haddad, S.; Paolini, R.; Ulpiani, G.; Synnefa, A.; Hatvani-Kovacs, G.; Garshasbi, S.; Fox, J.; Vasilakopoulou, K.; Neild, L.; Santamouris, M. Holistic approach towards urban sustainability: Co-benefits of urban heat mitigation in a hot humid region of Australia. Sci. Rep. 2020, 10, 14216. [Google Scholar] [CrossRef] [PubMed]
- Santamouris, M.; Paolini, R.; Haddad, S.; Synnefa, A.; Garshasbi, S.; Hatvani-Kovacs, G.; Gobakis, S.; Yenneti, K.; Vasilakopoulou, J.; Feng, K.G. Heat Mitigation Technologies can improve sustainability in Cities. An holistic experimental and numerical impact assessment of urban overheating and related heat mitigation strategies on energy consumption indoor comfort vulnerability and heat related mortality and morbidity in cities. Energy Build. 2020, 217, 110002. [Google Scholar]
- European Environmental Agency [EEA]. Green Infrastructure and Territorial Cohesion; European Environmental Agency [EEA]: Copenhagen, Denmark, 2011. [Google Scholar]
- Connop, S.; Vandergert, P.; Eisenberg, B.; Collier, M.J.; Nash, C.; Clough, J.; Newport, D. Renaturing cities using a regionally-focused biodiversity-led multifunctional benefits approach to urban green infrastructure. Environ. Sci. Pol. 2016, 62, 99–111. [Google Scholar] [CrossRef] [Green Version]
- Davies, H.J.; Doick, K.J.; Hudson, M.D.; Schreckenberg, K. Challenges for tree officers to enhance the provision of regulating ecosystem services from urban forests. Environ. Res. 2017, 156, 97–107. [Google Scholar] [CrossRef] [Green Version]
- Jayasooriya, V.M.; Ng, A.W.M.; Muthukumaran, S.; Perera, B.J.C. Green infra- structure practices for improvement of urban air quality. Urban For. Urban Green. 2017, 21, 34–47. [Google Scholar] [CrossRef]
- Santamouris, M.; Ban-Weiss, G.; Cartalis, C.; Crank, C.; Kolokotsa, D.; Morakinyo, T.E.; Muscio, A.; Ng, E.; Osmond, P.; Paolini, R.; et al. Progress in urban greenery mitigation science—Assessment methodologies advanced technologies and impact on cities. J. Civ. Eng. Manag. 2018, 24, 638–671. [Google Scholar] [CrossRef] [Green Version]
- Selmi, W.; Weber, C.; Rivie’re, E.; Blond, N.; Mehdi, L.; Nowak, D.J. Air pollution removal by trees in public green spaces in Strasbourg city, France. Urban For. Urban Green. 2016, 17, 192e201. [Google Scholar] [CrossRef] [Green Version]
- Anav, A.; De Marco, A.; Proietti, C.; Alessandri, A.; Dell’Aquila, A.; Cionni, I.; Friedlingstein, P.; Khvorostyanov, D.; Menut, L.; Paoletti, E.; et al. Comparing concentration-based [AOT40] and stomatal uptake [PODY] metrics for ozone risk assessment to European forests. Glob. Chang. Biol. 2016, 22, 1608–1627. [Google Scholar] [CrossRef]
- Pataki, D.E.; Carreiro, M.M.; Cherrier, J.; Grulke, N.E.; Jennings, V.; Pincetl, S.; Pouyat, R.V.; Whitlow, T.H.; Zipperer, W.C. Coupling biogeochemical cycles in urban environments: Ecosystem services, green solutions, and mis- conceptions. Front. Ecol. Environ. 2011, 9, e27–e36. [Google Scholar] [CrossRef]
- Gascon, M.; Triguero-Mas, M.; Martínez, D.; Dadvand, P.; Rojas-Rueda, D.; Plasència, A.; Nieuwenhuijsen, M.J. Residential green spaces and mortality: A systematic ‘review. Environ. Int. 2016, 86, 60–67. [Google Scholar] [CrossRef] [Green Version]
- MillionTrees NYC. About MillionTrees NYC. 2017. Available online: http://www.milliontreesnyc.org/ (accessed on 17 June 2017).
- Chicago Region Trees Initiative. ChicagoRTI. 2018. Available online: http://chicagorti.org/ (accessed on 22 March 2018).
- City Plants. About City Plants. 2018. Available online: http://www.cityplants.org (accessed on 22 March 2018).
- Bottalico, F.; Travaglini, D.; Chirici, G.; Garfì, V.; Giannetti, F.; De Marco, A.; Fares, S.; Marchetti, M.; Nocentini, S.; Paoletti, E.; et al. A spatially- explicit method to assess the dry deposition of air pollution by urban forests in the city of Florence, Italy. Urban Green. 2017, 27, e221–e234. [Google Scholar] [CrossRef]
- Denise, H.S.; Duarte, P.S.; Dos Santos Gusson, C.; Abrahão, C.A. The impact of vegetation on urban microclimate to counterbalance built density in a subtropical changing climate. Urban Clim. 2015, 14, 224–239. [Google Scholar]
- Nyelele, C.; Kroll, C.N.; Nowak, D.J. Present and future ecosystem services of trees in the Bronx, NY. Urban For. Urban Green. 2019, 42, 10–20. [Google Scholar] [CrossRef]
- Rosenzweig, C.; Solecki, W.D.; Slosberg, R.B.; Parshall, L.; Lynn, B.; Cox, J.; Goldberg, R.; Hodges, S.; Gaffin, S.; Savio, P. Mitigating New York City’s Heat Island with Urban Forestry, Living Roofs, and Light Surfaces; New York State Energy Research and Development Authority: Albany, NY, USA, 2006; p. 6681.
- Christopher, J.L.; Bond, J. A Report to North East State Foresters Association. A Plan Integrate Management of Urban Trees into Air Quality Planning; Davey Resource Group, New York State Department of Environmental Conservation: Albany, NY, USA; Division of Lands and Forests and Division of Air Resources USDA Forest Service, Northeastern Research Station: Syracuse, NY, USA, 2002. [Google Scholar]
- Urban Heat Island Management Study; Texas Trees Foundation: Dallas, TX, USA, 2017.
- Belle Hudischewskyj, A.; Douglas, S.G.; Lundgren, J.R. Meteorological and Air Quality Modeling to Forther Examine the Effects of Urban Heat Island Mitigation Measures on Several Cities in the Northeastern; Global Programs Division USA Environmental Protection Agency Ariel Rios Building (6205J): Washington, DC, USA, 31 January 2001; SYSAPP-01-001. [Google Scholar]
- Nowaka, D.J.; Civerolo, K.L.; Rao, S.T.; Sistla, G.; Luley, C.J.; Crane, D.E. A modeling study of the impact of urban trees on ozone. Atmos. Environ. 2000, 34, 1601–1613. [Google Scholar] [CrossRef]
- Berardi, U.; Jandaghian, Z.; Graham, J. Effects of greenery enhancements for the resilience to heat waves: A comparison of analysis performed through mesoscale [WRF] and microscale [Envi-met] modelling. Sci. Total Environ. 2020, 747, 141300. [Google Scholar] [CrossRef]
- Kalkstein, L.S.; Sheridan, S. The Impact of Heat Island Reduction Strategies on Health-Debilitating Oppressive Air Massive in Urban Areas; U.S. EPA Heat Island Reduction Initiative: Berkeley, CA, USA, 2003.
- Chen, D.; Wang, X.; Thatcher, M.; Barnett, G.; Kachenko, A.; Prince, R. Urban vegetation for reducing heat related mortality. Environ. Pollut. 2014, 192, 275–284. [Google Scholar] [CrossRef]
- Imran, H.M.; Kala, J.; Ng, A.W.M.; Muthukumaran, S. Effectiveness of vegetated patches as Green Infrastructure in mitigating Urban Heat Island effects during a heatwave event in the city of Melbourne. Weather Clim. Extrem. 2019, 25, 100217. [Google Scholar] [CrossRef]
- Jacobs, S.J.; Gallant, A.J.E.; Tapper, N.J.; Li, D. Use of cool roofs and vegetation to mitigate urban heat and improve human thermal stress in Melbourne, Australia. J. Appl. Meteorol. Climatol. 2018, 77, 1748. [Google Scholar] [CrossRef]
- Chapman, S.; Thatcher, M.; Salazar, A.; Watson, J.E.M.; McAlpine, C.A. The Effect of Urban Density and Vegetation Cover on the Heat Island of a Subtropical City. J. Appl. Climatol. Meteorol. 2017, 57, 2532. [Google Scholar] [CrossRef]
- Santamouris, M.; Haddad, S.; Saliari, M.; Vasilakopoulou, K.; Synnefa, A.; Paolini, R.; Ulpiani, G.; Garshasbi, S.; Fiorito, F. On the energy impact of urban heat island in Sydney: Climate and energy potential of mitigation technologies. Energy Build. 2018, 166, 154–164. [Google Scholar] [CrossRef]
- Haddad, S.; Barker, A.; Yang, J.; Ilamathy, D.; Kumar, M.; Garshasbi, S.; Paolini, R.; Santamouris, M. On the Potential of Building Adaptation Measures to Counterbalance the Impact of Climatic Change in the Tropics. Energy Build. 2020, 229, 110494. [Google Scholar] [CrossRef]
- Yenneti, K.; Ding, L.; Prasad, D.; Ulpiani, G.; Paolini, R.; Haddad, S.; Santamouris, M. Urban overheating and cooling potential in Australia: An evidence-based review. Climate 2020, 8, 126. [Google Scholar] [CrossRef]
- Middendorp, M. Mesoscale Modelling the Influence of Urban Vegetation on the Urban Temperatures and Human Thermal Comfort, Supervisors: Steeneveld, G.J., Theeuwes, N.E. Master’s Thesis, Meteorology and Air Quality Wageningen University, Wageningen, The Netherlands, October 2013. [Google Scholar]
- Fallmann, J.; Emeis, S.; Suppar, P. Mitigation of urban heat stress—A modelling case study for the area of Stuttgart, DIE ERDE. J. Geogr. Soc. Berl. 2013, 144, 3–4. [Google Scholar]
- Žuvela-Aloise, M.; Koch, R.; Buchholz, S.; Früh, B. Modelling the potential of green and blue infrastructure to reduce urban heat load in the city of Vienna. Clim. Chang. 2016. [Google Scholar] [CrossRef] [Green Version]
- Li, X.-X.; Norford, L.K. Evaluation of cool roof and vegetations in mitigating urban heat island in a tropical city. Singap. Urban Clim. 2016, 16, 59–74. [Google Scholar] [CrossRef]
- Arghavani, S.; Hossein Malakooti, H.; Bidokhti, A.A. Numerical evaluation of urban green space scenarios effects on gaseous air pollutants in Tehran Metropolis based on WRF-Chem model. Atmos. Environ. 2019, 214, 116832. [Google Scholar] [CrossRef]
- Tong, H.; Walton, A.; Sang, J.; Chan, J.C.L. Numerical simulation of the urban boundary layer over the complex terrain of Hong Kong. Atmos. Environ. 2005, 39, 3549–3563. [Google Scholar] [CrossRef]
- Ziter, C.D.; Pedersen, E.J.; Christopher, J.; Kucharik, C.J.; Turner, M.G. Scale-dependent interactions between tree canopy cover and impervious surfaces reduce daytime urban heat during summer. Proc. Nastl. Acad. Sci. USA 2019, 116, 7575–7580. [Google Scholar] [CrossRef] [Green Version]
- Gao, K.; Santamouris, M.; Feng, J. On the efficiency of transpiration cooling to mitigate urban heat. Climate 2020, 8, 69. [Google Scholar] [CrossRef]
- Santamouris, M.; Kolokotsa, D. Urban Climate Mitigation Techniques; Routedge: London, UK, 2016. [Google Scholar]
- Qiao, Z.; Tian, G.; Xiao, L. Diurnal and seasonal impacts of urbanization on the urban thermal environment: A case study of Beijing using MODIS data. ISPRS J. Photogramm. Remote Sens. 2013, 85, 93–101. [Google Scholar] [CrossRef]
- Zulia, I.; Santamouris, M.; Dimoudi, A. Monitoring the effect of urban green areas on the heat island in Athens. Environ. Monit. Assess. 2009, 156, 275–292. [Google Scholar] [CrossRef] [PubMed]
- Liu, Y.; Chen, F.; Warner, T.; Basara, J.J. Verification of a mesoscale data-assimilation and forecasting system for the Oklahoma city area during the joint urban 2003 field project—American meteorological society. J. Appl. Meteorol. Climatol. 2006, 45, 912–929. [Google Scholar] [CrossRef]
- Kusaka, H.; Kondo, H.; Kikegawa, Y.; Kimura, F. A sim- ple single-layer urban canopy model for atmospheric models: Comparison with multi-layer and slab models. Bound. Layer Meteorol. 2001, 101, 329–358. [Google Scholar] [CrossRef]
- Martilli, A.; Clappier, A.; Rotach, M.W. Rotach: An urban sur- face exchange parameterisation for mesoscale models. Bound. Layer Meteorol. 2002, 104, 261–304. [Google Scholar] [CrossRef]
- Salamanca, F.; Krpo, A.; Martilli, A.; Clappier, A. A new building energy model coupled with an urban can- opy parameterization for urban climate simulations—Part 1: Formulation, verification, and sensitivity analy- sis of the model. Theor. Appl. Climatol. 2010, 99, 331–344. [Google Scholar] [CrossRef]
- Fantozzi, F.; Monaci, F.; Blanusa, T.; Bargagli, R. Spatio-temporal variations of ozone and nitrogen dioxide concentrations under urban trees and in a nearby open area. Urban Clim. 2015, 12, 119–127. [Google Scholar] [CrossRef]
- Manes, F.; Vitale, M.; Fabi, M.A.; De Santis, F.; Zona, D. Estimates of potential ozone stomatal uptake in mature trees of Quercus ilex in a Mediterranean climate. Environ. Exp. Bot. 2007, 59, 235–241. [Google Scholar] [CrossRef]
- Beckett, P.K.; Freer-Smith, P.; Taylor, G. The capture of particulate pollution by trees at five contrasting urban sites. Arboric. J. 2000, 24, 209–230. [Google Scholar] [CrossRef]
- Carter, W.P.L. Development of ozone reactivity scales for volatile organic compounds. Air Waste 1994, 44, 881–899. [Google Scholar] [CrossRef] [Green Version]
- Atkinson, R. Atmospheric chemistry of VOCs and NOx. Atmos. Environ. 2002, 34, 2063–2101. [Google Scholar] [CrossRef]
- Calfapietra, C.; Fares, S.; Manes, F.; Morani, A.; Sgrigna, G.; Loreto, F. Role of biogenic volatile organic compounds [BVOC] emitted by urban trees on ozone concentration in cities: A review. Environ. Pollut. 2013, 183, 71–80. [Google Scholar] [CrossRef] [PubMed]
- Ghirardo, A.; Xie, J.; Zheng, X.; Wang, Y.; Grote, R.; Block, K.; Wildt, J.; Mentel, T.; Kiendler- Scharr, A.; Hallquist, M.; et al. Urban stress- induced biogenic VOC emissions and SOA-forming potentials in Beijing. Atmos. Chem. Phys. 2016, 16, 2901–2920. [Google Scholar] [CrossRef] [Green Version]
- Fu, Y.; Liao, H.; Change, C. Impacts of land use and land cover changes on biogenic emissions of volatile organic compounds in China from the late 1980s to the mid- 2000s: Implications for tropospheric ozone and secondary organic aerosol. Tellus B 2014, 66, 1–17. [Google Scholar] [CrossRef]
- Taha, H.; Douglas, S.; Haney, J. Mesoscale meteorological and air quality impacts of increased urban albedo and vegetation. Energy Build. 1997, 25, 169–177. [Google Scholar] [CrossRef] [Green Version]
- Long, X.; Wu, J.; Li, X.; Feng, T.; Xing, L.; Zhao, S.; Cao, J.; Tie, X.; An, Z.; Li, G.; et al. Does afforestation deteriorate haze pollution in Beijing-Tianjin-Hebei [BTH], China? Atmos. Chem. Phys. 2018, 18, 10869–10879. [Google Scholar] [CrossRef] [Green Version]
- Vos, P.E.; Maiheu, B.; Vankerkom, J.; Janssen, S. Improving local air quality in cities: To tree or not to tree? Environ. Pollut. 2013, 183, 113–122. [Google Scholar] [CrossRef]
- Jeanjean, A.P.R.; Buccolieri, R.; Eddy, J.; Monks, P.S.; Leigh, R.J. Air quality af-fected by trees in real street canyons: The case of marylebone neighborhood in central London. Urban. Urban Green. 2017, 22, 41–53. [Google Scholar] [CrossRef]
- Taha, H.; Douglas, S.; Haney, J.; Winer, A.; Benjamin, M.; Hall, D.; Hall, J.; Liu, X.; Fishman, B. Modeling the Ozone Air Quality Impacts of Increased Albedo and Urban Forest in the South Coast Air Basin; Rep. No. LBL-37316; Lawrence Berkeley National Laboratory: Berkeley, CA, USA, 1995.
- Environmnetal Services City of Portland. Portland’s Green Infrastructure. Quantifying the Health, Energy and Commiunity Liveability Benefits; ENTRIX: Portland, OR, USA, 2010. Available online: https://www.portlandoregon.gov/bes/article/298042 (accessed on 14 September 2020).
- Zhang, Y.; Bash, J.O.; Shawn, J.; Roselle, S.J.; Repinsky, A.; Mathur, R.; Hogrefe, C.; Piziali, J.; Jacobs, T.; Gilliland, A. Unexpected air quality impacts from implementation of green infrastructure in urban environments: A Kansas city case study. Sci. Total Environ. 2020, 744, 140960. [Google Scholar] [CrossRef]
- Cardelino, C.A.; Chameides, W.L. Natural hydrocarbons, urbanisation, and urban ozone. J. Geophys. Res. 1990, 95, 13971–13979. [Google Scholar]
- McDonald, A.G.; Bealey, W.J.; Fowler, D.; Dragosits, U.; Skiba, R.I.; Smith, R.G.; Donovan, R.G.; Brett, H.E.; Hewitt, C.N.; Nemitz, E. Quantifying the effect of urban tree planting on concentrations and depositions of PM10 in two UK conurbations. Atmos. Environ. 2007, 41, 8455–8467. [Google Scholar] [CrossRef]
- Tallis, M.T.; Taylor, G.; Sinnett, D.; Freer-Smith, P. Estimating the removal of atmospheric particulate pollution by the urban tree canopy of London, under current and future environments. Landsc. Urban Plan. 2011, 103, 129–138. [Google Scholar] [CrossRef]
- Nowak, D.J.; Crane, D.E.; Stevens, J.C.; Hoehn, R.E.; Walton, J.T.; Bond, J. A ground-based method of assessing urban forest structure and ecosystem services. Arboricult. Urban 2008, 34, 347–358. [Google Scholar]
- Janhil, S. Review on urban vegetation and particle air pollution e Deposition and dispersion. Atmos. Environ. 2015, 105, 130–137. [Google Scholar] [CrossRef]
- Hinds, W.C. Aerosol Technology: Properties, Behavior, and Measurement of Airborne Particles, 2nd ed.; John Wiley & Sons: Hoboken, NJ, USA, 1999; p. 504. [Google Scholar]
- Thomas, A.M.; Pugh, T.A.; Robert MacKenzie, A.R.; Whyatt, J.D.; Hewitt, C.N. Effectiveness of Green Infrastructure for Improvement of air quality in urban street canyons. Environ. Sci. Technol. 2012, 46, 7692–7699. [Google Scholar]
- Jeanjean, A.P.; Monks, P.S.; Leigh, R.J. Modelling the effectiveness of urban trees and grass on PM2.5 reduction via dispersion and deposition at a city scale. Atmos. Environ. 2016, 147, 1–10. [Google Scholar] [CrossRef] [Green Version]
- Buccolieri, R.; Salim, S.M.; Leo, L.S.; Di Sabatino, S.; Chan, A.; Ielpo, P.; de Gennaro, G.; Gromke, C. Analysis of local scale treeeatmosphere interaction on pollutant concentration in idealized street canyons and application to a real urban junction. Atmos. Environ. 2011, 45, e1702–e1713. [Google Scholar] [CrossRef]
- Salmond, J.A.; Tadaki, M.; Vardoulakis, S.; Arbuthnott, K.; Coutts, A.; Demuzere, M.; Dirks, K.N.; Heaviside, C.; Lim, S.; Macintyre, H.; et al. Health and climate related ecosystem services provided by street trees in the urban environment. Environ. Health 2016, 15, 95. [Google Scholar] [CrossRef] [Green Version]
- Wania, A.; Bruse, M.; Blond, N.; Weber, C. Analysing the influence of different street vegetation on traffic-induced particle dispersion using microscale sim- ulations. J. Environ. Manag. 2012, 94, e91–e101. [Google Scholar] [CrossRef]
- Touchaei, A.G.; Akbari, H.; Tessum, C.W. Effect of increasing urban albedo on meteorology and air quality of Montreal [Canada]—episodic simulation of heat wave in 2005. Atmos. Environ. 2016, 132, 188–206. [Google Scholar] [CrossRef]
- Nowak, D.J.; Hirabayashi, S.; Bodine, A.; Greenfield, E. Tree and forest effects on air quality and human health in the United States. Environ. Pollut. 2014, 193, 119–139. [Google Scholar] [CrossRef] [Green Version]
- Nowak, D.J.; Hirabayashi, S.; Doyle, M.; McGovern, M.; Pasher, J. Air pollution removal by urban forests in Canada and its effect on air quality and human health. Urban For. Urban Green. 2018, 29, 40–48. [Google Scholar] [CrossRef]
- Abdollahi, K.K.; Sun, J.J.; Ning, Z.H. Relative ability of urban trees and shrubs in removing ozone [O-3]. In Proceedings of the 1996 Society of American Foresters Convention—Diverse forests, Abundant Opportunities, and Evolving Realities, Washington, DC, USA, 9–13 November 1996. [Google Scholar]
- Takahashi, M.; Higaki, A.; Nohno, M.; Kamada, M.; Okamura, Y.; Matsui, K.; Kitani, S.; Hiromichi, M. Differential assimilation of nitrogen dioxide by 70 taxa of roadside trees at an urban pollution level. Chemosphere 2005, 61, 633–639. [Google Scholar] [CrossRef] [PubMed]
- Harris, T.B.; Manning, W.J. Nitrogen dioxide and ozone levels in urban tree canopies. Environ. Pollut. 2010, 158, 2384–2386. [Google Scholar] [CrossRef] [PubMed]
- Kuttler, W.; Strassburger, A. Air quality measurements in urban green areas—A case study. Atmos. Environ. 1999, 33, 4101–4108. [Google Scholar] [CrossRef]
- Ciacchini, G.; Vincentini, M.; Notoli, R.; Giaconi, V. Ozone measurements in the urban and extra-urban areas of Pisa during the summer of 1995. J. Environ. Pathol. Toxicol. Oncol. 1997, 16, 111–117. [Google Scholar]
- Grundström, M.; Pleijel, H. Limited effect of urban tree vegetation on NO2 and O3 concentrations near a traffic route. Environ. Pollut. 2014, 189, 73–76. [Google Scholar] [CrossRef] [Green Version]
- García-Go’mez, H.; Aguillaume, L.; Izquieta-Rojano, S.; Valino, F.; Avila, A.; Elustondo, D.; Santamaría, J.M.; Alastuey, A.; Calvete-Sogo, H.; González-Fernández, I.; et al. Atmospheric pollutants in peri-urban forests of Quercus ilex: Evidence of pollution abatement and threats for vegetation. Environ. Sci. Pollut. Res. 2016, 23, e6400–e6413. [Google Scholar] [CrossRef] [Green Version]
- Yli-Pelkonen, V.; Scott, A.A.; Viippola, V.; Heikki Setaala, H. Trees in urban parks and forests reduce O3, but not NO2 concentrations in Baltimore, MD, USA. Atmos. Environ. 2017, 167, 73–80. [Google Scholar] [CrossRef] [Green Version]
- Nowak, D.; Patrick, M.; Ibarra, M.; Crane, D.; Stevens, J.; Luley, C. Modeling the Effects of Urban Vegetation on Air Pollution. Air Pollut. Modeling Appl. XII 1998, 399–407. [Google Scholar] [CrossRef]
- Yli-Pelkonen, V.; Setälä, H.; Viljami Viippola, V. Urban forests near roads do not reduce gaseous air pollutant concentrations but have an impact on particles levels. Landsc. Urban Plan. 2017, 158, 39–47. [Google Scholar] [CrossRef] [Green Version]
- Roy, S.; Byrne, J.; Pickering, C. A systematic quantitative review of urban tree benefits, costs, and assessment methods across cities in different climatic zones. Urban For. Urban Green. 2012, 11, 351–363. [Google Scholar] [CrossRef] [Green Version]
- Di Nardo, F.; Saulle, R.; La Torre, G. Green areas and health outcomes: A systematic review of the scientific literature. Ital. J. Public Health 2012, 7, 402–413. [Google Scholar]
- Simpson, R.; Williams, G.; Petroeschevsky, A.; Best, T.; Morgan, G.; Denison, L.; Hinwood, A.; Neville, G.; Neller, A. The short-term effects of air pollution on daily mortality in four Australian cities. Aust. N. Z. J. Public Health 2005, 29, 205–212. [Google Scholar] [CrossRef] [Green Version]
- Lachowycz, K.; Jones, A.P. Does walking explain associations between access to greenspace and lower mortality? Soc. Sci. Med. 2014, 107, 9–17. [Google Scholar] [CrossRef] [PubMed]
- Van den Berg, M.; Wendel-Vos, W.; Van Poppel, M.; Kemper, H.; Van Mechelen, W.; Maas, J. Health benefits of green spaces in the living environment: A systematic review of epidemiological studies. Urban. For. Urban Green. 2015, 14, 806–816. [Google Scholar] [CrossRef]
- Bowler, D.E.; Buyung-Ali, L.M.; Knight, T.M.; Pullin, S.A. A systematic review of evidence for the added benefits to health of exposure to natural environments. BMC Public Health 2010, 10, 456. [Google Scholar] [CrossRef] [Green Version]
- Harlan, S.L.; Declet-Barreto, J.H.; Stefanov, W.L.; Petitti, D.B. Neighborhood effects on heat deaths: Social and environmental predictors of vulnerability in Maricopa County, Arizona. Environ. Health Perspect. 2013, 121, 197–204. [Google Scholar] [CrossRef] [Green Version]
- Wilker, E.H.; Wu, C.-D.; McNeely, E.; Mostofsky, E.; Spengler, J.; Wellenius, G.A.; Mittleman, M.A. Green space and mortality following ischemic stroke. Environ. Res. 2014, 133, 42–48. [Google Scholar] [CrossRef] [Green Version]
- Tamosiunas, A.; Grazuleviciene, R.; Luksiene, D.; Dedele, A.; Reklaitiene, R.; Baceviciene, M.; Vencloviene, J.; Bernotiene, G.; Radisauskas, R.; Malinauskiene, V.; et al. Accessibility and use of urban green spaces, and cardiovascular health:findings from a Kaunas cohort study. Environ. Health 2014, 13, 20. [Google Scholar] [CrossRef] [Green Version]
- Jonker, M.F.; Van Lenthe, F.J.; Donkers, B.; Mackenbach, J.P.; Burdorf, A. The effect of urban green on small-area [healthy] life expectancy. J. Epidemiol. Community Health 2014, 68, 999–1002. [Google Scholar] [CrossRef]
- Son, J.-Y.; Liu, J.C.; Bell, M.J. Temperature-related mortality: A systematic review and investigation of effect modifiers. Environ. Res. Lett. 2019, 14, 073004. [Google Scholar] [CrossRef]
- Murage, P.; Kovats, S.; Sarran, C.; Taylor, J.; McInnes, R.; Hajat, S. What individual and neighbourhood-level factors increase the risk of heat- related mortality? A case-crossover study of over 185,000 deaths in London using high-resolution climate datasets. Environ. Int. 2020, 134, 1052922. [Google Scholar] [CrossRef] [PubMed]
- Son, J.K.; Lane, K.J.; Lee, J.-T.; Bell, M.L. Urban vegetation and heat-related mortality in Seoul. Environ. Res. 2016, 151, 728–733. [Google Scholar] [CrossRef] [PubMed] [Green Version]
- Nowak, D.J.; Hirabayashi, S.; Bodine, A.; Hoehn, R. Modeled PM2.5 removal by trees in ten U.S. cities and associated health effects. Environ. Pollut. 2013, 178, 395–402. [Google Scholar] [CrossRef]
- Rao, M.; George, L.A.; Rosenstiel, T.N.; Shandas, V.; Dinno, A.; Rao, M.; George, L.A.; Rosenstiel, T.N.; Shandas, V.; Dinno, A. Assessing the relationship among urban trees, nitrogen dioxide, and respiratory health. Environ. Pollut. 2014, 194, 96–104. [Google Scholar] [CrossRef]
- Manes, F.; Incerti, G.; Salvatori, E.; Vitale, M.; Ricotta, C.; Costanza, R. Urban ecosystem services: Tree diversity and stability of tropospheric ozone removal. Ecol. Appl. 2012, 22, 349–360. [Google Scholar] [CrossRef]
- Alonso, R.; Vivanco, M.G.; González-Fernández, I.; Bermejo, V.; Palomino, I.; Garrido, J.L.; Artíñano, B. Modelling the influence of peri-urban trees in the air quality of Madrid region [Spain]. Environ. Pollut. 2011, 159, 2138–2147. [Google Scholar] [CrossRef]
- Tiwary, A.; Sinnett, D.; Peachey, C.; Chalabi, Z.; Vardoulakis, S.; Fletcher, T.; Hutchings, T.R. An integrated tool to assess @benefits: A case study in London. Environ. Pollut. 2009, 157, 2645–2653. [Google Scholar] [CrossRef] [Green Version]
- Powe, N.A.; Willis, K.G. Mortality and morbidity benefits of air pollution [SO2 and PM10] absorption attributable to woodland in Britain. J. Environ. Manag. 2004, 70, 119–128. [Google Scholar] [CrossRef]
- Pereira, G.; Foster, S.; Martin, K.; Christian, H.; Boruff, B.J.; Knuiman, M.; Giles-Corti, B. The association between neighborhood greenness and cardiovascular disease: An observ ational study. BMC Public Health 2012, 12, 466. [Google Scholar] [CrossRef] [Green Version]
- Mills, D.M.; Laurence Kalkstein, L. Estimating reduced heat-attributable mortality for an urban revegetation project. J. Heat Island Inst. Int. 2012, 7, 18–24. [Google Scholar]
- Kalkstein, L.S.; Greene, S.; Mills, D.M.; Samenow, J. An evaluation of the progress in reducing heat-related human mortality in major U.S. cities. Nat. Hazards 2011, 56, 113–129. [Google Scholar] [CrossRef]
- Smargiassi, A.; Goldberg, M.S.; Plante, C.; Fournier, M.; Baudouin, Y.; Kosatsky, T. Variation of daily warm season mortality as a function of micro-urban heat islands. J. Epidemiol. Community Health 2009, 63, 659–664. [Google Scholar] [CrossRef] [PubMed]
- Taylor, J.; Wilkinson, P.; Davies, M.; Armstrong, B.; Chalabi, Z.; Mavrogianni, A.; Symonds, P.; Oikonomou, E.; Bohnenstengel, S.I. Mapping the effects of urban heat island, housing, and age on excess heat-related mortality in London. Urban Clim. 2015, 14, 517–528. [Google Scholar] [CrossRef]
- Hondula, D.M.; Balling, R.C.; Vanos, J.K.; Georgescu, M. Rising temperatures, human health, and the role of adaptation. Curr. Clim. Chang. Rep. 2015, 1, 144–154. [Google Scholar] [CrossRef] [Green Version]
- Boeckmann, M.; Rohn, I. Is planned adaptation to heat reducing heat-related mortality and illness? A systematic review. BMC Public Health 2014, 14, 1112. [Google Scholar] [CrossRef] [Green Version]
- Yao, Y.; Luo, Y.; Huang, J.; Zhao, Z. Comparison of monthly temperature extremes simulated by CMIP3 and CMIP5 models. J. Clim. 2013, 26, 7692–7707. [Google Scholar] [CrossRef]
- Pyrgou, A.; Hadjinicolaou, P.; Santamouris, M. Urban-rural moisture contrast: Regulator of the urban heat island and heatwaves’ synergy over a Mediterranean city. Environ. Res. 2020, 182, 109102. [Google Scholar] [CrossRef]
- Khan, H.S.; Santamouris, M.; Riccardo Paolini, R.; Caccetta, P.; Kassomenos, P. Analyzing the local and climatic conditions affecting the Urban Overheating Magnitude during the Heatwaves [HWs] in a coastal city, a case study of the greater Sydney region. Sci. Total Environ. 2020, 755, 142515. [Google Scholar] [CrossRef]
- Lu, J.; Li, C.-D.; Yang, Y.-C.; Zhang, X.-H.; Jin, M. Quantitative evaluation of urban park cool island factors in mountain city. J. Cent. South. Univ. Technol. 2012, 19, 1657–1662. [Google Scholar] [CrossRef]
- Teskey, R.; Wertin, T.; Bauweraerts, I.; Ameye, M.; McGuire, M.A.; Steppe, K. Responses of tree species to heat waves and extreme heat events. Plant. Cell Environ. 2015, 38, 1699–1712. [Google Scholar] [CrossRef] [PubMed]
- Zweifel, R.; Zimmermann, L.; Zeugin, F.; Newbery, D.M. Intra-annual radial growth and water relations of trees: Implications towards a growth mechanism. J. Exp. Bot. 2006, 57, 1445–1459. [Google Scholar] [CrossRef] [PubMed] [Green Version]
- Kala, J.; De Kauwe, M.G.; Pitman, A.J.; Medlyn, B.E.; Wang, Y.-P.; Lorenz, R.; Perkins-Kirkpatrick, S.E. Impact of the representation of stomatal conductance on model projections of heatwave intensity. Sci. Rep. Nat. 2016, 6, 23418. [Google Scholar] [CrossRef] [PubMed] [Green Version]
- Lorenz, R.; Davin, E.L.; Lawrence, D.M.; Stöckli, R.; Seneviratne, S.I. How important is vegetation phenology for European climate and heat waves? J. Clim. 2013, 26, 10077–10100. [Google Scholar] [CrossRef] [Green Version]
- Stéfanon, M.; Drobinski, P.; D’Andrea, F.; de Noblet-Ducoudré, N. Effects of interactive vegetation phenology on the 2003 summer heat waves. J. Geophys. Res. 2012, 117, D24103. [Google Scholar] [CrossRef] [Green Version]
- Harfouche, A.; Meilan, R.; Altman, A. Tree genetic engineering and applications to sustainable forestry and biomass production. Trends Biotechnol. 2011, 29, 9–17. [Google Scholar] [CrossRef]
- Nuvolone, D.; Petri, D.; Voller, F. The effects of ozone on human health. Environ. Sci. Pollut. Control Ser. 2017, 25, 8074–8088. [Google Scholar] [CrossRef]
- Krmpotic, D.; Luzar-Stiffler, V.; Herzog, P. Effects of urban ozone pollution on hospitalizations for exacerbation of chronic obstructive pulmonary disease. Eur. Respir. J. 2015, 46, PA3411. [Google Scholar]
- Amorim, J.H.; Rodrigues, V.; Tavares, R.; Valente, J.; Borrego, C. CFD modelling of the aerodynamic effect of trees on urban air pollution dispersion. Sci. Total Environ. 2013, 461, 541–551. [Google Scholar] [CrossRef]
- EEA. Air Pollution in Europe 1990–2004; EEA Report No2/2007; European Environment Agency: Copenhagen, Denmark, 2007. [Google Scholar]
- Silva, H.R.; Phelan, P.E.; Golden, J.S. Modeling effects of urban heat island mitigation strategies on heat-related morbidity: A case study for Phoenix, Arizona, USA. Int. J. Biometeorol. 2010, 54, 13–22. [Google Scholar] [CrossRef]
- Venter, Z.S.; Krog, N.H.; David, N.; Barton, D.N. Linking green infrastructure to urban heat and human health risk mitigation in Oslo, Norway. Sci. Total Environ. 2020, 709, 136193. [Google Scholar] [CrossRef] [PubMed]
Figure 1.
Predicted average peak daily ambient temperature predicted from Equation (1) against the reported values.
Figure 1.
Predicted average peak daily ambient temperature predicted from Equation (1) against the reported values.

Figure 2.
Correlation between the average peak daily temperature drop at 15:00 p.m. against the corresponding increase of the tree cover.
Figure 2.
Correlation between the average peak daily temperature drop at 15:00 p.m. against the corresponding increase of the tree cover.
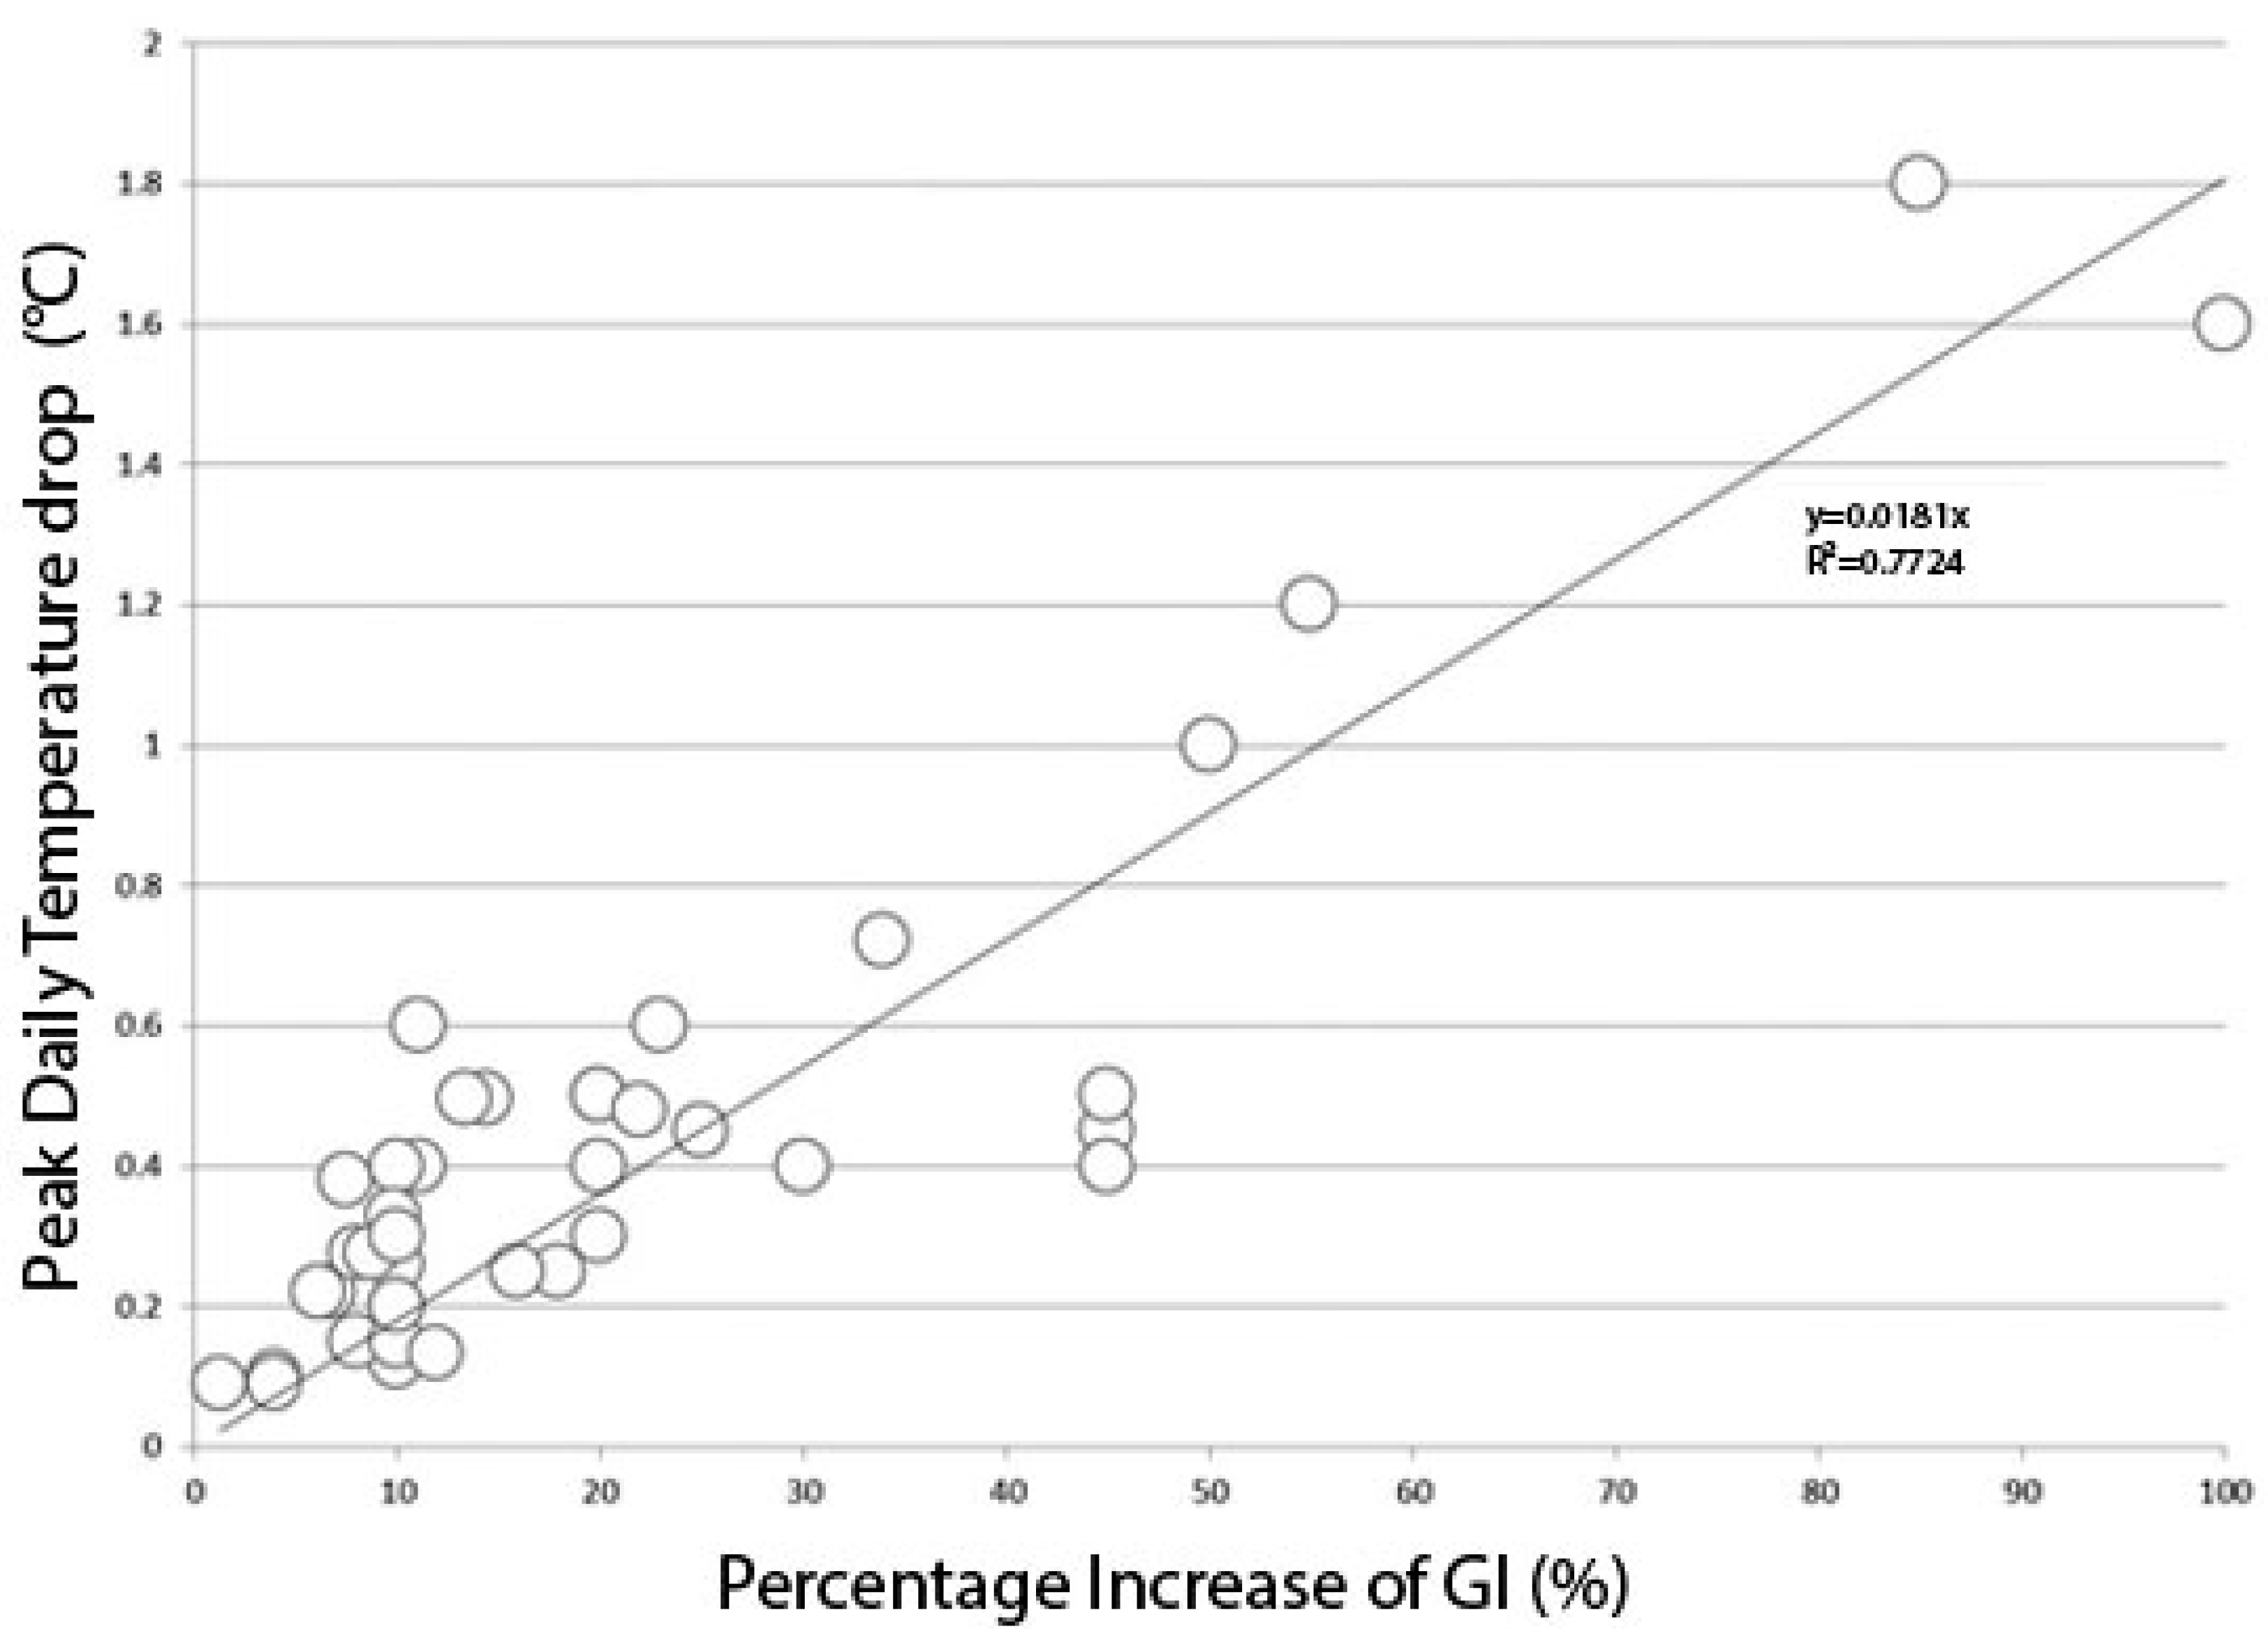
Figure 3.
Box plots of the maximum temperature drop at 15:00 for four clusters of tree-covering increases. Cluster 1: 0 < GI < 10, Cluster 2: 10 < GI < 20, Cluster 3: 20 < GI < 30, Cluster 4: GI > 30.
Figure 3.
Box plots of the maximum temperature drop at 15:00 for four clusters of tree-covering increases. Cluster 1: 0 < GI < 10, Cluster 2: 10 < GI < 20, Cluster 3: 20 < GI < 30, Cluster 4: GI > 30.

Figure 4.
Correlation between the maximum drop of the ambient temperature at night against the corresponding increase of the tree covering.
Figure 4.
Correlation between the maximum drop of the ambient temperature at night against the corresponding increase of the tree covering.

Figure 5.
Daily peak and night-time temperature drop as a function of the considered increase of the GI. Circles correspond to the night-time temperature drop, and squares to the peak daytime decrease of the temperature.
Figure 5.
Daily peak and night-time temperature drop as a function of the considered increase of the GI. Circles correspond to the night-time temperature drop, and squares to the peak daytime decrease of the temperature.

Figure 6.
Correlation between the percentage decrease of the HRM against the corresponding decrease of the peak daily temperature at 15:00 p.m.
Figure 6.
Correlation between the percentage decrease of the HRM against the corresponding decrease of the peak daily temperature at 15:00 p.m.


Table 1.
Characteristics and results of all the analysed scenarios and cases of increased tree covering.
Table 1.
Characteristics and results of all the analysed scenarios and cases of increased tree covering.
| Part 1: Assessment of the Mitigation Potential, HR Mortality and Morbidity | |||||||
| City | Scenario | Simulation Period | Simulation Tool | Impact on Temperature | Impact on Mortality | Impact on Morbidity | Reference |
| Darwin, Australia | Increase of tree cover tree cover from 19% to 39%. | Wet and dry seasons in 2016 | ENVI-met 6 × 6 m | Decrease of the average peak daily temperature by 0.5 °C | Calculation of the HRM based on correlations between the local ambient temperature and mortality. Decrease of mortality by 19.3% against the base case. | Greenery reduces the annual excess hospital admissions of 40.14 to 27.51. | [65] |
| Paramatta, Australia | Increase of the tree cover from 20% to 70%. | Summer months 2002–2016 | WRF Resolution: 500 × 500 m | Decrease of the average peak daily temperature by 1.0 °C | Calculation of the HRM based on correlations between the local ambient temperature and mortality. Decrease of mortality by 49% against the base case. | The daily excess HR morbidity decreases from 3.66 hospital admissions per day to about 2.6. | [64] |
| Part 2: Assessment of the Mitigation Potential and HR Mortality | |||||||
| City | Scenario | Simulation Period | Simulation Tool | Impact on Temperature | Impact on Mortality | Reference | |
| New Orleans, LA, USA | Increase of the tree cover from 25% to 35% | Heatwaves 31 May–2 June 1998 16–18 June 1998 14–8 July 2000 | WRF Resolution 2 × 2 km | Reduction of the average afternoon ambient temperature by 0.21 °C | Calculation of the HRM for the offensive air mass types. Decrease of HRM by 0.82 deaths per day and 100,000 population, or 15% of the base case. | [58] | |
| Philadelphia, PA, USA | Increase of the tree cover from 15% to 25% | Heatwaves 22-26 June 1997 3–8 July 1999 23–29 July 1999 | WRF Resolution 2 × 2 km | Reduction of the average afternoon ambient temperature by 0.32 °C | Calculation of the HRM for the offensive air mass types. Decrease of HRM by 0.67 deaths per day and 100,000 population or 5.7% of the base case. | [58] | |
| Detroit, MI, USA | Increase of the tree cover from 15% to 25% | Heatwaves 13–16 July 1995, 6–11 June 1999, 6–9 August 2001 | WRF Resolution 1 × 1 km | Reduction of the average afternoon ambient temperature by 0.1 °C | Calculation of the HRM for the offensive air mass types. Decrease of HRM by 0.09 deaths per day and 100,000 population or 1.5% of the base case. | [58] | |
| Philadelphia, PA, USA | Increase of the GI from 31% to 35% | Years 2020–2049 | Based on past WRF simulations | Reduction of the average peak daily ambient temperature by 0.14 °C | Calculation of the HRM for the offensive air mass types. Decrease of the mortality by 5.6% compared to the base case. | [140] | |
| Philadelphia, PA, USA | Increase of the tree cover from 31% to 52% | 2020–2049 | Based on past WRF simulations | Reduction of the average peak daily ambient temperature by 0.97 °C | Calculation of the HRM for the offensive air mass types. Decrease of the mortality by 26.6% compared to the base case. Reduction of deaths by 135–315 deaths over the period 2020 through 2049. | [140] | |
| Melbourne CBD area Australia | Increase of the GI from 15% to 100% | 2009–2050 | (UCM-TAPM) Multiple one-way nesting procedure, steps of 30, 10, 3 and 1 km. | Decrease of the average peak daily temperature by 1.7 °C | Calculation of the HRM based on correlations between the local ambient temperature and mortality of elderly people. Decrease of mortality by 45% against the base case. | [59] | |
| Melbourne CBD area Australia | Increase of the GI from 15% to 49% | 2009–2050 | (UCM-TAPM) Multiple one-way nesting procedure, steps of 30, 10, 3 and 1 km. | Decrease of the average peak daily temperature by 0.76 °C | Calculation of the HRM based on correlations between the local ambient temperature and mortality of elderly people. Decrease of mortality by 20% against the base case. | [59] | |
| Melbourne CBD area Australia | Increase of the GI from 15% to 38% | 2009–2050 | (UCM-TAPM) Multiple one-way nesting procedure, steps of 30, 10, 3 and 1 km. | Decrease of the average peak daily temperature by 0.6 °C | Calculation of the HRM based on correlations between the local ambient temperature and mortality of elderly people. Decrease of mortality by 10% against the base case. | [59] | |
| Melbourne CBD area Australia | Decrease of the GI from 15% to 5% | 2009–2050 | (UCM-TAPM) Multiple one-way nesting procedure, steps of 30, 10, and 1 km. | Increase of the average peak daily temperature by 0.2 °C | Calculation of the HRM based on correlations between the local ambient temperature and mortality of elderly people. Increase of mortality by 13% against the base case. | [59] | |
| Melbourne CBD area Australia | Increase of the GI from 15% to 33% | 2009–2050 | (UCM-TAPM) Multiple one-way nesting procedure, steps of 30 m 10, 3 and 1 km. | Decrease of the average peak daily temperature by 0.25 °C | Calculation of the HRM based on correlations between the local ambient temperature and mortality of elderly people. Decrease of mortality by 12% against the base case. | [59] | |
| Dallas, TX, USA | Increase of the GI from 27.5% to 35% | Summer months 2011 | WRF Resolution: 500 × 500 m | Decrease of the average peak daily temperature by 0.38 °C | Exposure-response relationship between temperature and mortality. Decrease of mortality by 5.7% against the base case. | [54] | |
| Part 3: Assessment of the Mitigation Potential and HR Morbidity | |||||||
| City | Scenario | Simulation Period | Simulation Tool | Impact on Temperature | Impact on Morbidity | Reference | |
| Phoenix, AZ, USA | Increase the GI by 5% | 2002–2006 | Zero-dimensional energy balance model | Decrease of the average daily temperature by 1.7%. | Heat-related emergency calls decreased by 17%. | [160] | |
| Phoenix, AZ, USA | Increase the GI by 10% | 2002–2006 | Zero-dimensional energy balance model | Decrease of the average daily temperature by 3.6%. | Heat-related emergency calls decreased by 35%. | [160] | |
| Phoenix, AZ, USA | Increase the GI by 15% | 2002–2006 | Zero-dimensional energy balance model | Decrease of the average daily temperature by 5.4%. | Heat-related emergency calls decreased by 53%. | [160] | |
| Phoenix, AZ, USA | Increase the GI by 20% | 2002–2006 | Zero-dimensional energy balance model | Decrease of the average daily temperature by 7.2%. | Heat-related emergency calls decreased by 70%. | [160] | |
| Oslo, Norway | Zero GI in the city | Summer 2018 | Satellite measured surface temperature data correlated against ambient air temperature | - | No relation between temperature and morbidity except for skin-related problems. Trees reduce the potential heat exposure for the elderly by 1.3 ± 0.1 heat risk person days. | [161] | |
| Part 4: Assessment of the Air Quality and Mitigation Potential | |||||||
| City | Scenario | Simulation Period | Simulation Tool | Temperature Decrease | Impact on Air Quality | Reference | |
| Bronx, NY, USA | Increase of GI from 24.9% to 26.2% | 2010–2030 | i-Tree assessment software | Decrease of the average peak daily temperature by 0.09 °C | Increase of the removal PM2.5 by 9.8%, 13.7% and 21.6% for the high, average and low tree mortality rate. | [51] | |
| North-eastern USA | Increase of the urban GI from 20% to 40% | Period of heatwaves | CSUMM tool | Decrease of the average peak daily temperature by 0.4 °C | Decrease in daytime hourly ozone concentrations of 1 ppb (2.4%) with a peak decrease of 2.4 ppb (4.1%). Increases in some parts of the computational domain. | [55,56] | |
| New York, NY, USA | Increase of GI from 10% to 30% | Heatwaves | MMA mesoscale tool | Decrease of the average peak daily temperature by 0.4 °C | Domain-wide drop of about 4 ppb of ozone (132 to 128 ppb). | [86] | |
| New York, NY, USA | Increase of GI from 10% to 20% | Heatwaves | MMA mesoscale tool | Decrease of the average peak daily temperature by 0.15 °C | Domain-wide drop of about 4 ppb of ozone (132 to 128 ppb). | [86] | |
| Part 5: Assessment of the Air Quality | |||||||
| City | Scenario | Simulation Period | Simulation Tool | Impact on Air Quality | Reference | ||
| Brooklyn, Melbourne, AU | Increase of trees from 20 to 80 trees per hectare | Current | i-Tree assessment software | Increase of pollutant removal by 660%, from 577 to 4500 kg NO2: from 68 to 964 kg; SO2: from 22 to 125 kg; PM10: from 225 to 1474 kg. PM2.5: from 7 to 43 kg; O3: from 246 to 1885 kg. CO: from 9 to 10 kg. | [83] | ||
| Atlanta, GA, USA | Reduction of Urban GI by 20% | Current | The OZIPM4 Computer Tool | Increase of ozone concentration (0% to 5%). | [85] | ||
| Kansas City, MO, USA | Non-quantified increase of GI | Current | WRF-CMAQ tool | Increase of PM2.5 10% or 1.1 μg m−3 during the night period. Decrease of O3 concentration by 2.0 ppbv during the daytime, and 5.2 ppbv during the night. Increase in some domains of the city. | [84] | ||
| West Midlands, UK | Increase of GI from 3.75% to 16.5% | - | Atmospheric FRAME model | Reduction of the average PM10 concentrations by 10% from 2.3 to 2.1 mg m−3, removing 110 tonnes per year of primary PM10 from the atmosphere. | [97] | ||
| West Midlands, UK | Increase of GI from 3.75% to 54% | - | Atmospheric FRAME model | Reduction of the average PM10 concentration by 26%, removing 200 tonnes of primary PM10 per year. | [97] | ||
| Glasgow, UK | Increase of GI from 3.75% to 8.0% | - | Atmospheric FRAME model | Reduction of the primary PM10 concentrations by 2%, removing 4 tonnes of PM10 per year. | [97] | ||
| Glasgow, UK | Increase of GI from 3.75% to 21% | - | Atmospheric FRAME model | Reduction of the primary PM10 air concentrations by 7%, removing 13 tonnes of primary PM10 per year. | [97] | ||
| California’s South Coast Air Basin, CA, USA | Moderate Increase of greenery by 6% | - | CSUMM Tool | If low-emitting plants are used, the decrease of the population-weighted exceedance exposure to ozone above the Californian and National thresholds are up to 14% during peak afternoon hours, respectively. | [89] | ||
| California’s South Coast Air Basin, CA, USA | High increase of greenery by 12% | - | CSUMM Tool | If low-emitting plants are used, the decrease of the population-weighted exceedance exposure to ozone above the Californian and National thresholds is up to 22% during peak afternoon hours, respectively. | [89] | ||
| Greater London Area, UK | Increase of GI from 20% to 30%. | - | The Urban Forest Effects Model (UFORE) | Deposition of 1109–2379 tonnes of PM10 (1.1–2.6% removal) by 2050. | [98] | ||
| Part 6: Assessment of the Mitigation Potential | |||||||
| City | Scenario | Simulation Period | Simulation Tool | Temperature Decrease | Reference | ||
| Sao Paolo, Brazil | Increase of GI from zero to 11%. Street trees | Summer 2014 | ENVI-met | Decrease of the peak daily temperature by 0.6 °C | [50] | ||
| Sao Paolo, Brazil | Increase of GI from zero to 11%. Pocket parks | Summer 2014 | ENVI-met | Decrease of the peak daily temperature by 0.4 °C. | [50] | ||
| Brisbane, Australia | Increase of GI from zero to 45% | 2000–2010 | CCAM CSIRO | Decrease of the night temperature by 1.83 °C, average T by 0.99 °C, and peak temperature by 0.44 °C. | [62] | ||
| Archerfield, Australia | Increase of GI from zero to 45% | 2000–2010 | CCAM CSIRO | Decrease of the night temperature by 1.58 °C, average T by 0.94 °C, and peak temperature by 0.40 °C. | [62] | ||
| Logan, Australia | Increase of GI from zero to 45% | 2000–2010 | CCAM CSIRO | Decrease of the night temperature by 1.58 °C, average T by 0.94 °C, and peak temperature by 0.40 °C. | [62] | ||
| HK, China | Increase of the GI from zero to 100% | March 2000 | MM5 | Decrease of the peak daily temperature by 1.6 °C. | [71] | ||
| Melbourne, Australia | Increase of the mixed Forest from zero tree cover to by 20–50% | Heatwaves 27–30 January 2009 | WRF | Decrease of the UHI intensity from 0.5 to 5 during the night-time. Non-significant differences during the daytime. | [60] | ||
| Melbourne, Australia | Increase of the trees cover by 5%, 10%, 40%. Average initial trees cover 24%, Final tree cover 28%, 32%, 40%. | 12 heatwaves 1990–2014 | WRF | Decrease of the night temperature by 0.28, 0.38, and 1.08 °C cooler than the control for the three scenarios. | [61] | ||
| Bochum, Germany | Increase of the GI by 25% in a specific urban zone. Initial tree cover: 9%, final tree cover: 25% | Heatwave of Summer 2010 | WRF | Decrease of the peak daily temperature by 0.45 °C | [66] | ||
| Vienna, Austria | Increase of the size of urban parks by 20% | 1981–2010 | MUCLIMA 3 | Maximum decrease of the night-time ambient temperature by 1 °C | [68] | ||
| New York City, NY, USA Mid-Manhattan West, Lower Manhattan East, Fordham Bronx, Maspeth Queens, Crown Heights, Ocean Parkway | Initial tree cover: around 20%. Additional tree cover from 6.2% to 14.4% | Heatwaves 2002 | MM5 | Average decrease at 3 p.m. close to 0.22 °C | [52] | ||
| Heatwaves 2002 | MM | Average decrease at 3 p.m. between 0.22 to 0.5 °C | [52] | ||||
| Singapore | Increase of the trees cover on the dense and industrial zones from 5% to 60% | April and May period | WRF | Decrease of the average peak daily temperature close to 0.3 °C, and close to 1.5 °C during the night. | [69] | ||
| Stuttgart, Germany | Increase of the tree cover from 18% to 30% | Heatwaves August 2003 | WRF | Decrease of the average peak daily temperature by 0.13 °C. Maximum decrease up to 2 °C. | [67] | ||
| Tehran, Iran | Increase of the tree cover from 8% to 28% | June 2016 | WRF | Decrease of the average peak daily temperature up to 0.6 °C. Increase of the night-time temperature up to 1.5 °C. | [70] | ||
| Brampton, Toronto, ON, Canada | Increase of tree cover from 18% to 27% | Heatwaves 2018 | WRF | Decrease of the average peak daily temperature by 0.2 °C. | [57] | ||
| Caledon, Toronto, ON, Canada | Increase of tree cover from 18% to 27% | Heatwaves 2018 | WRF | Decrease of the average peak daily temperature by 0.3 °C. | [57] | ||
Publisher’s Note: MDPI stays neutral with regard to jurisdictional claims in published maps and institutional affiliations. |
© 2020 by the authors. Licensee MDPI, Basel, Switzerland. This article is an open access article distributed under the terms and conditions of the Creative Commons Attribution (CC BY) license (http://creativecommons.org/licenses/by/4.0/).
Share and Cite
MDPI and ACS Style
Santamouris, M.; Osmond, P. Increasing Green Infrastructure in Cities: Impact on Ambient Temperature, Air Quality and Heat-Related Mortality and Morbidity. Buildings 2020, 10, 233. https://doi.org/10.3390/buildings10120233
AMA Style
Santamouris M, Osmond P. Increasing Green Infrastructure in Cities: Impact on Ambient Temperature, Air Quality and Heat-Related Mortality and Morbidity. Buildings. 2020; 10(12):233. https://doi.org/10.3390/buildings10120233
Chicago/Turabian StyleSantamouris, Matthaios, and Paul Osmond. 2020. "Increasing Green Infrastructure in Cities: Impact on Ambient Temperature, Air Quality and Heat-Related Mortality and Morbidity" Buildings 10, no. 12: 233. https://doi.org/10.3390/buildings10120233
Note that from the first issue of 2016, this journal uses article numbers instead of page numbers. See further details here.