Earthquake Safety Assessment of Buildings through Rapid Visual Screening
by
 , ,
, ,
Ehsan Harirchian
1,* ,
,
Tom Lahmer
1 ,
,
Sreekanth Buddhiraju
1, 
Kifaytullah Mohammad
1 and
Amir Mosavi
2,3,4,5,*
1
Institute of Structural Mechanics (ISM), Bauhaus-Universität Weimar, 99423 Weimar, Germany
2
School of the Built Environment, Oxford Brookes University, Oxford OX30BP, UK
3
Faculty of Health, Queensland University of Technology, 130 Victoria Park Road, Kelvin Grove, QLD 4059, Australia
4
Department of Mathematics and Informatics, J. Selye University, 94501 Komarno, Slovakia
5
Kalman Kando Faculty of Electrical Engineering, Obuda University, 1034 Budapest, Hungary
*
Authors to whom correspondence should be addressed.
Buildings 2020, 10(3), 51; https://doi.org/10.3390/buildings10030051
Submission received: 5 February 2020
/
Revised: 29 February 2020
/
Accepted: 6 March 2020
/
Published: 10 March 2020
(This article belongs to the Collection Structural Analysis for Earthquake-Resistant Design of Buildings)
Abstract
:Earthquake is among the most devastating natural disasters causing severe economical, environmental, and social destruction. Earthquake safety assessment and building hazard monitoring can highly contribute to urban sustainability through identification and insight into optimum materials and structures. While the vulnerability of structures mainly depends on the structural resistance, the safety assessment of buildings can be highly challenging. In this paper, we consider the Rapid Visual Screening (RVS) method, which is a qualitative procedure for estimating structural scores for buildings suitable for medium- to high-seismic cases. This paper presents an overview of the common RVS methods, i.e., FEMA P-154, IITK-GGSDMA, and EMPI. To examine the accuracy and validation, a practical comparison is performed between their assessment and observed damage of reinforced concrete buildings from a street survey in the Bingöl region, Turkey, after the 1 May 2003 earthquake. The results demonstrate that the application of RVS methods for preliminary damage estimation is a vital tool. Furthermore, the comparative analysis showed that FEMA P-154 creates an assessment that overestimates damage states and is not economically viable, while EMPI and IITK-GGSDMA provide more accurate and practical estimation, respectively.
1. Introduction
Failure of structures is the main cause of higher deaths and injuries during an earthquake, also causing more economic losses [1]. Studies showed that the behavior of different structure types during an earthquake and its vulnerability depends mainly on the primary vertical load-bearing elements [2]. In other words, different construction methodologies have different levels of vulnerability. For instance, a masonry building with walls as load-bearing elements without any frame structure might be more vulnerable compared to that of a reinforced concrete structure with columns as load-bearing elements with a moment-resisting frame [3]. The damage caused to a building during an earthquake can be estimated by assessing seismic vulnerability [4]. “Seismic vulnerability” is defined as “the susceptibility of a population of buildings to undergo damage due to seismic ground motion” [5]. There are many methods available for seismic assessment of structures, which involve detailed structural analysis and design [6]. These detailed assessment methods consume more time when the assessment must be performed for a large number of buildings [7]. To filter and prioritize the buildings for Comprehensive, time- and resource-saving assessment, alternative Rapid Visual Screening (RVS) methods have been developed [8]. These methods are based on the systems improved upon by experts [7]. Generally, most of the evaluation procedures follow a three-stage assessment process, which starts with a rapid visual assessment to categorize buildings into different damage categories based on seismic vulnerability. Afterward, a detailed assessment using structural components, material properties, and site conditions are performed for the critical buildings. If necessary, the selected buildings from the detailed assessment are evaluated by third-stage assessment, which involves sophisticated in-depth structural analysis [9], for instance, the study on estimating the floor deformability in existing RC buildings [10] or proposing improvement on the reliability and accuracy in vulnerability modeling [11].
This study aims to examine the applicability of RVS methods for preliminary damage estimation of reinforced concrete buildings of one to seven stories. This was achieved by performing a comparison between the real observed damage of 28 buildings in Bingöl, Turkey region and RVS estimations via three different methods. These methods were FEMA P-154, Indian Method (IITK-GSDMA), and Turkish method (EMPI), which will be explained in further sections.
A study by Işık [12] compared just the performance scores of six buildings by application of the Turkish and Canadian method to evaluate the priority of investigations. Another study by Alam et al. [5] proposed a scoring system to select the suitable vulnerability assessment technique to be utilized for evaluating three different case studies conducted in various seismicity and geological zones. However, the results of the current study about the estimated potential seismic damage using three RVS methodologies for existing reinforced concrete buildings grade comparison has not been previously described in other studies.
2. Rapid Visual Screening
The Federal Emergency Management Agency (FEMA), USA, in 1988 proposed the initial Rapid Visual Screening (RVS) methodology as “Rapid Visual Screening of Buildings for Potential Seismic Hazards: A Handbook” [13]. Furthermore, in 2002, due to the effect of earthquake disasters in the 1990s, the methodology was modified to integrate the latest technological advancements [14]. Many countries follow the same RVS methodology as FEMA with relevant modifications concerning their region or country [8].
In RVS methodology, a visual inspection of buildings is carried out during the street survey without entering the building and may take 15 to 30 minutes for each building. This visual investigation involves collecting fundamental characteristics of a building, such as building type, number of stories, soft and weak stories, short columns, existence of irregularities in elevation and plan, year of construction, location of the building, soil type, seismic zone, appearance quality of the building, and other useful features. Depending on the collected data, a structural score is computed without implementing any structural calculations to determine the expected damage of the building and whether the building needs the next stage of assessment. This procedure saves time and resources that can be used effectively for the buildings that need detailed assessment [8,13,15].
There are many other RVS methods developed by using linear regression [15,16], multi-criteria decision making [17], machine learning techniques [18], fuzzy logic [19,20], or some other methods concerning their consideration and experiences on region or country [21,22,23], but the focus in this paper is on the most common RVS methodologies that have been provided by national technical codes and mentioned in the following [8,23].
2.1. USA Method (FEMA P-154)
The newest (third) edition of FEMA 154 is known as FEMA P-154 and was revised in 2015 [13]. The revised changes information was given in a scientific study by Nanda et al. [23]. In FEMA P-154, the person performing the RVS procedure should fill out a data collection form by conducting a visual inspection of the building from the outside and, if possible, inside during the sidewalk survey. The data collection form has enough space for all the required data of a building, including images and drawings. The FEMA P-154 supplied data forms for various degrees of seismicity. Depending on the seismicity classification, the relevant data form must be chosen. The classification of levels of seismicity is based on the spectral response acceleration values, as shown in Table 1 [13], where is the spectral response acceleration parameter for a 5%-damped maximum considered earthquake () at a period of 0.2 s, and , the spectral response acceleration parameter for a 5%-damped at a period of 1 s, assuming Soil Type B.
The first part of the data collection form is about general information, such as address, location, use, and year of construction, along with pictures and drawings of the building under observation. The second part provides scores for different parameters based on building type. All the parameters and the procedure of calculating final scores are explained in the following.
The procedure starts with the selection of an appropriate basic score for the building, which is changed further by using score modifiers. The lower the score, the higher the vulnerability of the building [13]. The classification of damage is based on the Final Score shown in Table 2.
Minimum Score, : In some cases, the final score obtained can be zero or a negative number, which means a building is more than 100 percent damaged. To avoid this issue, FEMA P-154 provided the minimum score a building can have in the data collection form. The minimum score was developed by considering the worst possible combination of all score modifiers at once. If the final score is less than the minimum score provided in the data completion form, the minimum score will be taken as the final score.
Basic Score: The basic score of a building was provided based on building types classified by FEMA P-154.
Score modifiers:
- Vertical irregularities: FEMA P-154 divided vertical irregularities into two parts: severe and moderate vertical irregularities. According to FEMA P-154, there is a total of seven vertical irregularities. If one or more severe irregularities are found and no moderate irregularity is identified in a building, then severe irregularity modifiers should be considered and vice versa. If both severe and moderate irregularities are found, the interpolated score of severe and moderate irregularities should be considered.
- Plan irregularities: There are five different plan irregularities defined by FEMA P-154. If one or more plan irregularities are observed, then this modifier should be considered.
- Pre-Code: This modifier should be considered if the building was constructed before the initial adoption and enforcement of seismic codes. For low seismic regions, this score modifier does not apply as it is included in the basic score itself.
- Post-Benchmark: If the building was constructed after the adoption and enforcement of significantly improved seismic codes by the local jurisdiction, this modifier should be applied. For both pre-code and post-benchmark modifiers, the year of implementation of seismic codes for the first time and the year in which the seismic codes improved (benchmark year) of the region should be known beforehand.
- Soil Type: Different score modifiers are provided based on the type of soil. Data collection forms have soil modifiers only for soil type A, B, and E; while the basic score was calculated assuming the average of soil type C and D. Also, there is no Score Modifier for Soil Type F because buildings on Soil Type F cannot be screened adequately with the RVS procedure. If the building is located on Soil Type F, it should be considered as "Geologic hazards" and a detailed structural evaluation is necessary.
2.2. Indian Method (IITK-GSDMA)
An RVS methodology has been developed based on FEMA 154 by the Indian Institute of Technology, Kanpur (IITK), with the support of the Gujarat State Disaster Mitigation Authority (GSDMA) in “Seismic Evaluation and Strengthening of Existing Buildings” [25]. It was promoted by completing proper modifications to FEMA 154, considering Indian conditions. These adjustments include only the values of scores and parameters, but the calculation procedure is similar to FEMA 154 and FEMA P-154. Indian RVS uses a similar data collection form as that of FEMA 154 with space to write all the important information of the building and extra space for photos and plan of the building and has different data collection forms for various seismic zones [26]. The classification of seismic zones is shown in Table 3 [26].
Basic score: Data forms provide different basic scores for different building types classified based on the moment-resisting system and the classification given in the data collection form itself [27].
Score modifiers:
- Mid-Rise and High-Rise: Depending on the number of stories, either of these modifiers should be selected. If the number of stories is between four and seven, inclusive, then mid-rise modifiers should be selected. If it is more than seven, then high-rise modifiers should be considered. If the number of stories is less than four, there is no need to consider these modifiers.
- Vertical irregularity: If any of the irregularities, such as steps in elevation view, inclined walls, buildings on a hill, soft story, buildings with short columns, and unbraced crippled walls are identified, then this modifier should be considered.
- Plan irregularity: This modifier should be considered when any of the irregularities, like buildings with re-entrant corners (L, T, U, E, + shape) and buildings with different lateral resistance in both directions, have been observed.
- Code detailing: This modifier can be taken into account if the building was constructed after the adoption and enforcement of significantly improved seismic codes by the local jurisdiction.
- Soil type: Depending on the soil type, the respective score modifier should be applied. If the soil is liquefiable, then the Liquefaction modifier must be considered. The classification of soil types is based on Indian code [26].
By summing all the necessary modifiers to the basic score, the final score is determined, which can be used to classify the buildings into different damage categories, which are stated at the bottom of the data collection form. In both FEMA P-154 and IITK GSDMA RVS methods, negative modifiers indicate that the value should be subtracted from the basic score. Hence, while adding modifiers to the basic score, it must be added along with a negative sign.
2.3. Turkish Method (EMPI)
The Turkish RVS methodology [28] was formed by surveying buildings in Istanbul and is called the Earthquake Master Plan for Istanbul (EMPI), which can also be used for other parts of the country. EMPI contributed different RVS methods for different types of construction, which in this study, the method for reinforced concrete buildings with 1–7 stories has been selected.
First stage of assessment (for 1–7 story reinforced concrete buildings):
This method provides different primary scores (basic score) for buildings depending on Peak Ground Velocity (PGV) and the number of stories. Furthermore, this basic score might be modified by considering the vulnerability scores of necessary vulnerability parameters observed.
Initial score parameters:
- Number of stories: Seismic force has a positive linear relationship with the number of stories of a building. Different basic scores are given to different numbers of stories.
- Local soil conditions: Depending on soil type, the intensity of ground motion changes. EMPI classified intensities into 3 zones based on PGV with Zone I as high intensity and Zone III as low intensity zones, as shown in Table 4. Depending on the number of stories and intensity zone, a basic score should be selected from Table 5 [28].
Vulnerability parameters (Score modifiers):
- Soft story: If the strength and stiffness of upper stories are more than that of the ground story, then it would be considered as a soft story. This effect happens mostly by providing more working areas on the ground floor for stores, shops, or parking purposes without constructing walls between the columns.
- Heavy overhangs: A few multi-story buildings might have extra overhangs, without any support, acting as a cantilever to main structural elements.
- Apparent building quality: The quality of a building also plays a role in the seismic resistance of the building. It depends on the materials used and the workmanship quality in construction. It is difficult to estimate the quality of a building solely by visual inspection, but a well trained and experienced person can estimate the quality of the building. EMPI classified building quality as good, moderate, and miserable.
- Short column: Semi infill frames, windows of partially buried basements, or mid-story beams lead to short columns. During an earthquake, this takes more damage because of high shear forces. It can be identified easily through visual inspection.
- Pounding effect: During an earthquake, adjacent buildings without enough space between them pound each other because of having different vibration periods. This effect usually is observed more in higher stories.
- Topographic effect: Foundations of buildings located on sloping grounds may not function properly because the seismic forces from the building cannot be transferred uniformly to the ground, resulting in a higher intensity of damage.
All the vulnerability parameters explained above should be considered appropriately depending on visual inspection and should be multiplied with vulnerability scores shown in Table 5. The vulnerability parameter values are shown in Table 6. The final score or Performance Score (PS) is calculated as follows:
3. Building Data Collection
The accuracy of information from buildings plays a vital role at RVS. Sometimes the cadastral data is not available for some buildings. In such situations, an interpretation can be made by a person performing RVS. In this study, a database of buildings that were damaged during the Bingöl earthquake in 2003 has been selected from the SERU (Structural Engineering Research Unit) database [29], which was collected from the street survey by a team of researchers from Middle East Technical University (METU), Ankara. This street survey was performed in the streets of Bingöl, Turkey, immediately after the earthquake on 1 May 2003 [30]. From the survey, information on 28 buildings has been selected for this study. The town is in the eastern part of Turkey, with an approximate area of 8125 km. Various earthquakes have occurred in this region, in which the past two significant historical events were Kovancilar in 1789 and Karliova in 1875. There were at least eight events with a magnitude higher than five in the last 60 years. The most notable event that affected the town was on 22 May 1971 with a magnitude of 6.7, which resulted in total causalities of 878 people and injuring 1500 more and 1571 collapsed or heavily damaged buildings [31].
The data are available with ground plans and in the way that one can identify all the required information, such as vertical irregularities, openings, and the number of stories. Nevertheless, sometimes, it may be challenging to identify the details of buildings from the available pictures. All the necessary building information related to required parameters to perform RVS methodologies was collected from the data provided. Table 7 matches the information from the data provided with the parameters used in RVS methodologies. The damage state provided was given verbally, such as “collapse”, “severe”, “moderate”, “light”, and “none” for both structural and infill damage, which were combined as one damage grade based on damage grades explained in the European Macroseismic Scale 1998 (EMS 98) [32]. The damage grades from EMS 98 were considered as numbers, as shown in Table 8.
If the presence of any of the irregularities is not mentioned in the data provided, then it was considered as “NO”. If the year of construction was not available, then the building was assumed to be constructed after 1940. In addition to the parameters mentioned above, seismicity level and soil type of the region are also critical, which were considered from the seismic zoning map and soil map of Turkey, respectively. Bingöl falls under a high seismic zone with a 10 percent probability in 50 years with Peak Ground Acceleration (PGA) of 0.55 g (NS), 0.28 g (EW), and 0.47 g (UP) [30]. The time-averaged shear-wave velocity ( 30) in the upper 30 m of soil in Bingöl varies from 620–760 m/s. The data provided by the METU survey team was converted for further research. However, this database was providing requirements to perform RVS but was not providing enough visual information or pictures of each building as in the other publications [19,34,35], which used the same data, and they did not show any pictures of buildings. In this paper, they tried to put more effort into the methods rather than an individual building by itself.
Table 9 shows the distribution of parameters of the building database. Data from this table can be connected with the required parameters to initialize RVS methodologies. The majority of buildings are system type C3, which is a reinforced concrete building with unreinforced masonry infill. Most of the buildings had moderate-to-poor quality, and having different story height was a significant issue. From Table 9, we can see that torsional irregularity was abundant and caused many problems. While in the database, there was no building with discontinuity of vertical structural elements.
3.1. Application of RVS to the Database
Different RVS methodologies were applied to the collected building data; there were some considerations and assumptions as follows:
3.1.1. FEMA P-154
- According to seismicity level classification based on FEMA, Bingöl is located in the high seismic zone, and hence, high seismic zone data collection form was used.
- The soil type was classified as type C based on classification given in FEMA P-154.
- There are only two different types of buildings in the collected building data. They are RC structures with concrete shear walls and RC structures with masonry infills, which were denoted as C2 and C3 building types, respectively, according to FEMA P-154.
- The pre-code year and post-benchmark year were considered as 1940 and 1998, respectively, as the seismic code was first introduced in 1940 in Turkey and was improved from 1998 [36]. As all the buildings were constructed after 1940, the pre-code factor was zero for buildings that were constructed before 1998.
- In FEMA P-154, there was no modifier value provided for soil type C as it was used in calculating the basic score. For this reason, the modifier for buildings in soil type C was given as zero as all the buildings have the same soil type.
3.1.2. Indian RVS (IITK-GGSDMA)
- According to the seismic level classification of IS 1893–2002 (part 1) [26], Bingöl is classified as zone IV, and hence, the data collection form for seismic zones IV and V was used.
- The building types in Indian RVS methodology are C2 for buildings with concrete shear wall and C3 for buildings with masonry infill.
- ‘Number of stories’ modifier was given as zero for the buildings with the number of stories less than four, as there was no modifier provided for such buildings.
- Buildings that were constructed before 1998 used zero as the pre-code modifier.
- As all the buildings have the same soil (type I) and Indian RVS does not have a modifier value for soil type I, the soil type modifier was given as zero.
3.1.3. Turkish RVS (EMPI)
4. Results and Discussion
Since the collected building data uses the name of the damage state, it must be converted into numbers. Table 10 shows the percentage of buildings in selected building data in a certain damage state. The pie chart reveals that the majority of buildings have experienced damage states three and four. Also, the outcomes obtained from RVS methodologies do not have an equal scale as actual damage (one to five) to compare the results and need to be standardized [41]. Thus, the results from various RVS methodologies were scaled from one to five using the following Equation (2):
where ‘’ is the scaled value of the obtained results. The is considered as 0.3 for both Indian RVS and FEMA P-154, as it is the lowest score in the table of structural scores with damage potential. The can be any value more than 2.5 as it was the maximum score in Table 2. Hence, is taken as 3 for Indian RVS and 2.6 for FEMA P-154 obtained from RVS of 28 buildings assumed without any damage. For Turkish RVS, as a table with damage potential scores is not available, is considered as the least possible score as a building in zone one with five stories can obtain all the irregularities, which was 25. For , the highest value a building can achieve in zone 1 with one story and without any irregularity is considered, which was 90. The scaled results are not exactly integers, but most of the scaled values are fractions, and hence, they are considered as integers with specific ranges, as in Table 11, for the sake of comparison with actual damage.
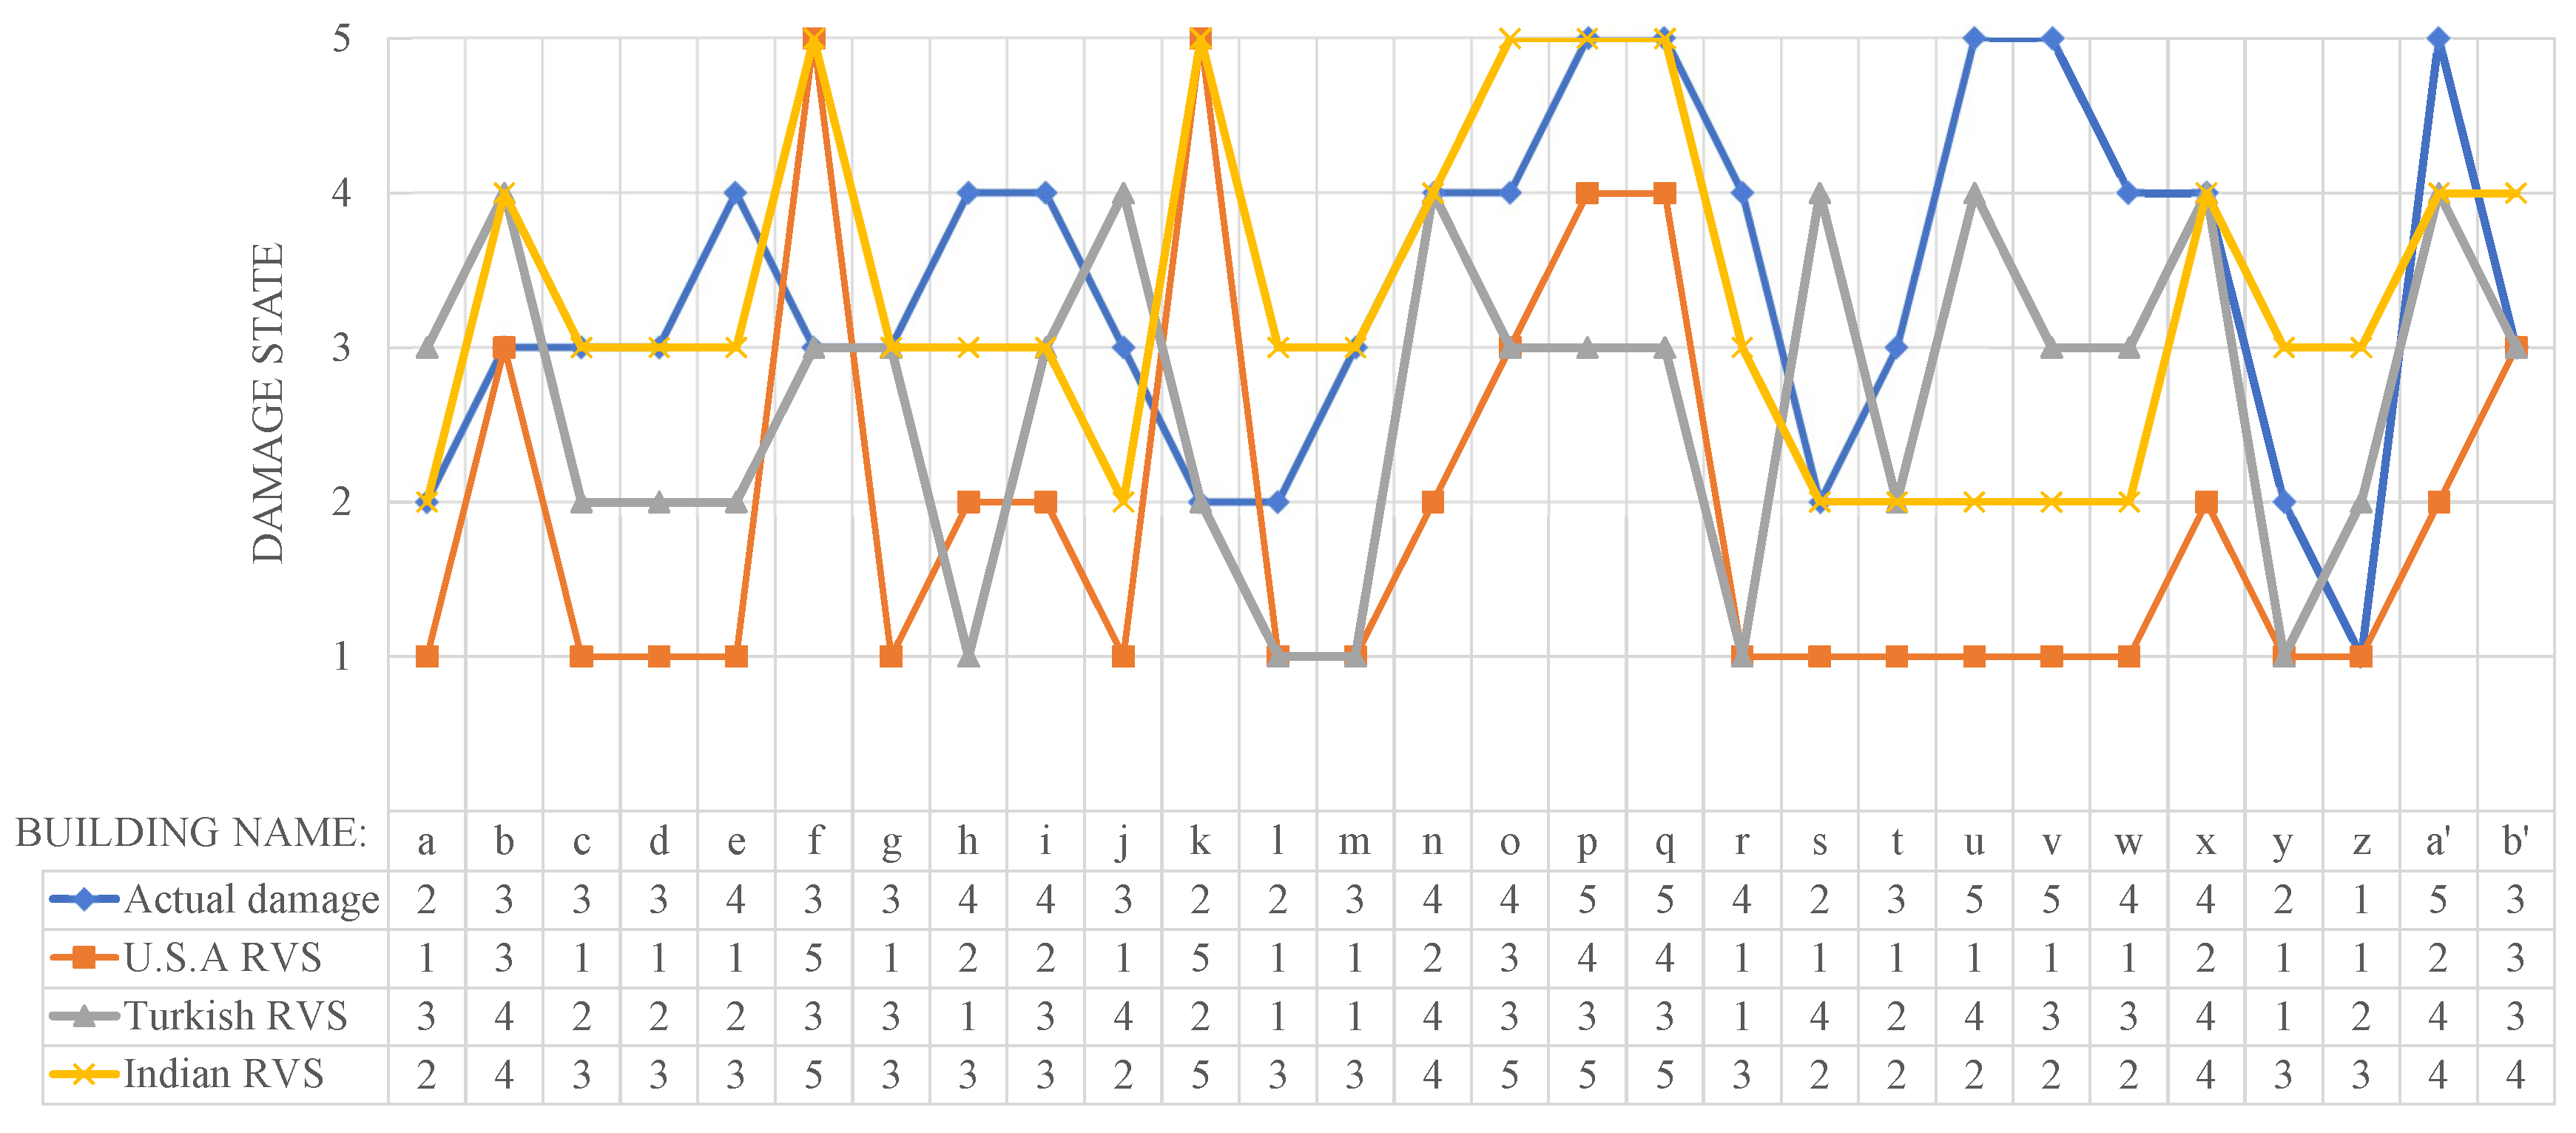
From Equation (2), when scaling the results from RVS methodologies, the lowest value 1 is calculated for FEMA P-154 and Indian RVS but 1.4 for Turkish RVS. The range for the considered integer was between 0.5 and 1.5. As 0.5 lies between the high probability of Grade 5 and Grade 4 (0.3 and 0.7 range), it was considered to be Grade 5 and Grade 4. For this reason, each definition includes two damage states. Initially, the scaled values were plotted against the actual damage, as shown in Figure 1. This figure presents the following: first, the estimation of each building via a different RVS method is displayed and compared with each other. Second, the actual damage of each building has been compared to the assessments. Accordingly, for better illustrating the achievements and difficulties of understanding the figure, a similarity system was worked out based on several buildings to express the results.
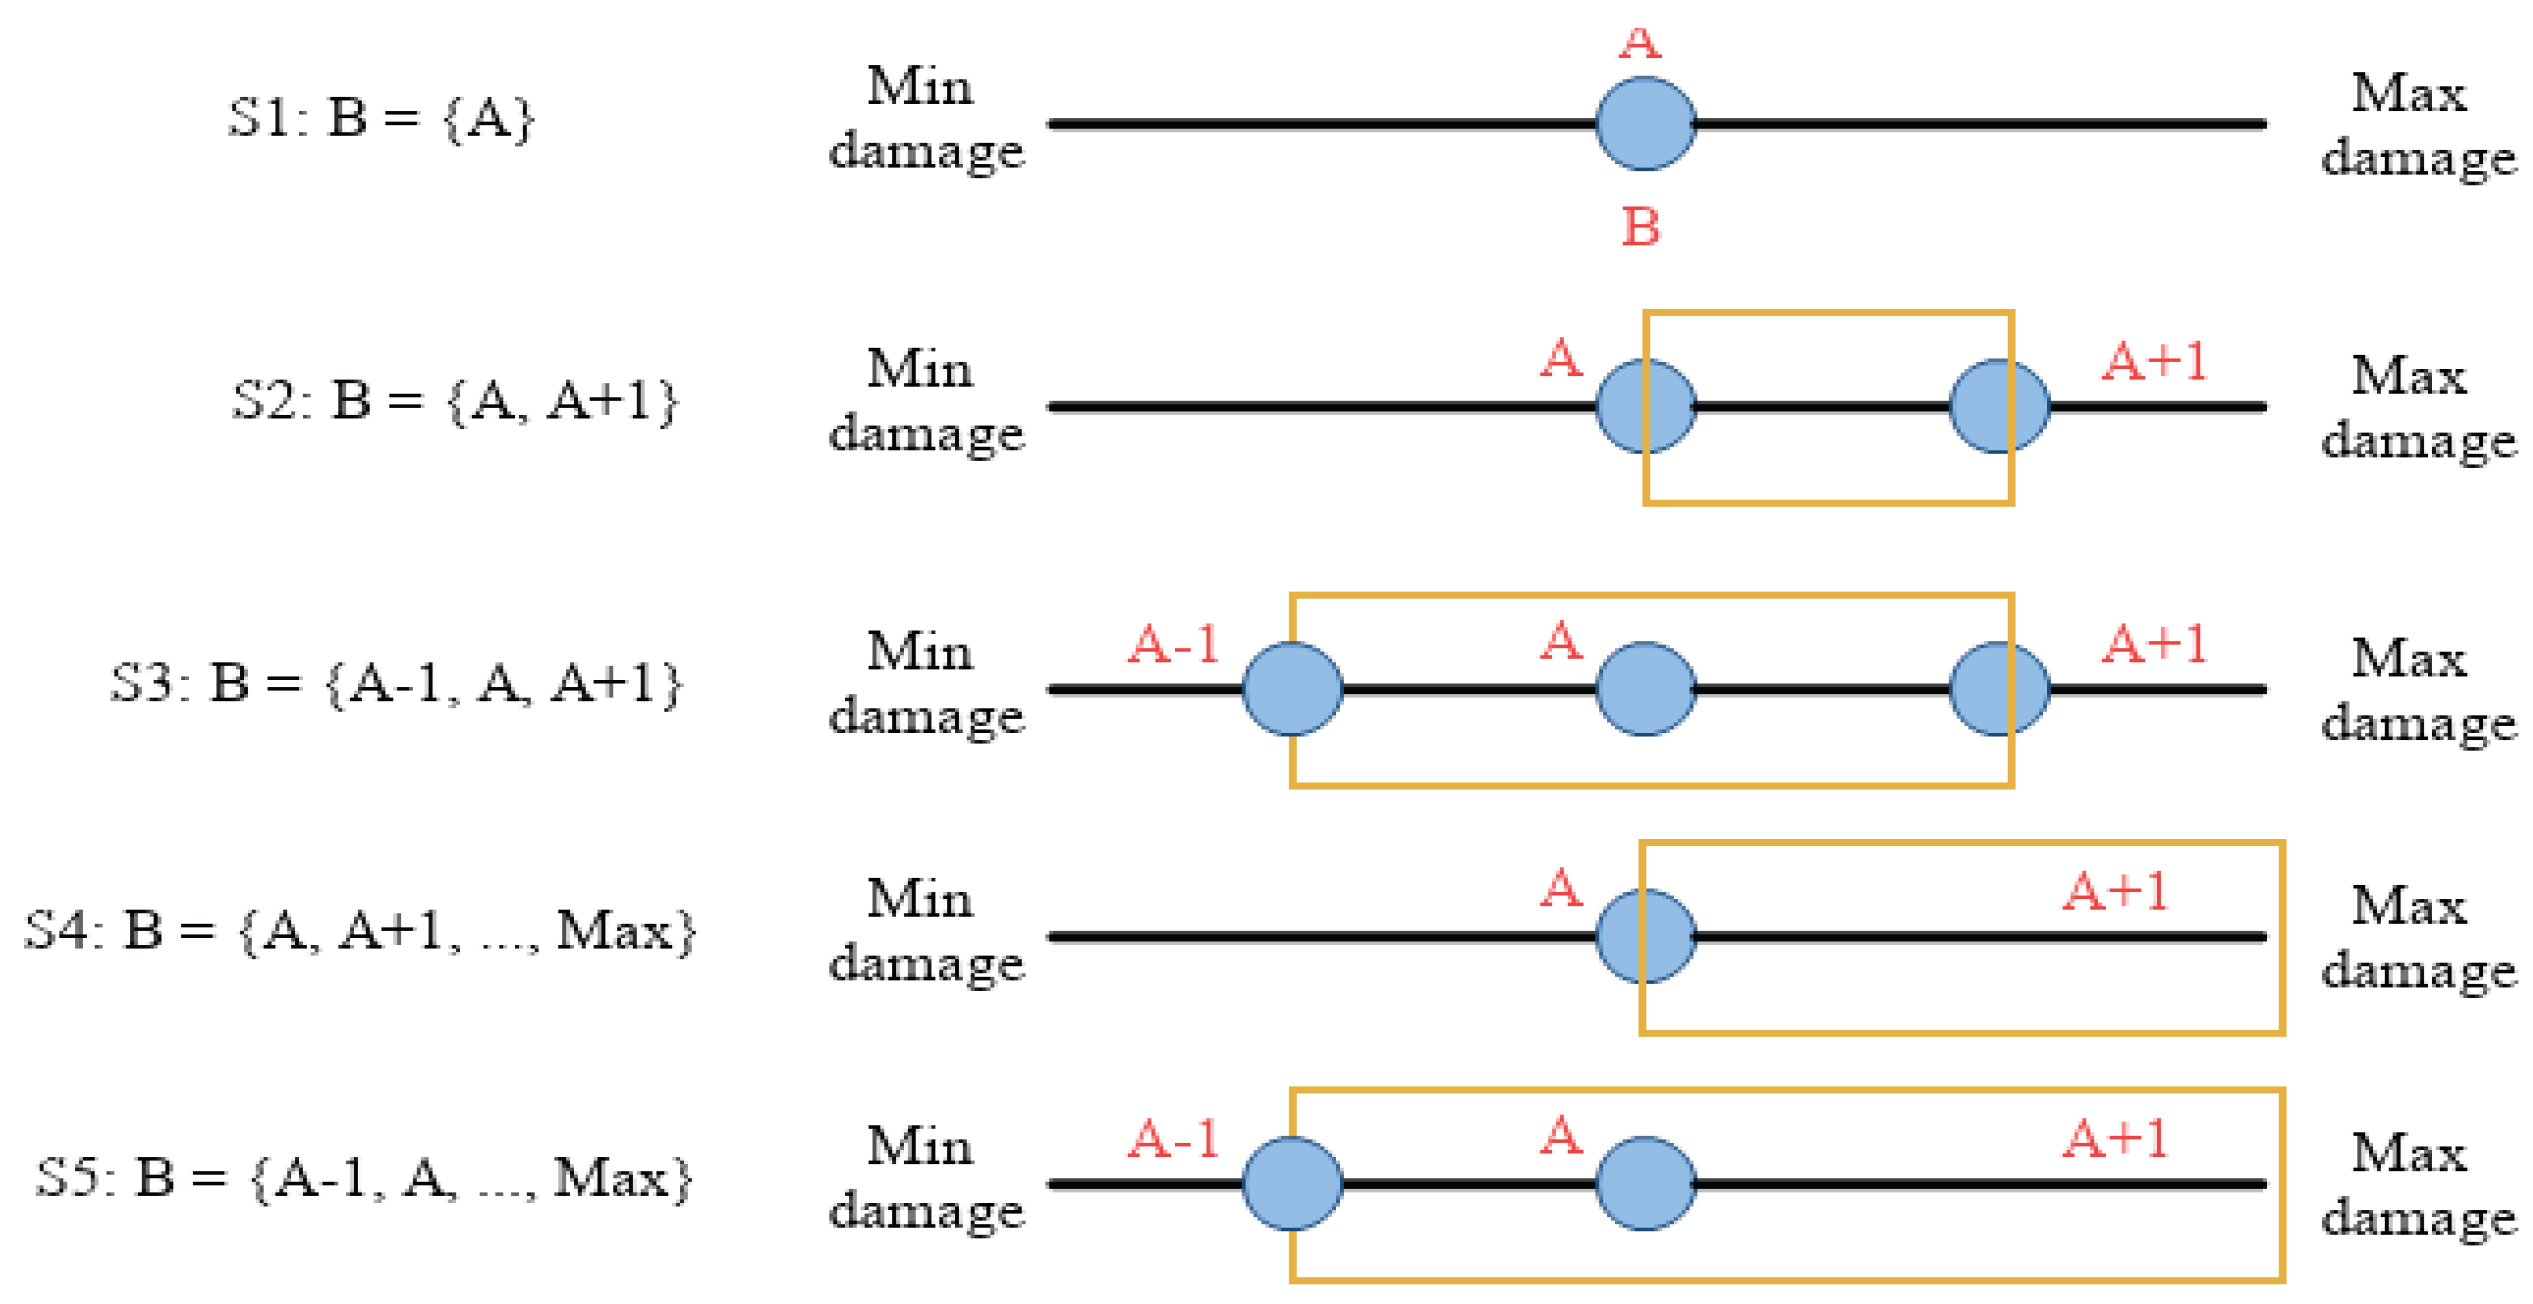
These requirements were called similarities in this paper, which are as follows:
Similarity 1: Number of buildings in RVS methodology giving exact damage as that of actual damage.
Similarity 2: Number of buildings in RVS methodology giving exact damage as that of actual damage + number of buildings with one-step severe damage. For example, if actual damage was four and RVS methodology gave three, which was one step more severe than four, that will also be counted in this similarity.
Similarity 3: Number of buildings in similarity 2 + number of buildings within one step damage. For example, if the actual damage was four and RVS methodology gave any of three, four, or five, then it will be counted in this similarity.
Similarity 4: Number of buildings in RVS methodology giving exact damage + number of buildings with more severe damage. For example, if actual damage was four and RVS methodology with four, three, two, and one, the damage state will be counted in this similarity.
Similarity 5: Number of buildings in similarity 4 + number of buildings with one step less severe or two steps more severe damage. For example, if actual damage was three and RVS methodology gave any of four, three, two, and one, then it will be counted in this similarity.
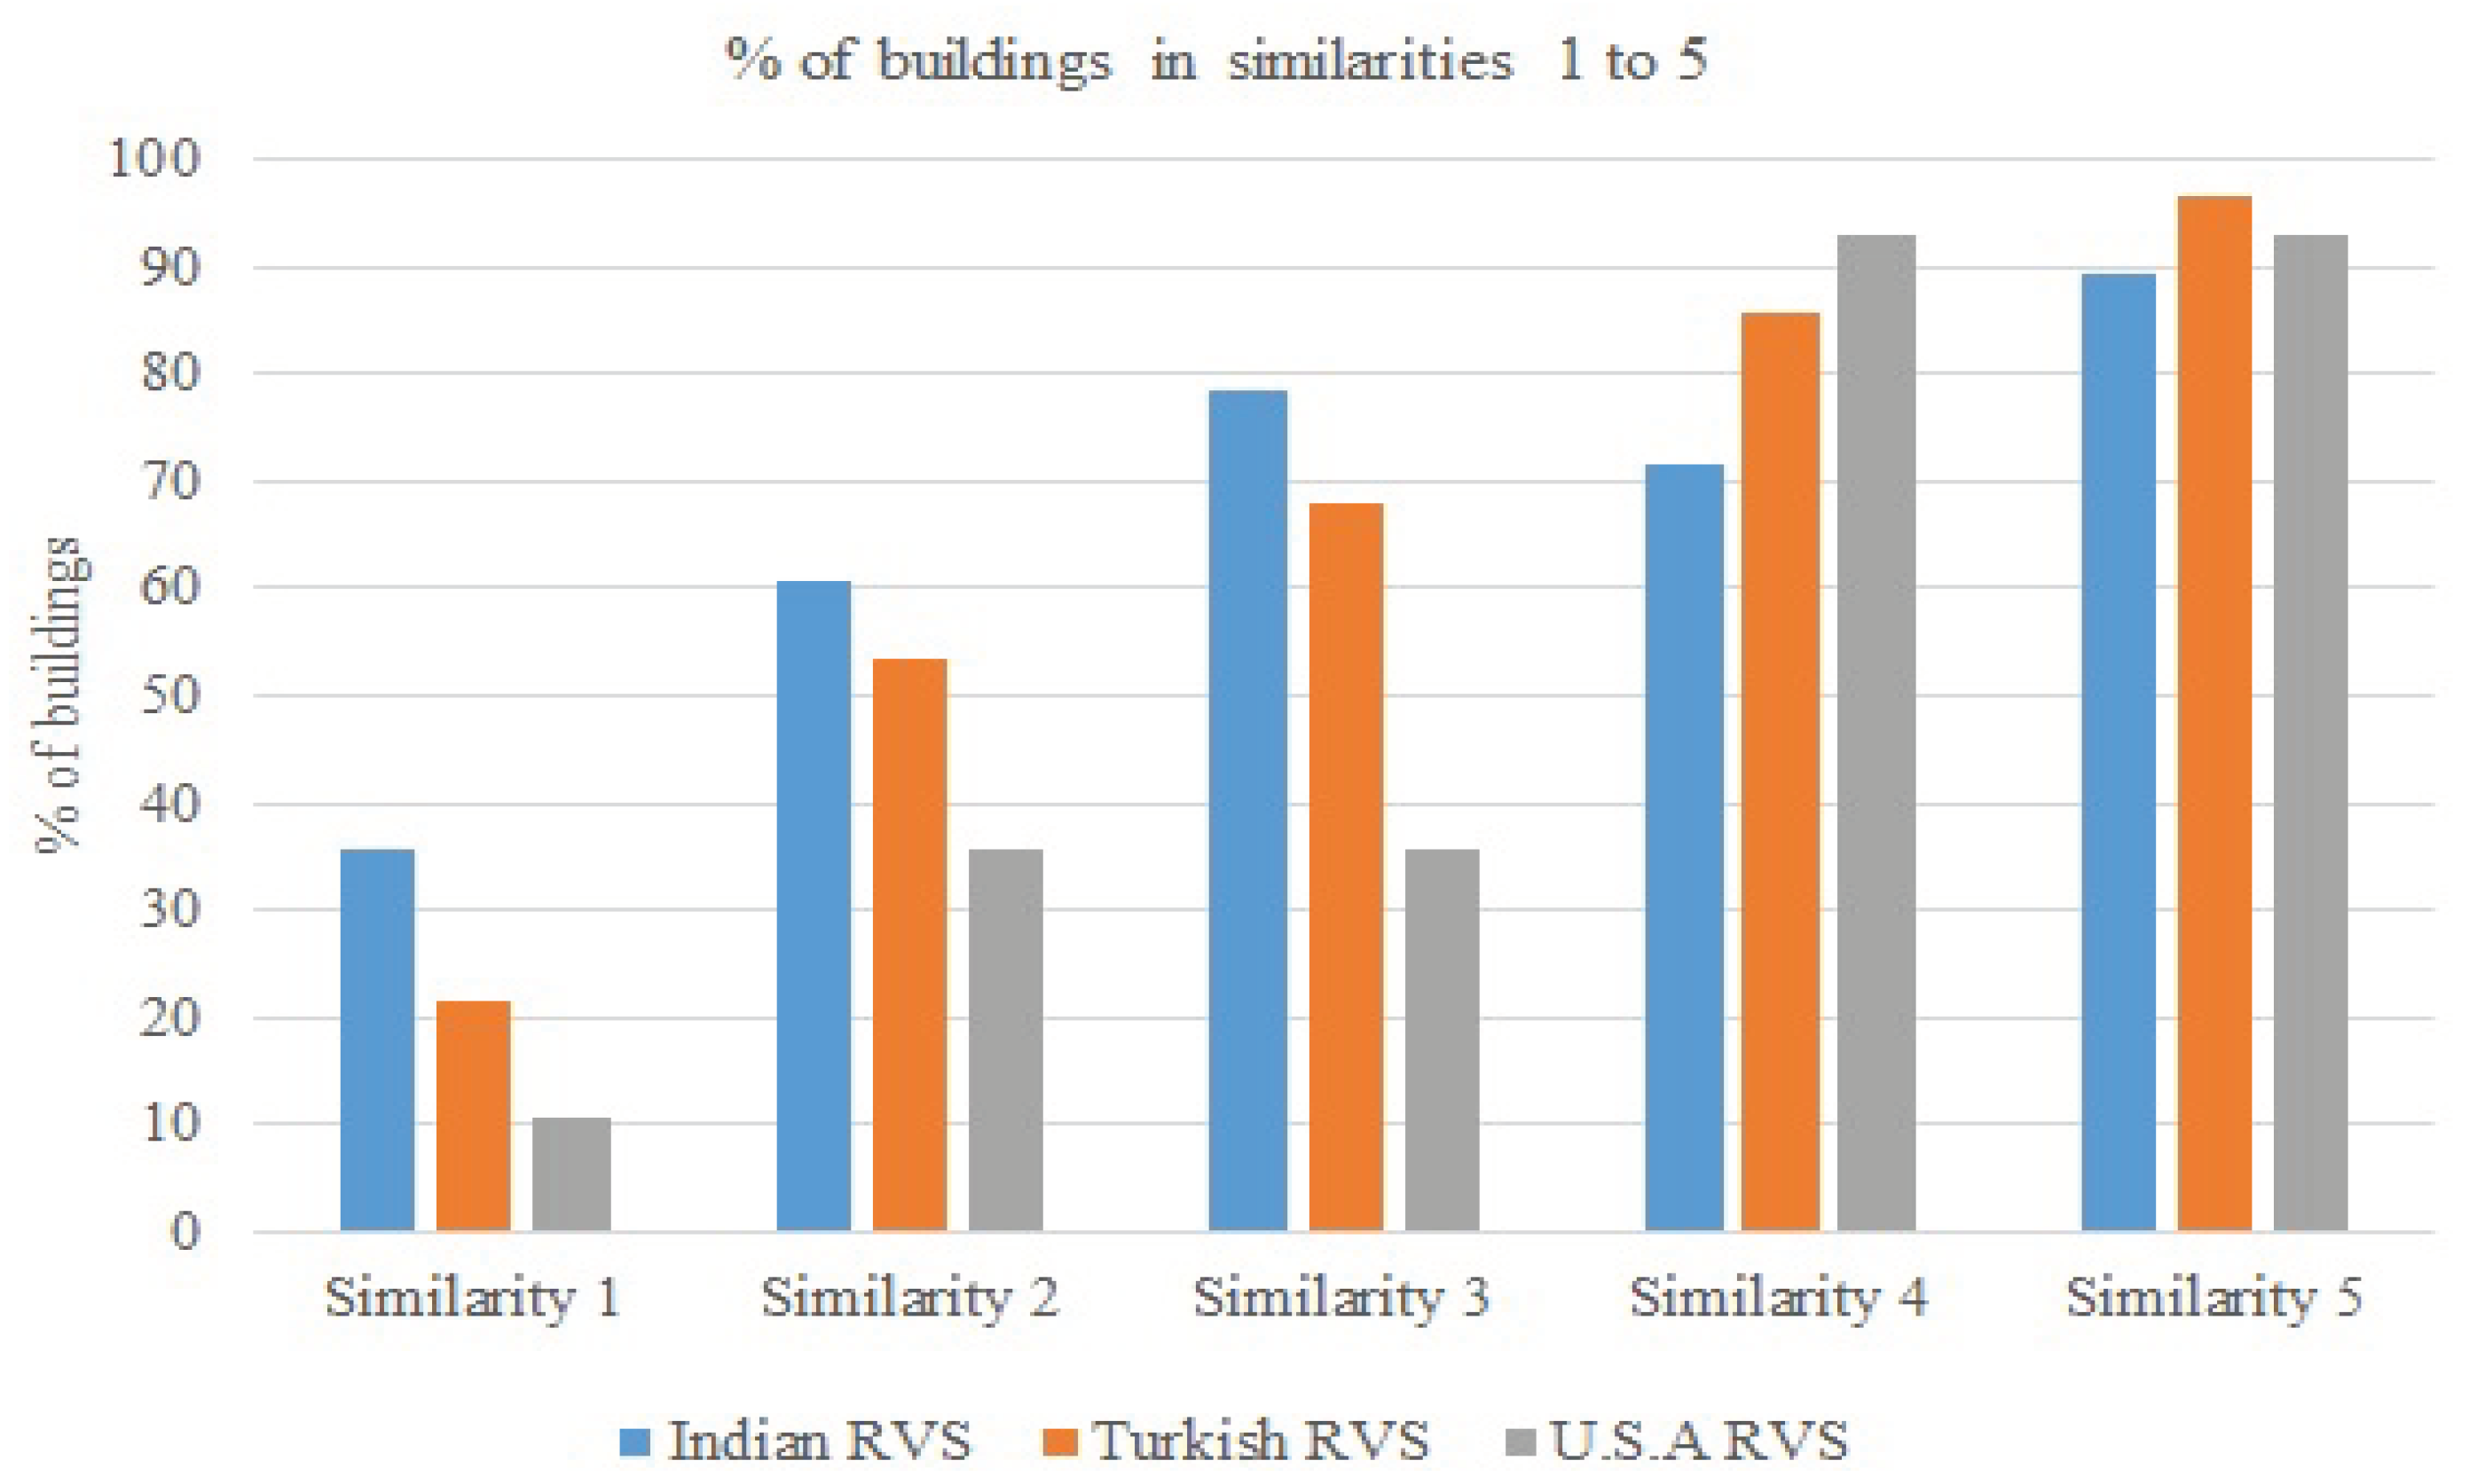
Figure 2 illustrates the set representation of each similarity where A indicates the actual damage, B is the RVS damage, or indicates the increase and decrease in damage, respectively. Achieving final decisions based on similarity 1 alone is not advisable, as the results may not always be exact. Similarity 4 should be considered if safety was of primary concern irrespective of cost and time it takes for a detailed assessment of more buildings. Similarity 2 and 3 provide closeness of RVS methodology to actual damage. Similarity 5 was performed only to check how many building estimates were inaccurate. As the results from similarity 5 are more than 90 percent of buildings, it has not been used for conclusion purposes. The results for all five similarities from three RVS methodologies are illustrated in Figure 3.
It has been inferred from the graph that in similarity 1, 2, and 3, Indian RVS presented a large amount of buildings as did Turkish RVS, but FEMA P-154 addressed a fewer number of buildings in the first three similarities. In similarity 4 and 5, FEMA P-154 assessed 93 percent of buildings, Turkish RVS addressed 80 percent of buildings, and Indian RVS presents a fewer number of buildings compared to the other two RVS methodologies shown in Figure 3.
It is clear that FEMA P-154 gives higher damage grade even for buildings with fewer negative influential parameters, although the damage may not be severe. On the other hand, in Indian RVS, similarity 2, 3, and 4 are close to each other with only 10 percent, indicating most of the buildings that were in similarity 4 were also in similarities to 2 and 3. This means Indian RVS provided closer results to the actual damage followed by Turkish RVS. It would be of interest to check the numbers of buildings categorized in damage state 1 by RVS methodologies before coming to a conclusion. This damage state included both damage grades 1 and 2, and hence, the damage state 1 from RVS methodologies will be compared against grades 1 and 2 of actual damage. The RVS methodology with the most accurate assessments of damage versus actual damage can be considered the most efficient methodology.
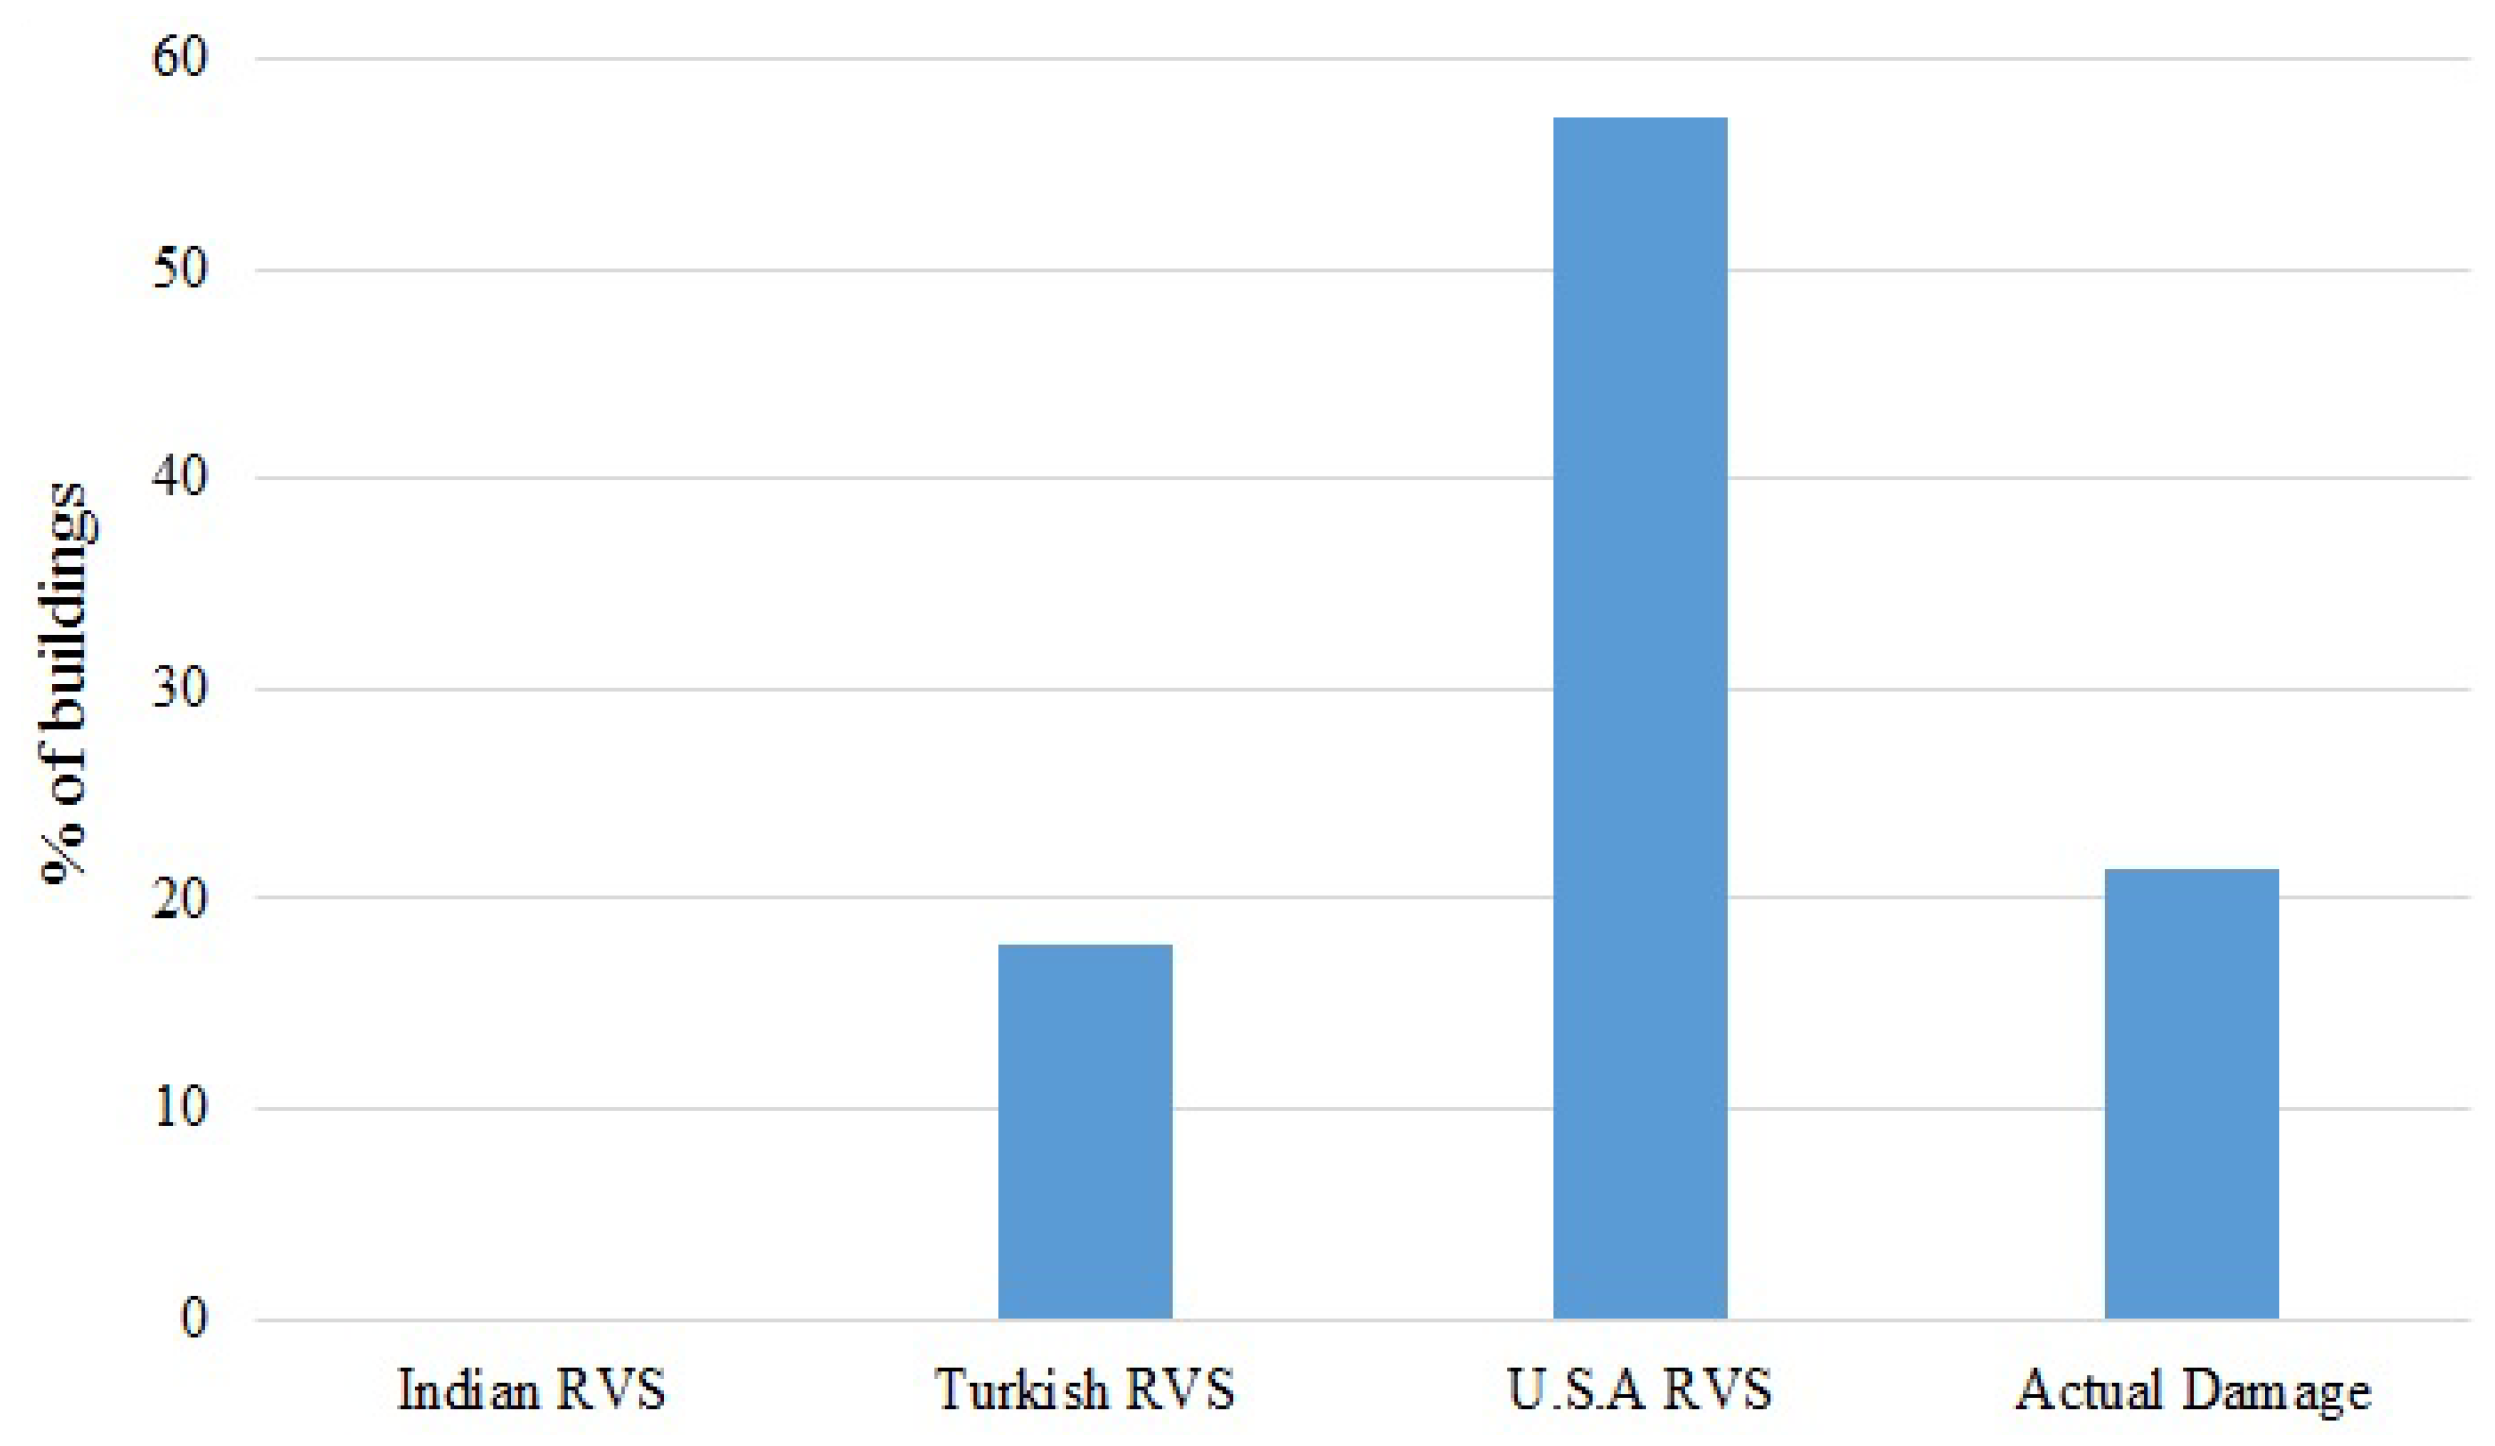
Figure 4 shows a clear trend that FEMA P-154 estimated almost 58 percent of buildings as damage state 1, which was not appropriate in consideration, as there were fewer buildings that showed state 1 and 2 in the actual damage data. Meanwhile, Indian RVS did not estimate any building as damage state 1, which is also not acceptable as there are fewer buildings having damage grade 1 and 2 in the actual building data. Moreover, Turkish RVS provided around 17 percent of buildings as damage state 1, which can be accepted, as around 20 percent of buildings were actual damage state 1 and 2.
According to the similarity level, although Indian RVS is significant, it can be highlighted from Figure 4 that Indian RVS might not be considered as a suitable method since it did not classify any building in damage state 1. It is very hazardous for health safety if a building can suffer more severe damage but has been estimated as a moderate or lighter damageable building. For this reason, the Turkish method can be preferred among the three RVS methodologies and also in similarities, as Turkish RVS was close to the results of Indian RVS. However, the RVS methodologies may not give the same damage as that of the actual damage; hence, the best method must be selected based on the requirement of the user.
5. Conclusions
In this study, three alternative approaches are presented to estimate potential seismic damage to existing reinforced concrete buildings in Bingöl in Turkey. To assess the damage estimations obtained from these three methods, the results are expressed in terms of structural damage state and practically compared with each other and the actual observed damage. From the results of this study, it can be determined that the Turkish RVS (EMPI) have significant efficiency in evaluating the vulnerability of buildings in Bingöl region. This can be expected as the RVS methods were modified according to the respective regions/countries. Although the Indian RVS was more significant than Turkish RVS, it did not estimate any buildings in damage state 1. In further studies, it is essential to check if Indian RVS gives similar results for the building in India as well. If so, it is highly risky to use the Indian RVS. Surprisingly, although it served as a basis for the Indian and Turkish RVS methodologies, FEMA P-154 was the method with the most overestimation during damage evaluations. This indicates that FEMA P-154 uses safety factors more than necessary. In future studies, it should be checked if the results from FEMA P-154 will be similar, if the RVS is performed on the buildings in America. In brief, this is an essential finding in the understanding of the applicability of the RVS methodologies to evaluate the building’s vulnerability. Although the study found evidence of the applicability of RVS within the study area, from the collected data, it was not possible to determine if it is valid for several building types, various soil conditions, and a different seismic zone. Further studies in this area may include more building databases, different building types, and seismic zones. For more accurate results, it would be suggested for further studies to perform the comparison of RVS methods by considering buildings from different countries/regions.
Author Contributions
Conceptualization, E.H. and T.L.; methodology, E.H. and K.M.; validation, T.L. and E.H.; formal analysis, E.H. and K.M.; investigation, E.H. and K.M.; resources, S.B.; data curation, S.B. and K.M.; writing—original draft preparation, E.H., S.B. and K.M.; writing—review and editing, E.H. and A.M.; visualization, K.M.; supervision, E.H., T.L. and A.M.; project administration, E.H. and T.L; funding acquisition, T.L.; All authors have read and agreed to the published version of the manuscript.
Funding
The part-time funding of the main author through the German Academic Exchange Service (STIBET) is highly acknowledged.
Acknowledgments
We are thankful to team members of the Middle East Technical University (METU) who provided the data that greatly assisted the research. Also, the authors appreciate the technical support of Mojtaba Shahraki, Mahdi Faramarzi, and Zouhour Jaouadi. In addition, Mosavi would like to acknowledge his financial support from the Hungarian State and the European Union under the EFOP-3.6.1-16-2016-00010 project and the 2017-1.3.1-VKE-2017-00025 project.
Conflicts of Interest
The authors declare no conflict of interest.
References
- Coburn, A.W.; Spence, R.J.; Pomonis, A. Factors determining human casualty levels in earthquakes: mortality prediction in building collapse. In Proceedings of the 10th world conference on earthquake engineering, Rotterdam, The Netherlands, 19 July 1992; pp. 5989–5994. [Google Scholar]
- Arya, A.S.; Boen, T.; Ishiyama, Y. Guidelines for Earthquake Resistant Non-Engineered Construction; United Nations Educational, Scientific and Cultural Organization (UNESCO): Paris, France, 2014. [Google Scholar]
- Rojahn, C.; Poland, C.D.; Scawthorn, C. Rapid Visual Screening of Buildings for Potential Seismic Hazards: A Handbook; Homeland Security Dept, Federal Emergency Management Agency: Washington, DC, USA, 1988; Volume 21.
- NDMA. Seismic Vulnerability Assessment of Building Types in India; National Disaster Management Authority (NDMA): New Delhi, India, 2013.
- Alam, N.; Alam, M.S.; Tesfamariam, S. Buildings’ seismic vulnerability assessment methods: A comparative study. Nat. Hazards 2012, 62, 405–424. [Google Scholar] [CrossRef]
- Datta, T.K. Seismic Analysis of Structures; John Wiley & Sons: Hoboken, NY, USA, 2010. [Google Scholar]
- Shah, M.F.; Ahmed, A.; Kegyes, G.; Al-Ghamadi, A.; Ray, R.A. A Case Study Using Rapid Visual Screening Method to Determine the Vulnerability of Buildings in Two Districts of Jeddah, Saudi Arabia. In Proceedings of the 15th Int. Symp. on New Technologies for Urban Safety of Mega Cities in Asia, Tacloban, Philippines, 7–9 November 2016. [Google Scholar]
- Kapetana, P.; Dritsos, S. Seismic assessment of buildings by rapid visual screening procedures. WIT Trans. Built Environ. 2007, 93, 409–418. [Google Scholar] [CrossRef] [Green Version]
- Ramancharla, P.K.; Chenna, R.; Goud, S.S.; Sreerama, A.K.; Vignesh, G.; Sattar, B.; Bodige, N.; Velani, P.; Sangem, R.; Babu, K. Rapid Visual Screening for Seismic Evaluation of Existing Buildings in Himachal Pradesh; Centre for Earthquake Engineering International Institute of Information Technology: Hyderabad, India, 2014. [Google Scholar]
- Ruggieri, S.; Porco, F.; Uva, G. A practical approach for estimating the floor deformability in existing RC buildings: Evaluation of the effects in the structural response and seismic fragility. Bull. Earthq. Eng. 2019, 18, 1–31. [Google Scholar] [CrossRef]
- Silva, V.; Akkar, S.; Baker, J.; Bazzurro, P.; Castro, J.M.; Crowley, H.; Dolsek, M.; Galasso, C.; Lagomarsino, S.; Monteiro, R.; et al. Current Challenges and Future Trends in Analytical Fragility and Vulnerability Modeling. Earthq. Spectra 2019, 35, 1927–1952. [Google Scholar] [CrossRef]
- Işık, E. Consistency of the rapid assessment method for reinforced concrete buildings. Earthq. Struct. 2016, 11, 873–885. [Google Scholar] [CrossRef]
- Rapid Visual Screening of Buildings for Potential Seismic Hazards: A Handbook, 3rd ed.; FEMA P-154; Homeland Security Dept, Federal Emergency Management Agency: Washington, DC, USA, 2015.
- Yadollahi, M.; Adnan, A.; Zin, R. Seismic vulnerability functional method for rapid visual screening of existing buildings. Arch. Civ. Eng. 2012, 58, 363–377. [Google Scholar] [CrossRef] [Green Version]
- Jain, S.K.; Mitra, K.; Kumar, M.; Shah, M. A proposed rapid visual screening procedure for seismic evaluation of RC-frame buildings in India. Earthq. Spectra 2010, 26, 709–729. [Google Scholar] [CrossRef]
- Ningthoujam, M.C.; Nanda, R.P. Rapid visual screening procedure of existing building based on statistical analysis. Int. J. Disaster Risk Reduct. 2018, 28, 720–730. [Google Scholar] [CrossRef]
- Harirchian, E.; Harirchian, A. Earthquake Hazard Safety Assessment of Buildings via Smartphone App: An Introduction to the Prototype Features- 30. Forum Bauinformatik: von jungen Forschenden für junge Forschende: September 2018, Informatik im Bauwesen; Professur Informatik im Bauwesen, Bauhaus-Universität Weimar: Weimar, Germany, 2018; pp. 289–297. [Google Scholar] [CrossRef]
- Tesfamariam, S.; Liu, Z. Earthquake induced damage classification for reinforced concrete buildings. Struct. Saf. 2010, 32, 154–164. [Google Scholar] [CrossRef]
- Tesfamariam, S.; Saatcioglu, M. Seismic vulnerability assessment of reinforced concrete buildings using hierarchical fuzzy rule base modeling. Earthq. Spectra 2010, 26, 235–256. [Google Scholar] [CrossRef]
- Şen, Z. Rapid visual earthquake hazard evaluation of existing buildings by fuzzy logic modeling. Exp. Syst. Appl. 2010, 37, 5653–5660. [Google Scholar] [CrossRef]
- Perrone, D.; Aiello, M.A.; Pecce, M.; Rossi, F. Rapid visual screening for seismic evaluation of RC hospital buildings. In Structures; Elsevier: London, UK, 2015; Volume 3, pp. 57–70. [Google Scholar] [CrossRef]
- Coskun, O.; Aldemir, A.; Sahmaran, M. Rapid screening method for the determination of seismic vulnerability assessment of RC building stocks. Bull. Earthq. Eng. 2019, 18, 1–16. [Google Scholar] [CrossRef]
- Nanda, R.P.; Majhi, D.R. Review on Rapid Seismic Vulnerability Assessment for Bulk of Buildings. J. Inst. Eng. (India): Ser. A 2013, 94, 187–197. [Google Scholar] [CrossRef]
- Nanda, R.P.; Majhi, D.R. Rapid seismic vulnerability assessment of building stocks for developing countries. KSCE J. Civ. Eng. 2014, 18, 2218–2226. [Google Scholar] [CrossRef]
- Rai, D.C. Seismic Evaluation and Strengthening of Existing Buildings; IIT Kanpur and Gujarat State Disaster Mitigation Authority: Gandhinagar, India, 2005; pp. 1–120. [Google Scholar]
- Criteria for earthquake resistant design of structures. In Part 1—General Provisions and Buildings, 5th ed.; Simco Printing Press: Delhi, India, 2002.
- Sinha, R.; Goyal, A. A national policy for seismic vulnerability assessment of buildings and procedure for rapid visual screening of buildings for potential seismic vulnerability. In Report to Disaster Management Division; Ministry of Home Affairs, Government of India: New Delhi, India, 2004. [Google Scholar]
- Ansal, A.; Özaydın, K.; Edinçliler, A.; Sağlamer, A.; Sucuoğlu, H.; Özdemir, P. Earthquake Master Plan for Istanbul; Metropolital Municipality of Istanbul, Planning and Construction Directorate, Geotechnical and Earthquake Investigation Department: Istanbul, Turkey, 2003.
- SERU. Middle East Technical University, Ankara, Turkey; Archival Material from Bingöl Database. Available online: http://www.seru.metu.edu.tr (accessed on 1 December 2019).
- Ozcebe, G.; Ramirez, J.; Wasti, S.T.; Yakut, A. May 2003 Bingöl earthquake engineering report. TUBITAK 2003, 1, 75–100. [Google Scholar]
- Ellul, F.; D’Ayala, D.; Calayir, Y. The 1st of May 2003, Bingol, Turkey, Earthquake, a Study of The Performance of the Building Stock. In Proceedings of the 13th World Conference on Earthquake Engineering, Vancouver, BC, Canada, 1–6 August 2004. [Google Scholar]
- Grünthal, G. European Macroseismic Scale 1998; European Seismological Commission (ESC): Luxembourg, 1998; Volume 15. [Google Scholar]
- Mohammad, K. Assessment of Decision Making Techniques for the Rapid Visual Hazard Evaluation of Existing Buildings. Master’s Thesis, Bauhaus-Universität Weimar, Weimar, Germany, 2017. [Google Scholar]
- Özhendekci, N.; Özhendekci, D. Rapid seismic vulnerability assessment of low-to mid-rise reinforced concrete buildings using Bingöl’s regional data. Earthq. Spectra 2012, 28, 1165–1187. [Google Scholar] [CrossRef]
- Harirchian, E.; Lahmer, T. Earthquake Hazard Safety Assessment of Buildings via Smartphone App: A Comparative Study. In IOP Conference Series: Materials Science and Engineering; IOP Publishing: Bristol, UK, 2019; Volume 652, p. 012069. [Google Scholar] [CrossRef]
- Soyluk, A.; Harmankaya, Z.Y. The History of Development in Turkish Seismic Design Codes. Int. J. Civ. Environ. Eng. 2012, 1, 25–29. [Google Scholar]
- Nagaraj, H.B.; Murty, C.V.R.; Jain, S.K. Review of Geotechnical Provisions in Indian Seismic Code IS: 1893 (Part 1): 2002; Technical Report, Report No. IITK-GSDMA-EQ13-V1. 0; Indian Institute of Technology: Kanpur, India, 2013. [Google Scholar]
- Bayhan, B.; Gülkan, P. Buildings subjected to recurring earthquakes: A tale of three cities. Earthq. Spectra 2011, 27, 635–659. [Google Scholar] [CrossRef]
- Özmen, B.; Nurlu, M.; Güler, H. Analysis of Earthquake Zones with Geographical Information System; Republic of Turkey Ministry of Public Works and Settlement, Disaster and Emergency Management Presidency, Earthquake Department: Ankara, Turkey, 1997.
- Ünal, S.; Çelebioğlu, S.; Özmen, B. Seismic hazard assessment of Turkey by statistical approaches. Turk. J. Earth Sci. 2014, 23, 350–360. [Google Scholar] [CrossRef]
- Patro, S.K.; Sahu, K.K. Normalization: A Preprocessing Stage. IARJSET 2015, 20–22. [Google Scholar] [CrossRef]
Figure 1.
Damage state of selected building data from RVS methodologies.

Figure 2.
Set representation of each similarity.

Figure 3.
Percentage of buildings in each similarity from RVS methodologies.

Figure 4.
Percentage of buildings in damage state 1 assessed by different RVS methodologies.


Table 1.
Range and median spectral response acceleration values in each seismic region [13].
Table 1.
Range and median spectral response acceleration values in each seismic region [13].
| Seismicity Region | Range of Response Values for Each Region | Median Response Values for Each Region | ||
|---|---|---|---|---|
| Low(L) | 0.2 | 0.08 | ||
| Moderate (M) | 0.4 | 0.16 | ||
| Moderately High (M) | 0.8 | 0.32 | ||
| High (H) | 1.2 | 0.48 | ||
| Very High (VH) | 2.25 | 0.9 | ||
Table 2.
Structural scores with damage potential [24].
Table 2.
Structural scores with damage potential [24].
| Rapid Visual Screening Score | Damage Potential |
|---|---|
| High probability of Grade 5 damage; Very high probability of Grade 4 damage | |
| High probability of Grade 4 damage; Very high probability of Grade 3 damage | |
| High probability of Grade 3 damage; Very high probability of Grade 2 damage | |
| High probability of Grade 2 damage; Very high probability of Grade 1 damage | |
| Probability of Grade 1 damage |
Table 3.
Seismic zone classification according to IS 1893:2002 (Part 1) [26].
Table 3.
Seismic zone classification according to IS 1893:2002 (Part 1) [26].
| Seismic Zone | Seismic Hazard Level |
|---|---|
| Zone II | Low seismic hazard (maximum damage during earthquake may be up to MSK intensity VI) |
| Zone III | Moderate seismic hazard (maximum damage during earthquake may be up to MSK intensity VII) |
| Zone IV | High seismic hazard (maximum damage during earthquake may be up to MSK intensity VIII) |
| Zone V | Very high seismic hazard (maximum damage during earthquake may be of MSK intensity IX or greater) |
Table 4.
Seismic zone intensity classification in the Earthquake Master Plan for Istanbul (EMPI) [28].
Table 4.
Seismic zone intensity classification in the Earthquake Master Plan for Istanbul (EMPI) [28].
| Seismic Intensity Zone | Peak Ground Velocity (PGV) |
|---|---|
| Zone I | cm/s |
| Zone II | cm/s |
| Zone III | cm/s |
Table 5.
Initial and vulnerability scores for concrete buildings given in EMPI [28].
Table 5.
Initial and vulnerability scores for concrete buildings given in EMPI [28].
| Story No. | Zone I | Zone II | Zone III | Soft Story | Heavy Overhang | Apparent Quality | Short Column | Pounding | Topographic Effects |
|---|---|---|---|---|---|---|---|---|---|
| 1, 2 | 90 | 125 | 160 | 0 | −5 | −5 | −5 | 0 | 0 |
| 3 | 90 | 125 | 160 | −10 | −10 | −10 | −5 | −2 | 0 |
| 4 | 80 | 100 | 130 | −15 | −10 | −10 | −5 | −3 | −2 |
| 5 | 80 | 90 | 115 | −15 | −15 | −15 | −5 | −3 | −2 |
| 6, 7 | 70 | 80 | 95 | 20 | −15 | −15 | −5 | −3 | −2 |
Table 6.
Vulnerability parameters in EMPI [28].
Table 6.
Vulnerability parameters in EMPI [28].
| Soft story | No (0); Yes (1) |
| Heavy overhangs | No (0); Yes (1) |
| Apparent quality | Good (0); Moderate (1); Poor (2) |
| Short columns | No (0); Yes (1) |
| Pounding effect | No (0); Yes (1) |
| Topographic effect | No (0); Yes (1) |
Table 7.
Collected information from a street survey performed by a Middle East Technical University (METU) research team [29,33].
| Building Information in Excel Sheet | Parameter in RVS Methodology |
|---|---|
| Building No. | Building ID |
| Damage state | Damage grade |
| Construction date | Year of construction |
| Ground floor + no. of normal floors | No. of floors |
| B1 & B2 | Weak/Soft story |
| B3 | Discontinuity of vertical structural elements |
| Is building on inclined surface? | Slope effect |
| story level with neighbors | Split levels |
| Ground story height not equal to normal story height | Different story heights |
| Short column | Short column |
| Is there a possibility of pounding? | Pounding effect |
| A1 | Torsion |
| A2 | Re-entrant corners |
| A3 | Beams do not align with columns |
| Structural system type | Building type |
| Are stories similar architecturally? | Overhangs |
| Apparent building quality | Apparent building quality |
| EMS 98 Damage Grade | Damage State |
|---|---|
| Grade 1 | 5 |
| Grade 2 | 4 |
| Grade 3 | 3 |
| Grade 4 | 2 |
| Grade 5 | 1 |
Table 9.
Distribution of parameters of the building database.
| Parameters | No. of Buildings | % of Buildings | |
|---|---|---|---|
| Building Type | C2 | 7 | 25 |
| C3 | 21 | 75 | |
| No. of stories | 2 | 2 | 7.14 |
| 3 | 7 | 25 | |
| 4 | 15 | 53.57 | |
| 5 | 4 | 14.28 | |
| Weak story/Soft story (B1 and B2) | 18 | 64.28 | |
| Discontinuity of vertical structural elements (B3) | 0 | 0 | |
| Slope | 9 | 32.14 | |
| Split levels (Story level) | 2 | 7.14 | |
| Large openings (dilatation) | 2 | 7.14 | |
| Different story heights | 17 | 60.71 | |
| Short columns | 4 | 14.28 | |
| Pounding (Neighbor) | 8 | 28.57 | |
| Torsional Irregularity (A1) | 19 | 67.85 | |
| Reentrant corner (A2) | 2 | 7.14 | |
| Diaphram openings (A2) | 2 | 7.14 | |
| Beams do not align with columns (discontinuity in plan)(A3) | 18 | 64.28 | |
| Non parallel systems (A4) | 1 | 3.57 | |
| Overhangs | 14 | 50 | |
| Apparent building quality | Good | 2 | 7.14 |
| Moderate | 11 | 39.28 | |
| Poor | 15 | 53.57 |
Table 10.
Percentage of buildings in selected building data in a certain damage state.
| Damage State 1 | Damage State 2 | Damage State 3 | Damage State 4 | Damage State 5 |
|---|---|---|---|---|
| 4% | 18% | 25% | 32% | 21% |
Table 11.
Ranges of scaled Rapid Visual Screening (RVS) results with damage state definition [33].
Table 11.
Ranges of scaled Rapid Visual Screening (RVS) results with damage state definition [33].
| Scaled RVS Results | Considered Integer for Damage State | Definition |
|---|---|---|
| 1–1.55 | 1 | Very high probability of Grade 5 and high probability of Grade 4 |
| 1.56–2.55 | 2 | moderate probability of Grade 4 and high probability of Grade 3 |
| 2.56– 3.55 | 3 | Very high probability of Grade 3 and little probability of Grade 2 |
| 3.56–4.55 | 4 | Very high probability of Grade 2 and little probability of Grade 1 |
| 4.56–5 | 5 | Little probability of Grade 2 and very high probability of Grade 1 |
© 2020 by the authors. Licensee MDPI, Basel, Switzerland. This article is an open access article distributed under the terms and conditions of the Creative Commons Attribution (CC BY) license (http://creativecommons.org/licenses/by/4.0/).
Share and Cite
MDPI and ACS Style
Harirchian, E.; Lahmer, T.; Buddhiraju, S.; Mohammad, K.; Mosavi, A. Earthquake Safety Assessment of Buildings through Rapid Visual Screening. Buildings 2020, 10, 51. https://doi.org/10.3390/buildings10030051
AMA Style
Harirchian E, Lahmer T, Buddhiraju S, Mohammad K, Mosavi A. Earthquake Safety Assessment of Buildings through Rapid Visual Screening. Buildings. 2020; 10(3):51. https://doi.org/10.3390/buildings10030051
Chicago/Turabian StyleHarirchian, Ehsan, Tom Lahmer, Sreekanth Buddhiraju, Kifaytullah Mohammad, and Amir Mosavi. 2020. "Earthquake Safety Assessment of Buildings through Rapid Visual Screening" Buildings 10, no. 3: 51. https://doi.org/10.3390/buildings10030051
Note that from the first issue of 2016, this journal uses article numbers instead of page numbers. See further details here.