A Fractal Model of Cracking of Cement Matrix Composites


Department of Materials Engineering and Technology of Building, Rzeszow University of Technology, 35-959 Rzeszow, Poland
Buildings 2020, 10(3), 52; https://doi.org/10.3390/buildings10030052
Submission received: 30 December 2019
/
Revised: 5 March 2020
/
Accepted: 9 March 2020
/
Published: 11 March 2020
(This article belongs to the Special Issue Advances in Sustainable Building Material Engineering)
Abstract
:The modern methods of materials (including cement matrix materials) design and testing impose the application of an approach appropriate to materials engineering. A quantitative description of the association between the properties of these materials and their structure is a necessity. What remains the scientific aim, however, is the clarification and description of the occurring phenomena by means of models mapping their actual behavior in the closest way possible. The article presents a cracking fractal model based on tests on the morphology of concrete fracture surfaces. The recorded fractal nature of the cracking of cement matrix materials enabled fractal geometry in the model development to be applied. Owing to the application of statistical analysis, together with an extensive base of data on the profile lines separated out of the real fracture surfaces of concrete, it was possible to develop a cracking fractal model. Not only does this model satisfy the condition of the equality of the fractal dimension of the real and model profile lines, it also offers the possibility of introducing an order to the apparently chaotic phenomena, such as the cracking process. An advantage and novelty of the model is that unlike the other authors’ proposals, there is a possibility of reaching an infinitely large number of solutions for model profile lines, which approximates the model to the real-life scenario. The results of fractal tests were supplemented with strength measurements, identifying concrete’s compressive and fracture toughness (determining the critical stress intensity factor KIcS). A connection between the fractal dimension and the investigated properties of concrete was demonstrated. A higher fractal dimension was observed in the profile lines separated out of the fracture surfaces of concretes of higher water–cement ratio. The advantages of the model include the simplicity and applicability in model studies on other materials of the cement matrix.
1. Introduction
Apart from the traditional approach appropriate for fractography to the analysis of the morphology of cement composites fracture surfaces or the lines separated out of them, attempts were made to use the possibilities offered by fractal geometry developed in the 1980s in research. The scientist regarded as the pioneer of the new branch of mathematics–fractal geometry is Benoit Mandelbrot, a French mathematician born in Warsaw in 1924. It is through Mandelbrot’s activities that a universal and, at the same time surprisingly simple, language for the description of complex forms occurring in nature. Fractal geometry provided an answer to the intricate description of the world around us, explaining, in a simple way, phenomena which were not only complex but also seemingly chaotic and random. Mandelbrot called the created forms fractals (Latin ‘fractus’, which means broken, divided, fractional, and the corresponding verb meaning to break and create irregular parts, ‘frangere’). It also turned out that the real objects, undefined in the Euclidean geometry, such as river networks, sea shores, the horizon, clouds, lightning, edges of leaves, animal tracks, blood vessel systems, are fractals. Fractals are structures:
- that do not have a distinctive and explicit shape, and the way they originated is described by a recursive dependency (Mandelbrot’s set, for instance),
- that are self-similar—when magnified, a part of fractal looks like the matrix, the original fractal,
- whose complexity level can be described by a fractal dimension [1]; assuming that a fractal in a set, its dimension inform one of how densely this set fills in the metric space in which it exists.
The length of both mathematical and real fractals is infinite. The history of the creation of mathematical fractals lies in repeating certain activities ad infinitum. This is why they cannot be seen in their final development, even using the fastest computers and monitors of the highest resolution for their visualization.
The possibilities offered by fractal geometry allow a better description of the world and the occurrence of physical phenomena. Fractal geometry is a development of the classical Euclidean geometry, limiting the concept of dimension to natural numbers. For example, in the Euclidean geometry, a one-dimensional line or 2D plane do not differ from a rough profile line or textured fracture surface, respectively, and yet the profile line fills in the space in which it is found better than the straight line, and a surface better fills in the space than a plane. The degree of complexity of a profile line and fracture surface can be reflected by the fractal dimension, which has a number between one and two for a profile line and a number from two to three for a fracture surface.
Fractal procedures enable the modeling and examination of the growth of bacteria or plants, description of chaotic processes (e.g. weather forecasting) or the analysis of the stock market. They are employed in genetic tests for the analysis of DNA chains and in music for the analysis of self-similar harmonic structures. They are also applied in chemistry, physics, medical science, biology, geography, epidemiology, geology, hydrology, and ecology, as well as materials engineering and building materials testing.
The studies on cement composites confirmed the fractal nature of the damage induced fracture surfaces. One of the reasons why researchers investigating cementitious materials took interest in fractal geometry was the desire to explain and describe the cracking phenomenon.
The first studies with the implementation of fractal geometry were published in 1985 and concerned cement paste [2], and since 1994 also concrete [3]. Winslow [2], who used Roentgen technique in his experiments, observed that the surface of hydrated cement paste is a fractal and that with the increase of water-cement ratio the fractal dimension decreases. Saouma and others [3] also demonstrated the multi-fractal character of concrete fractures. They stated that the fractal dimension in the microscopic scale is D = 1.2, that in the macroscopic scale is D = 1.1. Saouma and others [3] considered C–S–H as the basis for the determination of the minimal measurement step for the calculation of fractal dimension, adopting 10 µm.
Further studies indicated the fractal character of both the concrete microstructure (C–S–H phase, for example) and the system of pores in concrete [4,5,6,7,8,9,10,11].
The studies [4] that Diamond conducted on the basis of SEM images indicated the multi-fractal character of the pore system in concrete. For “small” steps (0.06–0.4 µm) the fractal dimension was D = 1.099, and for bigger steps (0.4–1 µm), D = 1.326. For hardened paste fractures, Wang and others [7] obtained two values of fractal dimension: at a smaller measurement step ~2.10–2.13, at a bigger one ~2.03.
Apart from their multi-fractal character, cement composites fractures exhibit the features of self-similarity. To a certain extent they are also self-affined [3,11]. To describe their roughness, the determination of the fractal dimension the divider method, inter alia, is employed.
Alongside the search for the relation between cement composites described with the fractal dimension and their characteristics [2,3,4,5,6,7,8,9,10,11,12,13,14,15,16,17,18,19,20], the search for a concrete cracking model mapping the real behavior of the cracking phenomenon remains topical.
The current extensive use of fractal geometry is observed in the analysis of the correlation between the microstructure of the materials of the cement matrix, including the pore structure, and the properties of these materials. As the authors of [21], inter alia, maintain, the fractal dimension describes the structure of a composite material so it has to be strictly connected with the macromechanical and transportation-related characteristics of a material. Researchers indicate a correlation between the microstructure of the materials of the cement matrix and their mechanical parameters, as well as the properties connected with water or aggressive media conveyance [21,22]. They also use fractal geometry in the modeling of the structure of these materials [23,24]. These are alternative approaches or complements of the results of, inter alia, porosimetry or stereological tests.
This paper presents a proposal of a fractal cracking model, based on the analysis of the statistical results of real-life fractal measurements performed on the profile lines, separated out of metakaolinite modified concrete fracture surfaces.
2. Materials and Methods
The experiments were conducted on concrete with the additive of metakaolinite (MK). The additive was used as a partial substitute for cement. Metakaolinite as an additive for concrete was and still is the subject of numerous studies [10,16,20,25,26,27,28,29,30,31,32,33,34,35,36,37,38]. The metakaolinite content referred to in the initial mass of cement was 8.5%. The concretes differed in the water/binder ratio (w/b), which was 0.35 and 0.54. These were extreme values in the tests previously conducted along an experiment central compositional plan on the properties of metakaolinite modified concretes presented in [10]. The concrete mixes compositions obtained after the experiment plan are tabulated in Table 1.
The tests were performed on the following components: Portland cement CEM I 32.5R, quartz sand to 2 mm with specific gravity of 2.65 kg/dm3, basalt grit to 16 mm with specific gravity of 3.06 kg/dm3 and metakaolinite (with 53% SiO2 and 42% Al2O3 content). To obtain metakaolin, which is a pozzolanic material, kaolinitic clay is calcinated at the temperature range between 550 °C and 800 °C. To receive the metakaolinite for the tests, kaolin was calcinated at ca. 800 °C, while its specific gravity was 2.54 kg/dm3. The size of the grains ranged from 0.1 µm to 100 µm, with predominant sizes of 1 µm to 10 µm (making up ca. 60%). The amount of grains of less than 1 µm was about 20%, while that of less than 17 µm was 90%.
The flow of 0.41 ± 0.03 m was obtained in the consistency tests, which were done on all the concrete mixes employing a flow table test. To achieve the constant consistency of the concrete mixes, superplasticizer FM-6 in the amount determined by the laboratory tests was used.
The strength tests were done after 28 days of curing the specimens, and kept in humid air (air relative humidity >95%). The tests included the specification of the compressive strength fc and critical stress intensity factor KIcS.
The specimens used in the compression tests were cubes of sides of 0.1 m. For the fc compression test, 14 such cubes were used.
The tests on fracture toughness were performed following the I model (bending tension) on beams of 0.08 × 0.15 × 0.70 m and the initial crack was 0.05 m long. The calculations of the critical stress intensity factor KIcS were done following [10,39]. During these tests the dependency of the loading force on the crack mouth opening displacement (CMOD) was observed. The calculations of the mean values of KIcS were based on four results.
The following expression (Equation (1)) was employed to calculate the critical stress intensity factor KIcS:
in which:
where: Pmax—maximum load, W0—specimen weight, S - support spacing, L—length of beam, d—depth of beam, b—width of beam, ac—critical effective crack length (all the values are expressed in Newtons or meters).
The critical effective crack length ac was calculated using the iteration after equation:
in which:
where: E—Young’s modulus, adopted on the basis of experiments and Cu—unloading compliance at 95% of peak load (value for 95% of peak load determined on the basis of equation for crack mouth opening displacement (CMOD)—load).
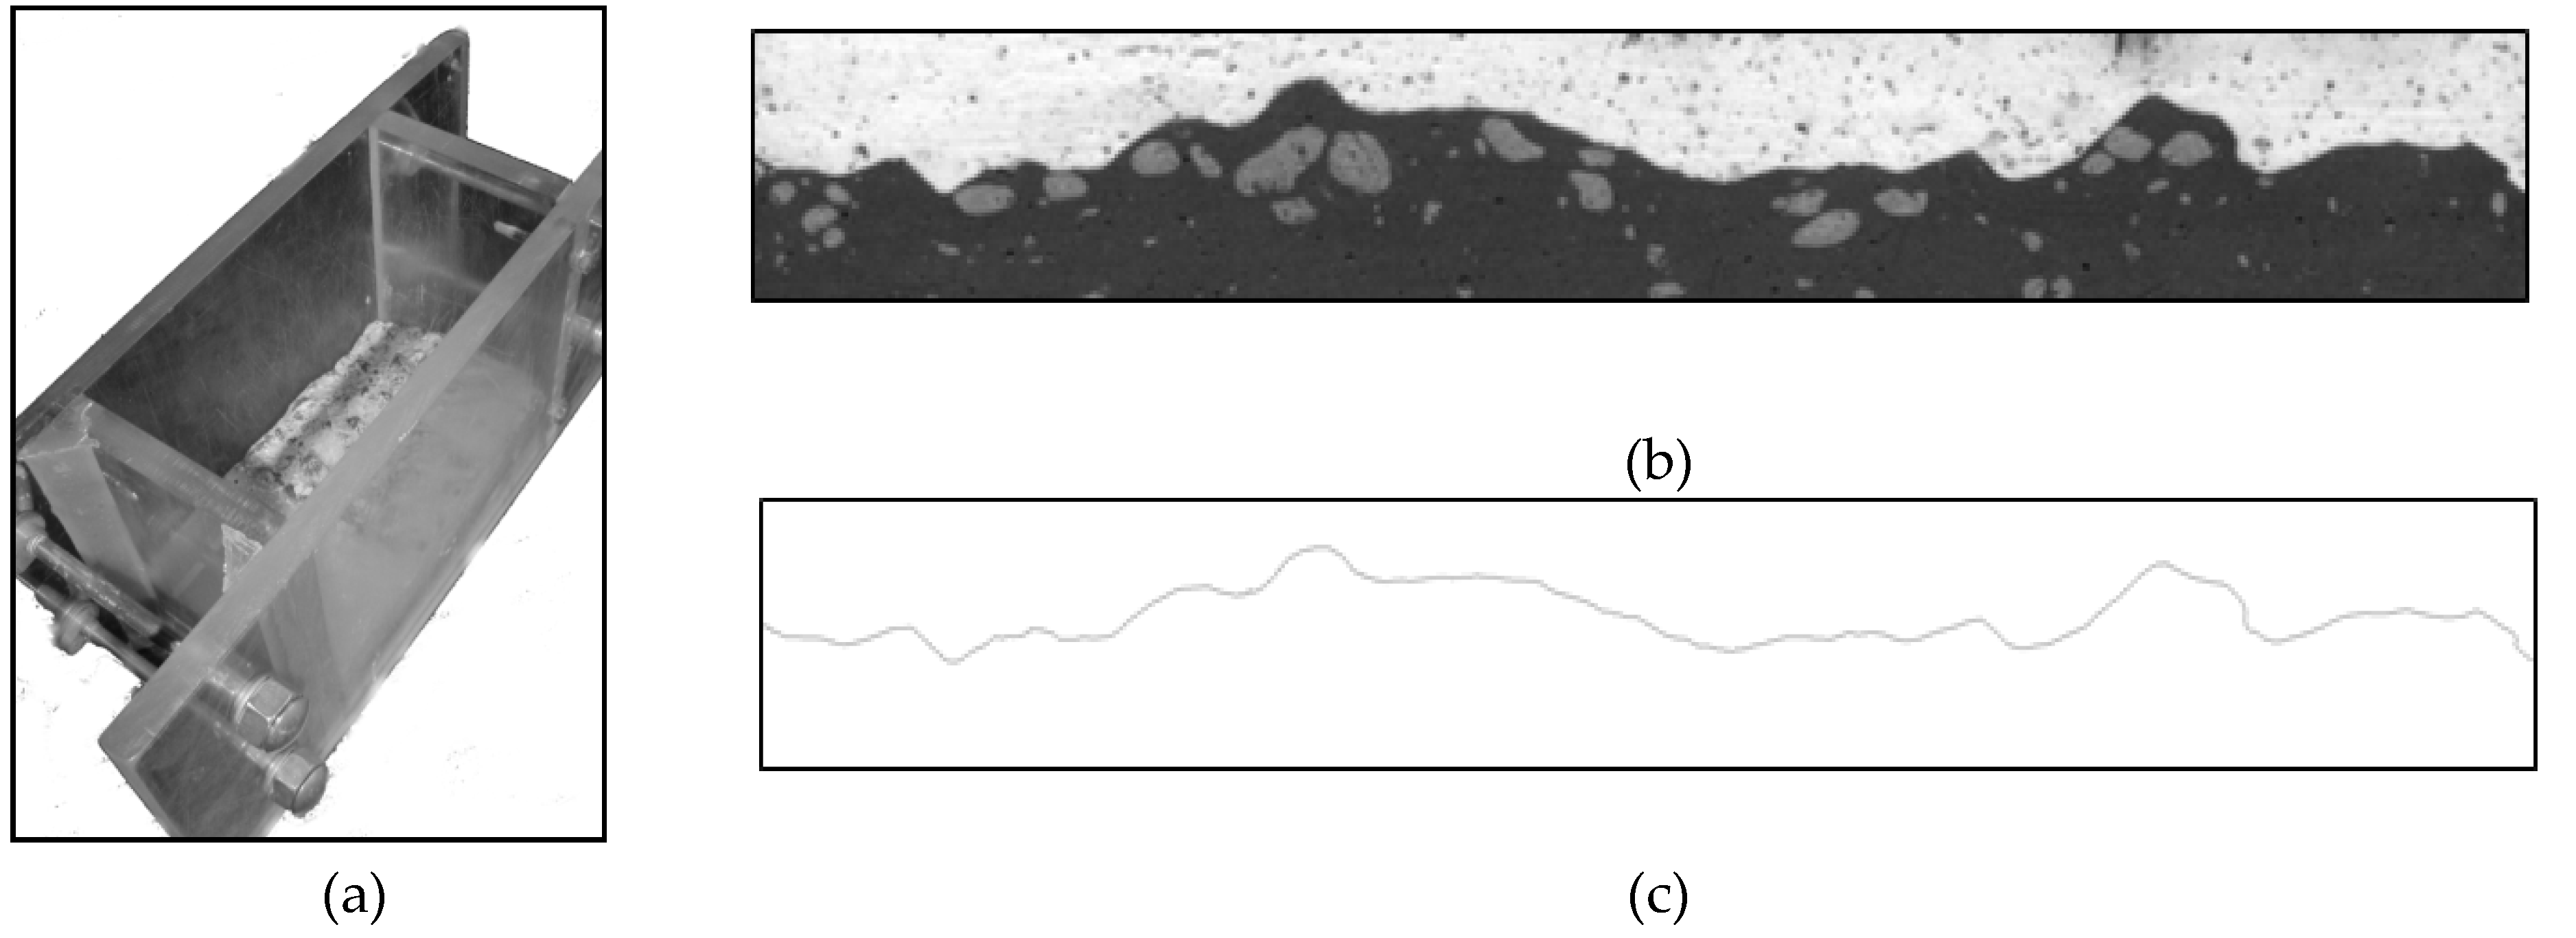
For the fractal tests, gypsum replicas of fracture surfaces, produced from white and dyed gypsum, were used (Figure 1). The replicas were cut along the longer edge of the block and the layers thus formed (Figure 1b) were scanned at the resolution of 600 dpi. The cutting direction overlapped that of the fracture development. The picture of the profile line, which is the line separating the white and contrasting gypsum layers, was achieved employing FRACTAL_Digit (J. Konkol, FRACTAL_Digit, a program, 2001) (see Figure 1c). The fractal dimension of the profile line DC was calculated by the divider method. FRACTAL_Dimension2D (J. Konkol, FRACTAL_Dimension2D, a program, 2000) was used to perform the fractal analysis of the concrete fracture surface profile lines. The fractal dimension was determined as a slope tangent in a bilogarithmic diagram of the relationship between the logarithm of the s step measured curve length and the logarithm of the length of step s.
Adopting the guidelines, presented in [40], on the number of profile lines necessary for the determination of the fractal dimension with a specified assessment error, an analysis was performed on twenty profile lines.
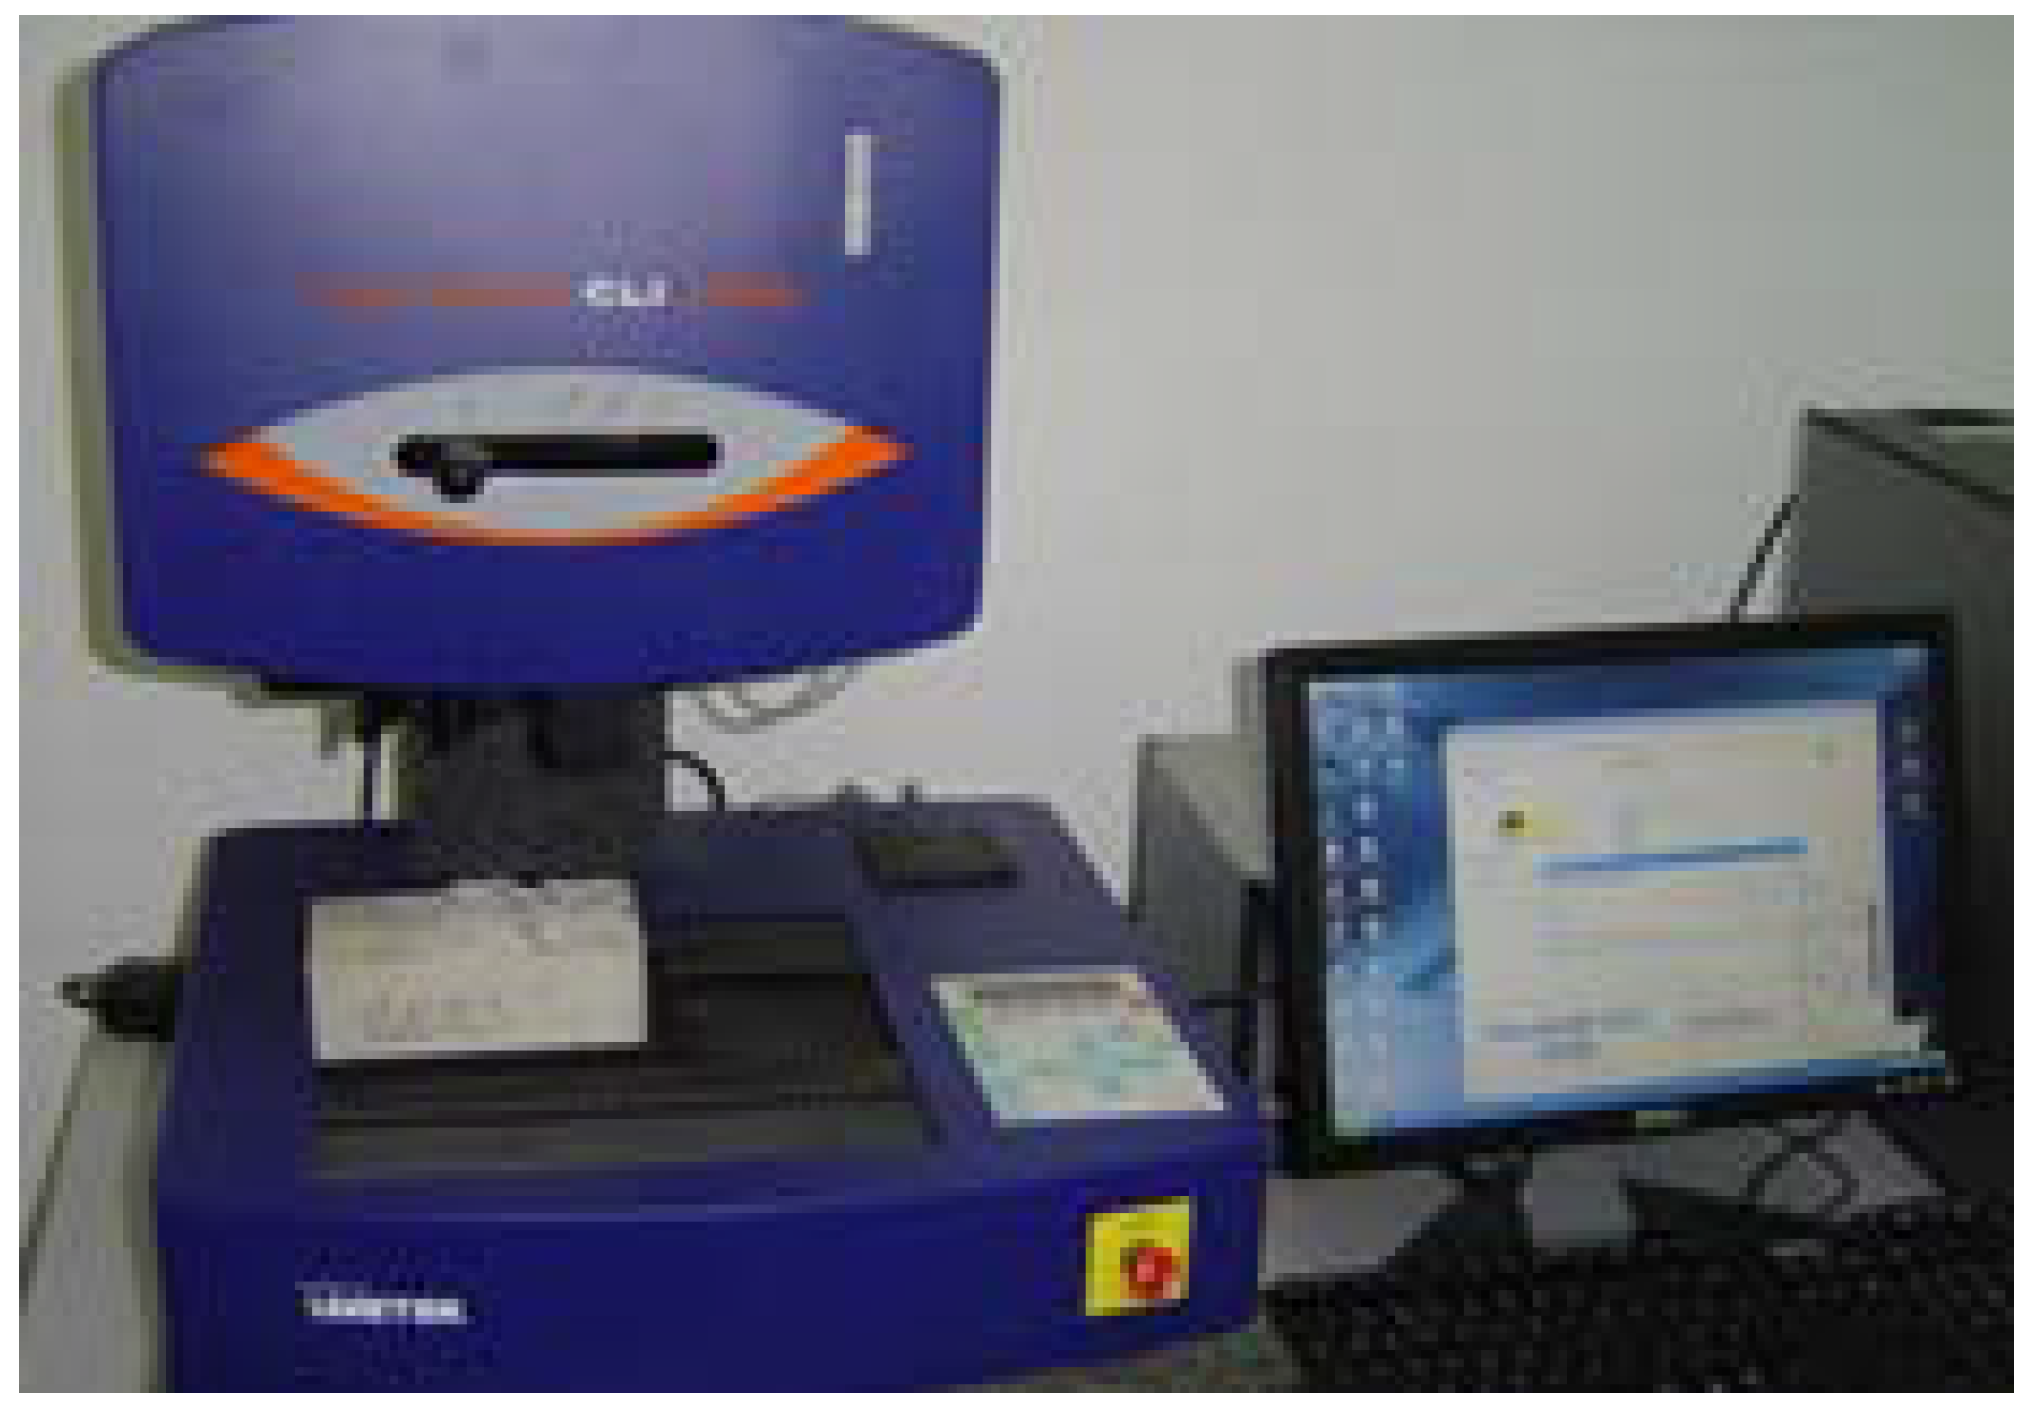
The analysis targeted at the development of fractal fracture model was done separately. The model was created on the basis of the analysis of over 300 profile lines obtained with the method of vertical sections, and separated out of the fracture surfaces of roasted kaolinite—metakaolonite (MK) modified concrete of different w/c ratio in the range of 0.35 to 0.54 and the MK content ranging from 2 to 15% compared with the initial cement mass. Finally, for the testing and verification of the model concrete fracture surfaces of w/c ratio of 0.35 or 0.54 and MK content of 8.5% of the initial cement mass were selected. For each concrete, eight fracture surfaces were selected at random, which was followed by separating out ten profile lines in each line. In total, the analysis was performed on a set of 160 profile lines. Each profile line was 8 cm long, and they were obtained by means of a laser profilometer (Figure 2) of the discretization step of 5 μm, which generated 16,000 points, making up each profile line.
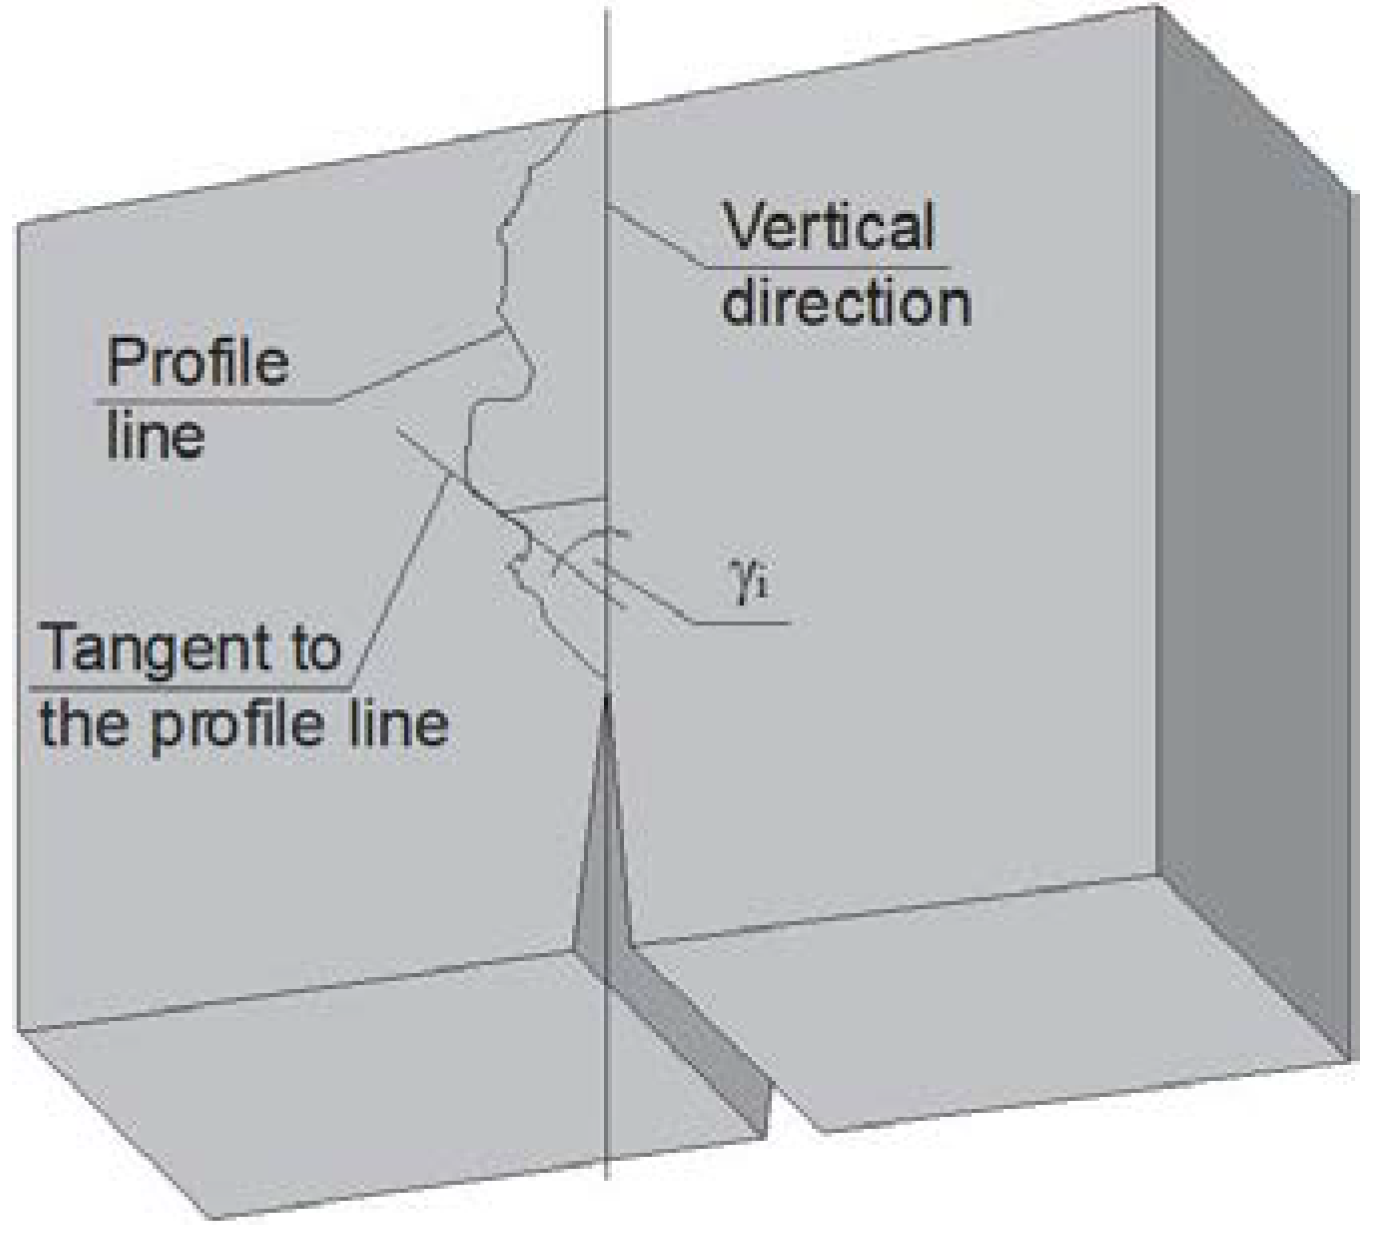
The data obtained from the measurements with laser profilometer were used for the determination of the fracture development direction. In actual practice, the fracture development direction was defined as an inclination angle to the vertical of a straight line identified on the basis of two adjacent points describing the profile line, which is shown in Figure 3.
3. Results
The results of tests on compressive strength, fracture toughness and the results of the fractal analyses of the profile lines are given in Table 2.
The results of the analysis of the profile lines obtained with the laser profilometer are discussed in the section that follows.
4. Fractal Model
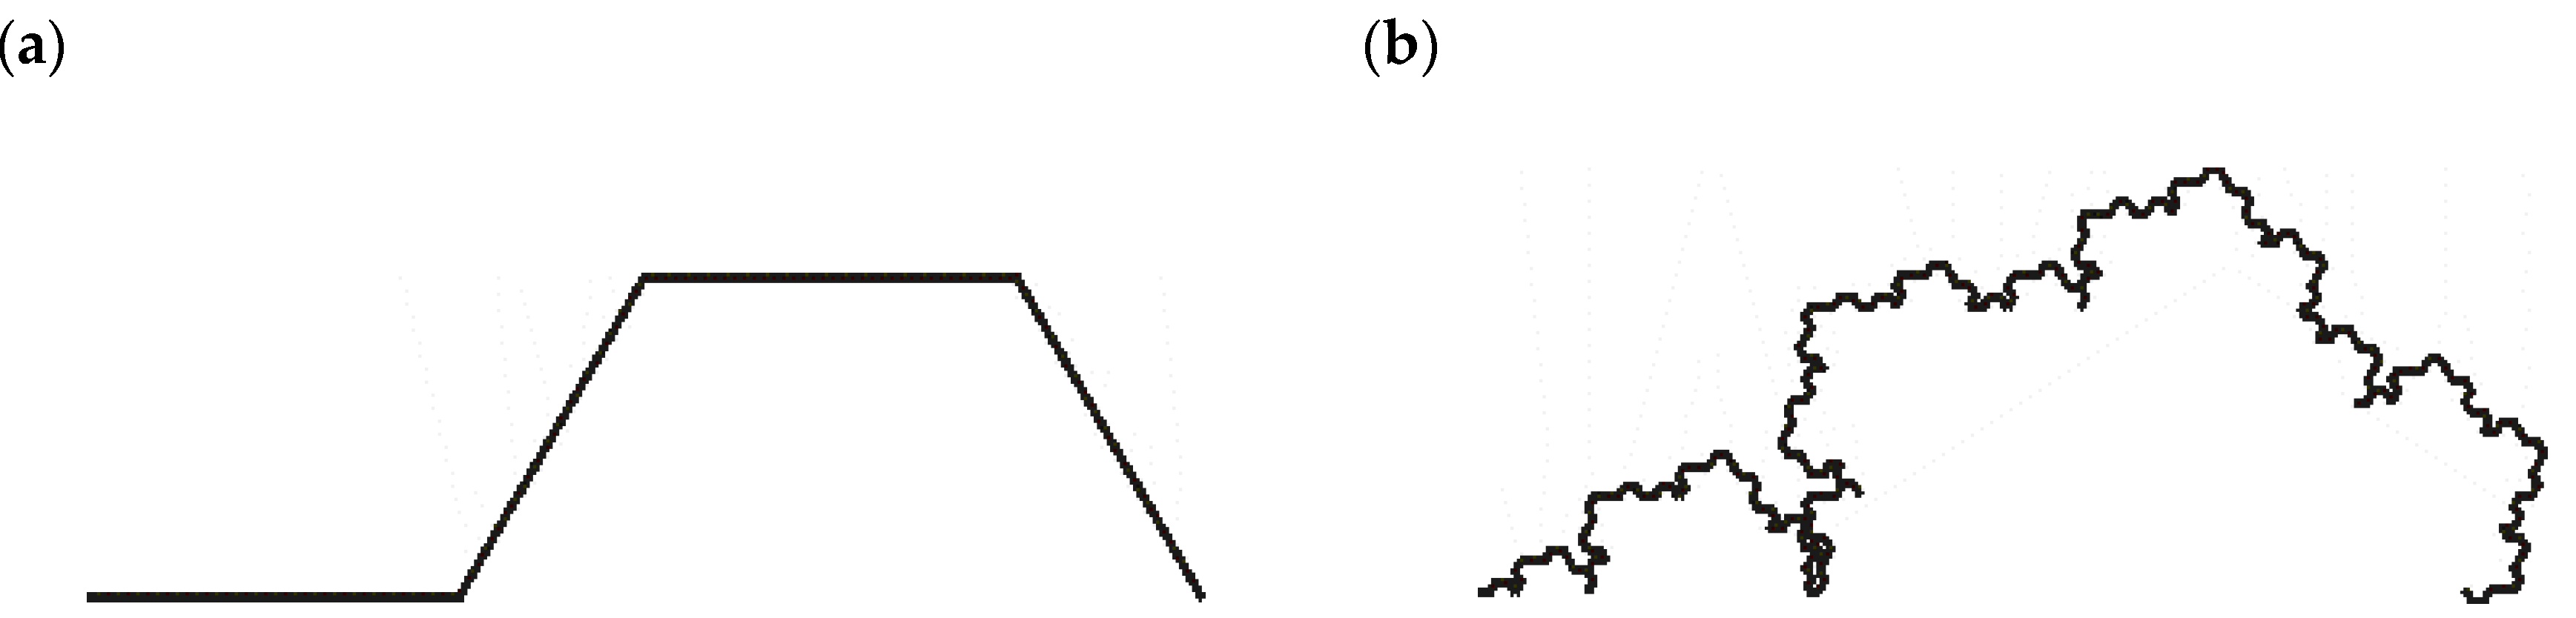
From the quantitative fractography perspective, the damage induced fracture is a geometric formation of complex topography, with irregularly distributed elements of various shape and dimension; monitoring the cracking process itself is very difficult. An attempt was made to simulate cracking and models describing the cracking process were developed [41,42,43,44,45,46]. An apparent similarity between the fracture and the fractal curve called Koch curve seemed to be found (Figure 4).
As follows from the very nature of the fractal geometry, the actual formation called a fractal of a very complicated shape can be described with a simple recursive formula or a graphical rule based on initiator and generator. For example, Mandelbrot set, which is a set of all the possible Julia sets, of an infinitely large number of details, is described by a single line recursive formula. Koch curve, on the other hand, is created by substituting the initiator which is a segment by a generator shown in Figure 4b. A generator imperatively requires each strip/segment to be divided into three parts, and the middle part to be replaced by the sides of an equilateral triangle. This is repeated ad infinitum.
A similar approach should be adopted to the problem of searching for a formula for the development of a model fracture, in, for instance, metakaolinite modified concrete. Looking for a formula in this case is the same as looking for a relevant generator.
It should, however, be remembered that the generator itself cannot be identified with the fracture shape in macro-scale. Such a procedure may result in grave errors. For example, in their analysis of the fractal character of concrete fracture surfaces, Chang and others [42] defined different types of fracture transfer through aggregate grain. Assuming a model shape of aggregate grains, one of the possible fractures was described with a generator shown in Figure 5a and the result obtained with an adopted generator in Figure 5b. The result clearly indicates that such fracture cannot be obtained in concrete or any other material either.
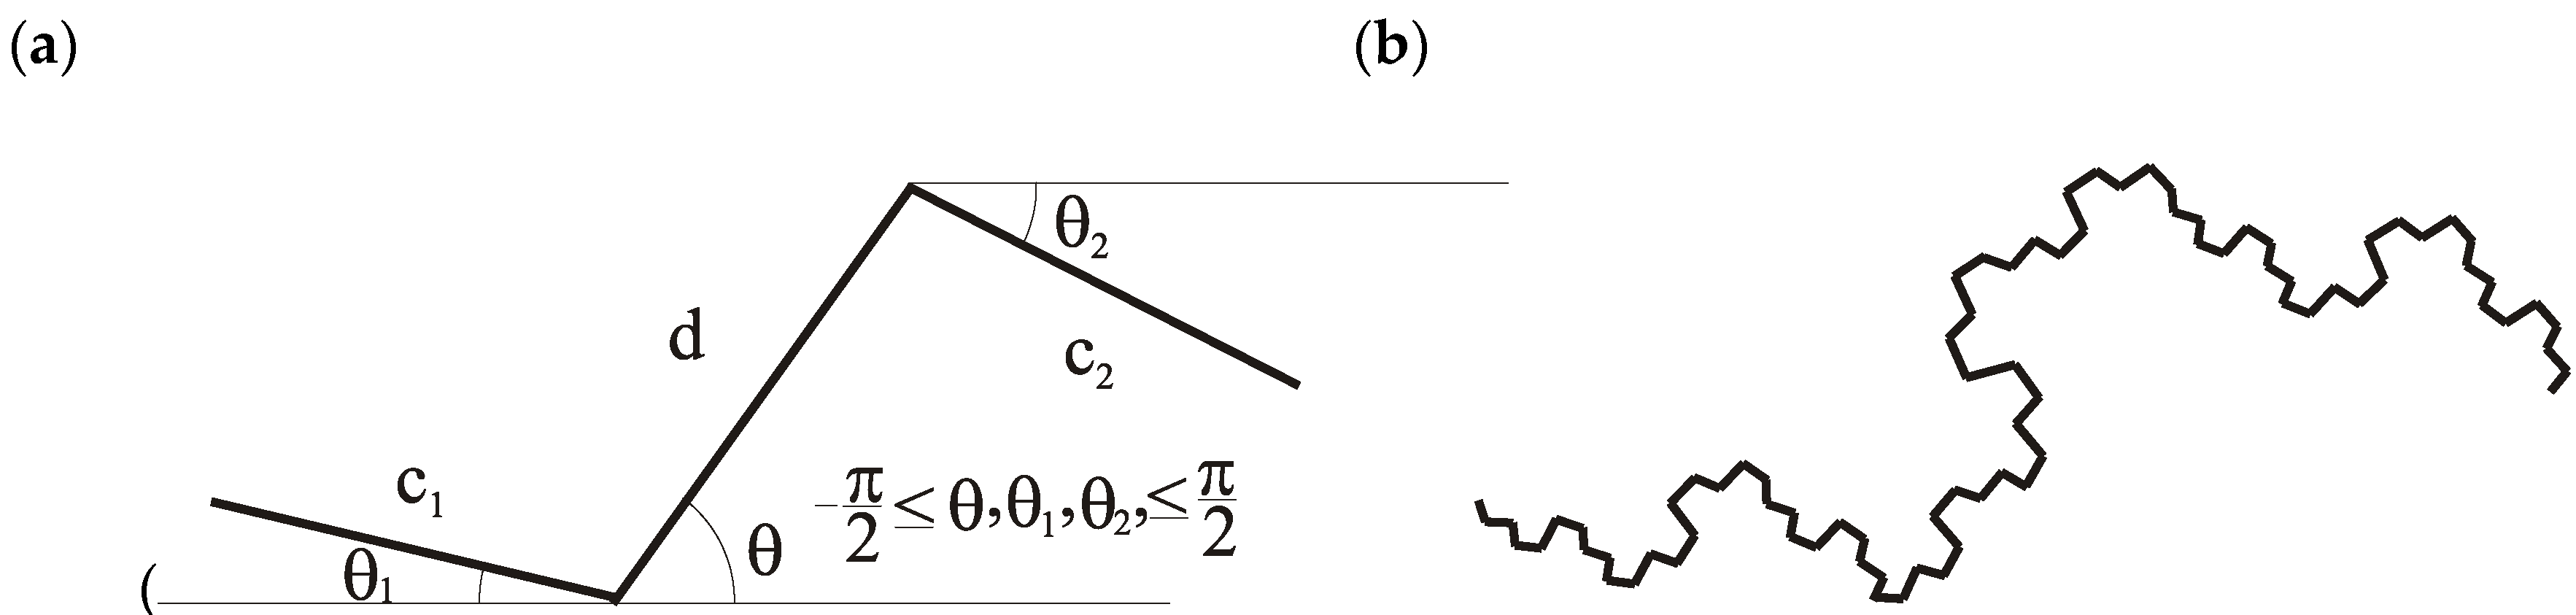
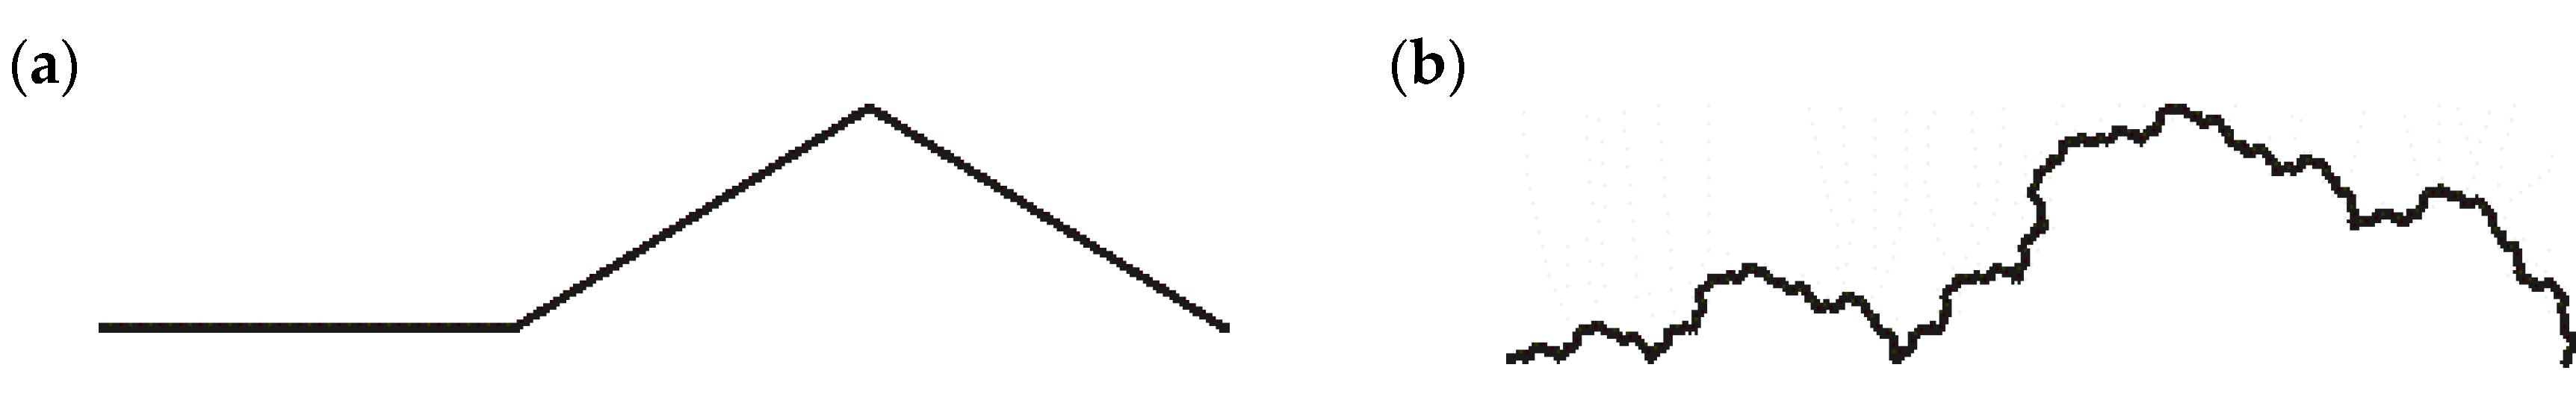
Other researchers addressed this problem, including Yan and others [46], Peng and others [44], Xie [45], Carpinteri and others [41]. For the statistical fractal model (Figure 6), Peng and others proposed [44] obtained a fractal dimension in the range of 1.17 to 1.27. Carpinteri and others [41] proposed the generator shown in Figure 6, but their fractal was obtained at angle θ of ca. 38°. The proposals of a generator most frequently concern two (Figure 7) or three strips, interconnected in different ways. Following the Koch curve, one of the concepts is shown in Figure 8.
In the first step of the creation of the cracking fractal model, an analysis of the shape of actual profile lines was performed. The analysis covered the specification of the fracture direction change, relative to the direction of the shortest distance identified, with the lowest energy output necessary for fracture to form. The changes of fracture development direction were determined based on angles γi between the tangent to the profile line at a given point and the direction of the shortest distance (Figure 3).
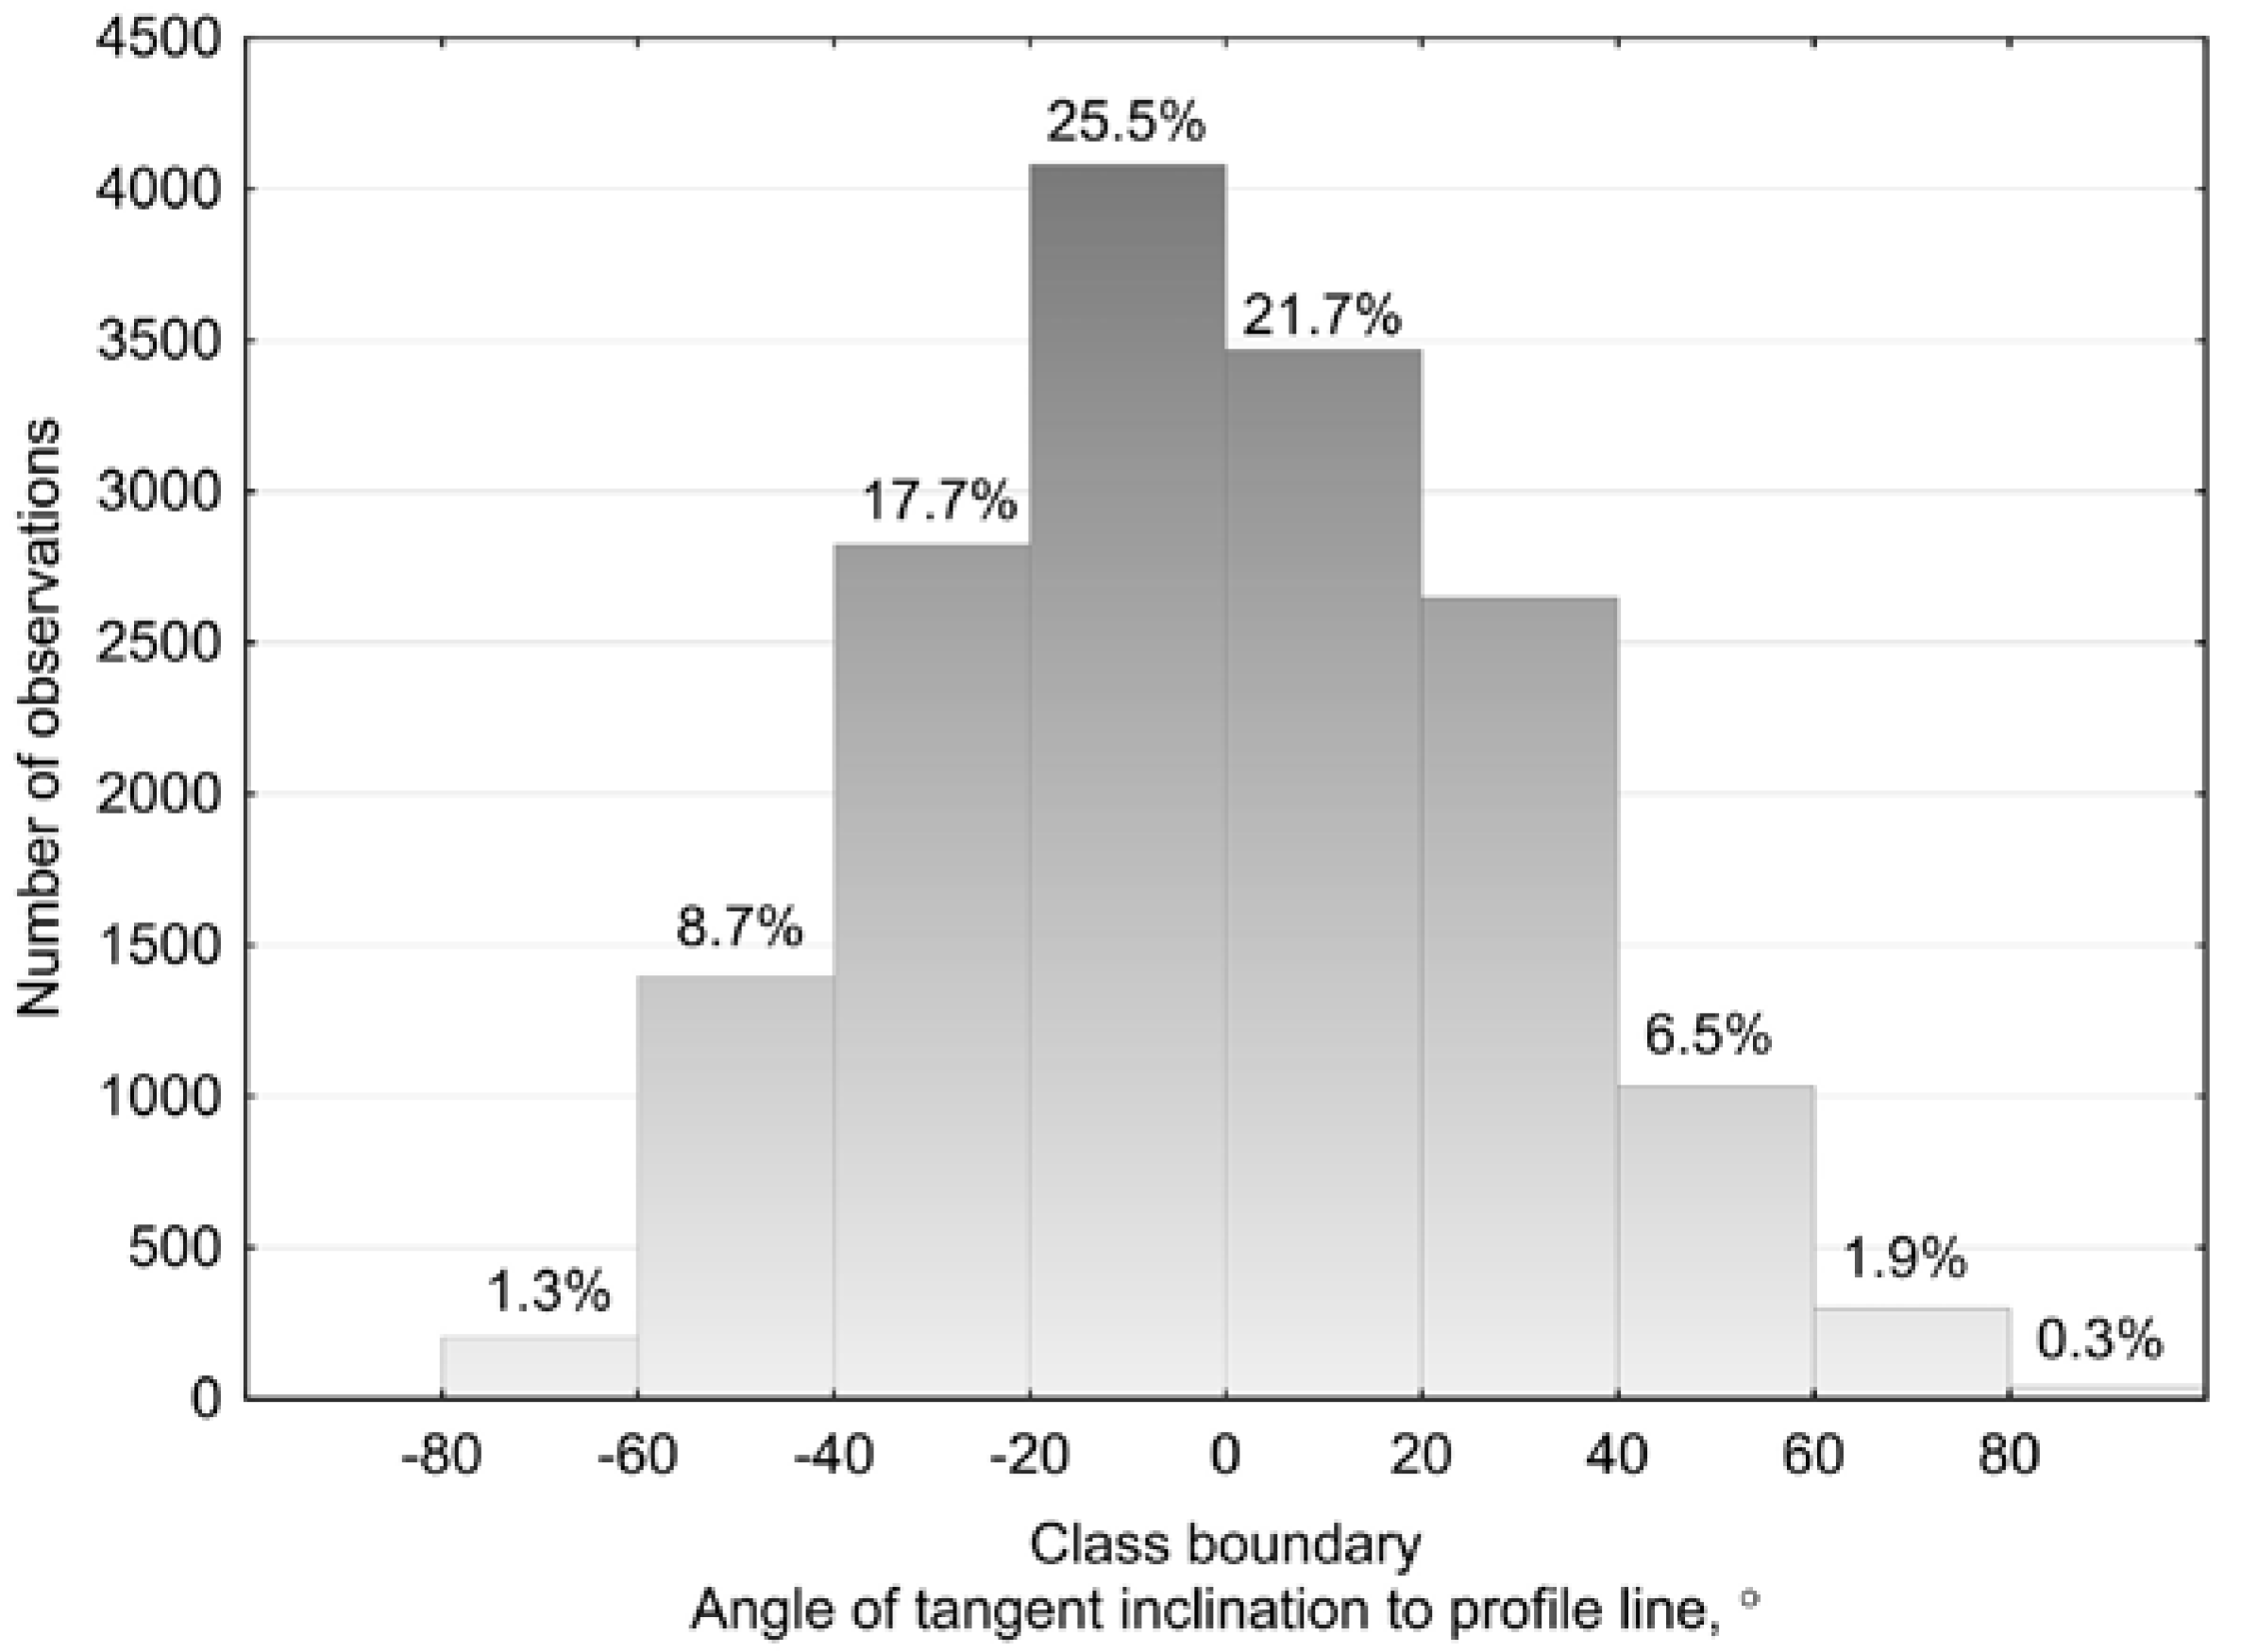
Due to the adopted form of the fractal model generator, and following the observed actual profile lines, there were three main ranges of the variability of angles γi: 0° to 20°, 20° to 40° and 40° to 60°. The frequency of the occurrence of angles γi in the given range was determined on the basis of obtained histograms (Figure 9). The adopted ranges of the variability angles of the tangent to the profile line overlapped the class intervals of the histogram.
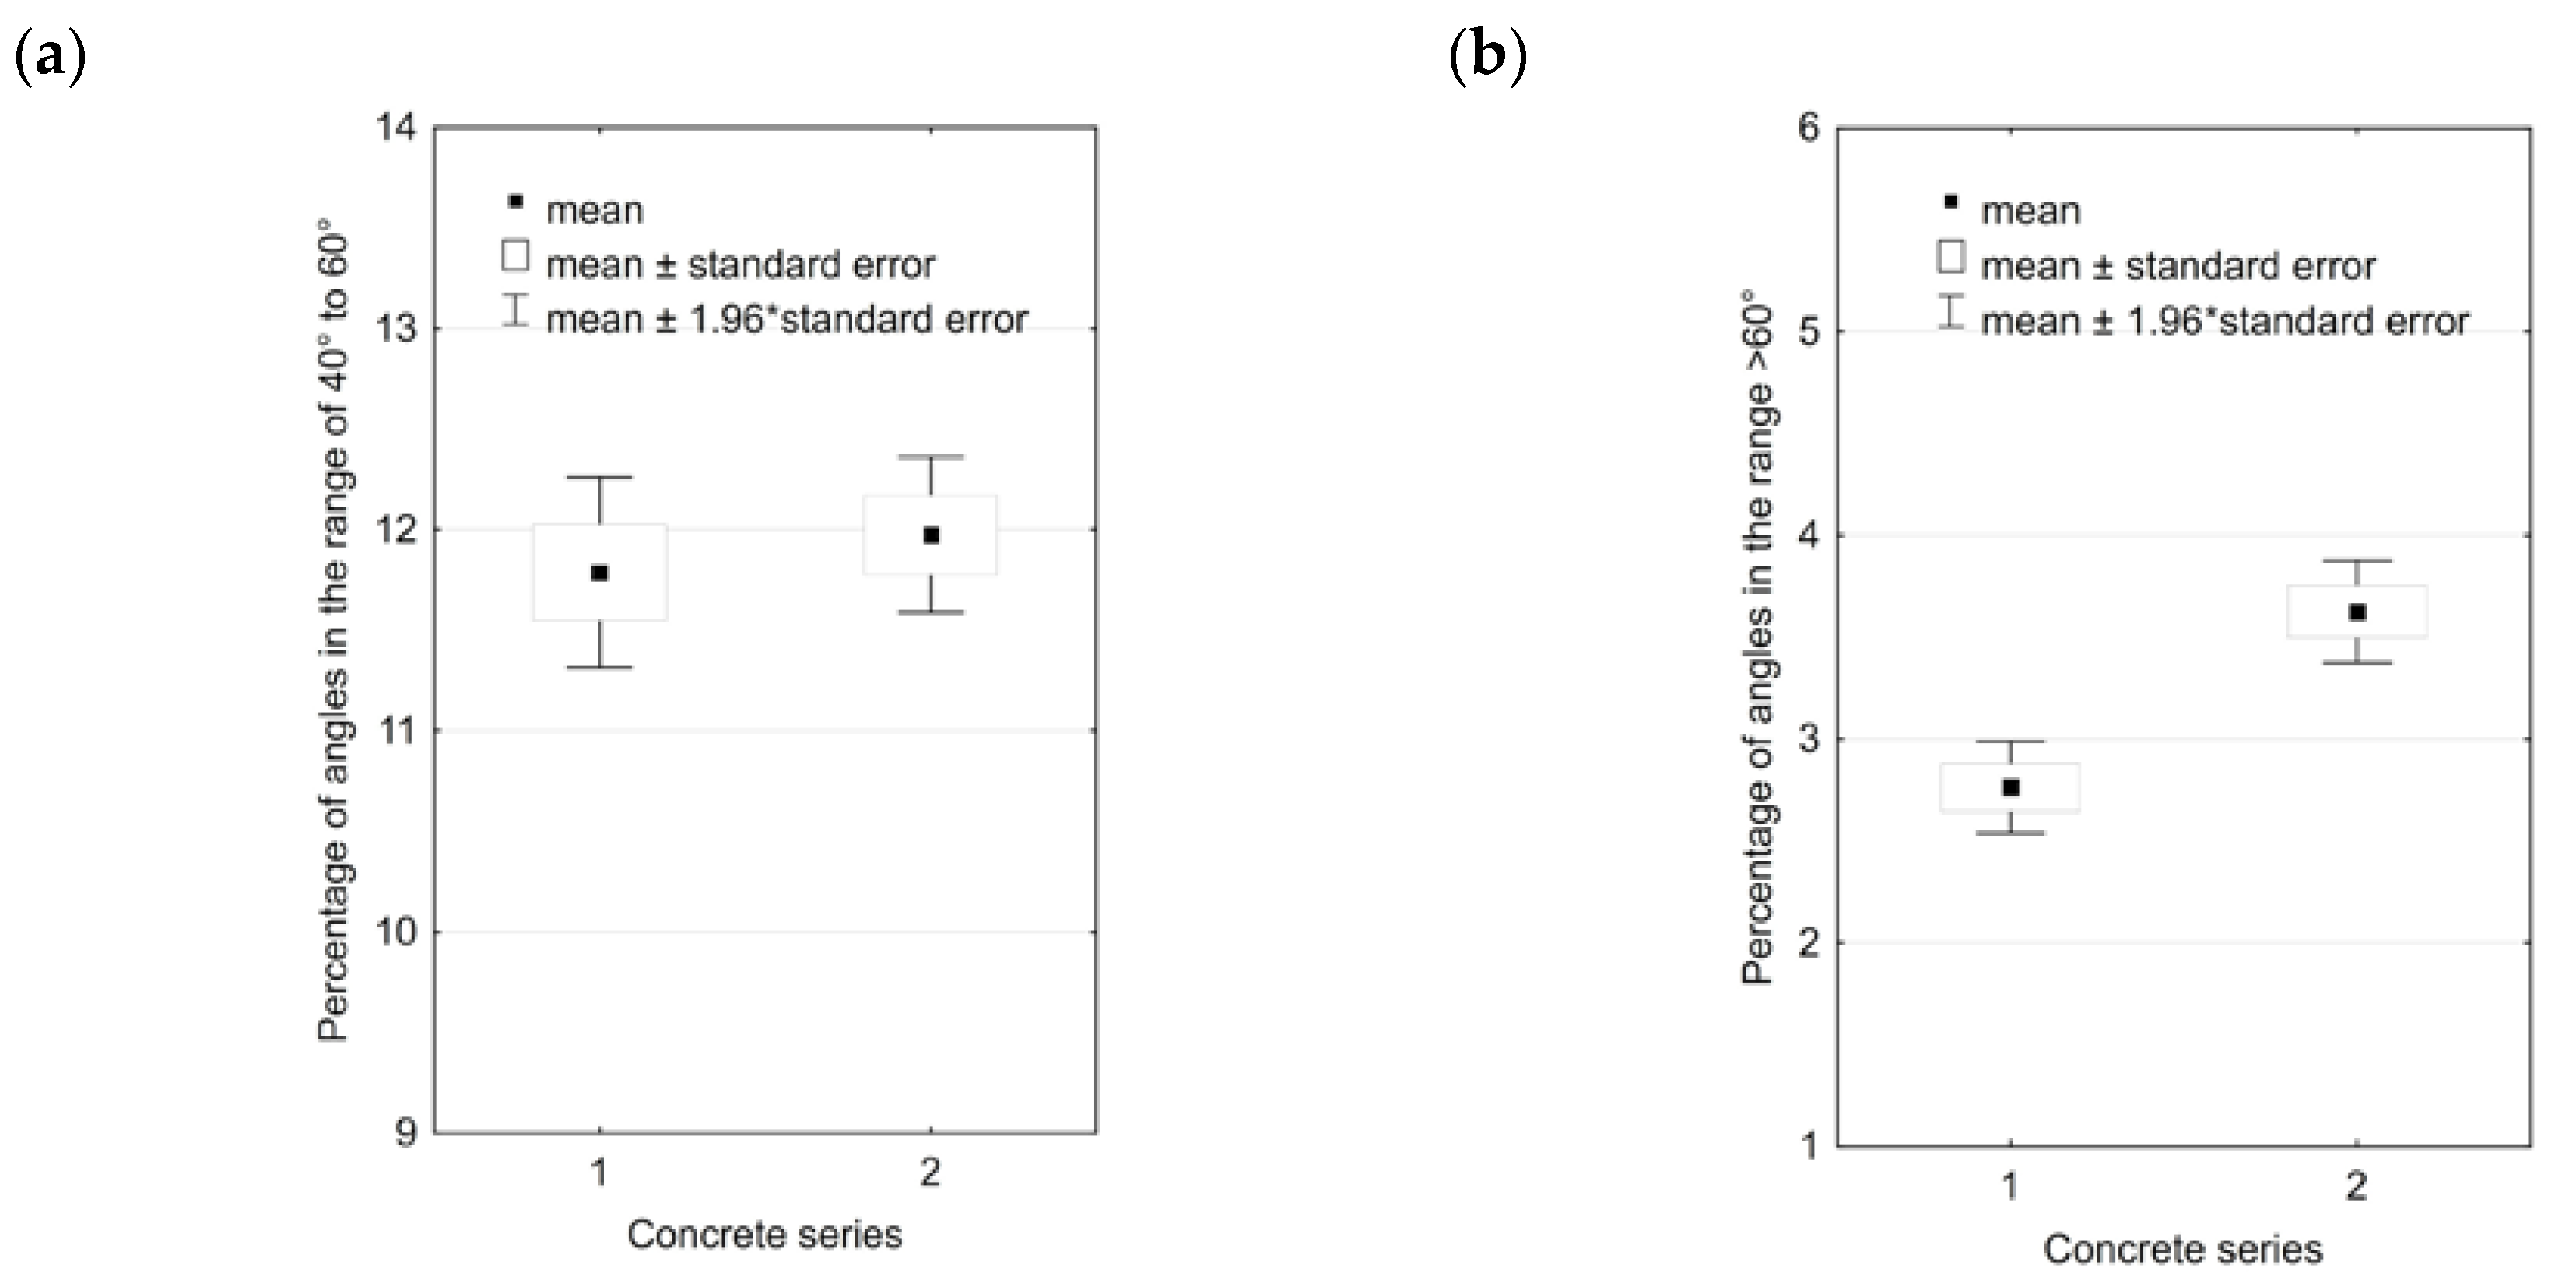
The results seem surprising, as significant differences in the frequency of occurrence of angles γi were expected in a given range, owing to a large number of profiles and considerable differentiation of the strength characteristics of the concretes selected for the analysis. However, in both profile series, very close mean values of angles γi occurrence frequency percentage were obtained (Table 3). A graphic comparison of the mean values of angles γi occurrence frequency in a given range is shown in Figure 10 and Figure 11.
A similar angles γi occurrence frequency in the ranges 20° to 40° and 40° to 60° was stated (Table 3). A slightly lower frequency of the angles from 0° to 20° was obtained for the fracture surface profile lines of concretes series 2. Different frequencies were observed only in the case of ranges above 60°. The results confirm the higher complexity level of the profile lines of the fracture surfaces of metakaolinite modified concrete series 2 of higher ratio w/b = 0.54, than those of series 1 of lower ratio w/b = 0.35 and identical amount of metakaolinite additive of 8.5%, relative to the binder mass. This indicates a higher complexity level of the fracture surfaces of metakaolinite modified concretes of higher w/b ratio and lower strength (lower values of fc and KIcS, Table 2).
The evaluation of the significance of the differences relative to the obtained mean values of the angles γi occurrence frequency was reduced to the determination of the boundary value of the significance level p. The significance boundary levels p > 0.05 indicate that the dismissal of the hypothesis of the equal mean frequencies of angles γi occurrence in the range of 0° to 60° is unfounded. The statistically highly significant difference was observed only for the values of angles γi occurrence mean frequency over 60° (p << 0.05).
The differences in angles γi occurrence frequency in particular ranges was taken into account in the description of the model (Figure 12), by increasing the generator’s elements length proportionally to mean frequency of angles γi occurrence.
The unit length ε was adopted for a strip corresponding to the range of the tangent inclination to the profile line of 40° to 60°. Due to the four times’ higher rate of the tangent inclination in the angles γi range of 0° to 20°, a generator’s section corresponding to this angle range of the length of 5ε was adopted. For angles γi in the range of 20° to 40°, a section of the length of 3ε was adopted. The inclination angles of generator’s individual sections were initially adopted, as the values corresponding to centers of class intervals adopted. The generator’s figure defined in this way (Figure 12a) enables a fractal simulating the fracture shape to be created (Figure 12b) and the fractal dimension of this fractal to be calculated (Equation (7)).
The procedure of plotting the Koch curve eventually results in a strict solution. As is well known, however, the actual fracture process develops along a different path each time, so the profile line separated out of the fracture surface will be unique. An infinite number of solutions based on the same generator is possible, owing to the introduction of the choice of the generator’s initial transformation. The proposed generator’s figure offers four alternatives (Figure 13). The randomness of the generator’s figure choice at each subsequent step of fractal creation makes the number of possible combinations close to infinity. What is an important feature of the fractals created in this way is their identical fractal dimension.
If the same fractal dimension of the profile lines separated out of fracture surfaces of concrete of identical composition were assumed, it would mean an a priori programmed way of fracture development for this concrete. The profile lines, however, will be visually different. That this approach can be extended to concretes of different composition is possible is proved by, inter alia, different results of the analysis of the angles γi. distribution histograms. The histograms of angles γi distribution for the profile lines separated out of fracture surfaces of concretes series 1 and 2, for eight randomly selected fracture surfaces, were compatible. The statistically significant difference was observed only in the angles γi occurrence mean frequencies in the range over 60°. This behavior may be accounted for, not only by the hardened paste itself, but also the coarse aggregate grains. In concretes of lower strength (series 2), the fractures developed along the grains, which was confirmed also by visual inspection of the fracture surfaces. The inclination angle changed substantially compared with the earlier direction of fracture development.
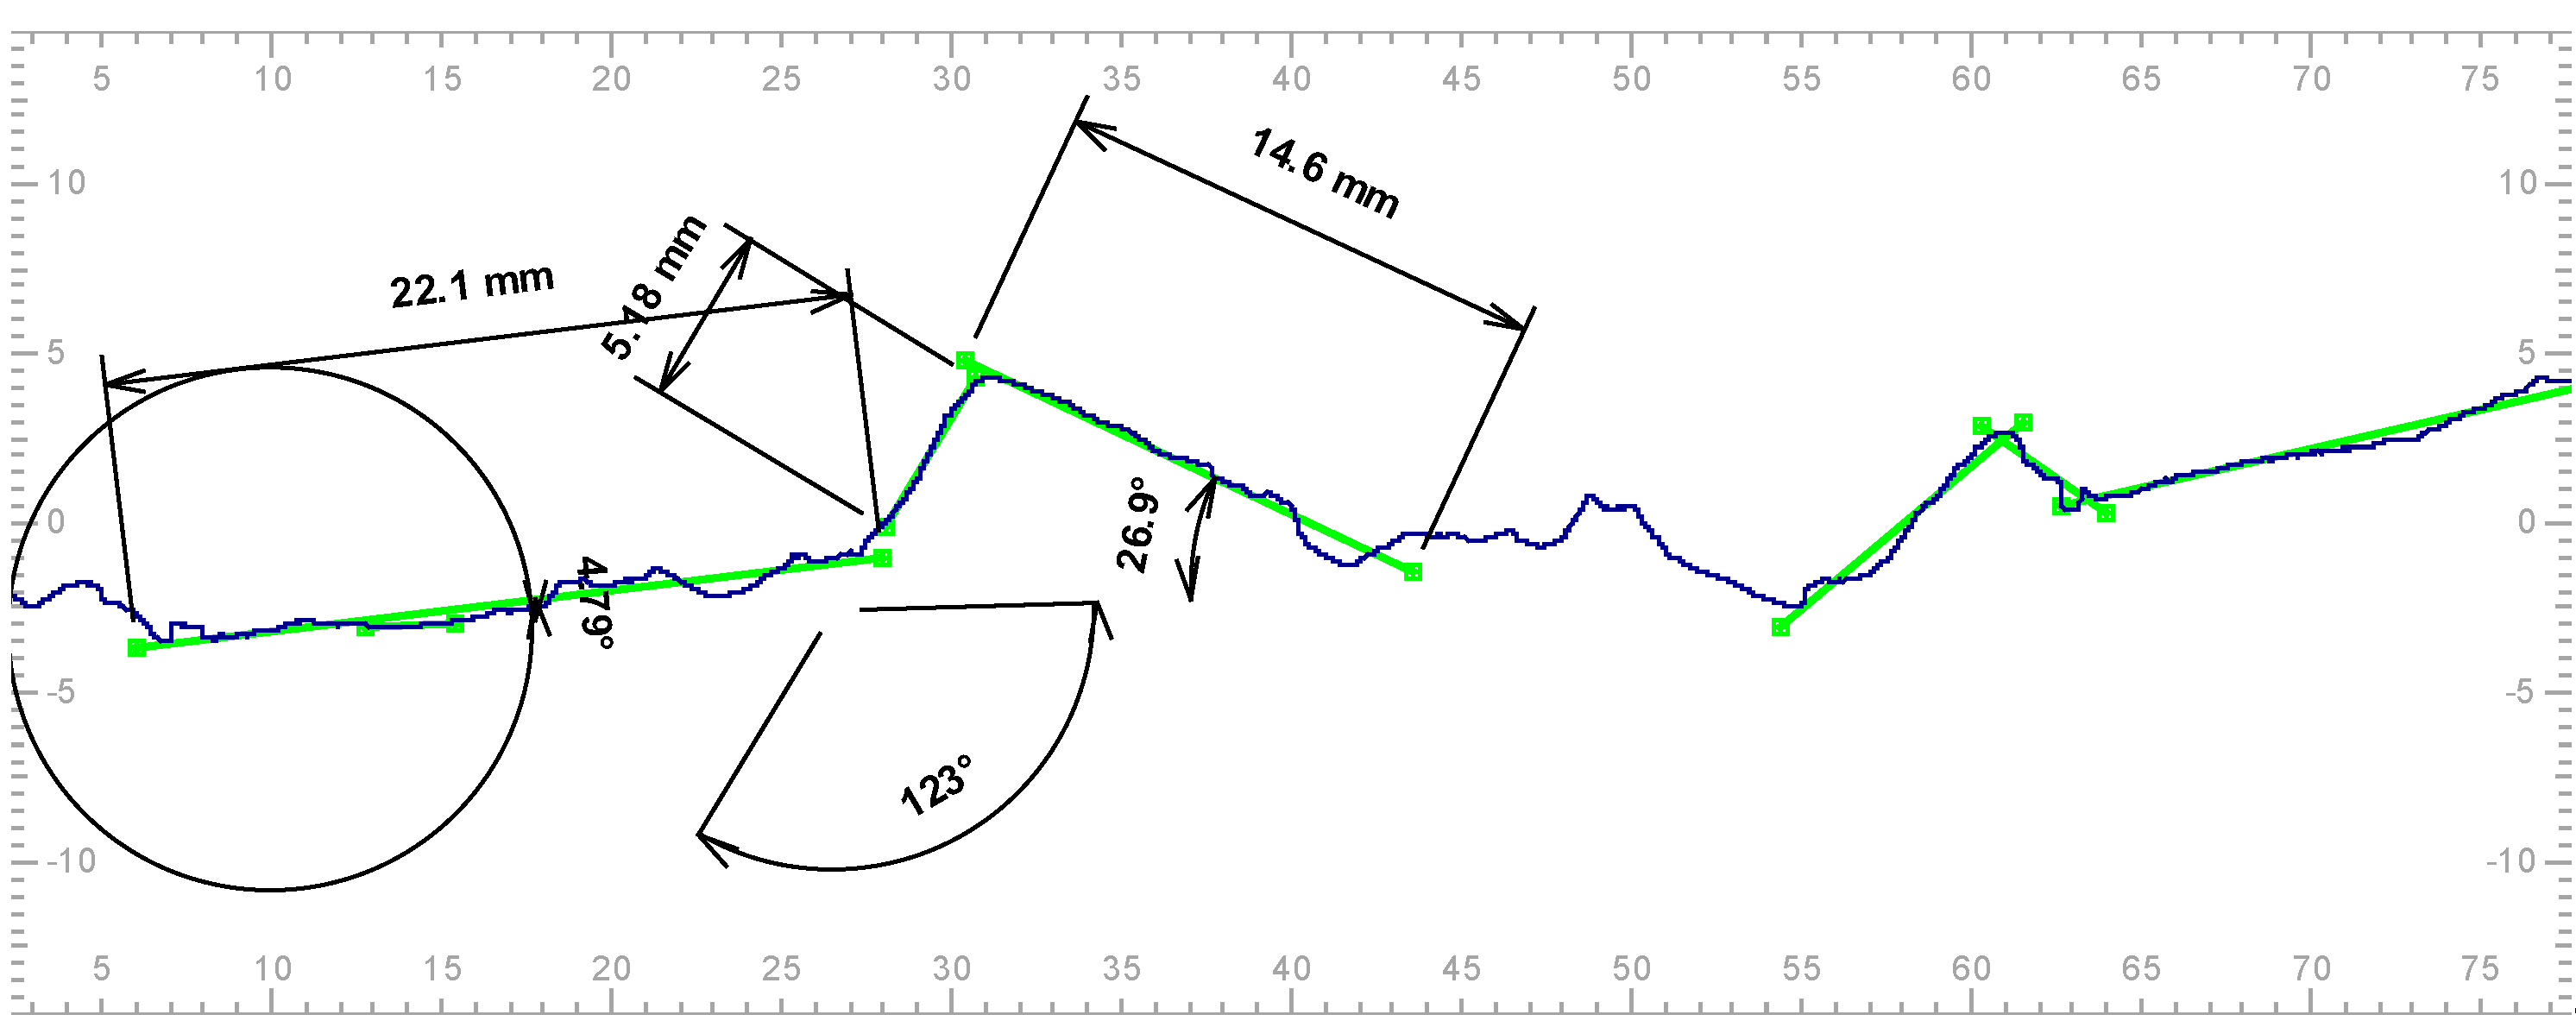
The assumption of such a simple, in principle, generator was also proven to be correct by the results of the analyses of the profile lines obtained with the profilometer. As shown in Figure 14, simple affine transformations such as offset, rotation or scaling enable parts of the profile lines resembling the assumed generator to be found.
The magnified parts of profile lines matching the generator disclose subsequent images whose shapes resemble the assumed generator (Figure 15). The real profile lines, then, reveal another fractal property characteristic, i.e. self-similarity.
In the process of a fractal model development, its comparison with the real structure is described is an important stage. To create model fractal profile lines, a program which was written in the Visual Basic language and a formal language introduced by A. Lindenmayer (applied for the description of plant growth) called an L-system was employed. The resulting solution was a chain of symbols, which was visualized by means of the concept of turtle graphics proposed by S. Papert. Starting from a certain point on the monitor, the turtle receives commands, consistent with the chain of symbols, how to move and whether to leave a trace of the distance covered or not. An example of the notation corresponding to the generator in Figure 12 can look like this: – F F F F F – F + F F F –. Symbol F denotes a shift by a certain assumed step of length l, and – or + denotes turning left or right, respectively. Because of the changing rotation angles in the created generator, the angle of rotation was specified. On the basis of the obtained record, in the next step symbol, F is replaced by the entire chain identifying the generator. Consequently, in the second step a sequence of symbols is obtained: – {– F F F F F – F + F F F –} {– F F F F F – F + F F F –} {– F F F F F – F + F F F –} {– F F F F F – F + F F F –} {– F F F F F – F + F F F –} – {– F F F F F – F + F F F –} + {– F F F F F – F + F F F –} {– F F F F F – F + F F F –} {– F F F F F – F + F F F –} –. The procedure can be repeated ad infinitum. The location of the subsequent points characterizing a fractal is found by defining three components: coordinate x, y and angle θ. Then the following transformations correspond to the symbols:
in which δ is the angle by which the turn is to be done.
For the created fractal profiles angles, γi occurrence histograms were plotted, which were next compared with those obtained for the real profile lines. A shift of the rotation angles towards the higher values was observed. The phenomenon of tangent bigger inclinations in the model profile compared with the real profile results from the bigger inclinations adopted, which is clearly indicated in the L-system chain record by the duplication of symbol –. Additionally, the fractal dimension was calculated in the Fraktal_Wymiar2D program. The values of the fractal dimension of the model profile lines, higher than those for the real profile lines, were obtained by both the divider method and the box method. Consequently, the angles in the proposed generator had to be reduced. An optimization analysis for various combinations of angles on over 300 model profile lines was performed, taking into account the compatibility of the histograms, i.e. angles γi occurrence frequency in a given class interval and the fractal dimension compatibility. Error function minimization was adopted as the optimization criterion. Depending on the concrete composition (series 1 or 2), generators shown in Figure 16 were obtained. Thus, the inclination angles of individual segments of the generator were shifted towards the lower boundaries of the adopted class intervals.
Examples of model fractal profiles against the real profile lines are shown in Figure 17 and Figure 18. The shorter lines denote the model lines.
Visual compatibility between the model profiles and the real profile lines is also noticeable. In some cases, simple affine transformations would result in an overlap of the model and real profiles.
The specific nature of model studies does not require obtaining an identical model solution perfectly matching the original. Similar to the modeling of the porosity or aggregate grains arrangement, each separated out section will be unique. A model solution must, however, meet the imposed conditions specified by a set of parameters that enable the verification of the model against the real-life case. The fractal dimension of the modeled profile line must be identical with that of the real profile line. Eventually, in the proposed solution, the definition of the master (the generator) is sufficient to create model fractures of concrete. At the same time, it is a significant step in the understanding and description of the seemingly random phenomenon of cracking. The determinism in producing a strict solution—a formula, or a rule of creating a fractal, is associated with the phenomenon of the apparently chaotic formation of a fracture. Fractal geometry allows for the concept of deterministic chaos to be introduced.
The tabulated results for the fractal dimension of the model profile lines and the fractal dimension calculated on the basis of the real profile lines indicate the high compatibility of D (Table 4).
Since the values of the fractal dimension of the model profile obtained from the generator are compatible with those calculated using the divider method, this method was employed for the test analysis. The results tabulated in Table 4 confirm the compatibility of the obtained values of the fractal dimension DC of the model profile lines with DC values of real lines and the value of fractal dimension D calculated on the basis of the proposed generator.
5. Conclusions
Understanding how the structure of cementitious composites and their properties, considering the fractal dimension, are interrelated is made difficult by their non-homogeneity and different behavior of particular phases during damage process resulting thereof. The concrete fracture surface caused by damage has a different fractal dimension depending on the characteristics of the phase, and its fractal dimension is composed of fractal dimensions of particular phases in this composite. Despite these difficulties, and the random nature of the cracking phenomenon in particular, a model describing the damage caused profile line can be developed.
Using the methods of description and the creation of fractal structures based on the proposed generator, a model of fractal fracture was developed. On the basis of the obtained results and relevant analyses, the following can be stated:
- visual compatibility between the fractal model of the cracking of metakaolinite modified concrete and the real fractal profile lines was demonstrated, and the compatibility between the fractal dimensions of model profile lines and those of real lines was confirmed;
- a similarity of the plotted histograms of fracture development directions distribution, regardless of concrete composition, was observed. In the fractal fracture model of cementitious composites, an analysis of fracture development of the directions’ distribution fracture development histograms should precede model modification;
- a dependence of the fractal dimension of the profile line, separated out of the fracture surface of concrete modified with 10% metakaolinite content on the mechanical properties of this composite, was found. The higher values of the fractal dimension were associated with poorer mechanical parameters of concrete. The critical stress intensity factor KIcS of concrete specimens with w/b = 0.54 was found to be over 36% lower and its compressive strength fc over 41 % lower than these parameters of the concrete with w/b = 0.35.
The proposed solution can be applied in the modeling of the behavior of cementitious composites during the cracking process. It can also be a basis for further research on the subject.
Funding
This research was funded by the Polish Grant Agency MNiSzW, grant number N N507 475337.
Acknowledgments
The author appreciates the anonymous reviewers for their constructive suggestions to improve the quality of the paper.
Conflicts of Interest
The author declares no conflict of interest.
References
- Mandelbrot, B.B. Fractals. Form, Chance and Dimension; Freeman: San Francisco, CA, USA, 1977. [Google Scholar]
- Winslow, D.N. The fractal nature of the surface of cement paste. Cem. Concr. Res. 1985, 15, 817–824. [Google Scholar] [CrossRef]
- Saouma, V.E.; Barton, C.C. Fractals, fractures and size effects in concrete. J. Eng. Mech. 1994, 120, 835–854. [Google Scholar] [CrossRef]
- Diamond, S. Aspects of concrete porosity revisited. Cem. Concr. Res. 1999, 29, 1181–1188. [Google Scholar] [CrossRef]
- Janik, A.; Kurdowski, W.; Podsiad, R.; Samset, J. Fractal structure of C-S-H and Tobermorite phases. Acta Phys. Pol. A 2001, 100, 529–537. [Google Scholar] [CrossRef]
- Konkol, J.; Prokopski, G. Analysis of the fracture surface morphology of concrete by the method of vertical section. Comput. Concr. 2004, 1, 389–400. [Google Scholar] [CrossRef]
- Wang, Y.; Diamond, S. A fractal study of the fracture surfaces of cement pastes and mortars using a stereoscopic SEM method. Cem. Concr. Res. 2001, 31, 1385–1392. [Google Scholar] [CrossRef]
- Zeng, Q.; Luo, M.; Pang, X.; Li, L.; Li, K. Surface fractal dimension: An indicator to characterize the microstructure of cement-based porous materials. Appl. Surf. Sci. 2013, 282, 302–307. [Google Scholar] [CrossRef]
- Czarnecki, L.; Garbacz, A.; Kurach, J. On the characterization on polymer concrete fracture surface. Cem. Concr. Compos. 2001, 23, 399–409. [Google Scholar] [CrossRef]
- Konkol, J. Fracture Toughness and Fracture Surface Morphology of Concretes Modified with Selected Additives of Pozzolanic Properties. Buildings 2019, 9, 174. [Google Scholar] [CrossRef] [Green Version]
- Carpinteri, A.; Chiaia, B. Multifractal scaling laws in the breaking behaviour of disordered materials. Chaos Solitons Fractals 1997, 8, 135–150. [Google Scholar] [CrossRef]
- Prokopski, G.; Konkol, J. The fractal analysis of the fracture surface of concretes made from different coarse aggregates. Comput. Concr. 2005, 2, 239–248. [Google Scholar] [CrossRef]
- Prokopski, G.; Langier, B. Effect of water/cement ratio and silica fume addition on the fracture toughness and morphology of fractured surfaces of gravel concretes. Cem. Concr. Res. 2000, 30, 1427–1433. [Google Scholar] [CrossRef]
- Brandt, A.M.; Prokopski, G. On the fractal dimension of fracture surfaces of concrete elements. J. Mater. Sci. 1993, 28, 4762–4766. [Google Scholar] [CrossRef]
- Konkol, J.; Prokopski, G. The use of fractal geometry for the assessment of the diversification of macro-pores in concrete. Image Anal. Stereol. 2011, 30, 89–100. [Google Scholar] [CrossRef] [Green Version]
- Konkol, J.; Prokopski, G. Fracture toughness and fracture surfaces morphology of metakaolinite-modified concrete. Constr. Build. Mater. 2016, 123, 638–648. [Google Scholar] [CrossRef]
- Erdem, S.; Blankson, M.A. Fractal-fracture analysis and characterization of impact-fractured surface in different types of concrete using digital image analysis and 3D nanomap laser profilometery. Constr. Build. Mater. 2013, 40, 70–76. [Google Scholar] [CrossRef]
- Ficker, T. Fracture surfaces and compressive strength of hydrated cement pastes. Constr. Build. Mater. 2012, 27, 197–205. [Google Scholar] [CrossRef]
- Czarnecki, L.; Chmielewska, B. Fracture and fractography of silane modified resin mortars. Int. J. Restor. Build. Monum. 2003, 9, 603–618. [Google Scholar] [CrossRef]
- Konkol, J.; Prokopski, G. Fracture surface morphology and fracture toughness of fluidal ash or metakaolinite modified concrete. Sci. J. Rzeszow Univ. Tech. Ser. Build. Environ. Eng. 2011, 58, 321–330. (In Polish) [Google Scholar]
- Lü, Q.; Qiu, Q.; Zheng, J.; Wang, J.; Zeng, Q. Fractal dimension of concrete incorporating silica fume and its correlations to pore structure, strength and permeability. Constr. Build. Mater. 2020, 228. [Google Scholar] [CrossRef]
- Jin, S.; Zheng, J.; Han, S. Fractal analysis of relation between strength and pore structure of hardened mortar. Constr. Build. Mater. 2017, 135, 1–7. [Google Scholar] [CrossRef]
- Yang, X.; Wang, F.; Yang, X.; Zhou, Q. Fractal dimension in concrete and implementation for meso-simulation. Constr. Build. Mater. 2017, 143, 464–472. [Google Scholar] [CrossRef]
- Yang, X.; Zhang, R.; Ma, S.; Yang, X.; Wang, F. Fractal dimension of concrete meso-structure based on X-ray computed tomography. Powder Technol. 2019, 350, 91–99. [Google Scholar] [CrossRef]
- Wild, S.; Khabit, J.M.; Jones, A. Relative strength pozzolanic activity and cement hydration in superplasticised metakaolin concrete. Cem. Concr. Res. 1996, 26, 1537–1544. [Google Scholar] [CrossRef]
- Sabir, B.B.; Wild, S.; Bai, J. Metakaolin and cacined clays as Pozzolans for concrete: A review. Cem. Concr. Compos. 2001, 23, 441–454. [Google Scholar] [CrossRef]
- Wong, H.S.; Razak, H.A. Efficiency of calcined kaolin and silica fume as cement replacement material for strength performance. Cem. Concr. Res. 2005, 35, 696–702. [Google Scholar] [CrossRef] [Green Version]
- Ding, J.T.; Li, Z. Effects of metakaolin and silica fume on properties of concrete. ACI Mater. J. 2002, 99, 393–398. [Google Scholar]
- Razak, H.A.; Wong, H.S. Strength estimation model for high-strength concrete incorporating metakaolin and silica fume. Cem. Concr. Res. 2005, 35, 688–695. [Google Scholar] [CrossRef] [Green Version]
- Poon, C.S.; Kou, S.C.; Lam, L. Compressive strength, chloride diffusivity and pore structure of high performance metakaolin and silica fume concrete. Constr. Build. Mater. 2006, 20, 858–865. [Google Scholar] [CrossRef]
- Love, C.A.; Richardson, I.G.; Brough, A.R. Composition and structure of C–S–H in white Portland cement–20% metakaolin pastes hydrated at 25 °C. Cem. Concr. Res. 2007, 37, 109–117. [Google Scholar] [CrossRef]
- Siddique, R.; Klaus, J. Influence of metakaolin on the properties of mortar and concrete: A review. Appl. Clay Sci. 2009, 43, 392–400. [Google Scholar] [CrossRef]
- Ramezanianpour, A.A.; Jovein, H.B. Influence of metakaolin as supplementary cementing material on strength and durability of concretes. Constr. Build. Mater. 2012, 30, 470–479. [Google Scholar] [CrossRef]
- Güneyisi, E.; Gesoğlu, M.; Karaoğlu, S.; Mermerdas, K. Strength, permeability and shrinkage cracking of silica fume and metakaolin concretes. Constr. Build. Mater. 2012, 34, 120–130. [Google Scholar] [CrossRef]
- Madandoust, R.; Mousavi, S.Y. Fresh and hardened properties of self-compacting concrete containing metakaolin. Constr. Build. Mater. 2012, 35, 752–760. [Google Scholar] [CrossRef]
- Dvorkin, L.; Bezusyak, A.; Lushnikova, N.; Ribakov, Y. Using mathematical modeling for design of self compacting high strength concrete with metakaolin admixture. Constr. Build. Mater. 2012, 37, 851–864. [Google Scholar] [CrossRef]
- Rashad, A.M. Metakaolin as cementitious material: History, scours, production and composition—A comprehensive overview. Constr. Build. Mater. 2013, 41, 303–318. [Google Scholar] [CrossRef]
- Konkol, J.; Prokopski, G. The influence of the age of concretes with FBC fly ash or metakaolinite additives on their strength properties. Road Bridg. 2014, 13, 49–67. [Google Scholar] [CrossRef]
- Shah, S.P. Determination of fracture parameters (KSIc and CTODc) of plain concrete using three-point bend test. RILEM Draft Recommendations, TC 89-FMT Fracture Mechanics of Concrete Test Methods. Mater. Struct. 1990, 23, 457–460. [Google Scholar] [CrossRef]
- Konkol, J.; Prokopski, G. The necessary number of profile lines for the analysis of concrete fracture surfaces. Struct. Eng. Mech. 2007, 25, 565–576. [Google Scholar] [CrossRef]
- Carpinteri, A.; Spagnoli, A.; Vantadori, S.; Viappiani, D. Influence of the crack morphology on fatigue crack growth rate: A continuously-kinked crack model based on fractals. Eng. Fract. Mech. 2008, 75, 579–589. [Google Scholar] [CrossRef]
- Chang, K.K.; Xi, Y.; Roh, Y.S. A fractal fracture model and application to concrete with different aggregate sizes and loading rates. Struct. Eng. Mech. 2006, 23, 147–161. [Google Scholar] [CrossRef]
- Konkol, J.; Prokopski, G. Fractal description of cement concretes fracture surface. J. Civ. Eng. Environ. Archit. JCEEA 2014, 61, 247–260. (In Polish) [Google Scholar] [CrossRef]
- Peng, J.; Wu, Z.; Zhao, G. Fractal analysis of fracture in concrete. Theor. Appl. Fract. Mech. 1997, 27, 135–140. [Google Scholar] [CrossRef]
- Xie, H. Effects of fractal crack. Theor. Appl. Fract. Mech. 1995, 23, 235–244. [Google Scholar] [CrossRef]
- Yan, A.; Wu, K.; Zhang, X. A quantitative study on the surface crack pattern of concrete with high content of steel fiber. Cem. Concr. Res. 2002, 32, 1371–1375. [Google Scholar] [CrossRef]
Figure 1.
A mold for the manufacture of gypsum replicas (a) and a gypsum replica strip (b) scanned at definition resolution of 600 dpi, together with the digitization results (c).
Figure 1.
A mold for the manufacture of gypsum replicas (a) and a gypsum replica strip (b) scanned at definition resolution of 600 dpi, together with the digitization results (c).

Figure 2.
Talysurf CLI 1000 laser profilometer manufactured by Taylor Hobson for fast non-contact measurement of 3D surface topography.
Figure 2.
Talysurf CLI 1000 laser profilometer manufactured by Taylor Hobson for fast non-contact measurement of 3D surface topography.

Figure 3.
A scheme for the determination of angles identifying the direction of fracture development direction.
Figure 3.
A scheme for the determination of angles identifying the direction of fracture development direction.

Figure 4.
Koch curve in the fourth formation step (a) and the “pattern” of its formation—generator (b).
Figure 4.
Koch curve in the fourth formation step (a) and the “pattern” of its formation—generator (b).

Figure 5.
The generator shape proposed by Chang and others in the paper [42] (a) and the fractal obtained on its basis (b).
Figure 5.
The generator shape proposed by Chang and others in the paper [42] (a) and the fractal obtained on its basis (b).

Figure 6.
Generator shape proposed by Peng and others in the paper [44] (a) and an example of fractal obtained on its basis (b).
Figure 6.
Generator shape proposed by Peng and others in the paper [44] (a) and an example of fractal obtained on its basis (b).


Figure 8.
Generator shape proposed (a) and an example of fractal obtained on its basis (b).

Figure 9.
Typical histogram of the distribution of angles γi, defining fracture development direction.
Figure 9.
Typical histogram of the distribution of angles γi, defining fracture development direction.

Figure 10.
Graphic interpretation of the test for the equality of angles γi occurrence mean frequency for specimen series 1 and 2 in the range of: (a) 0° to 20°, (b) 20° to 40°.
Figure 10.
Graphic interpretation of the test for the equality of angles γi occurrence mean frequency for specimen series 1 and 2 in the range of: (a) 0° to 20°, (b) 20° to 40°.

Figure 11.
Graphic interpretation of the test for the equality of angles γi occurrence mean frequency for specimen series 1 and 2 in the range of: (a) 40° to 60°, (b) over 60°.
Figure 11.
Graphic interpretation of the test for the equality of angles γi occurrence mean frequency for specimen series 1 and 2 in the range of: (a) 40° to 60°, (b) over 60°.

Figure 12.
Generator and the fractal obtained on its basis (N—number of parts making up the initial figure of the fractal, s—scale factor). (a) generator; (b) fractal obtained on its basis.
Figure 12.
Generator and the fractal obtained on its basis (N—number of parts making up the initial figure of the fractal, s—scale factor). (a) generator; (b) fractal obtained on its basis.

Figure 13.
Four possible options of generator’s arrangement.

Figure 14.
An example of a profile (concrete series 2) with visible parts matching the assumed generator.
Figure 14.
An example of a profile (concrete series 2) with visible parts matching the assumed generator.

Figure 15.
A magnified part of a profile with elements matching the proposed generator marked.

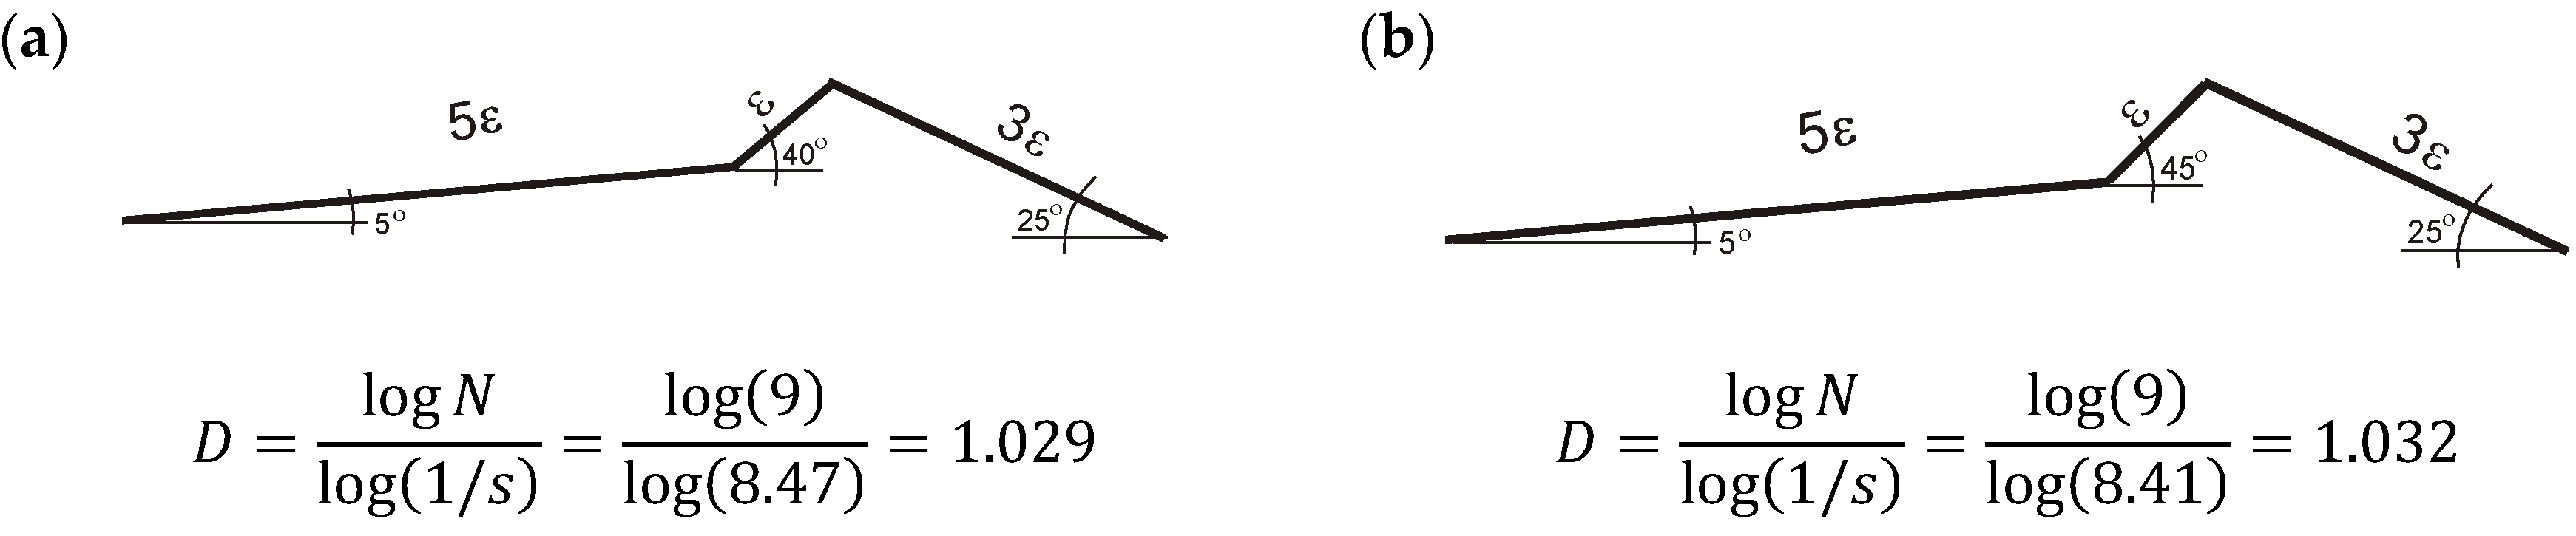
Figure 16.
Generator of the fracture surface profile line for concrete of the content of MK = 8.5% relative to binder mass and w/b = 0.35—series 1 (a), w/b = 0.54—series 1 (b).
Figure 16.
Generator of the fracture surface profile line for concrete of the content of MK = 8.5% relative to binder mass and w/b = 0.35—series 1 (a), w/b = 0.54—series 1 (b).

Figure 17.
Examples of random profile lines based on the proposed generator vs. real profiles separated out of fracture surfaces of concrete series 1.
Figure 17.
Examples of random profile lines based on the proposed generator vs. real profiles separated out of fracture surfaces of concrete series 1.

Figure 18.
Examples of random profile lines based on the proposed generator vs. real profiles separated out of fracture surfaces of concrete series 2.
Figure 18.
Examples of random profile lines based on the proposed generator vs. real profiles separated out of fracture surfaces of concrete series 2.


Table 1.
Concrete mix components.
| Series No. | Variable | Concrete Mix Composition in kg after the Adopted Plan | ||||||
|---|---|---|---|---|---|---|---|---|
| w/b | MK/b | Binder | Cement | MK | Water | Sand | Basalt | |
| 1 | 0.35 | 0.085 | 454 | 435.8 | 18.2 | 172.5 | 739.3 | 1212.5 |
| 2 | 0.54 | 0.085 | 415.4 | 38.6 | 202.0 | |||
Table 2.
Results of tests on compressive strength fc and critical stress intensity factor KIcS after 28 days curing of concrete and results of the fractal analyses.
Table 2.
Results of tests on compressive strength fc and critical stress intensity factor KIcS after 28 days curing of concrete and results of the fractal analyses.
| Series No. | Mechanical Properties of Concrete | Fractal Parameters | |
|---|---|---|---|
| fc ± Stand. Error MPa | KIcS ± Stand. Error MN/m3/2 | Dc ± Stand. Error - | |
| 1 | 63.7 ± 0.6 | 1.52 ± 0.03 | 1.028 ± 0.001 |
| 2 | 37.2 ± 0.8 | 0.97 ± 0.01 | 1.033 ± 0.001 |
The mean values of fractal dimension DC calculated on the basis of the analysis of 20 profile lines.
Table 3.
Results of analysis of the histograms of angles γi occurrence frequency, identifying fracture development direction.
Table 3.
Results of analysis of the histograms of angles γi occurrence frequency, identifying fracture development direction.
| Range of Profile Inclination Angles Variability | Results of Analysis of Histograms of Angles Distribution along the Profile Line Separated out of Fracture Surface | |||||
|---|---|---|---|---|---|---|
| Series 1, o MK/b = 0.085 and w/b = 0.35 | Series 2, MK/b = 0.085 and w/b = 0.54 | |||||
| Percentage of Angles γi | ± Stand. Deviation | ± Stand. Error | Percentage of Angles γi | ± Stand. Deviation | ± Stand. Error | |
| 0°–20° | 52.8 | ±3.75 | ±0.42 | 51.9 | ±3.66 | ±0.41 |
| 20°–40° | 32.7 | ±2.67 | ±0.30 | 32.5 | ±2.49 | ±0.28 |
| 40°–60° | 11.8 | ±2.16 | ±0.24 | 12.0 | ±1.76 | ±0.20 |
| >60° | 2.76 | ±1.03 | ±0.12 | 3.62 | ±1.14 | ±0.13 |
The number of profile lines for each concrete was 80.
Table 4.
Fractal dimension of model profiles vs. fractal dimension of real profile lines.
| Fractal Dimension D of Concrete Fracture Surface Profile Line | |||||||
|---|---|---|---|---|---|---|---|
| Series 1, MK/b = 0.085 and w/b = 0.35 | Series 2, MK/b = 0.085 and w/b = 0.54 | ||||||
| Model DC ± Stand. Error | Real DC ± Stand. Error | Calculation Based on Generator (Figure 11a) | Model DC ± Stand. Error | Real DC ± Stand. Error | Calculation Based on Generator (Figure 11b) | ||
| 1.029 | 1.029 ± 0.001 | 1.028 ± 0.001 | 1.029 | 1.034 | 1.035 ± 0.001 | 1.033 ± 0.001 | 1.032 |
| 1.030 | 1.036 | ||||||
| 1.029 | 1.034 | ||||||
| 1.031 | 1.037 | ||||||
| 1.027 | 1.033 | ||||||
© 2020 by the author. Licensee MDPI, Basel, Switzerland. This article is an open access article distributed under the terms and conditions of the Creative Commons Attribution (CC BY) license (http://creativecommons.org/licenses/by/4.0/).
Share and Cite
MDPI and ACS Style
Konkol, J. A Fractal Model of Cracking of Cement Matrix Composites. Buildings 2020, 10, 52. https://doi.org/10.3390/buildings10030052
AMA Style
Konkol J. A Fractal Model of Cracking of Cement Matrix Composites. Buildings. 2020; 10(3):52. https://doi.org/10.3390/buildings10030052
Chicago/Turabian StyleKonkol, Janusz. 2020. "A Fractal Model of Cracking of Cement Matrix Composites" Buildings 10, no. 3: 52. https://doi.org/10.3390/buildings10030052
Note that from the first issue of 2016, this journal uses article numbers instead of page numbers. See further details here.