Testing Joints between Walls Made of AAC Masonry Units


Abstract
1. Introduction
- Determination of the cracking and failure mechanisms of joints between AAC walls;
- Comparison of load capacity of wall joints using traditional masonry bonds and steel connectors;
- Optimization of the shape of a steel connector.
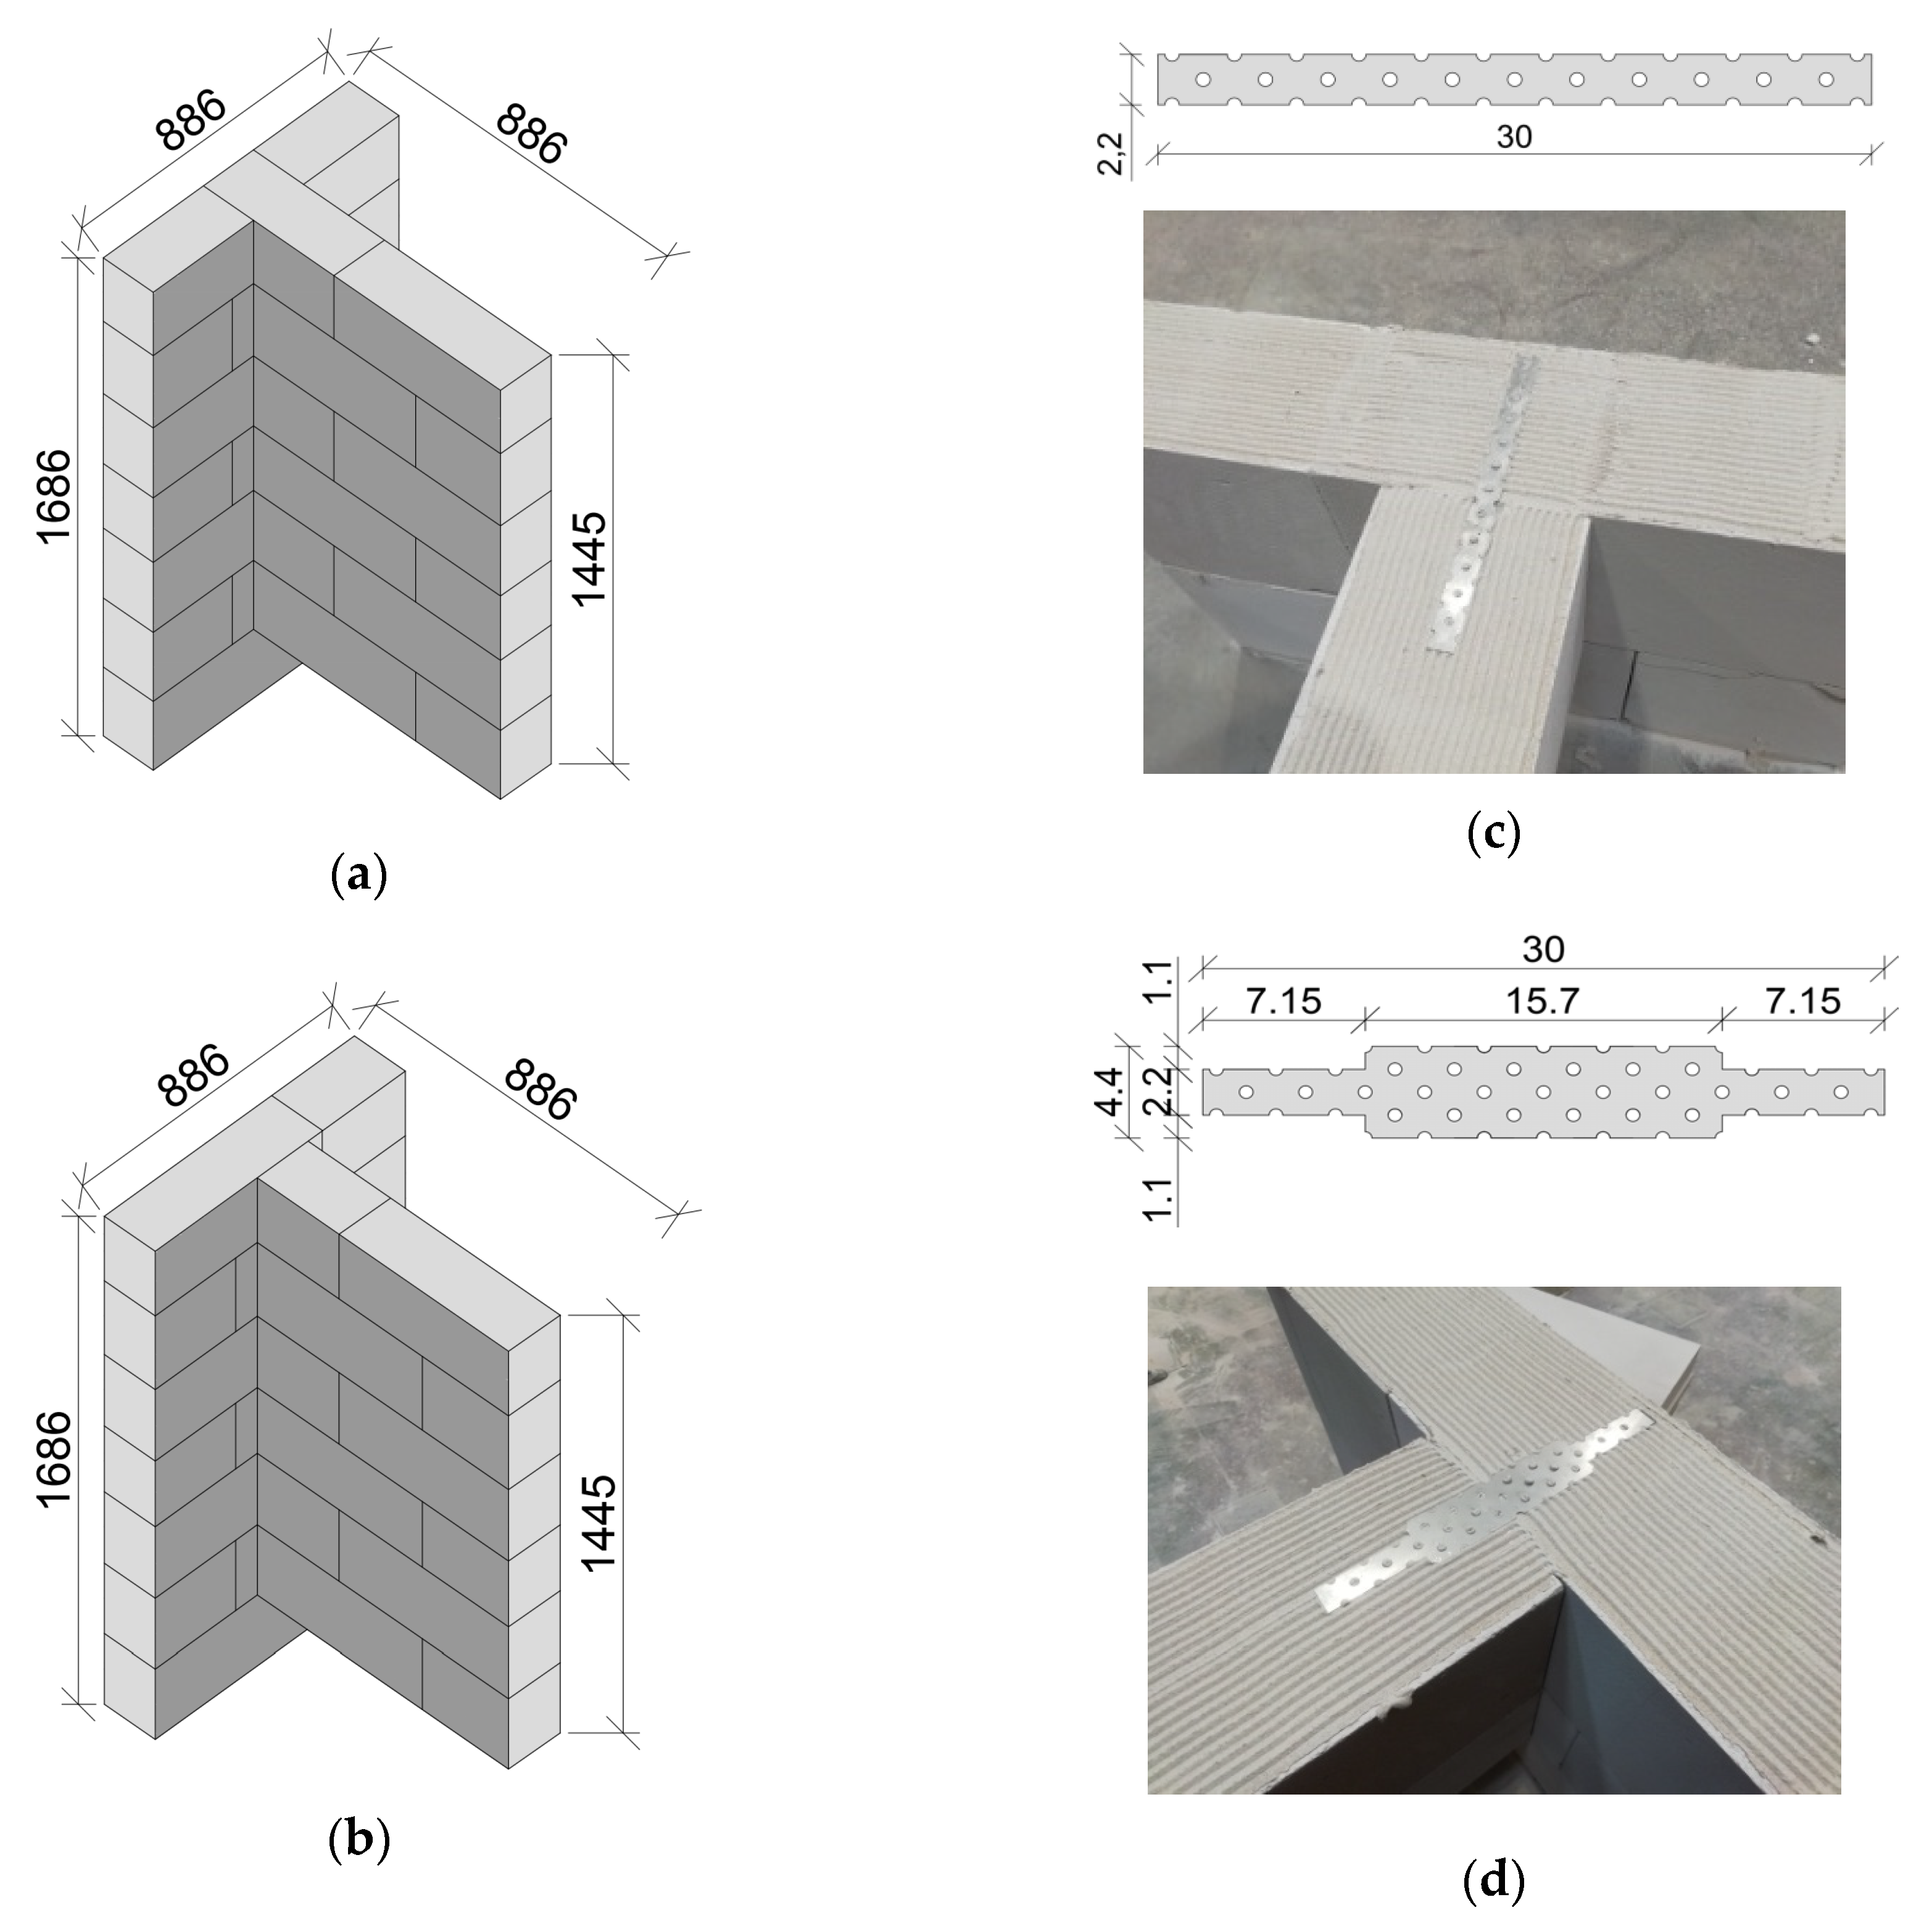
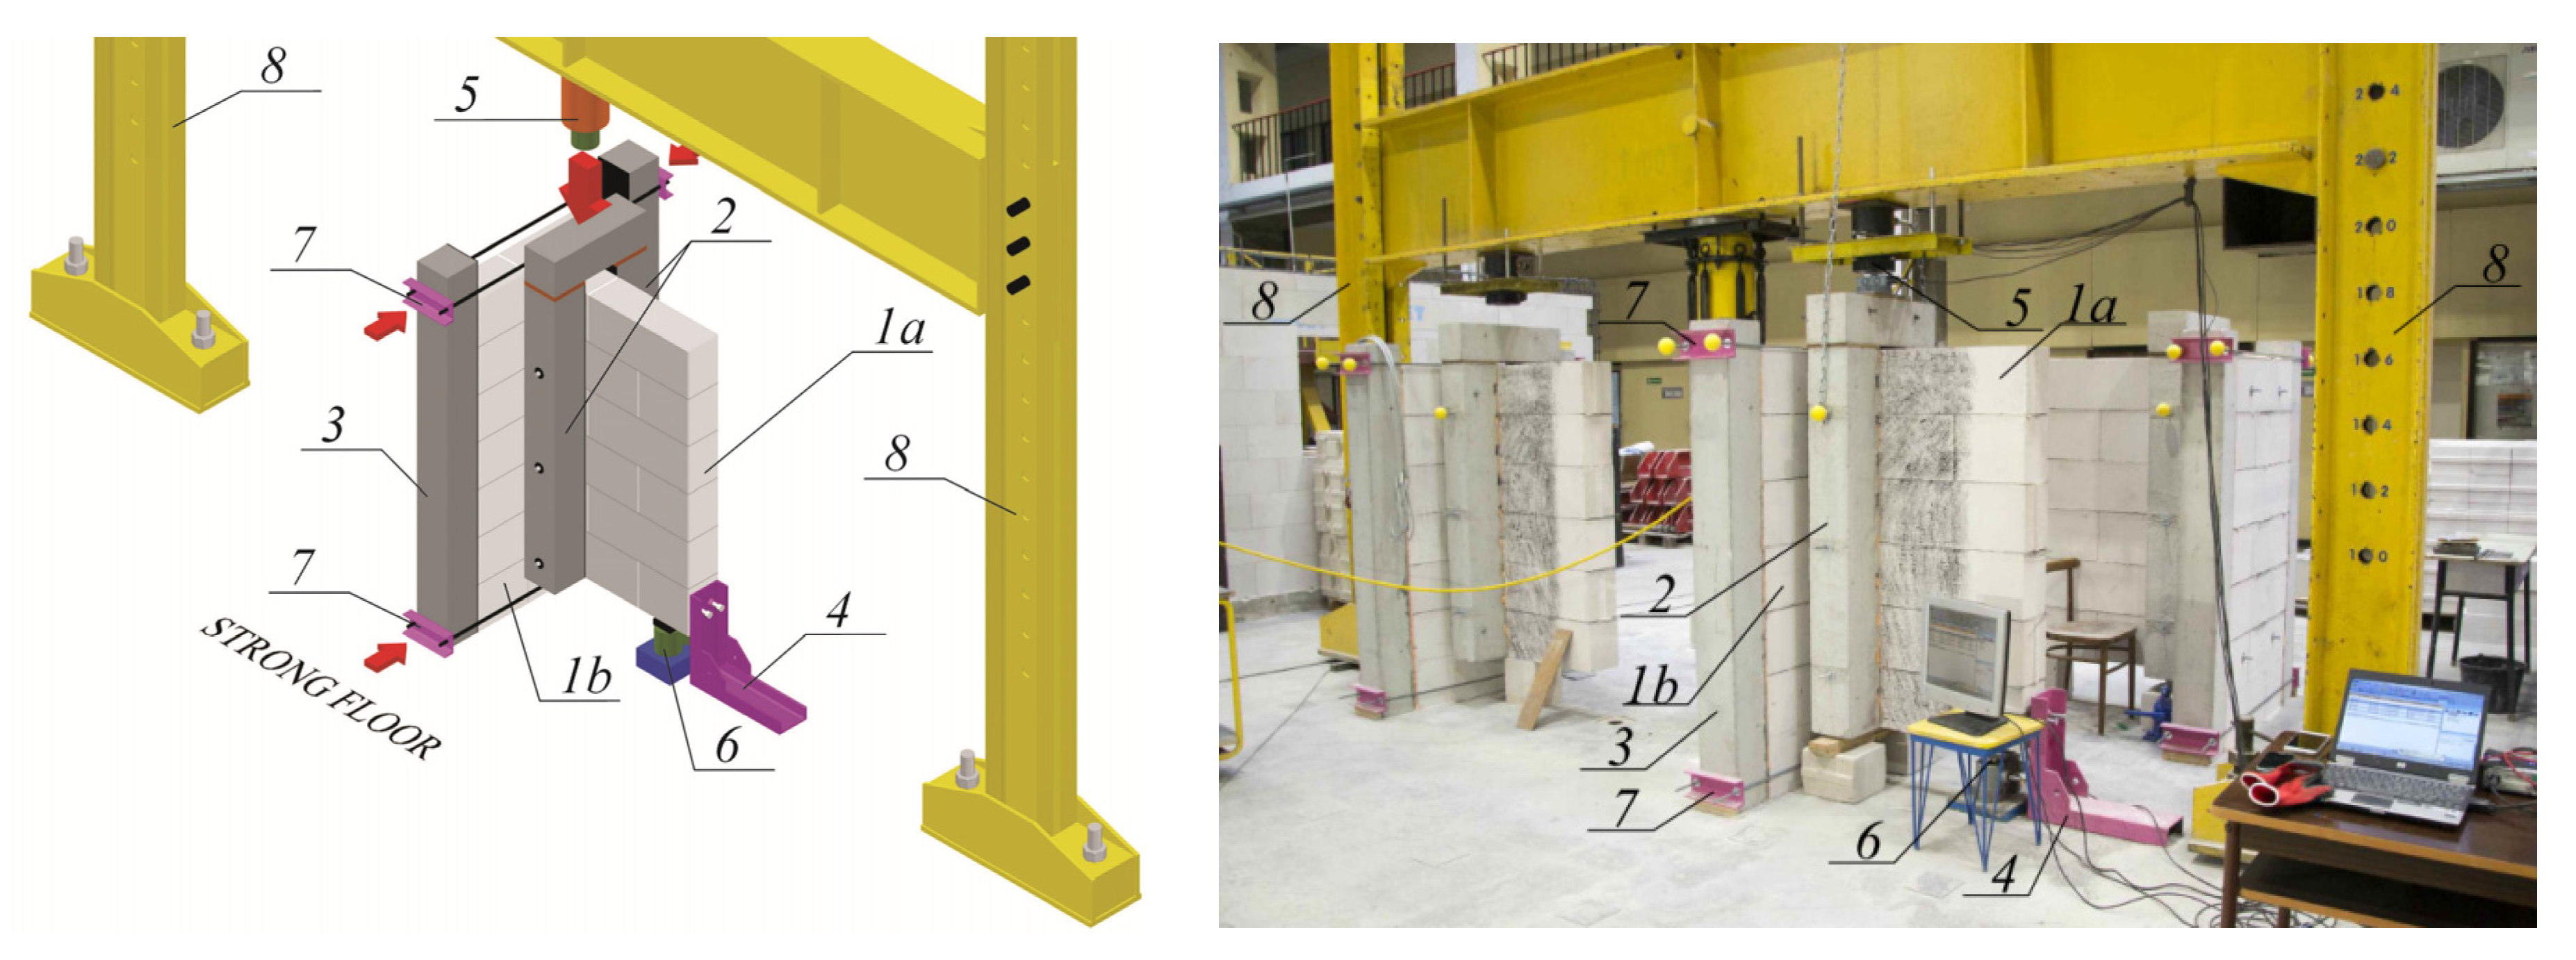
2. Programme of Our Own Tests
3. Test results and Analysis
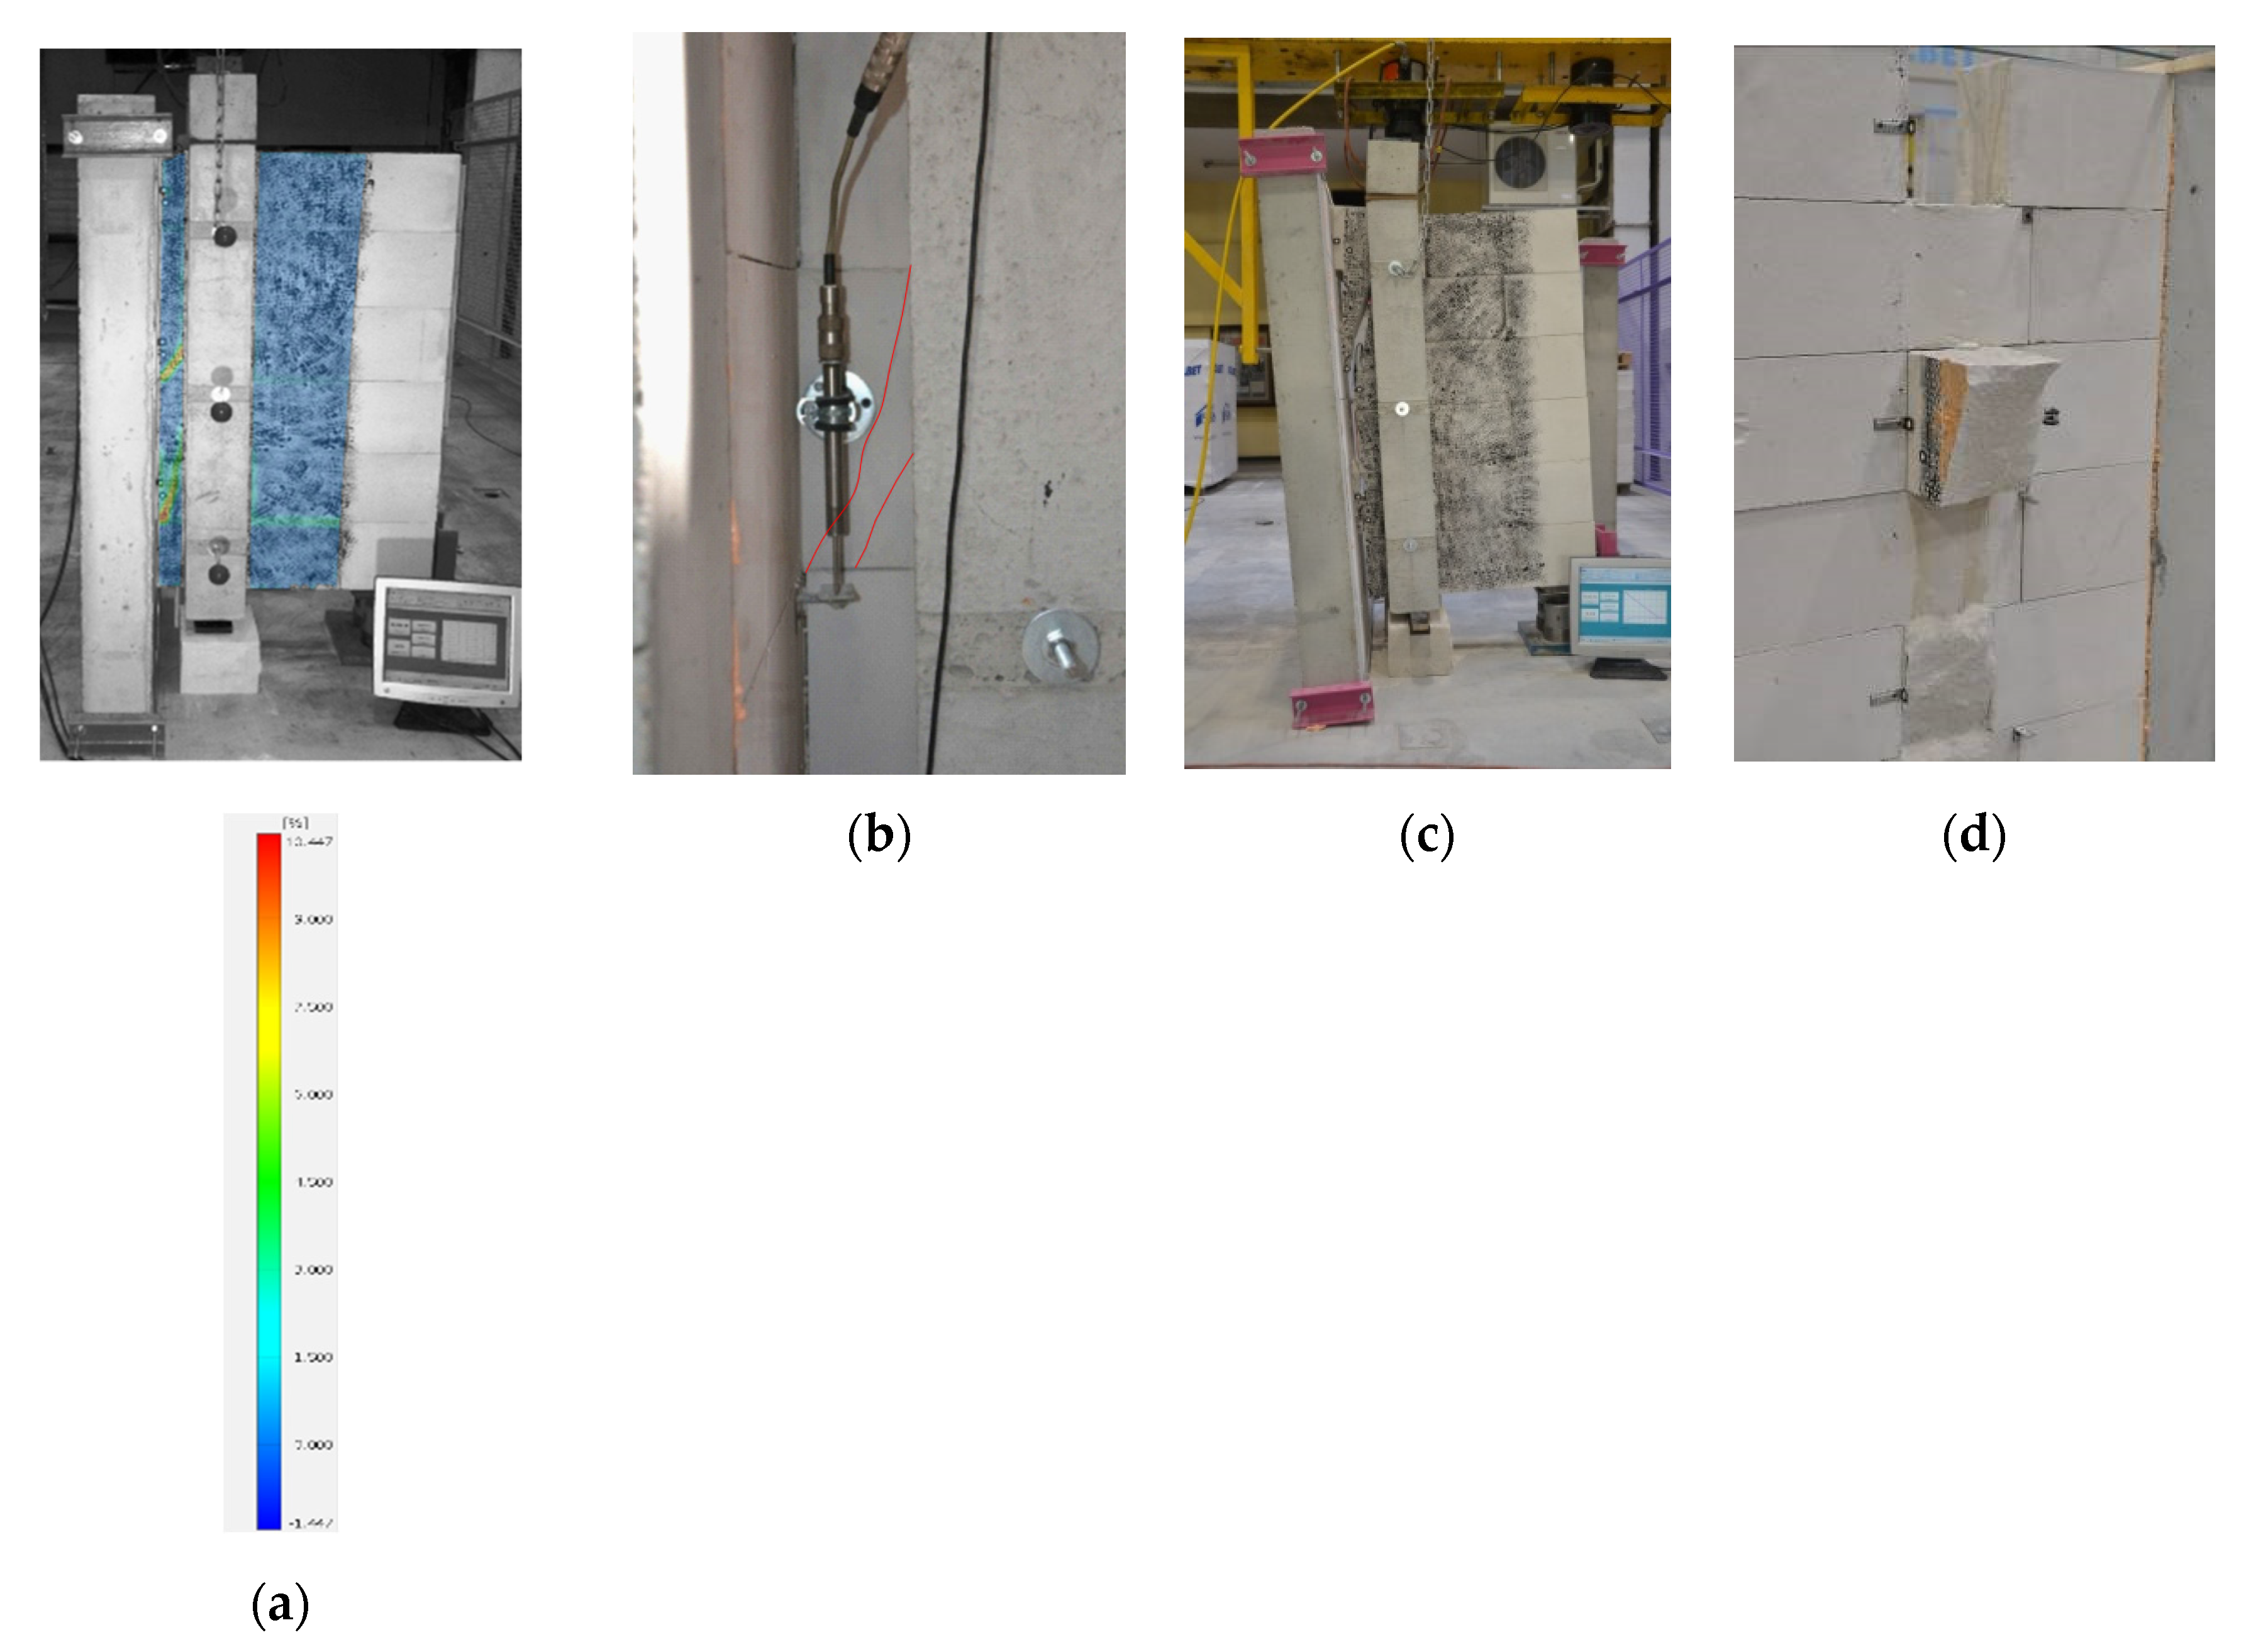
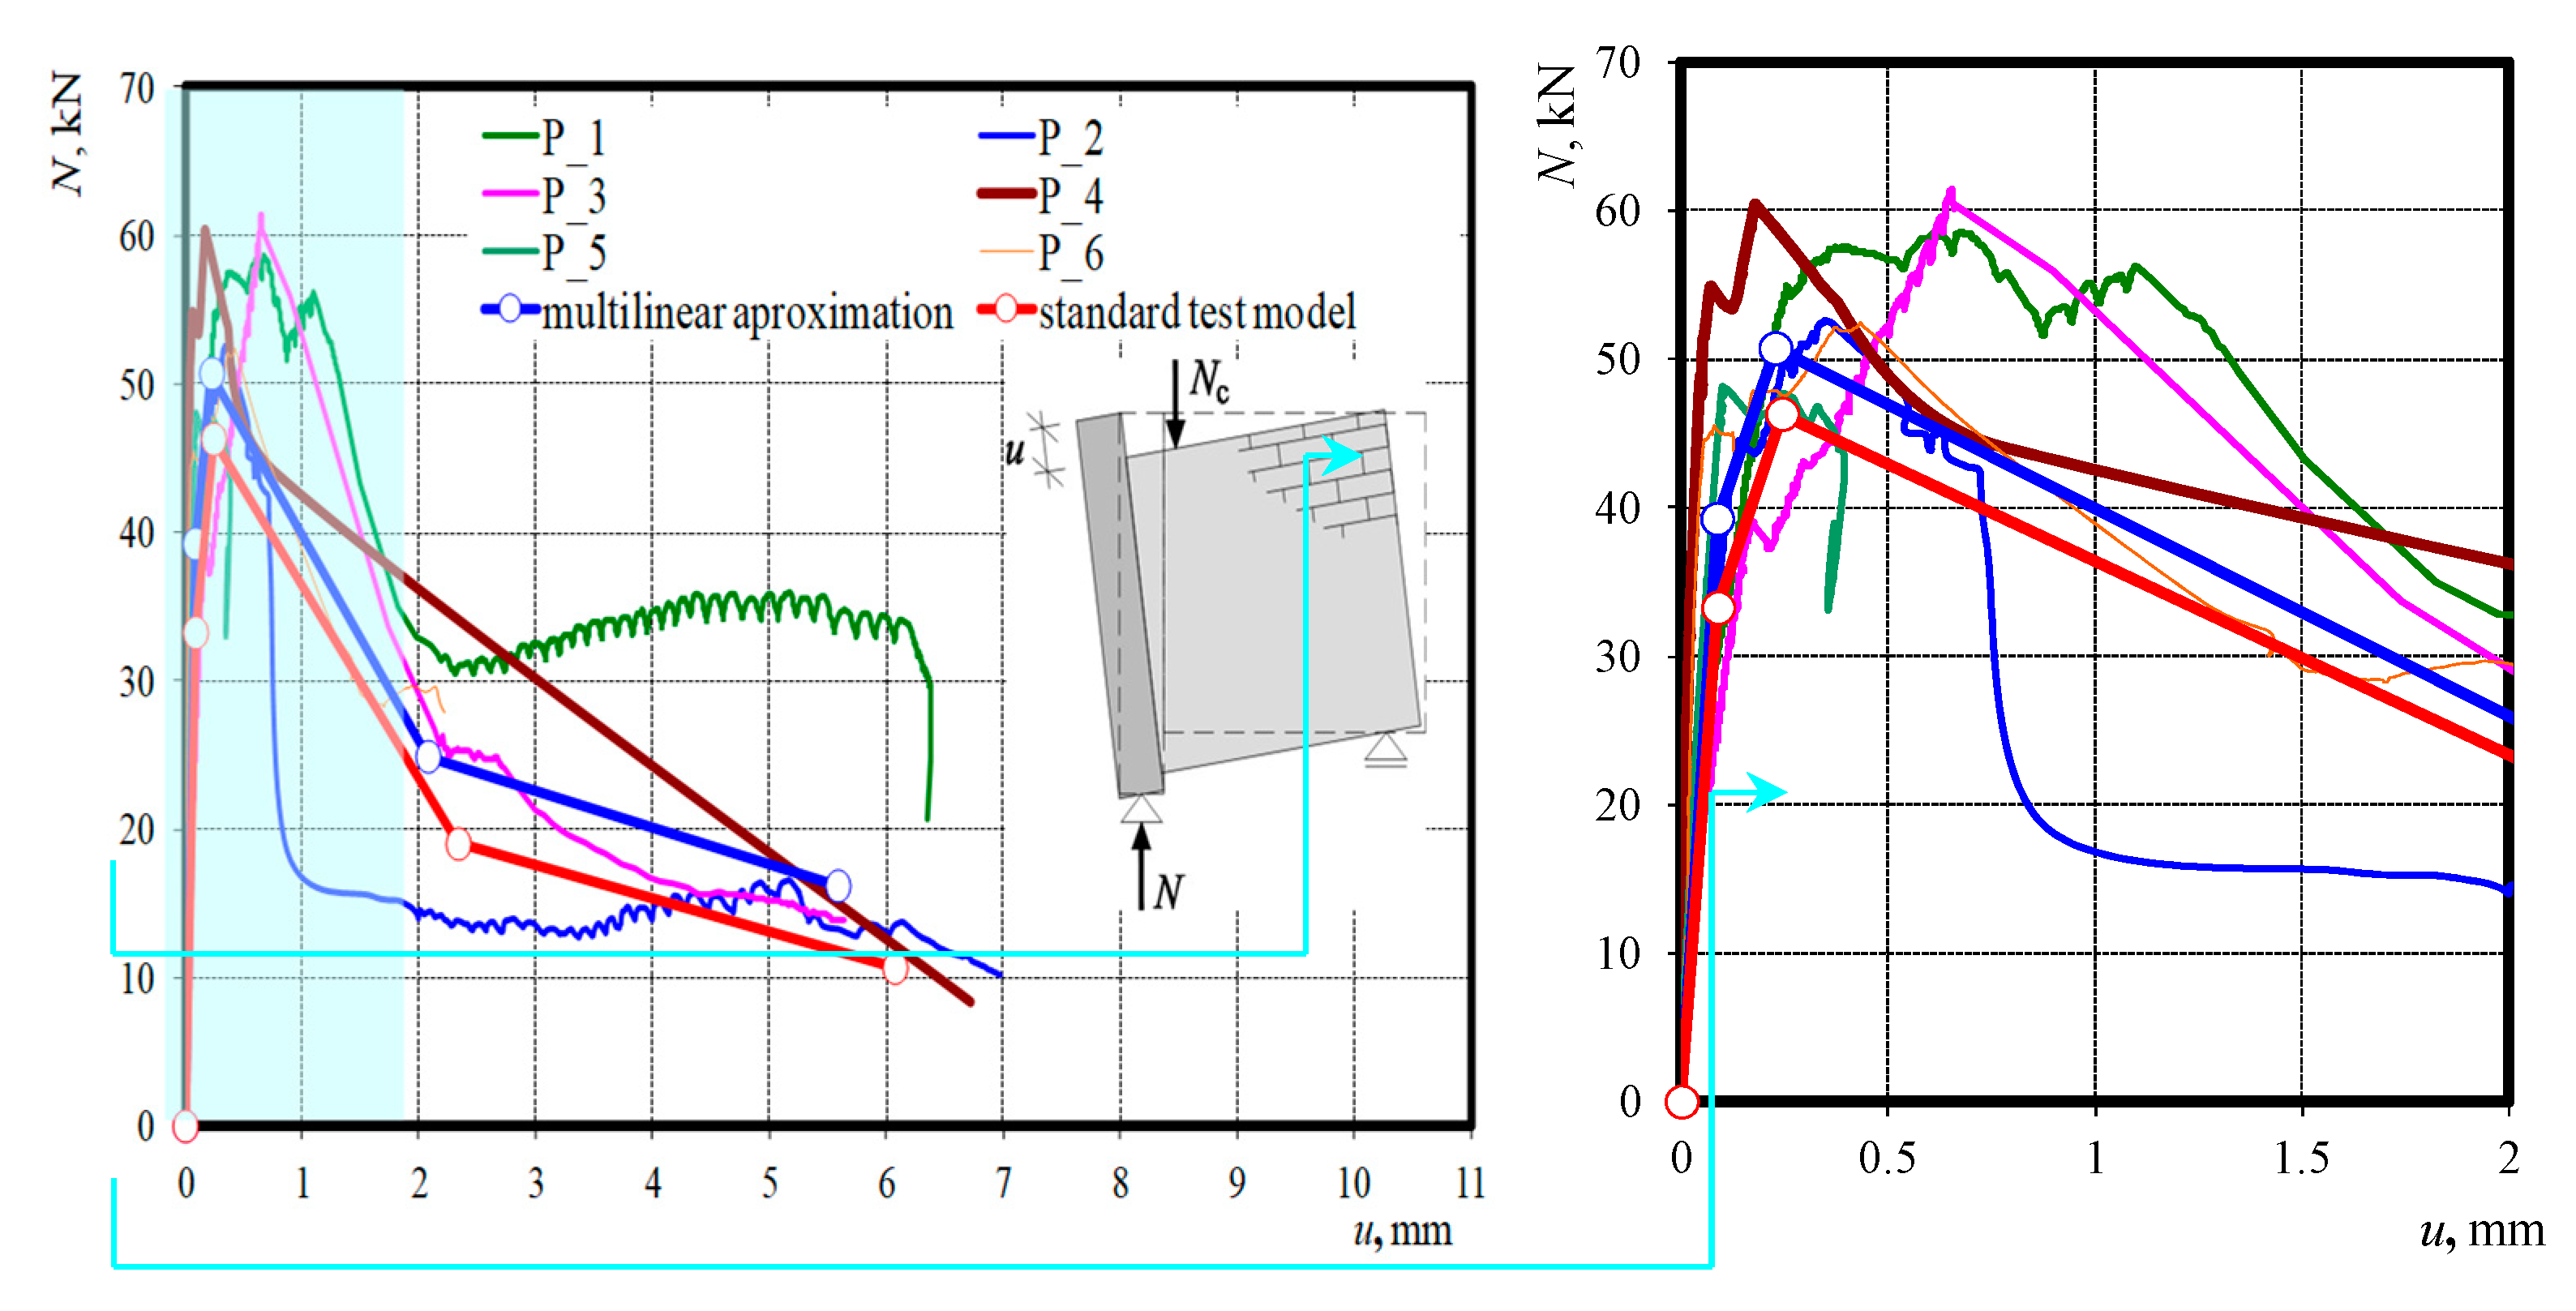
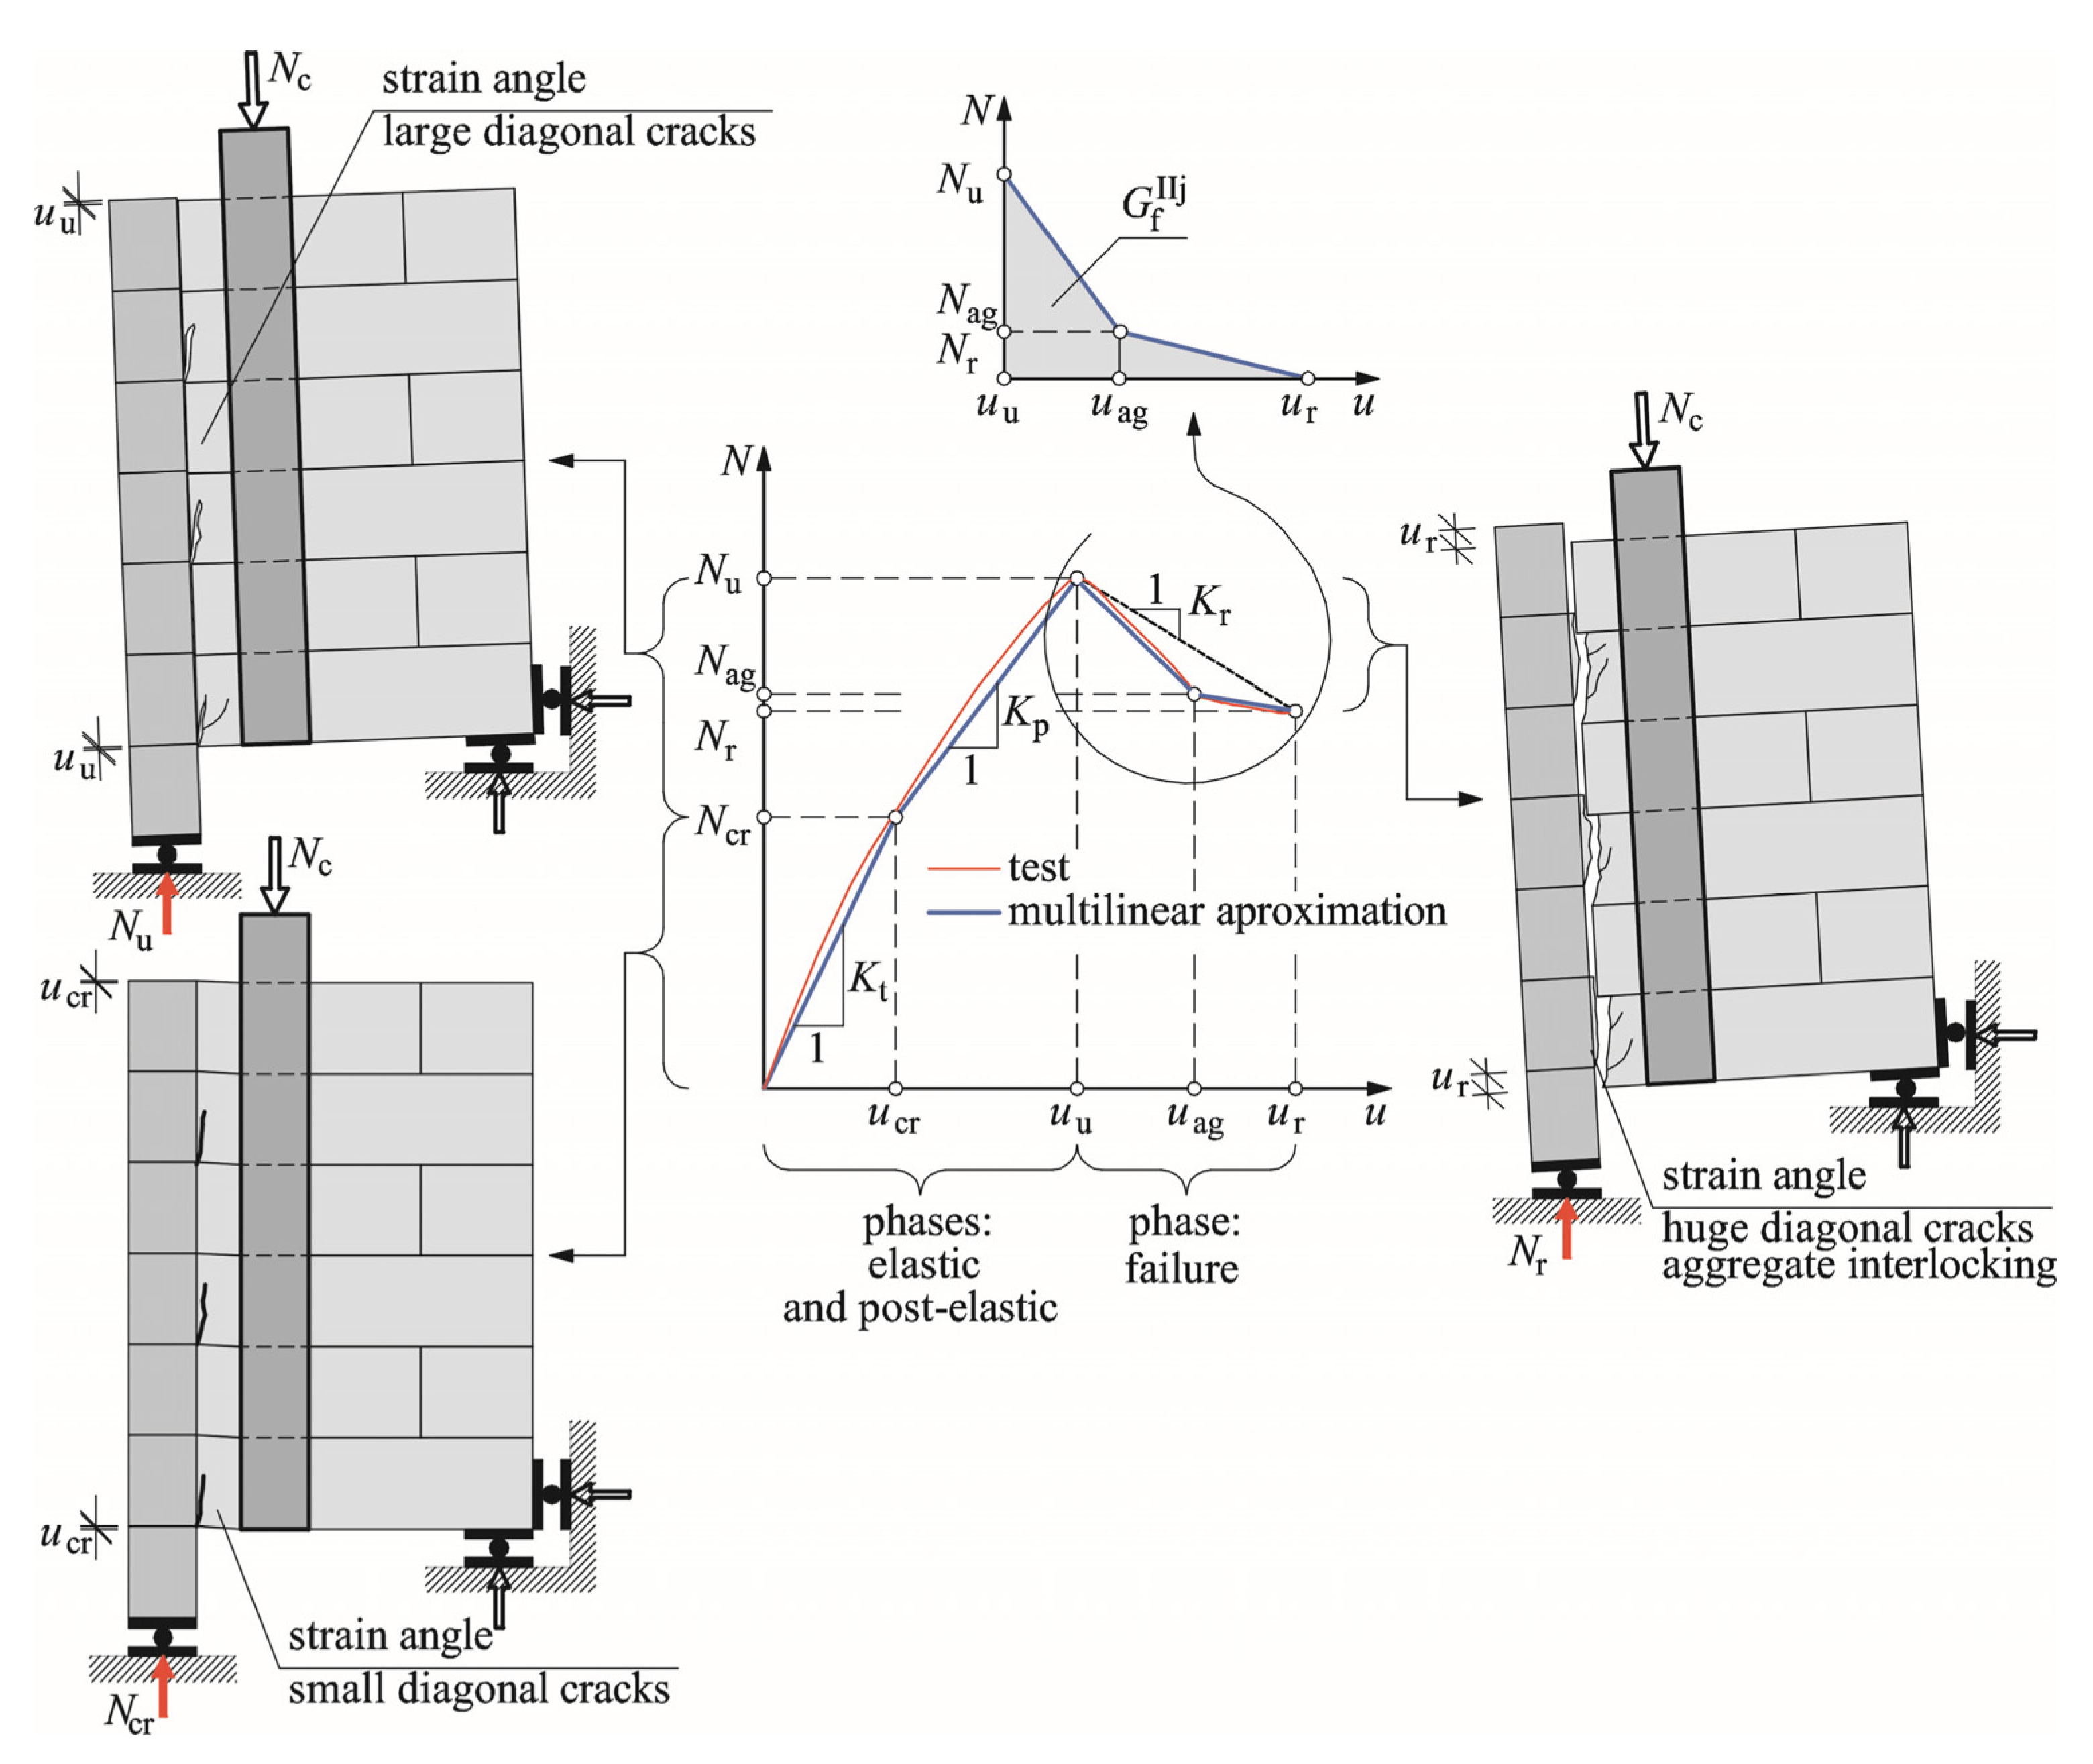
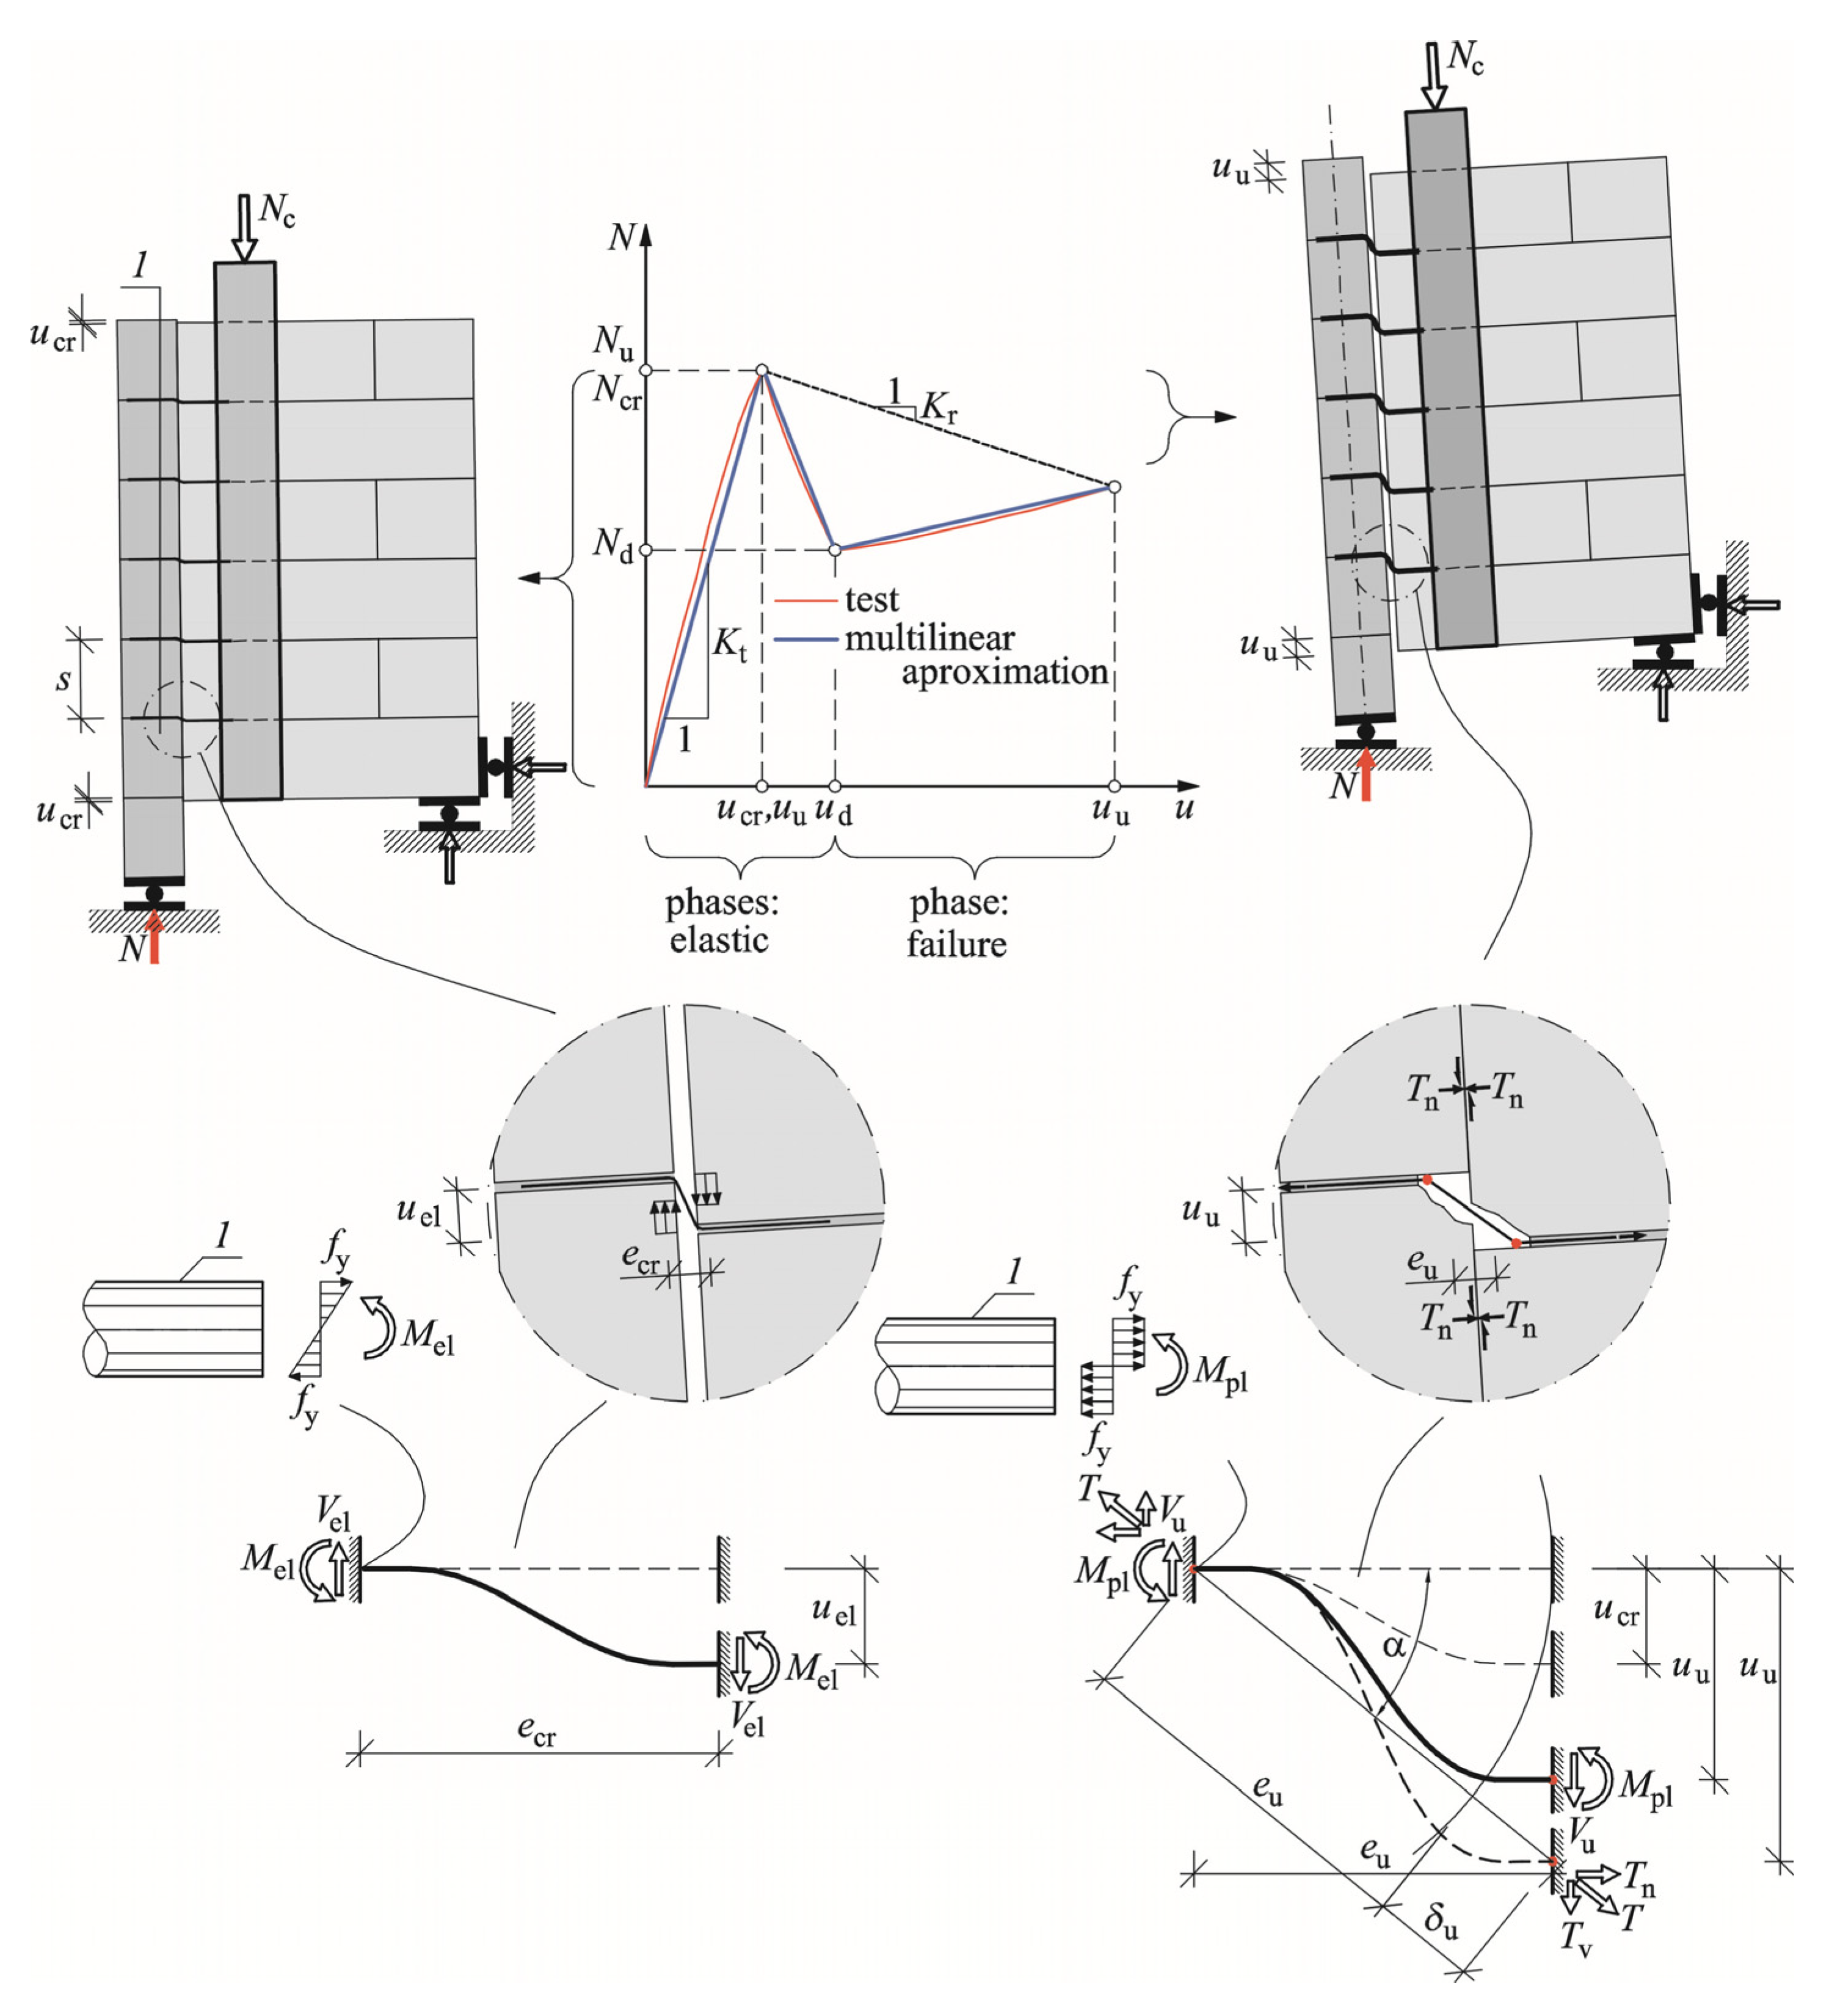
3.1. Unreinforced Models
Validation of the Model with Unreinforced Wall Joints
- a)
- A non-linear relationship N–u determined from tests could be replaced with a multi-linear relationship expressing all observed phases:
- i.
- The elastic phase observed in the load range 0–Ncr;
- ii.
- The post-elastic phase observed in the load range Ncr–Nu;
- iii.
- The failure phase observed in the load range Nu–Nag–Nr.
- b)
- It was suggested that all material parameters used in the model should be specified using standard and normalised methods;
- c)
- The model would be subjected to statistical validation on the basis of performed tests.
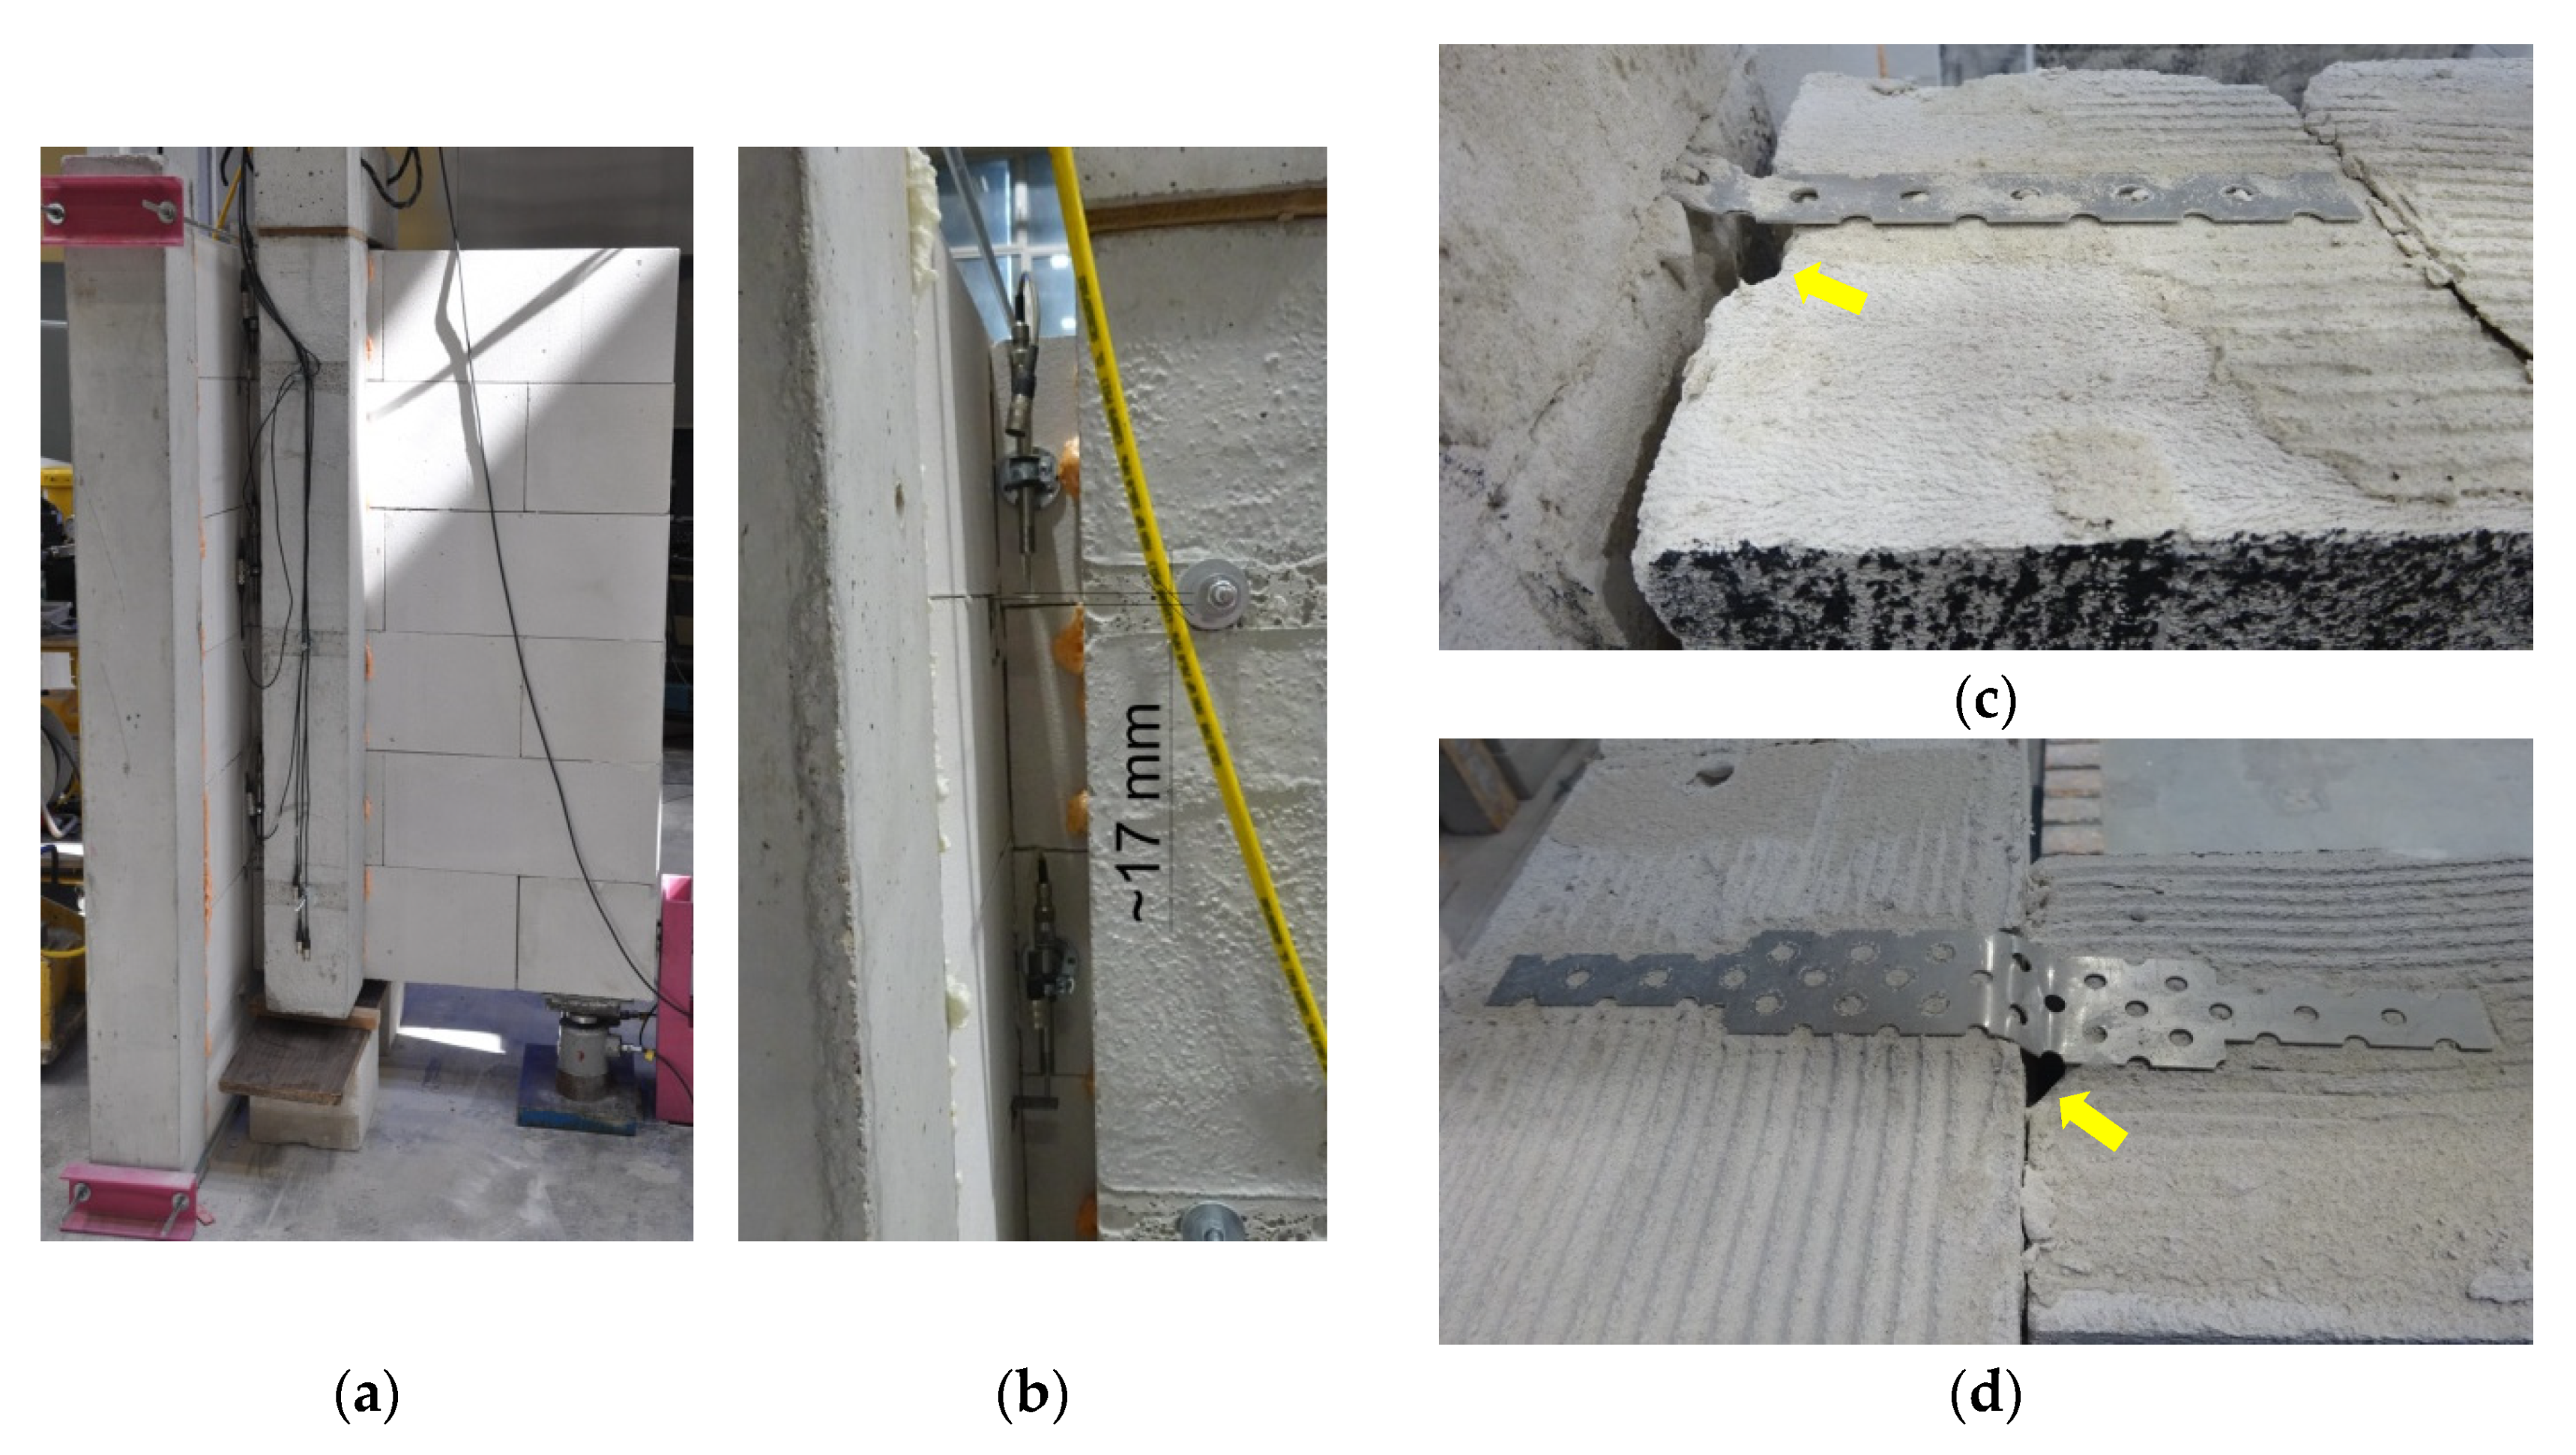
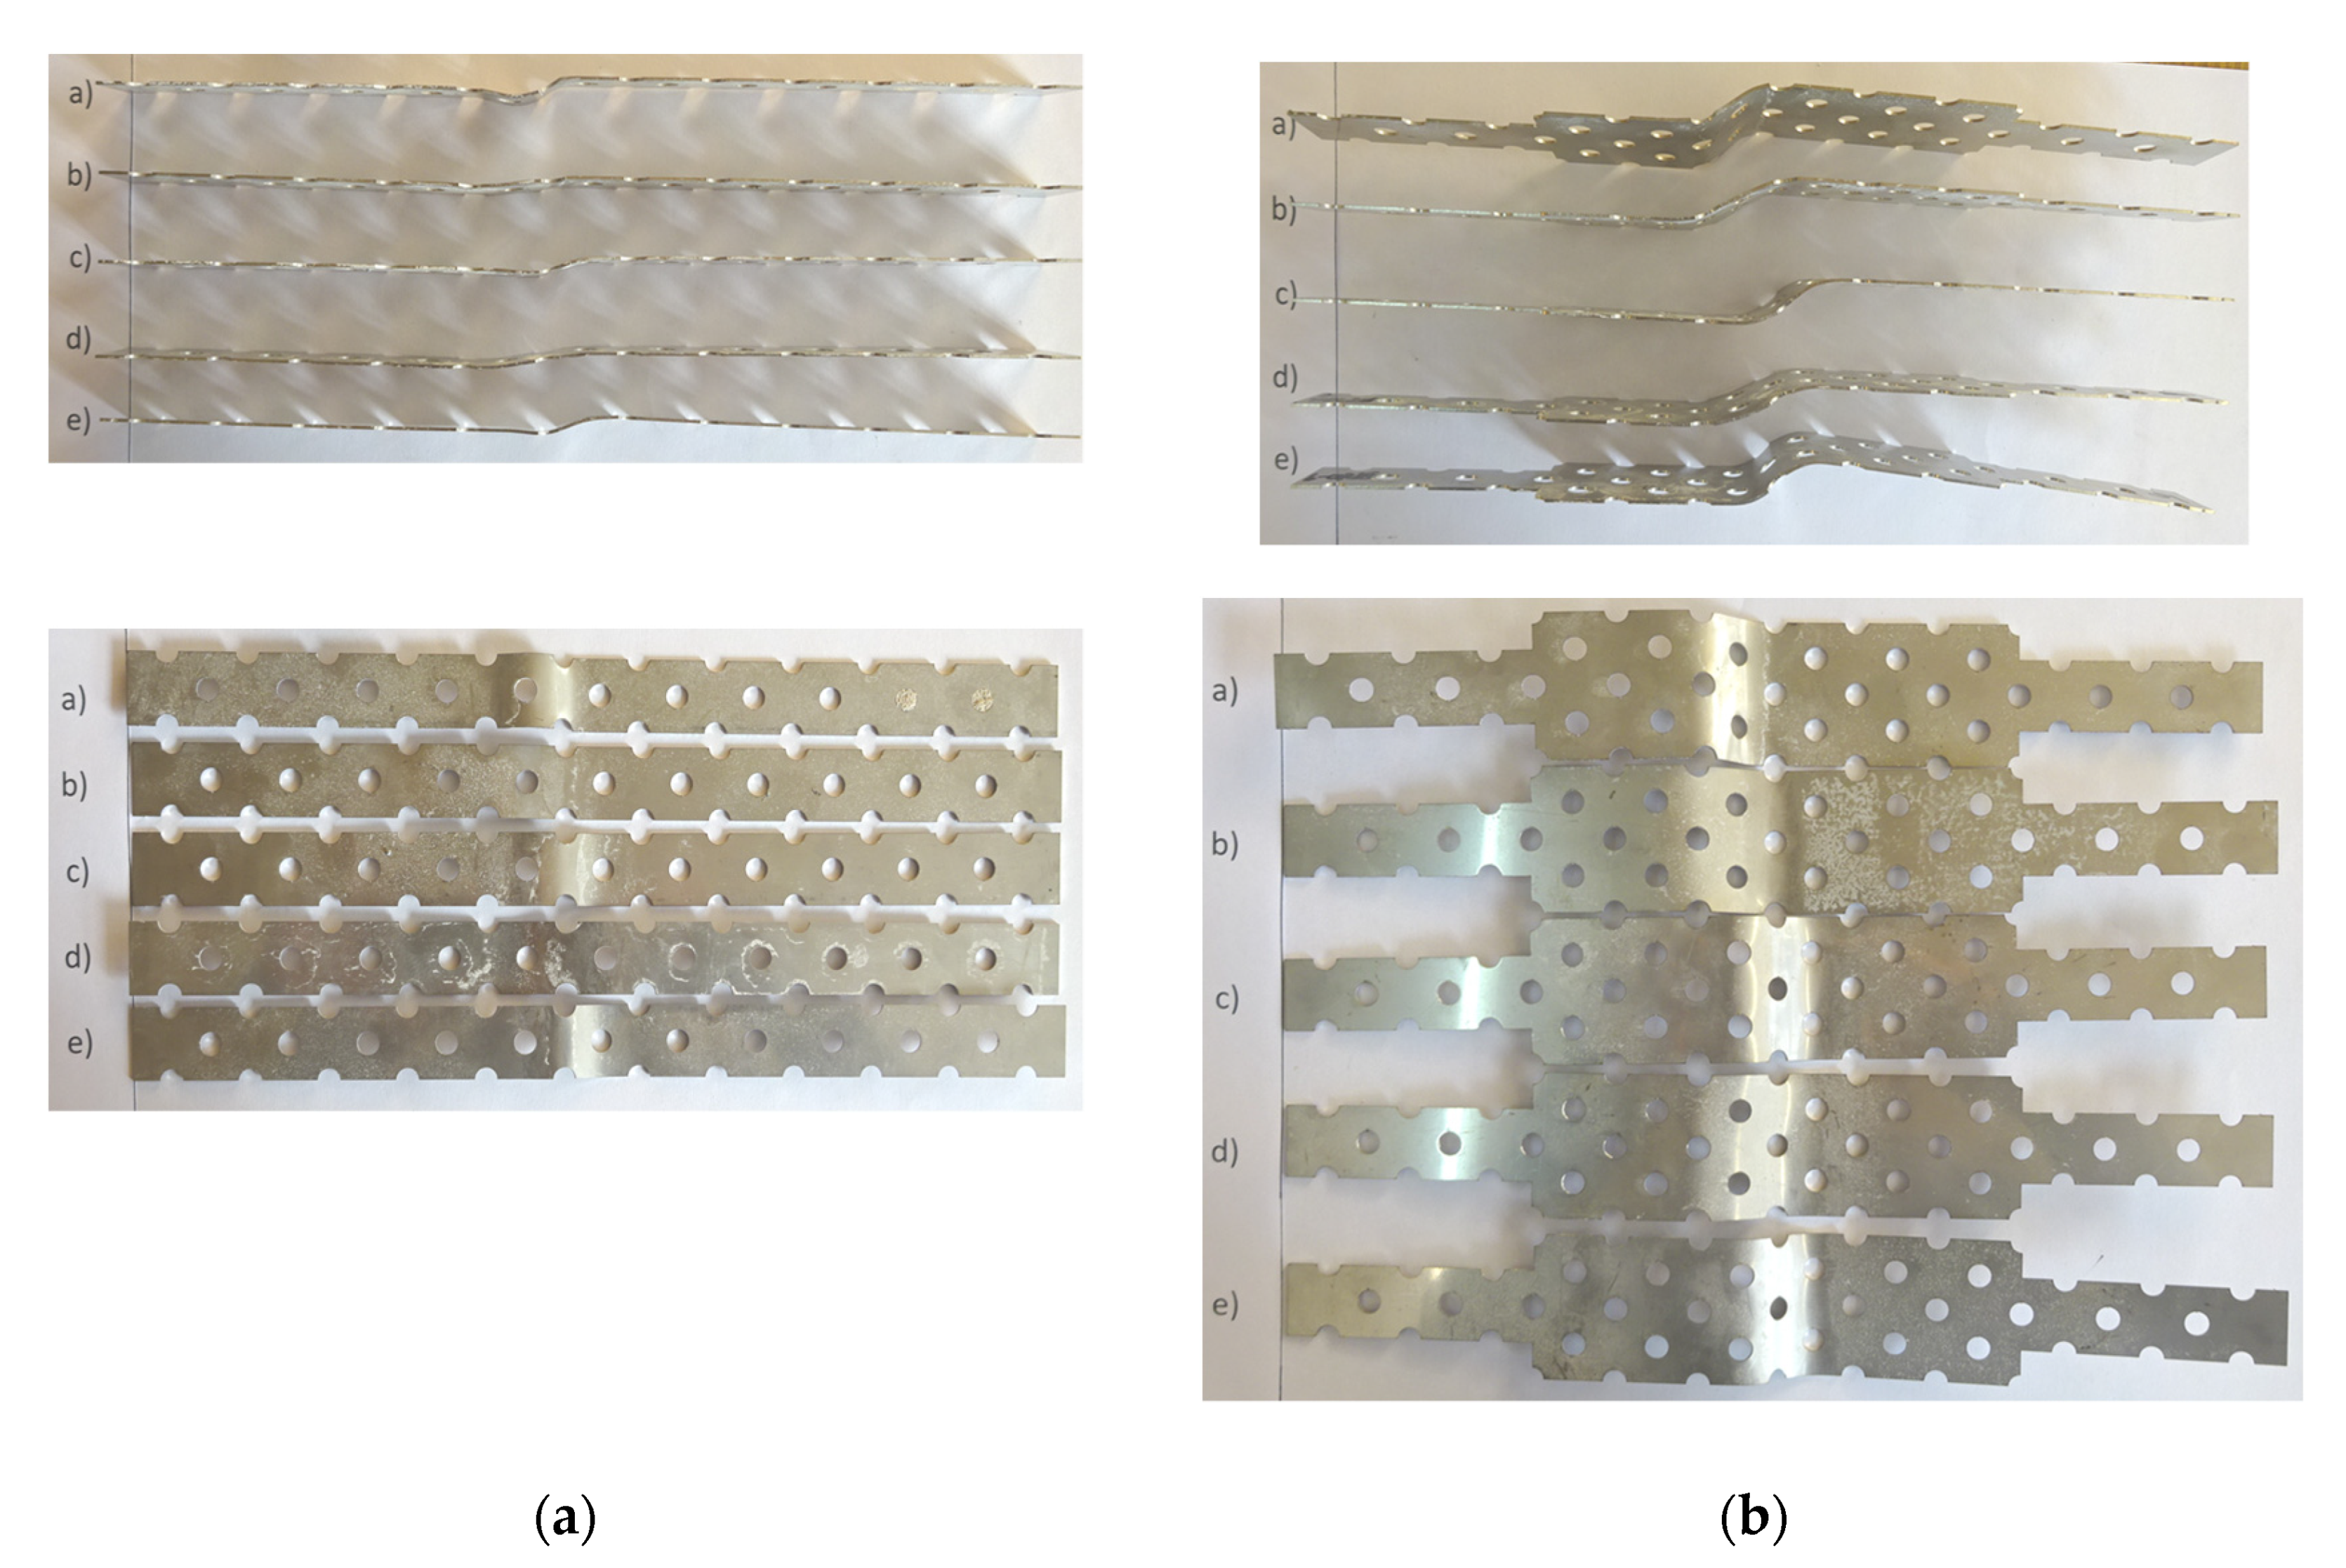
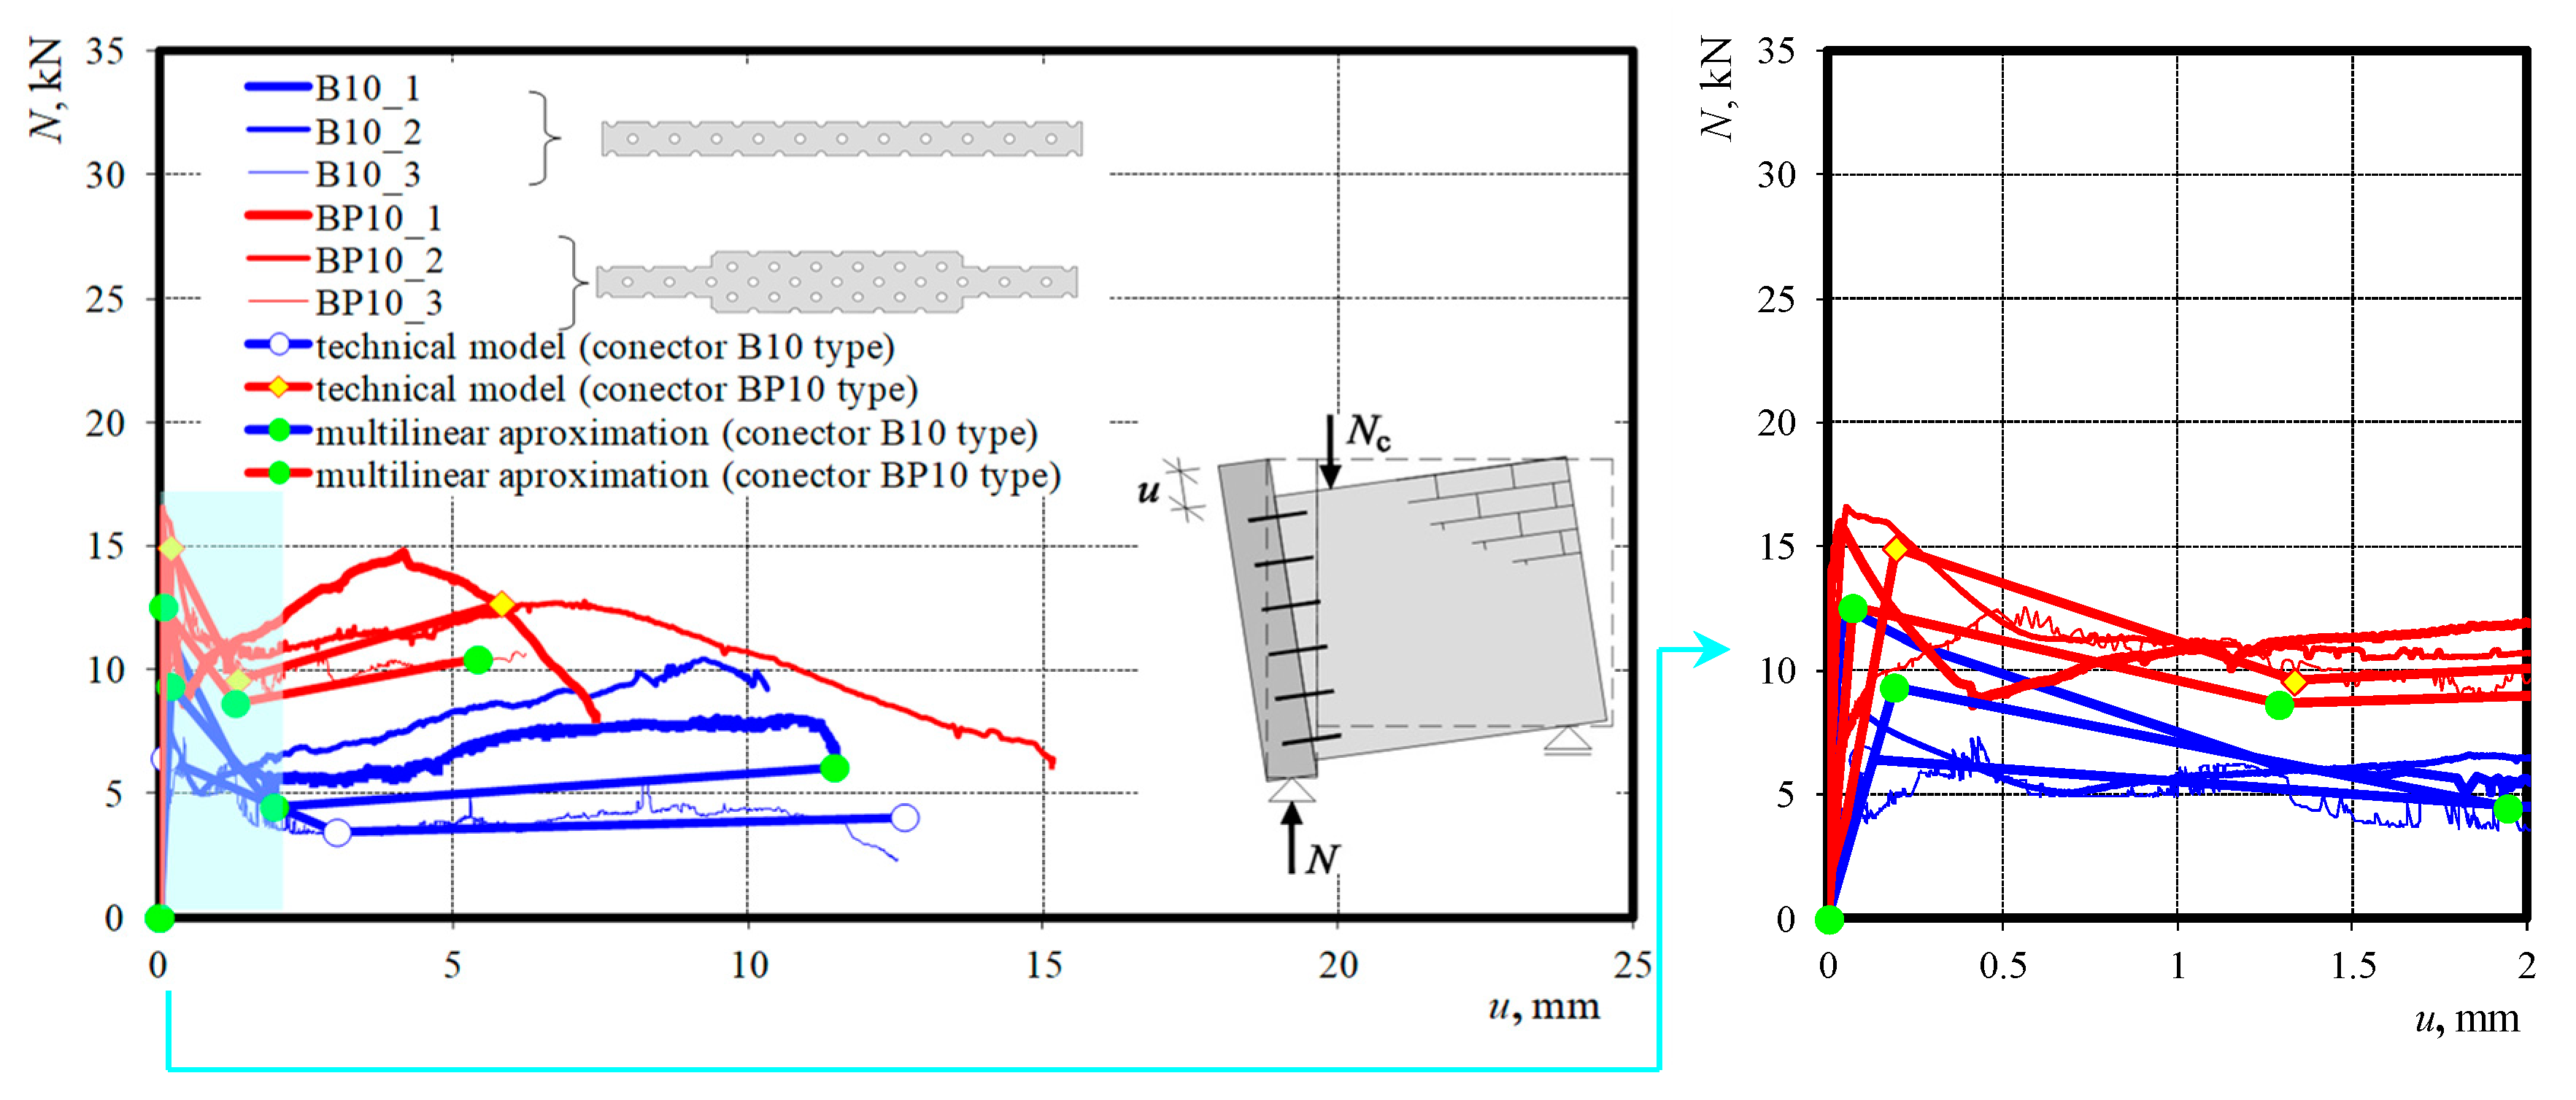
3.2. Reinforced Models
Validation of the Model Representing Reinforced Joints in Walls
- d)
- A non-linear relationship N–u determined from tests was replaced with a multi-linear relationship expressing all observed phases:
- i.
- the elastic phase observed in the load range 0 – Ncr = Nu;
- ii.
- the failure phase observed in the load range Nu–Nd–Nr.
- e)
- It was suggested that all material parameters used in the model should be specified using standard and normalised methods;
- f)
- An elastic and perfectly plastic model of the connector was used;
- g)
- The model would be subjected to statistical validation on the basis of performed tests.
4. Conclusions
Author Contributions
Funding
Acknowledgments
Conflicts of Interest
References
- Castro, L.O.; Alvarenga, R.D.C.S.; Silva, R.M.; Ribeiro, J.C.L. Experimental evaluation of the interaction between strength concrete block walls under vertical loads. Revista Ibracon de Estruturas e Materiais 2016, 9, 643–681. [Google Scholar] [CrossRef]
- Paganoni, S.; D’Ayala, D. Testing and design procedure for corner connections of masonry heritage buildings strengthened by metallic grouted anchors. Eng. Struct. 2014, 70, 278–293. [Google Scholar] [CrossRef]
- Maddaloni, G.; Balsamo, A.; Di Ludovico, M.; Prota, A. Out of Plane Experimental Behavior of T-Shaped Full Scale Masonry Orthogonal Walls Strengthened with Innovative Composite Systems. In Proceedings of the Fourth International Conference on Sustainable Construction Materials and Technologies, Las Vegas, NV, USA, 7–11 August 2016. [Google Scholar]
- Maddaloni, G.; Di Ludovico, M.; Balsamo, A.; Prota, A. Out-of-plane experimental behaviour of T-shaped full scale masonry wall strengthened with composite connections. Compos. Part B Eng. 2016, 93, 328–343. [Google Scholar] [CrossRef]
- Galman, I.; Jasiński, R.; Hahn, T.; Konopka, K. Study of joints masonry walls. Materiały Budowlane 2017, 10, 94–96. (In Polish) [Google Scholar] [CrossRef]
- Galman, I.; Jasiński, R. Joints in masonry walls. Ce/papers 2018, 2, 339–346. [Google Scholar] [CrossRef]
- Galman, I.; Jasiński, R. Tests of joints in AAC masonry walls. Arch. Civ. Eng. Environ. 2018, 11, 79–92. [Google Scholar] [CrossRef]
- Polish Patent Office. Wall Joint Connector. Niepodległości 188/192, 00-950 Warsaw (Poland). Patent No. W.128,153, 1 April 2019. [Google Scholar]
- PN-EN 1052-1:2000 Methods of Tests for Masonry. Part 1: Determination of Compression Strength; Polish Committee for Standardization (PKN): Warsaw, Poland, 2000. (In Polish) [Google Scholar]
- Jasiński, R.; Drobiec, Ł. Comparison Research of Bed Joints Construction and Bed Joints Reinforcement on Shear Parameters of AAC Masonry Walls. J. Civ. Eng. Arch. 2016, 10, 1329. [Google Scholar] [CrossRef]
- PN-EN 1052-3:2004 Methods of Tests for Masonry. Part 3: Determination of Initial Shear Strength; Polish Committee for Standardization (PKN): Warsaw, Poland, 2004. (In Polish) [Google Scholar]
- Drobiec, Ł.; Jasiński, R. Influence of the kind of mortar on mechanical parameters of AAC masonry subjected to shear – the basic strength parameters. Materiały Budowlane 2015, 5, 106–109. (In Polish) [Google Scholar] [CrossRef]
- Jasiński, R. Research and Modelling of Masonry Shear. Walls. Thesis, Silesian University of Technology, Gliwice, Poland, 2017. [Google Scholar]
- ASTM E519-81. Standard Test Method for Diagonal Tension (Shear) of Masonry Assemblages; American Society for Testing and Materials: West Conshohocken, PA, USA, 2000. [Google Scholar]
- Drobiec, Ł.; Jasiński, R. Influence of the kind of mortar on mechanical parameters of AAC masonry subjected to shear—dilatational deformability. Materiały Budowlane 2015, 7, 116–119. (In Polish) [Google Scholar] [CrossRef]
- PN-EN 10002-1:2004 Metallic Materials—Tensile Testing. Part 1. Method of Test at Ambient Temperature; Polish Committee for Standardization (PKN): Warsaw, Poland, 2004. (In Polish) [Google Scholar]
- Galman, I.; Jasiński, R. Attempt to Describe the Mechanism of Work of Masonry Joints. IOP Conf. Series Mater. Sci. Eng. 2019, 471, 052054. [Google Scholar] [CrossRef]
- Volk, W. Applied Statistics for Engineers; Literary Licensing, LLC: Whitefish, MT, USA, 2013. [Google Scholar]
- David, F.; Robert, P.; Roger, P. Statistics, 4th ed.; W.W. Norton & Company: New York, NY, USA, 2007. [Google Scholar]
- Simudic, G.; Page, A.W. Australian Developments in the Use of Walls of Geometric Section. In Proceedings of the 7th North American Masonry Conference, University of Notre Dame-South Bend, South Bend, IN, USA, 2–5 June 1996; Volume 2, pp. 1007–1018. [Google Scholar]
- Phipps, M.E.; Montague, T.I. The Behaviour and Design of Steel Shear Connectors in Plain and Prestressed Masonry. In Proceedings of the 7th North American Masonry Conference, University of Notre Dame-South Bend, South Bend, IN, USA, 2–5 June 1996; Volume 2, pp. 789–798. [Google Scholar]


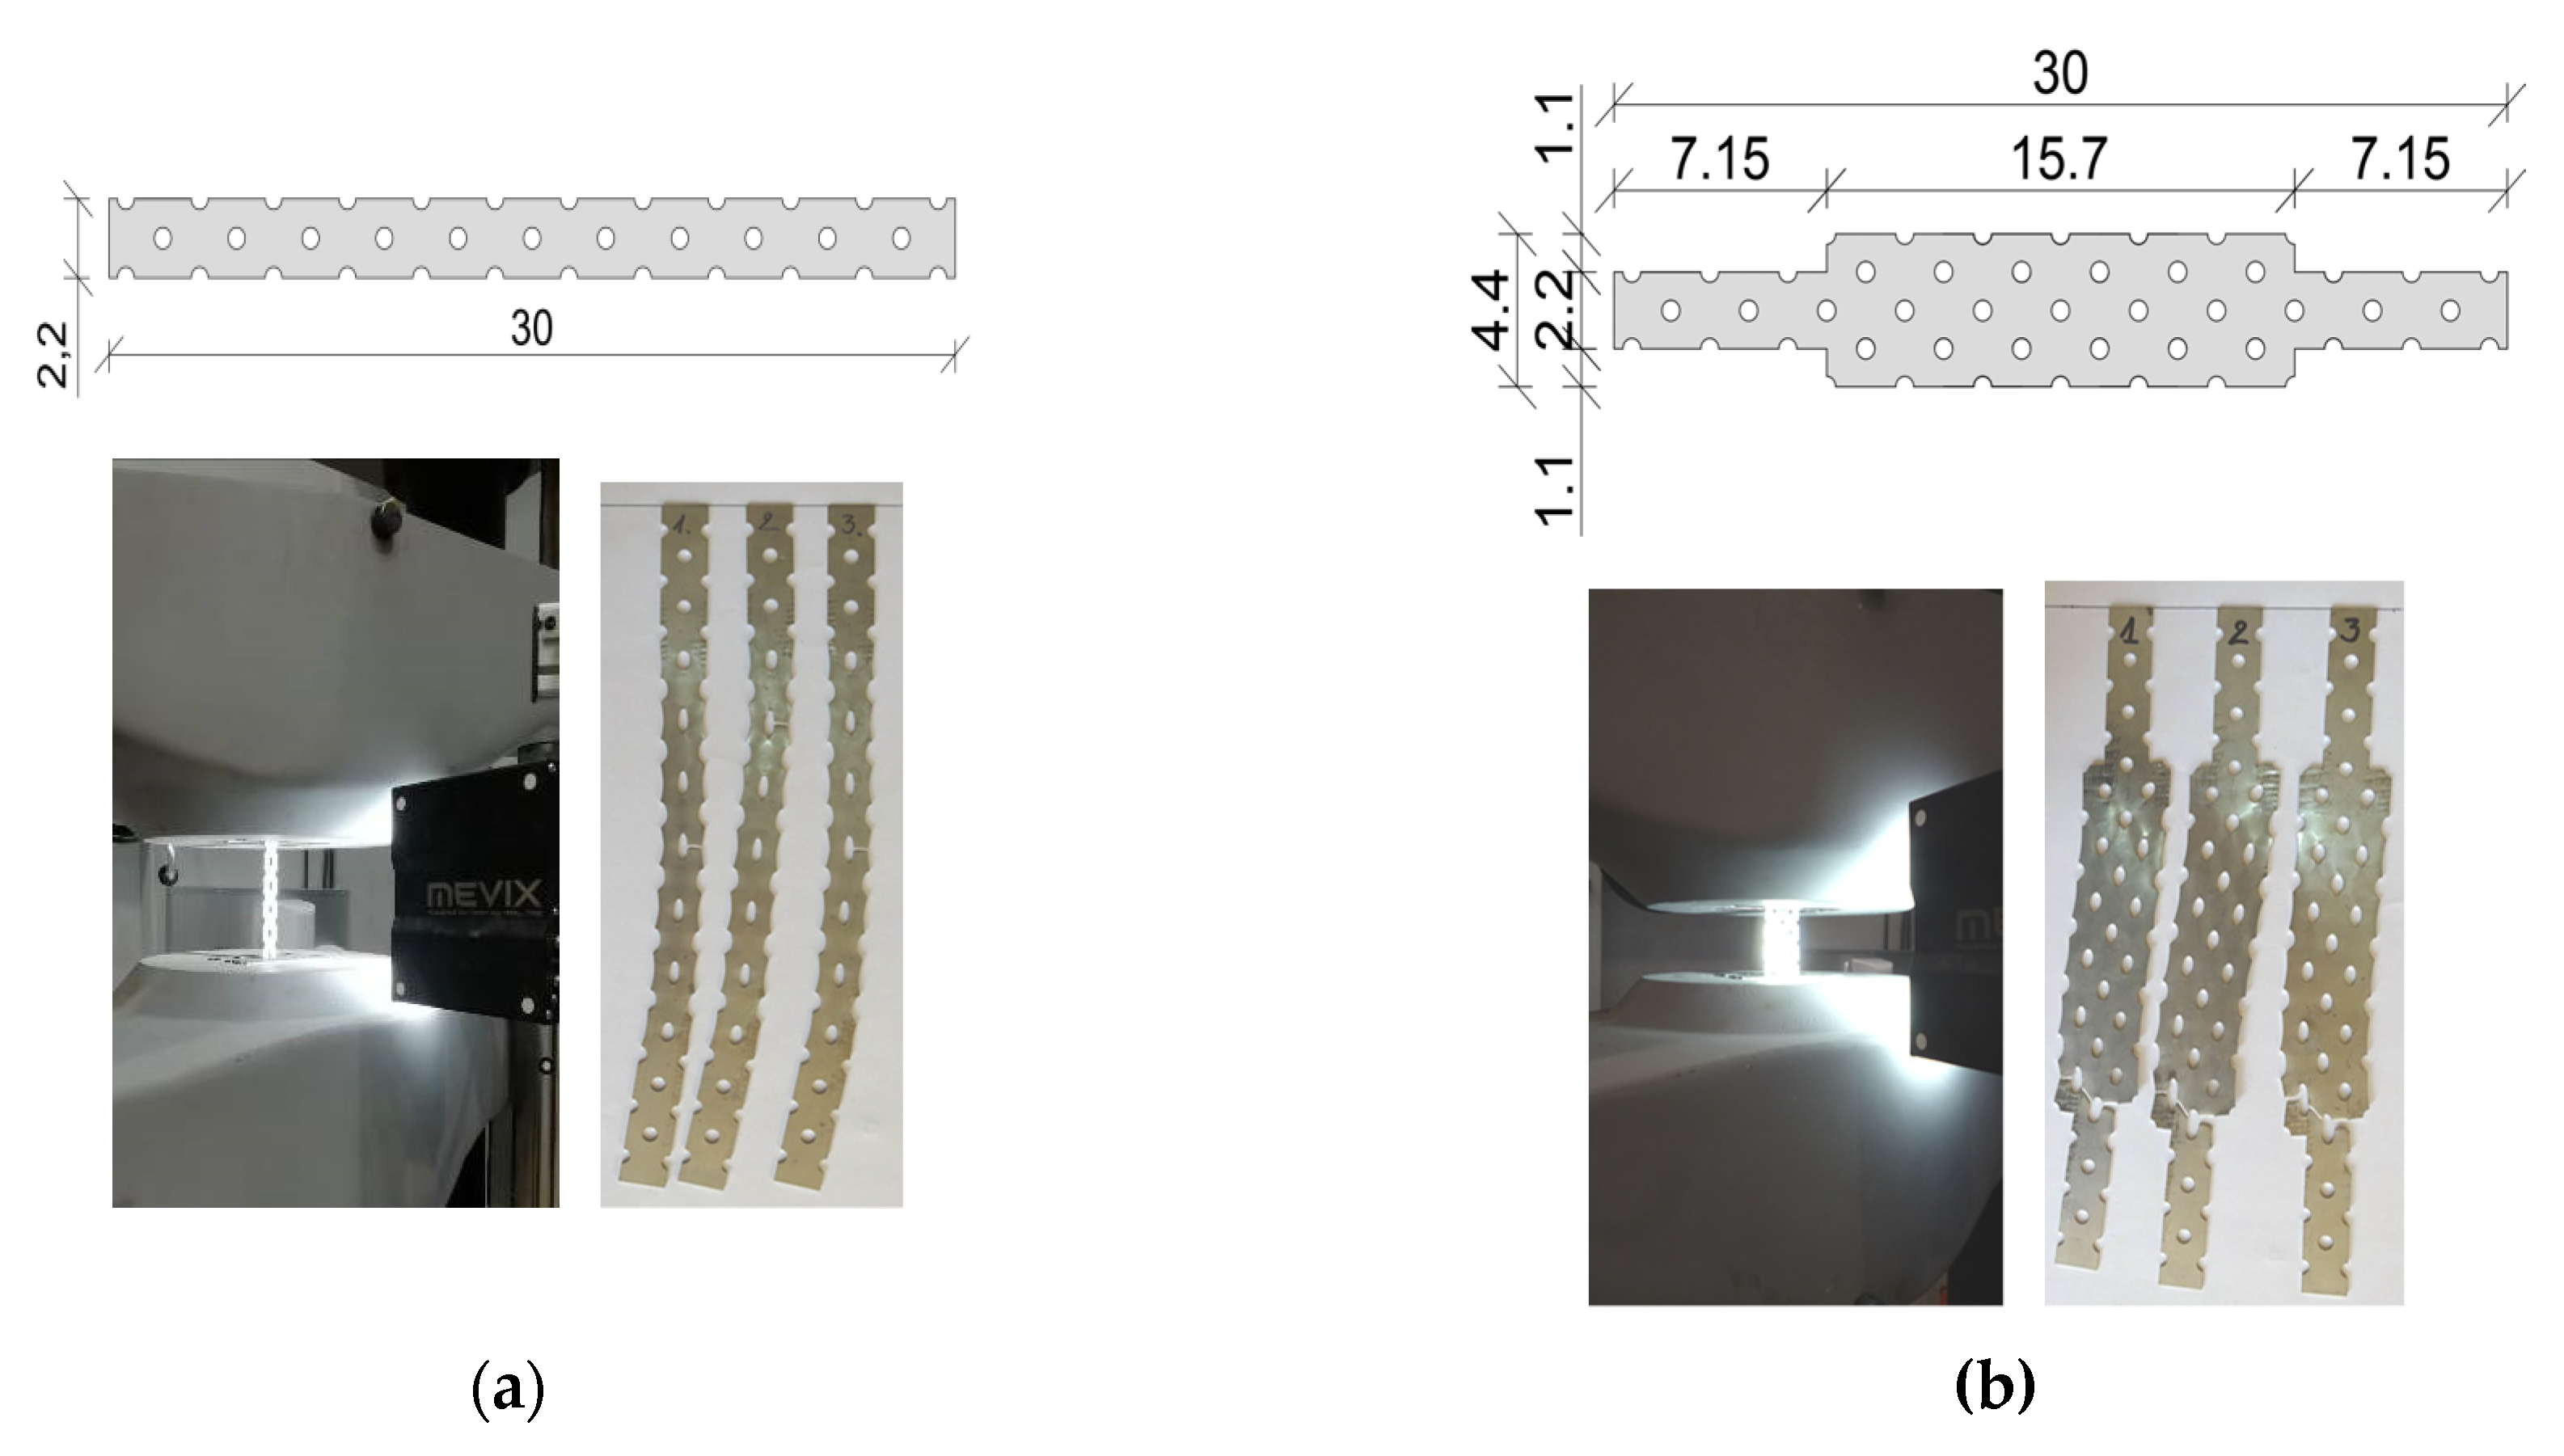
| Name of Series | Type of Joint | A mm2 | I mm4 | fy/ft N/mm2 | Es/Et N/mm2 | Number of Models |
|---|---|---|---|---|---|---|
| P | Traditional masonry bond | -- | -- | -- | -- | 6 |
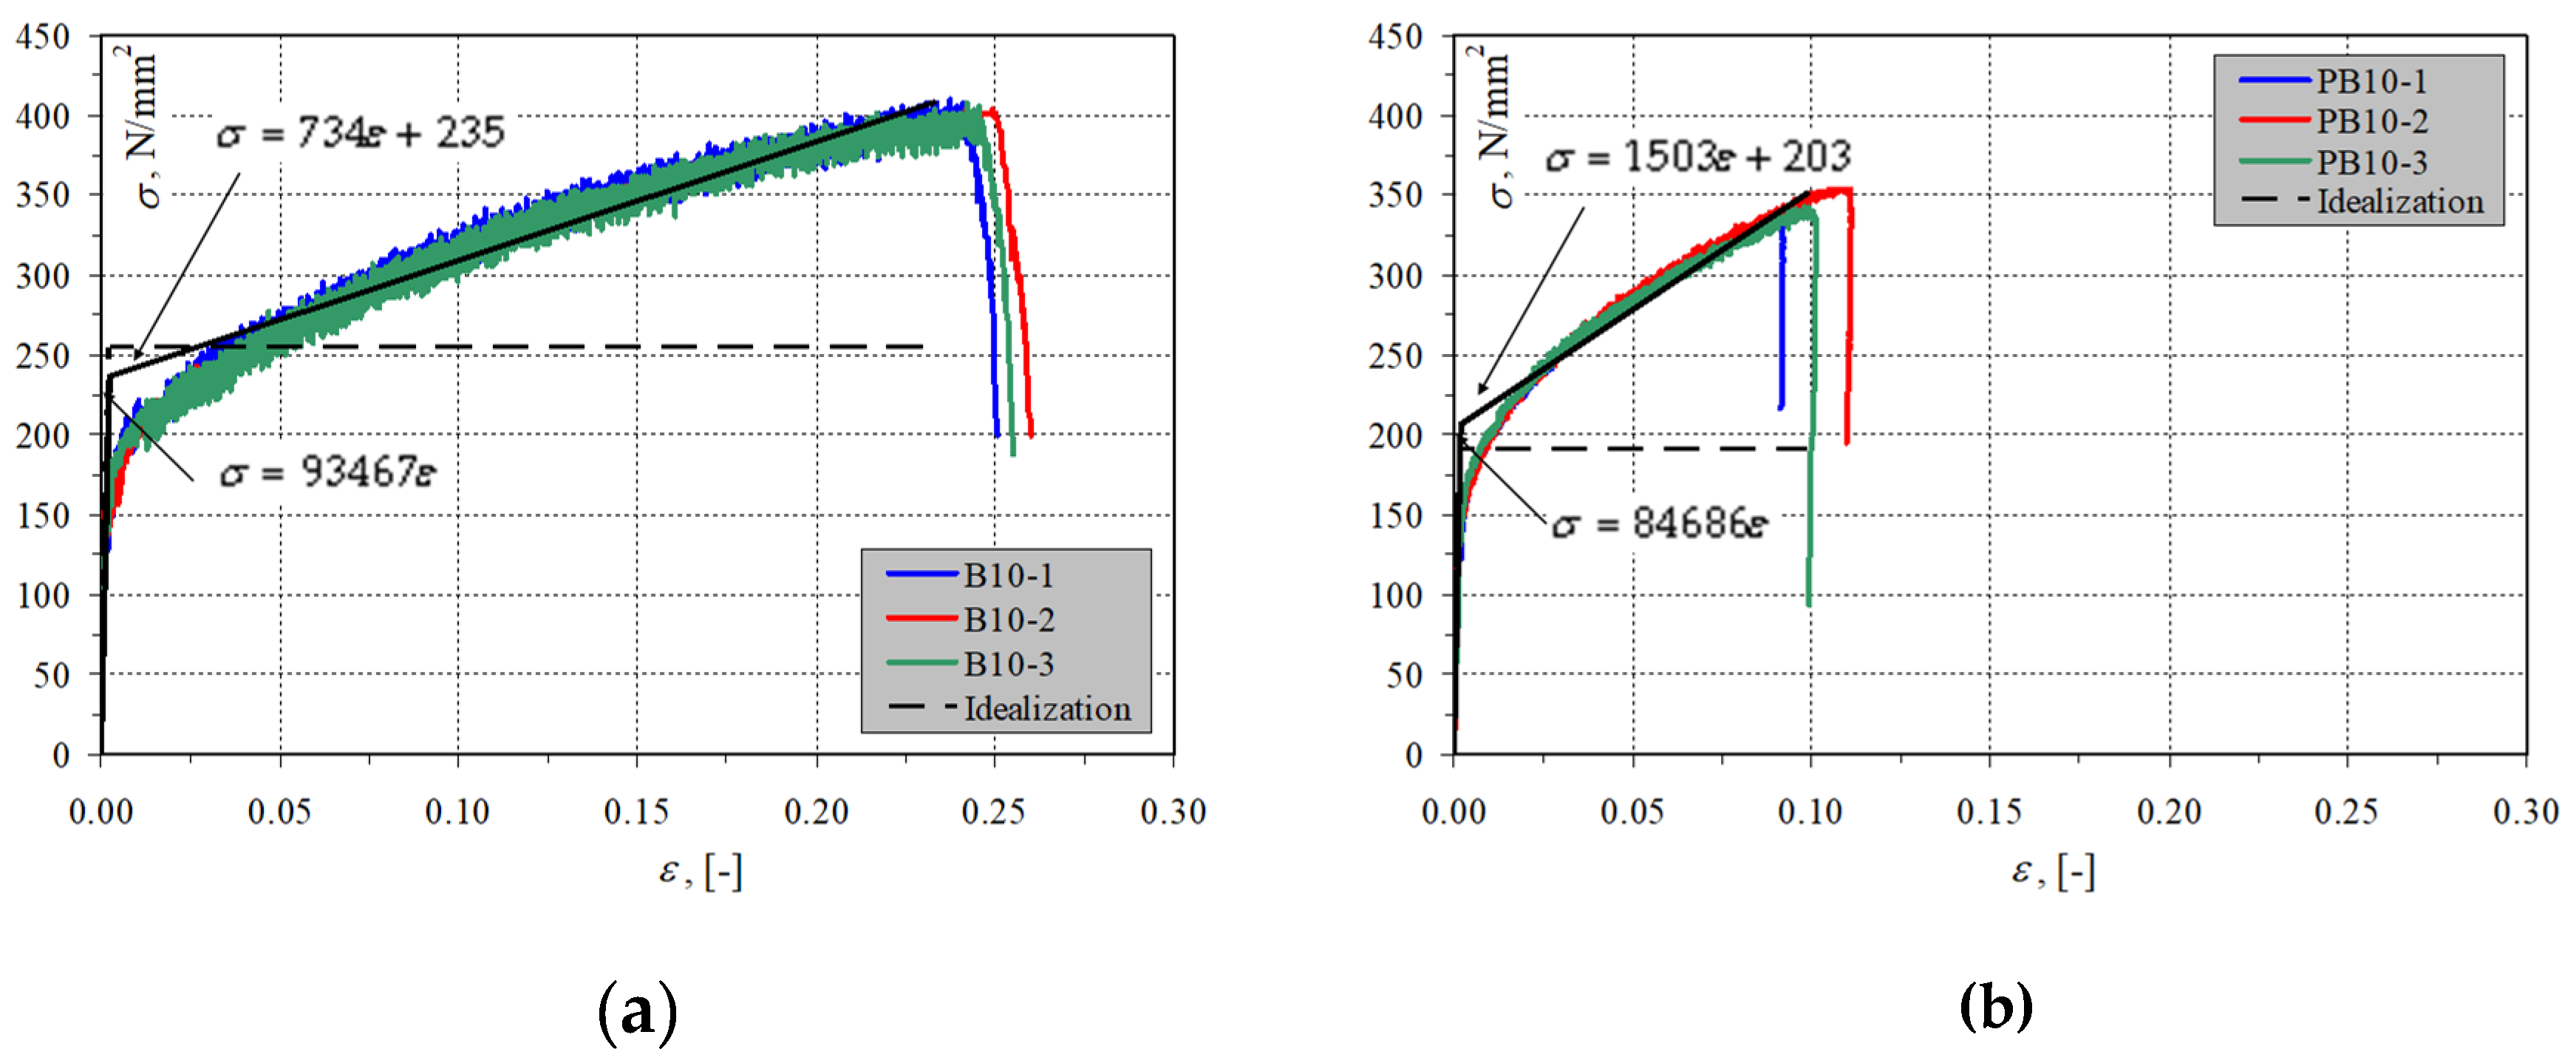
| B10 | Punched steel flat profile B × t = 22 × 1 mm  | 22 | 1.83 | 236/408 | 93467/743 | 3 |
| BP10 | Punched widened flat profile B × t = 44 × 1 mm  | 44 | 3.67 | 207/345 | 84686/1503 | 3 |
| Model | Force at the Time of Cracking | Maximum Force | Aggregate Interlocking Force | Residual Force | ||||
|---|---|---|---|---|---|---|---|---|
| Ncr,i | Ncr,mv | Nu,i | Nu,mv | Nag | Nag,mv,i | Nr,i | Nr,mv | |
| kN | kN | kN | kN | kN | kN | kN | kN | |
| P_1 | 27.3 | 39.2 | 56.3 | 50.7 | 31.1 | 24.9 | 20.7 | 16.2 |
| P_2 | 42.6 | 50.0 | 14.7 | 10.2 | ||||
| P_3 | 31.2 | 38.6 | 25.5 | 13.8 | ||||
| P_4 | 54.1 | 59.8 | -- | 8.36 | ||||
| P_5 | 35.1 | 48.1 | -- | -- | ||||
| P_6 | 45.1 | 51.6 | 28.264 | 27.9 | ||||
| Model | Displacement at the Time of Cracking | Displacement Right before Failure | Displacement at Aggregate Interlocking Force | Residual Displacement | ||||
|---|---|---|---|---|---|---|---|---|
| ucr,i | ucr,mv | uu,i | uu,mv | uag,i | uag,mv | ur,i | ur,mv | |
| mm | mm | mm | mm | mm | mm | mm | mm | |
| P_1 | 0.07 | 0.09 | 0.31 | 0.23 | 2.43 | 2.08 | 6.36 | 5.58 |
| P_2 | 0.12 | 0.25 | 1.95 | 6.97 | ||||
| P_3 | 0.12 | 0.16 | 2.22 | 5.64 | ||||
| P_4 | 0.07 | 0.17 | -- | 6.72 | ||||
| P_5 | 0.06 | 0.10 | -- | -- | ||||
| P_6 | 0.08 | 0.36 | 1.71 | 2.22 | ||||
| Model | Elastic Joint Stiffness | Post-Elastic Joint Stiffness | Residual Joint Stiffness | |||
|---|---|---|---|---|---|---|
| Kt,i | Kt,mv | Kp,i | Kp,mv | Kr,i | Kr,mv | |
| MN/m | MN/m | MN/m | MN/m | MN/m | MN/m | |
| P_1 | 413 | 496 | 119 | 123 | 5.89 | 7.39 |
| P_2 | 341 | 60 | 5.93 | |||
| P_3 | 268 | 163 | 4.51 | |||
| P_4 | 804 | 52.8 | 7.86 | |||
| P_5 | 562 | 322 | -- | |||
| P_6 | 590 | 23 | 12.75 | |||
| Model | xi | ||||||
|---|---|---|---|---|---|---|---|
| P_1 | 3.51 | 0.29 | 0.55 | 1.10 | 0.4 | 0.6 | 5.61 |
| P_2 | 2.90 | 0.17 | 0.85 | 0.98 | 0.2 | 0.3 | 4.49 |
| P_3 | 2.27 | 0.61 | 0.62 | 0.76 | 0.3 | 0.5 | 5.13 |
| P_4 | 6.83 | 0.07 | 1.08 | 1.17 | 0.2 | -- | -- |
| P_5 | 4.78 | 0.57 | 0.70 | 0.94 | -- | -- | -- |
| P_6 | 5.01 | 0.04 | 0.90 | 1.01 | 0.5 | 0.6 | 3.94 |
| n | 6 | 6 | 6 | 6 | 5 | 4 | 4 |
| x | 4.22 | 0.29 | 0.79 | 0.99 | 0.32 | 0.49 | 4.80 |
| S | 1.7 | 0.2 | 0.2 | 0.1 | 0.2 | 0.1 | 0.7 |
| 1.48 | 1.48 | 1.48 | 1.48 | 1.53 | 1.64 | 1.64 | |
| 3.22 | 0.14 | 0.67 | 0.91 | 0.21 | 0.37 | 4.20 | |
| 5.22 | 0.44 | 0.91 | 1.08 | 0.43 | 0.60 | 5.39 | |
| Joint Phase | Force | Stiffness | Displacement |
|---|---|---|---|
| Elastic phase | |||
| Post-elastic phase | |||
| Failure phase | |||
| Test Results for | Calculated Results for | ||||||
|---|---|---|---|---|---|---|---|
| Forces | Forces | ||||||
| Ncr,mv kN | Nu,mv kN | Nag,mv kN | Nr,mv kN | Ncr,cal kN | Nu,cal kN | Nag,cal kN | Nr,cal kN |
| 39.2 | 50.7 | 24.9 | 16.2 | 33.3 | 46.3 | 19.0 | 10.7 |
| Displacements | Displacements | ||||||
| ucr,mv mm | uu,mv mm | uag,mv mm | ur,mv mm | ucr,cal mm | uu,cal mm | uu,cal mm | ur,cal mm |
| 0.09 | 0.243 | 2.08 | 5.58 | 0.09 | 0.24 | 2.34 | 6.53 |
| Model | Layer of Connectors |  | |||||
|---|---|---|---|---|---|---|---|
| Distance between Points of Contraflexure | Relative Displacement of Connector Ends | Connector Extension | |||||
| eu,i | eu,mv | uu,i | uu,mv | δu,mv | |||
| mm | mm | mm | mm | mm | mm | ||
| 1 | 2 | 3 | 4 | 5 | 6 | 7 | 8 |
| B10_1 | a | 23 | 22 | 9 | 9 | 1.70 | 1.8 |
| b | 21 | 8 | 1.47 | ||||
| c | 20 | 9 | 1.93 | ||||
| d | 24 | 9 | 1.63 | ||||
| d | 21 | 10 | 2.26 | ||||
| B10_2 | a | 26 | 24 | 11 | 10 | 2.23 | 2.2 |
| b | 26 | 10 | 1.86 | ||||
| c | 25 | 11 | 2.31 | ||||
| d | 22 | 10 | 2.17 | ||||
| d | 20 | 10 | 2.36 | ||||
| B10_3 | a | 21 | 23 | 11 | 14 | 2.71 | 3.7 |
| b | 23 | 13 | 3.42 | ||||
| c | 23 | 15 | 4.46 | ||||
| d | 23 | 12 | 2.94 | ||||
| d | 27 | 17 | 4.91 | ||||
| 23 (23t) | -- | 11 (11t) | -- | 2.57 (2.57t) | |||
| BP10_1 | a | 19 | 24 | 12 | 13 | 3.47 | 3.33 |
| b | 27 | 14 | 3.41 | ||||
| c | 24 | 13 | 3.29 | ||||
| d | 29 | 11 | 2.02 | ||||
| d | 23 | 15 | 4.46 | ||||
| BP10_2 | a | 23 | 23 | 17 | 15 | 5.60 | 4.22 |
| b | 22 | 14 | 4.08 | ||||
| c | 27 | 14 | 3.41 | ||||
| d | 22 | 13 | 3.55 | ||||
| d | 23 | 15 | 4.46 | ||||
| 1 | 2 | 3 | 4 | 5 | 6 | 7 | 8 |
| BP10_3 | a | 22 | 23 | 12 | 10 | 3.06 | 2.01 |
| b | 23 | 10 | 2.08 | ||||
| c | 19 | 9 | 2.02 | ||||
| d | 26 | 8 | 1.20 | ||||
| d | 23 | 9 | 1.70 | ||||
| 23 (23t) | -- | 13 (13t) | -- | 3.28 (2.57t) | |||
| Model | Cracking Force | Force at Failure | Dowel Force | Residual Force | ||||
|---|---|---|---|---|---|---|---|---|
| Ncr,i | Ncr,mv | Nu,i | Nu,mv | Nd | Nd,mv,i | Nr,i | Nr,mv | |
| kN | kN | kN | kN | kN | kN | kN | kN | |
| B10_1 | 12.3 | 9.3 | 12.3 | 9.3 | 5.01 | 4.5 | 6.68 | 6.1 |
| B10_2 | 8.41 | 8.41 | 5.02 | 9.20 | ||||
| B10_3 | 7.27 | 7.27 | 3.39 | 2.32 | ||||
| BP10_1 | 15.9 | 14.9 | 15.9 | 14.9 | 8.86 | 9.6 | 14.8 | 12.7 |
| BP10_2 | 16.5 | 16.5 | 10.5 | 12.6 | ||||
| BP10_3 | 12.4 | 12.4 | 9.36 | 10.6 | ||||
| Model | Displacement at the Time of Cracking | Displacement Right before Failure | Displacement at Dowel Force | Residual Displacement | ||||
|---|---|---|---|---|---|---|---|---|
| ucr,i | ucr,mv | uu,i | uu,mv | ud,i | ud,mv | ur,i | ur,mv | |
| mm | mm | mm | mm | mm | mm | mm | mm | |
| B10_1 | 0.07 | 0.19 | 0.07 | 0.19 | 1.83 | 1.94 | 11.50 | 11.45 |
| B10_2 | 0.08 | 0.08 | 0.68 | 10.33 | ||||
| B10_3 | 0.41 | 0.41 | 3.32 | 12.52 | ||||
| BP10_1 | 0.04 | 0.19 | 0.04 | 0.19 | 0.45 | 1.33 | 4.15 | 5.80 |
| BP10_2 | 0.05 | 0.05 | 1.61 | 7.04 | ||||
| BP10_3 | 0.49 | 0.49 | 1.94 | 6.22 | ||||
| Model | Elastic Joint Stiffness | Residual Joint Stiffness | ||
|---|---|---|---|---|
| Kt,i | Kt,mv | Kr,i | Kr,mv | |
| MN/m | MN/m | MN/m | MN/m | |
| B10_1 | 180 | 100 | 0.496 | 0.327 |
| B10_2 | 102 | 0.077 | ||
| B10_3 | 17.8 | 0.409 | ||
| BP10_1 | 432 | 259 | 0.269 | 0.378 |
| BP10_2 | 319 | 0.553 | ||
| BP10_3 | 25.6 | 0.312 | ||
| Model | xi | |||||
|---|---|---|---|---|---|---|
| B10_1 | 0.01117 | 0.10 | 0.00421 | 2.73 | 0.00580 | 17.2 |
| B10_2 | 0.00744 | 0.12 | 0.00422 | 1.02 | 0.00819 | 15.4 |
| B10_3 | 0.00636 | -- | 0.00268 | -- | -- | 18.7 |
| n | 3 | 2 | 3 | 2 | 2 | 3 |
| x | 0.00832 | 0.11 | 0.003702 | 1.88 | 0.00699 | 17.11 |
| S | 0.00253 | 0.0146 | 0.0008880 | 1.21 | 0.00169 | 1.63 |
| 1.89 | 3.08 | 1.89 | 3.08 | 3.08 | 1.89 | |
| 0.00557 | 0.081 | 0.00274 | −0.75 | 0.0033 | 15.33 | |
| 0.01107 | 0.145 | 0.00467 | 4.50 | 0.0107 | 18.89 | |
| BP10_1 | 0.00619 | 0.06 | 0.00328 | 0.00573 | ||
| BP10_2 | 0.00645 | 0.08 | 0.00397 | 2.43 | 0.00484 | 10.6 |
| BP10_3 | 0.00476 | 0.00348 | 2.91 | 0.00401 | 9.4 | |
| n | 3 | 2 | 3 | 2 | 3 | 2 |
| 0.00580 | 0.07 | 0.00358 | 2.67 | 0.00486 | 9.98 | |
| S | 0.000911 | 0.0 | 0.000356 | 0.3 | 0.000859 | 0.877 |
| 1.89 | 3.08 | 1.89 | 3.08 | 1.89 | 3.08 | |
| 0.0048 | 0.0319 | 0.00319 | 1.93 | 0.0039 | 8.1 | |
| 0.0068 | 0.1014 | 0.0040 | 3.41 | 0.0058 | 11.9 | |
| Joint Phase | Force | Stiffness | Displacement |
|---|---|---|---|
| Connector B10 | |||
| Elastic phase | |||
| Failure phase | |||
| Connector BP10 | |||
| Elastic phase | |||
| Failure phase | |||
| Test results for connector B10 | Calculations for connector B10 | ||||
| forces | forces | ||||
| Ncr,mv = Nu,mv kN | Nd,mv kN | Nr,mv kN | Ncr,cal = Nu,cal kN | Nd,cal kN | Nr,cal kN |
| 9.34 | 4.47 | 6.07 | 6.44 | 3.45 | 4.06 |
| Displacements of connector B10 | Calculated displacements of connector B10 | ||||
| ucr,mv = uu,mv mm | uag,mv mm | ur,mv mm | ucr,cal = uu,cal mm | uu,cal mm | ur,cal mm |
| 0.19 | 1.94 | 11.45 | 0.10 | 3.01 | 12.6 |
| Test results for connector BP10 | Calculations for connector BP10 | ||||
| force | force | ||||
| Ncr,mv = Nu,mv kN | Nd,mv kN | Nr,mv kN | Ncr,cal = Nu,cal kN | Nd,cal kN | Nr,cal kN |
| 14.94 | 9.59 | 12.69 | 12.6 | 8.65 | 10.43 |
| Displacements of connector BP10 | Calculated displacements of connector BP10 | ||||
| ucr,mv = uu,mv mm | uag,mv mm | ur,mv mm | ucr,cal = uu,cal mm | uu,cal mm | ur,cal mm |
| 0.19 | 1.33 | 5.80 | 0.07 | 1.29 | 5.40 |
© 2020 by the authors. Licensee MDPI, Basel, Switzerland. This article is an open access article distributed under the terms and conditions of the Creative Commons Attribution (CC BY) license (http://creativecommons.org/licenses/by/4.0/).
Share and Cite
Jasiński, R.; Galman, I. Testing Joints between Walls Made of AAC Masonry Units. Buildings 2020, 10, 69. https://doi.org/10.3390/buildings10040069
Jasiński R, Galman I. Testing Joints between Walls Made of AAC Masonry Units. Buildings. 2020; 10(4):69. https://doi.org/10.3390/buildings10040069
Chicago/Turabian StyleJasiński, Radosław, and Iwona Galman. 2020. "Testing Joints between Walls Made of AAC Masonry Units" Buildings 10, no. 4: 69. https://doi.org/10.3390/buildings10040069
APA StyleJasiński, R., & Galman, I. (2020). Testing Joints between Walls Made of AAC Masonry Units. Buildings, 10(4), 69. https://doi.org/10.3390/buildings10040069