
Influence of the Visitor Walking on Airflow and the Bioaerosol Particles in Typical Open Tomb Chambers: An Experimental and Case Study


Abstract
:1. Introduction
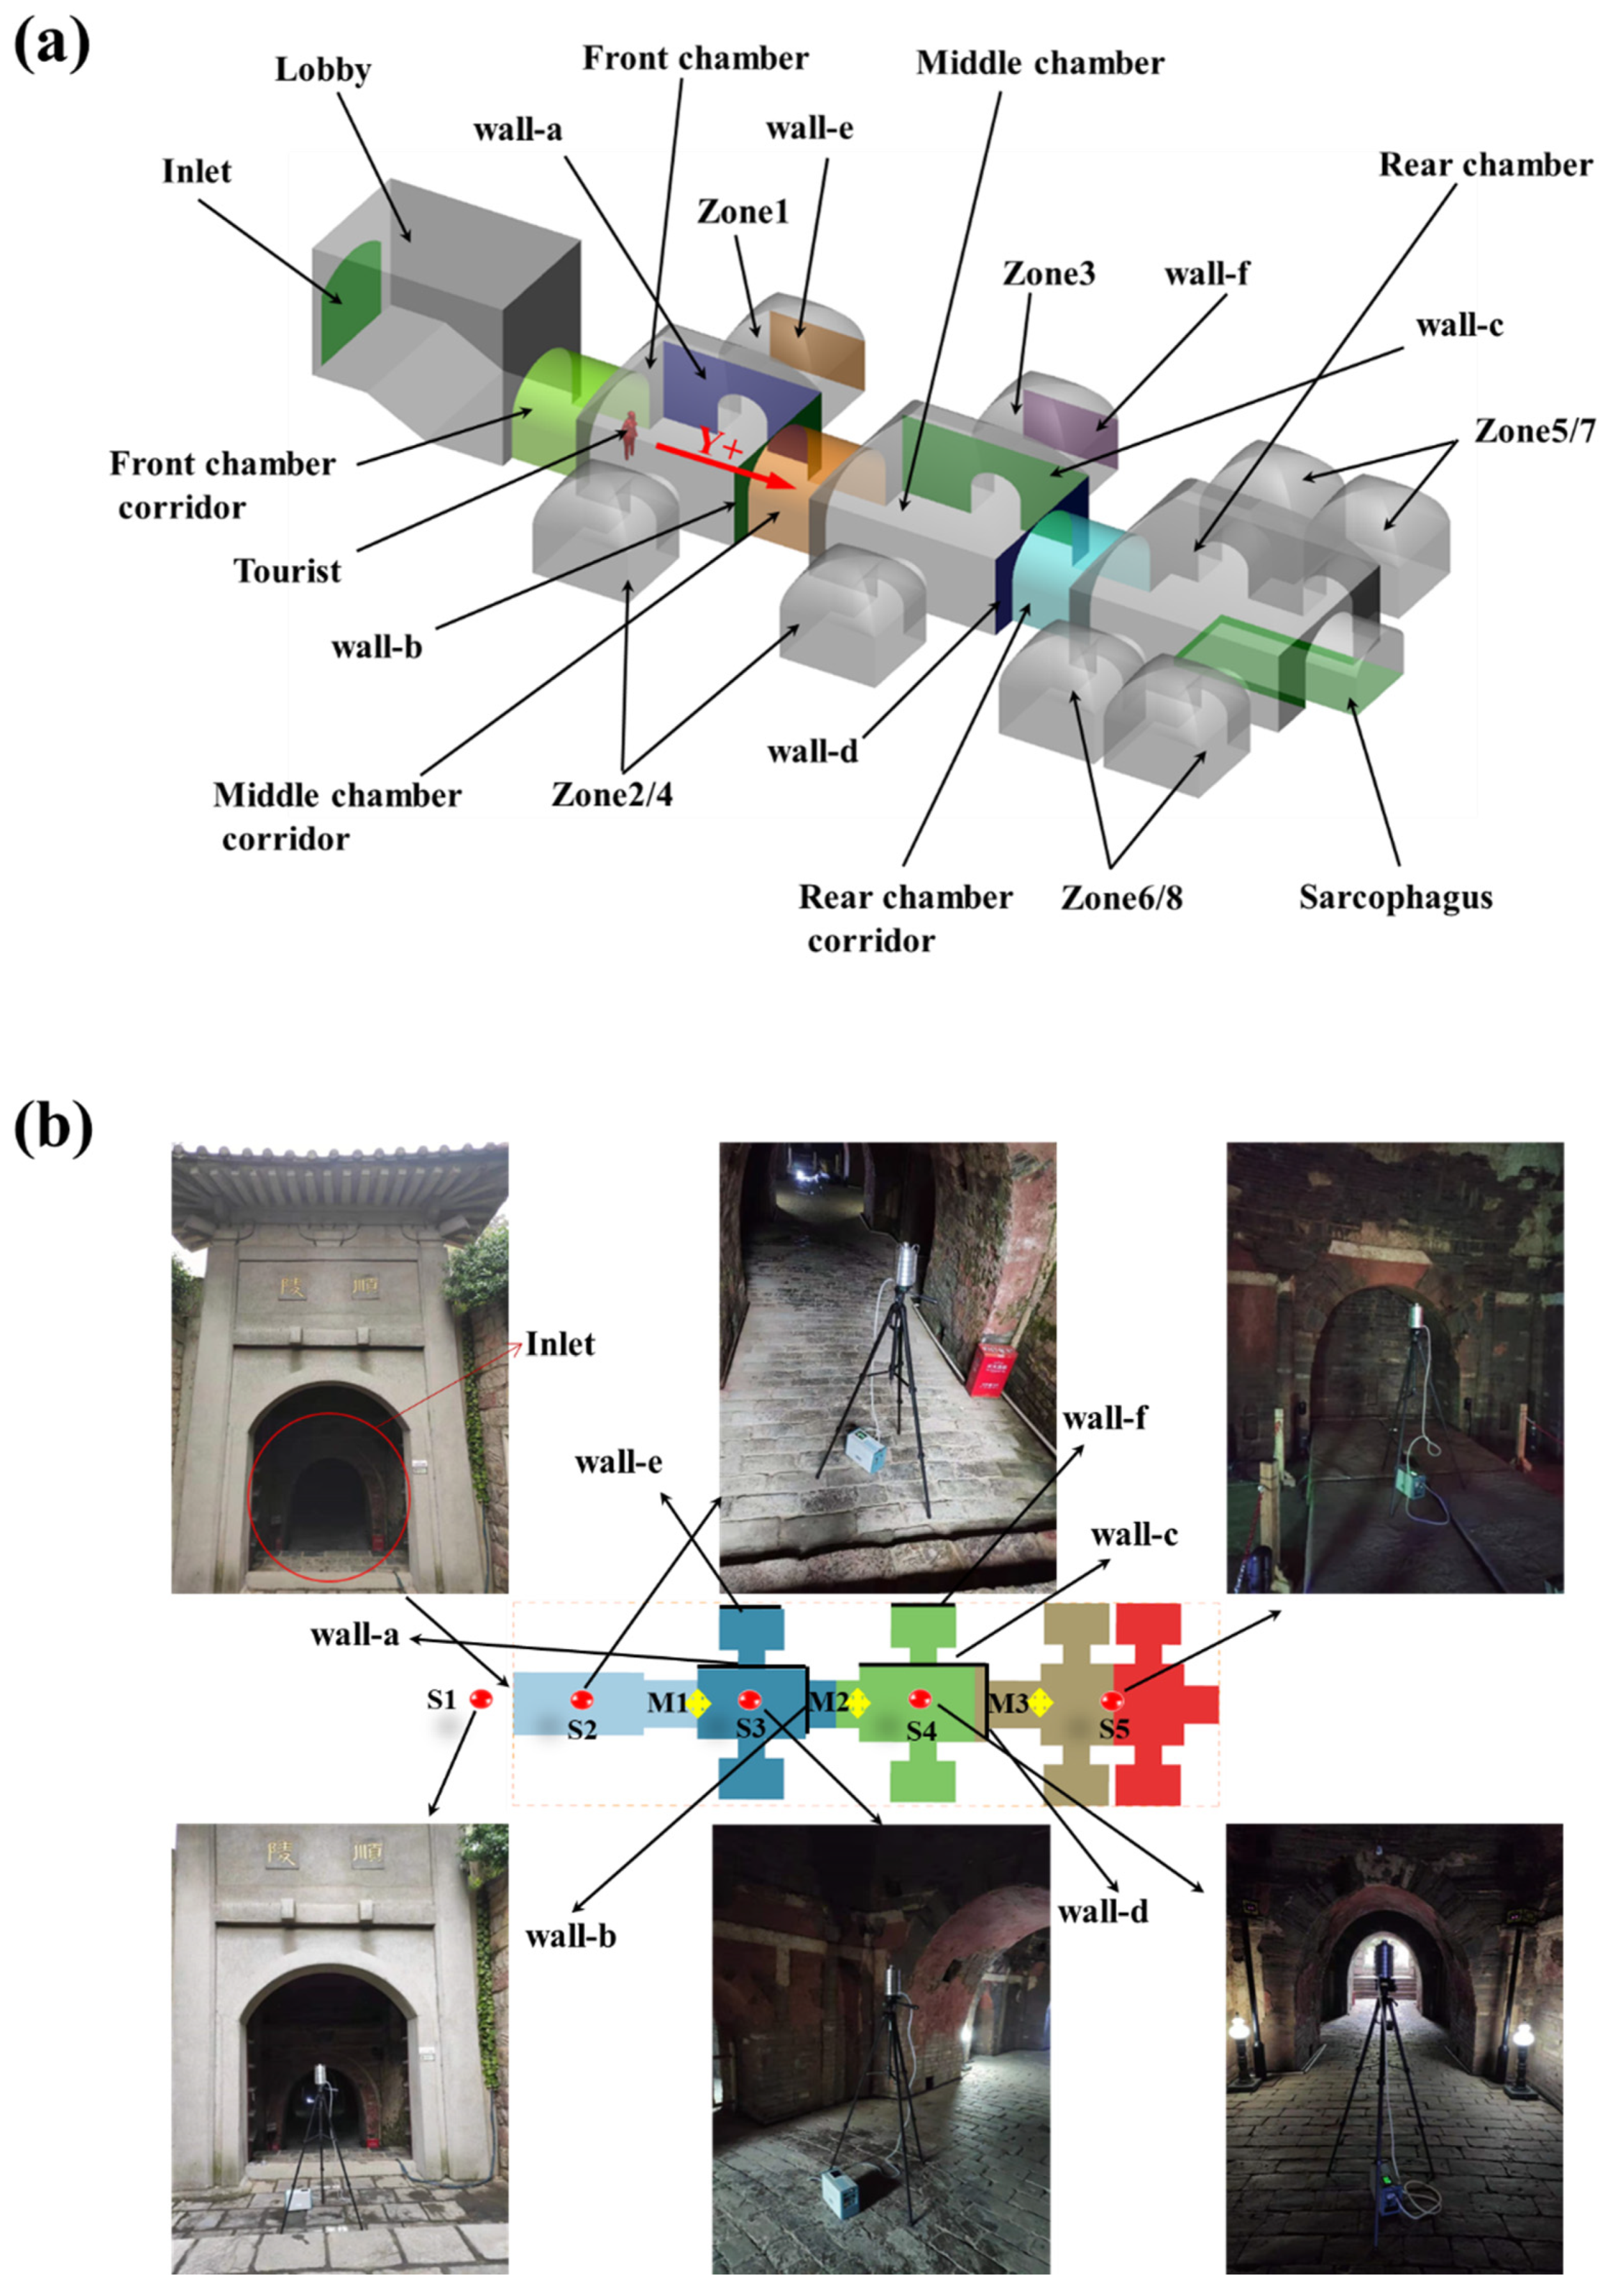
2. Research Object
3. Methodology
3.1. Airflow Simulation
3.2. Bioaerosol Particles Simulation
3.3. Dynamic Mesh Simulation
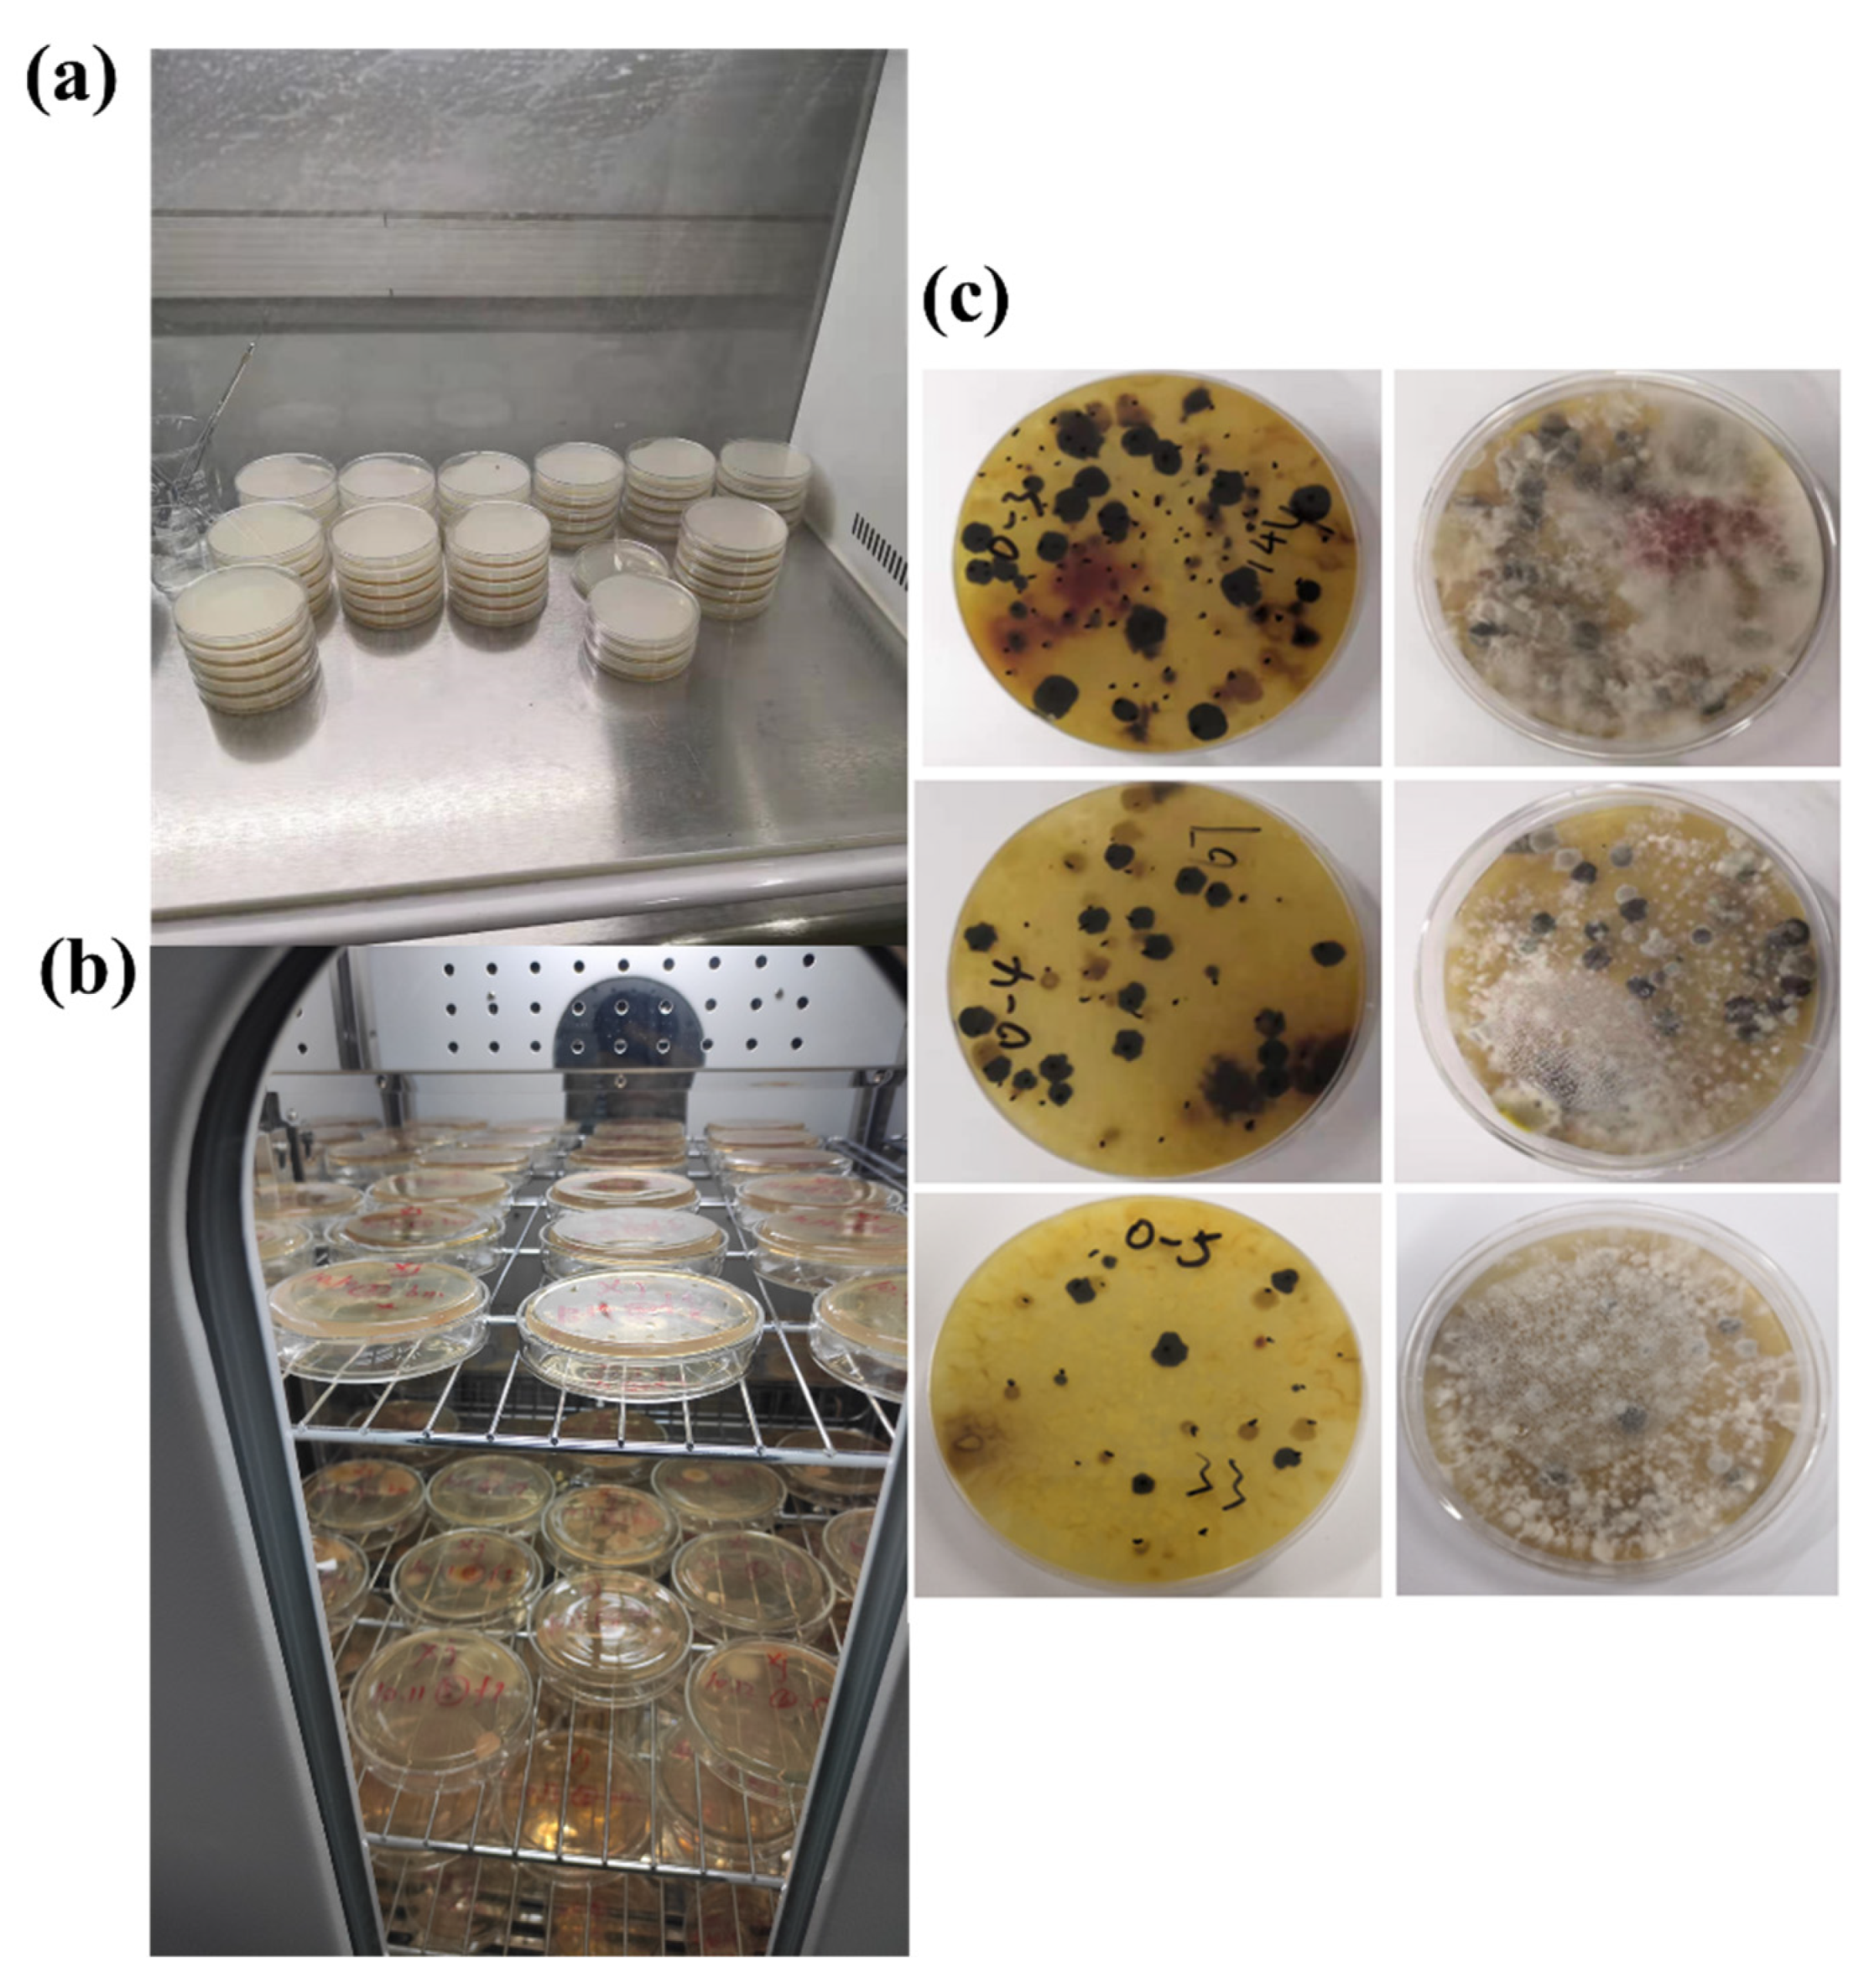
3.4. Experimental Method
4. Results and Discussion
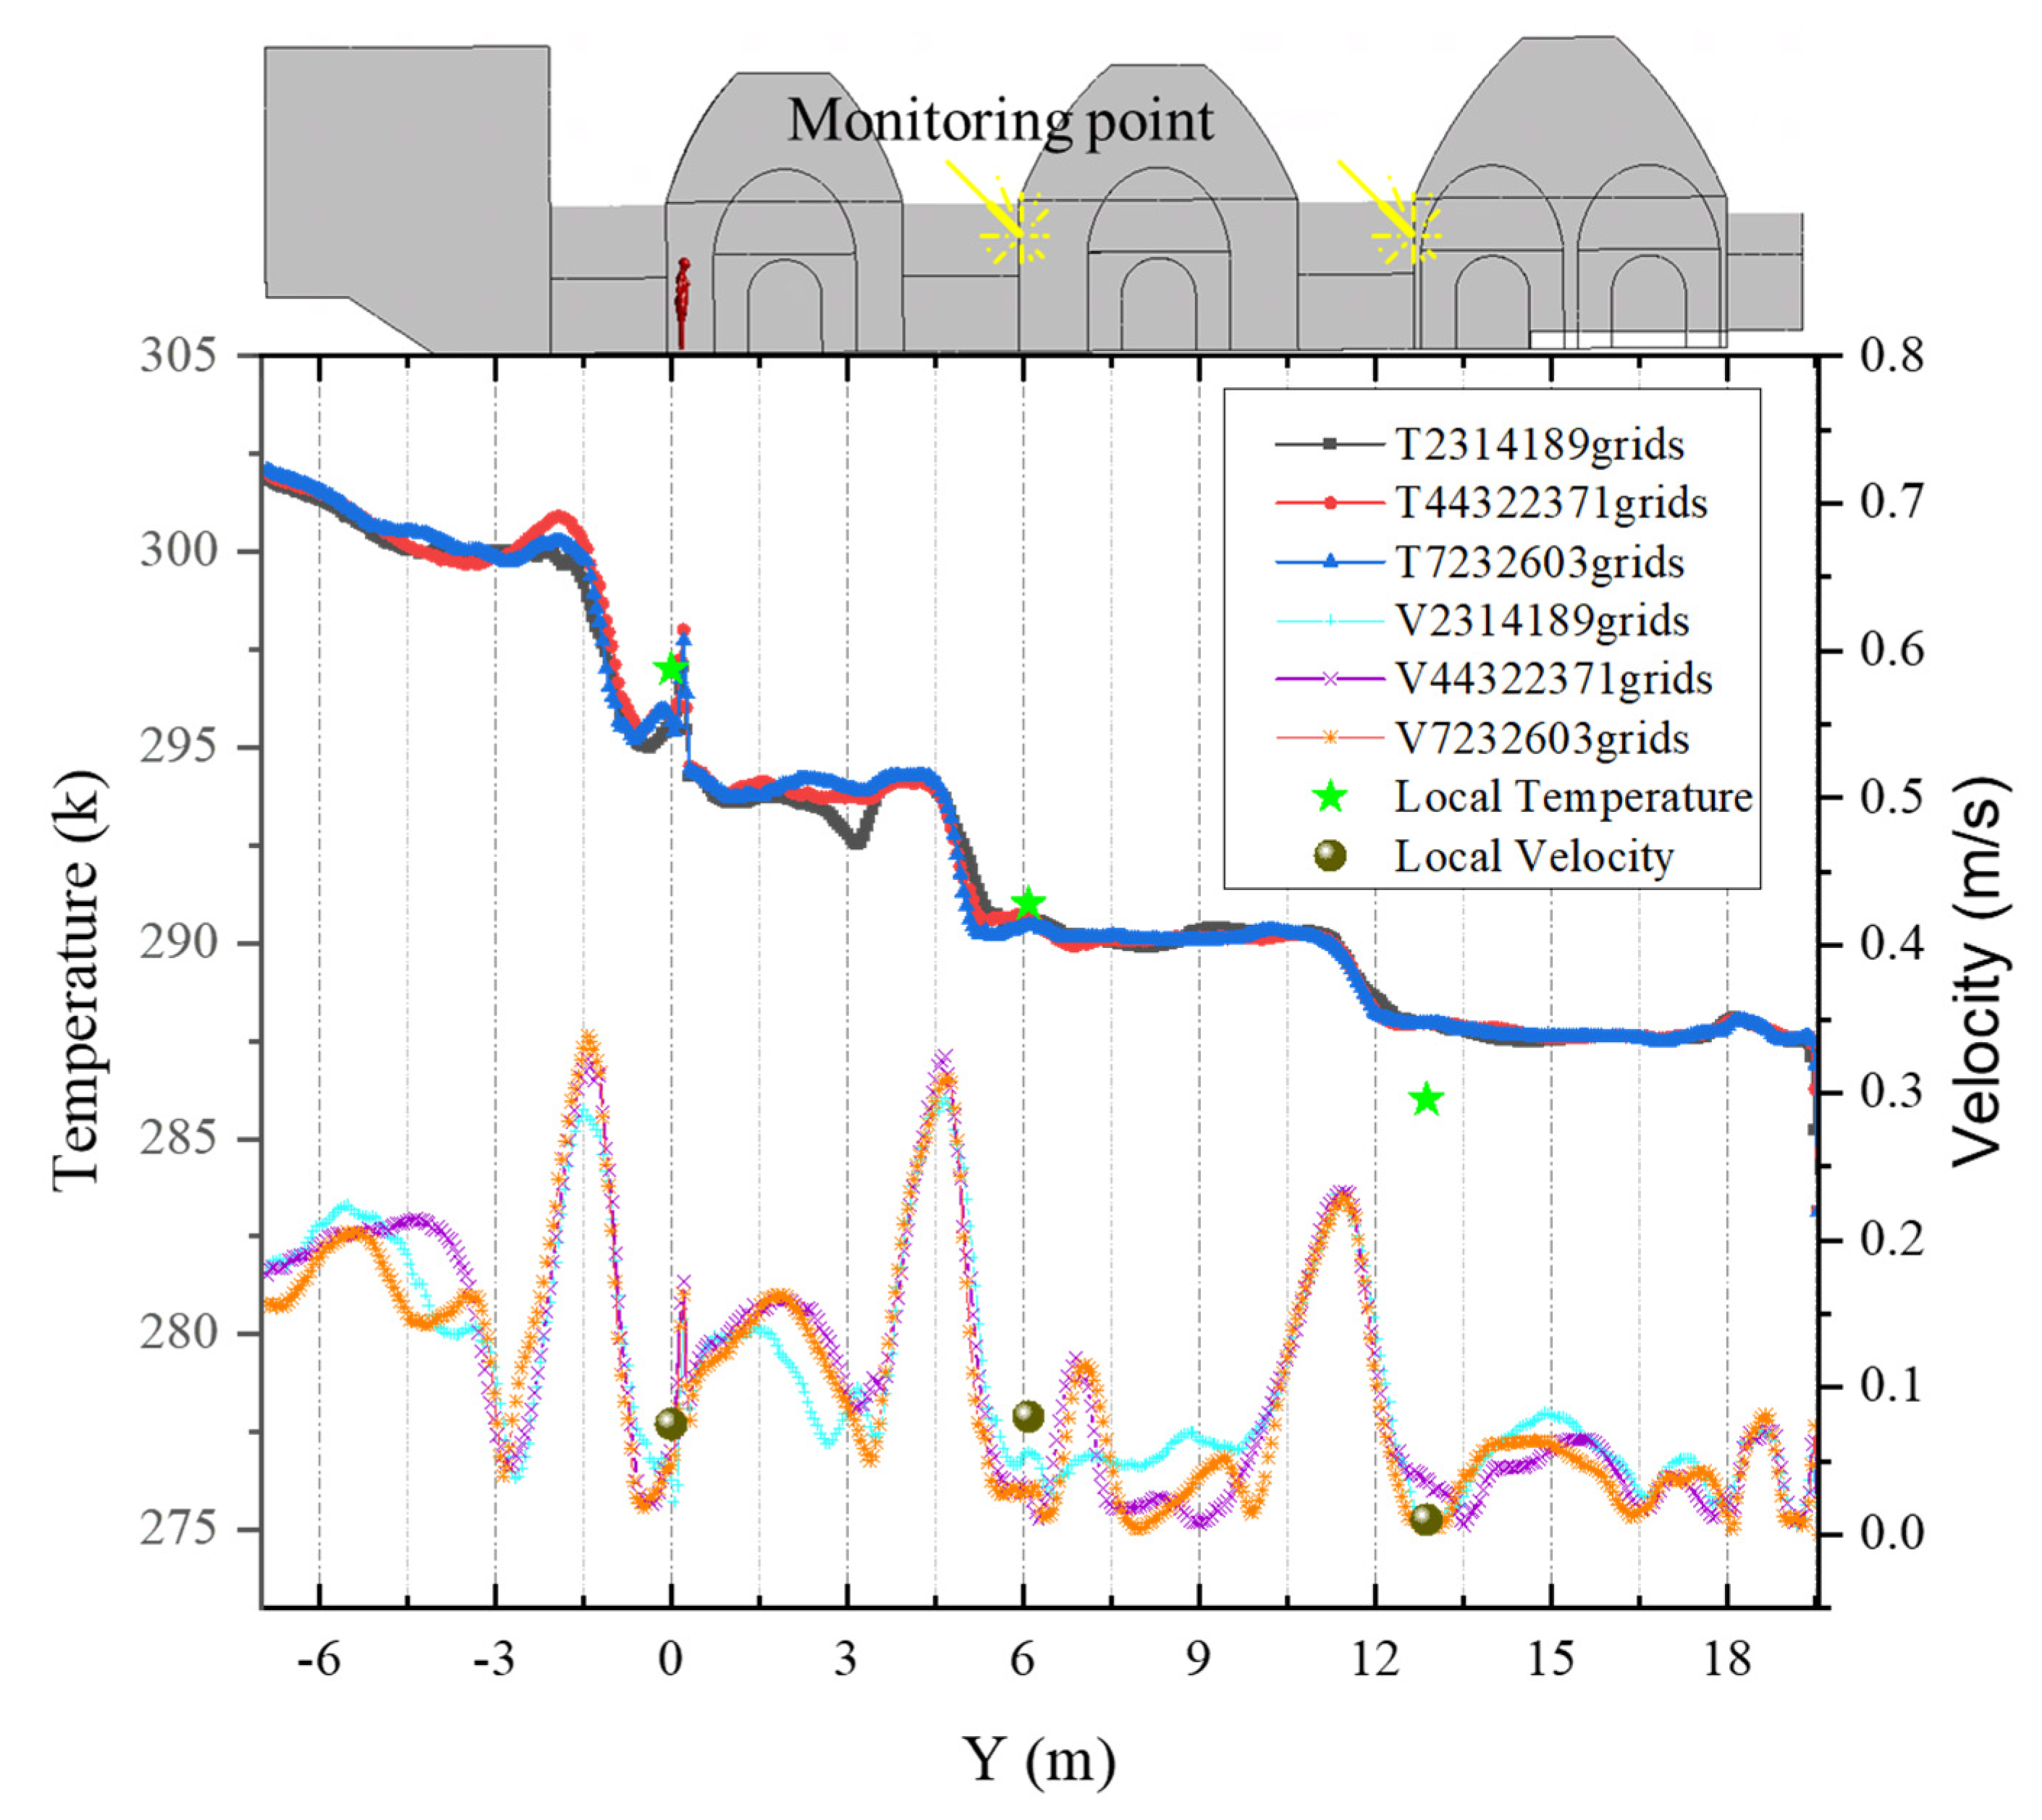
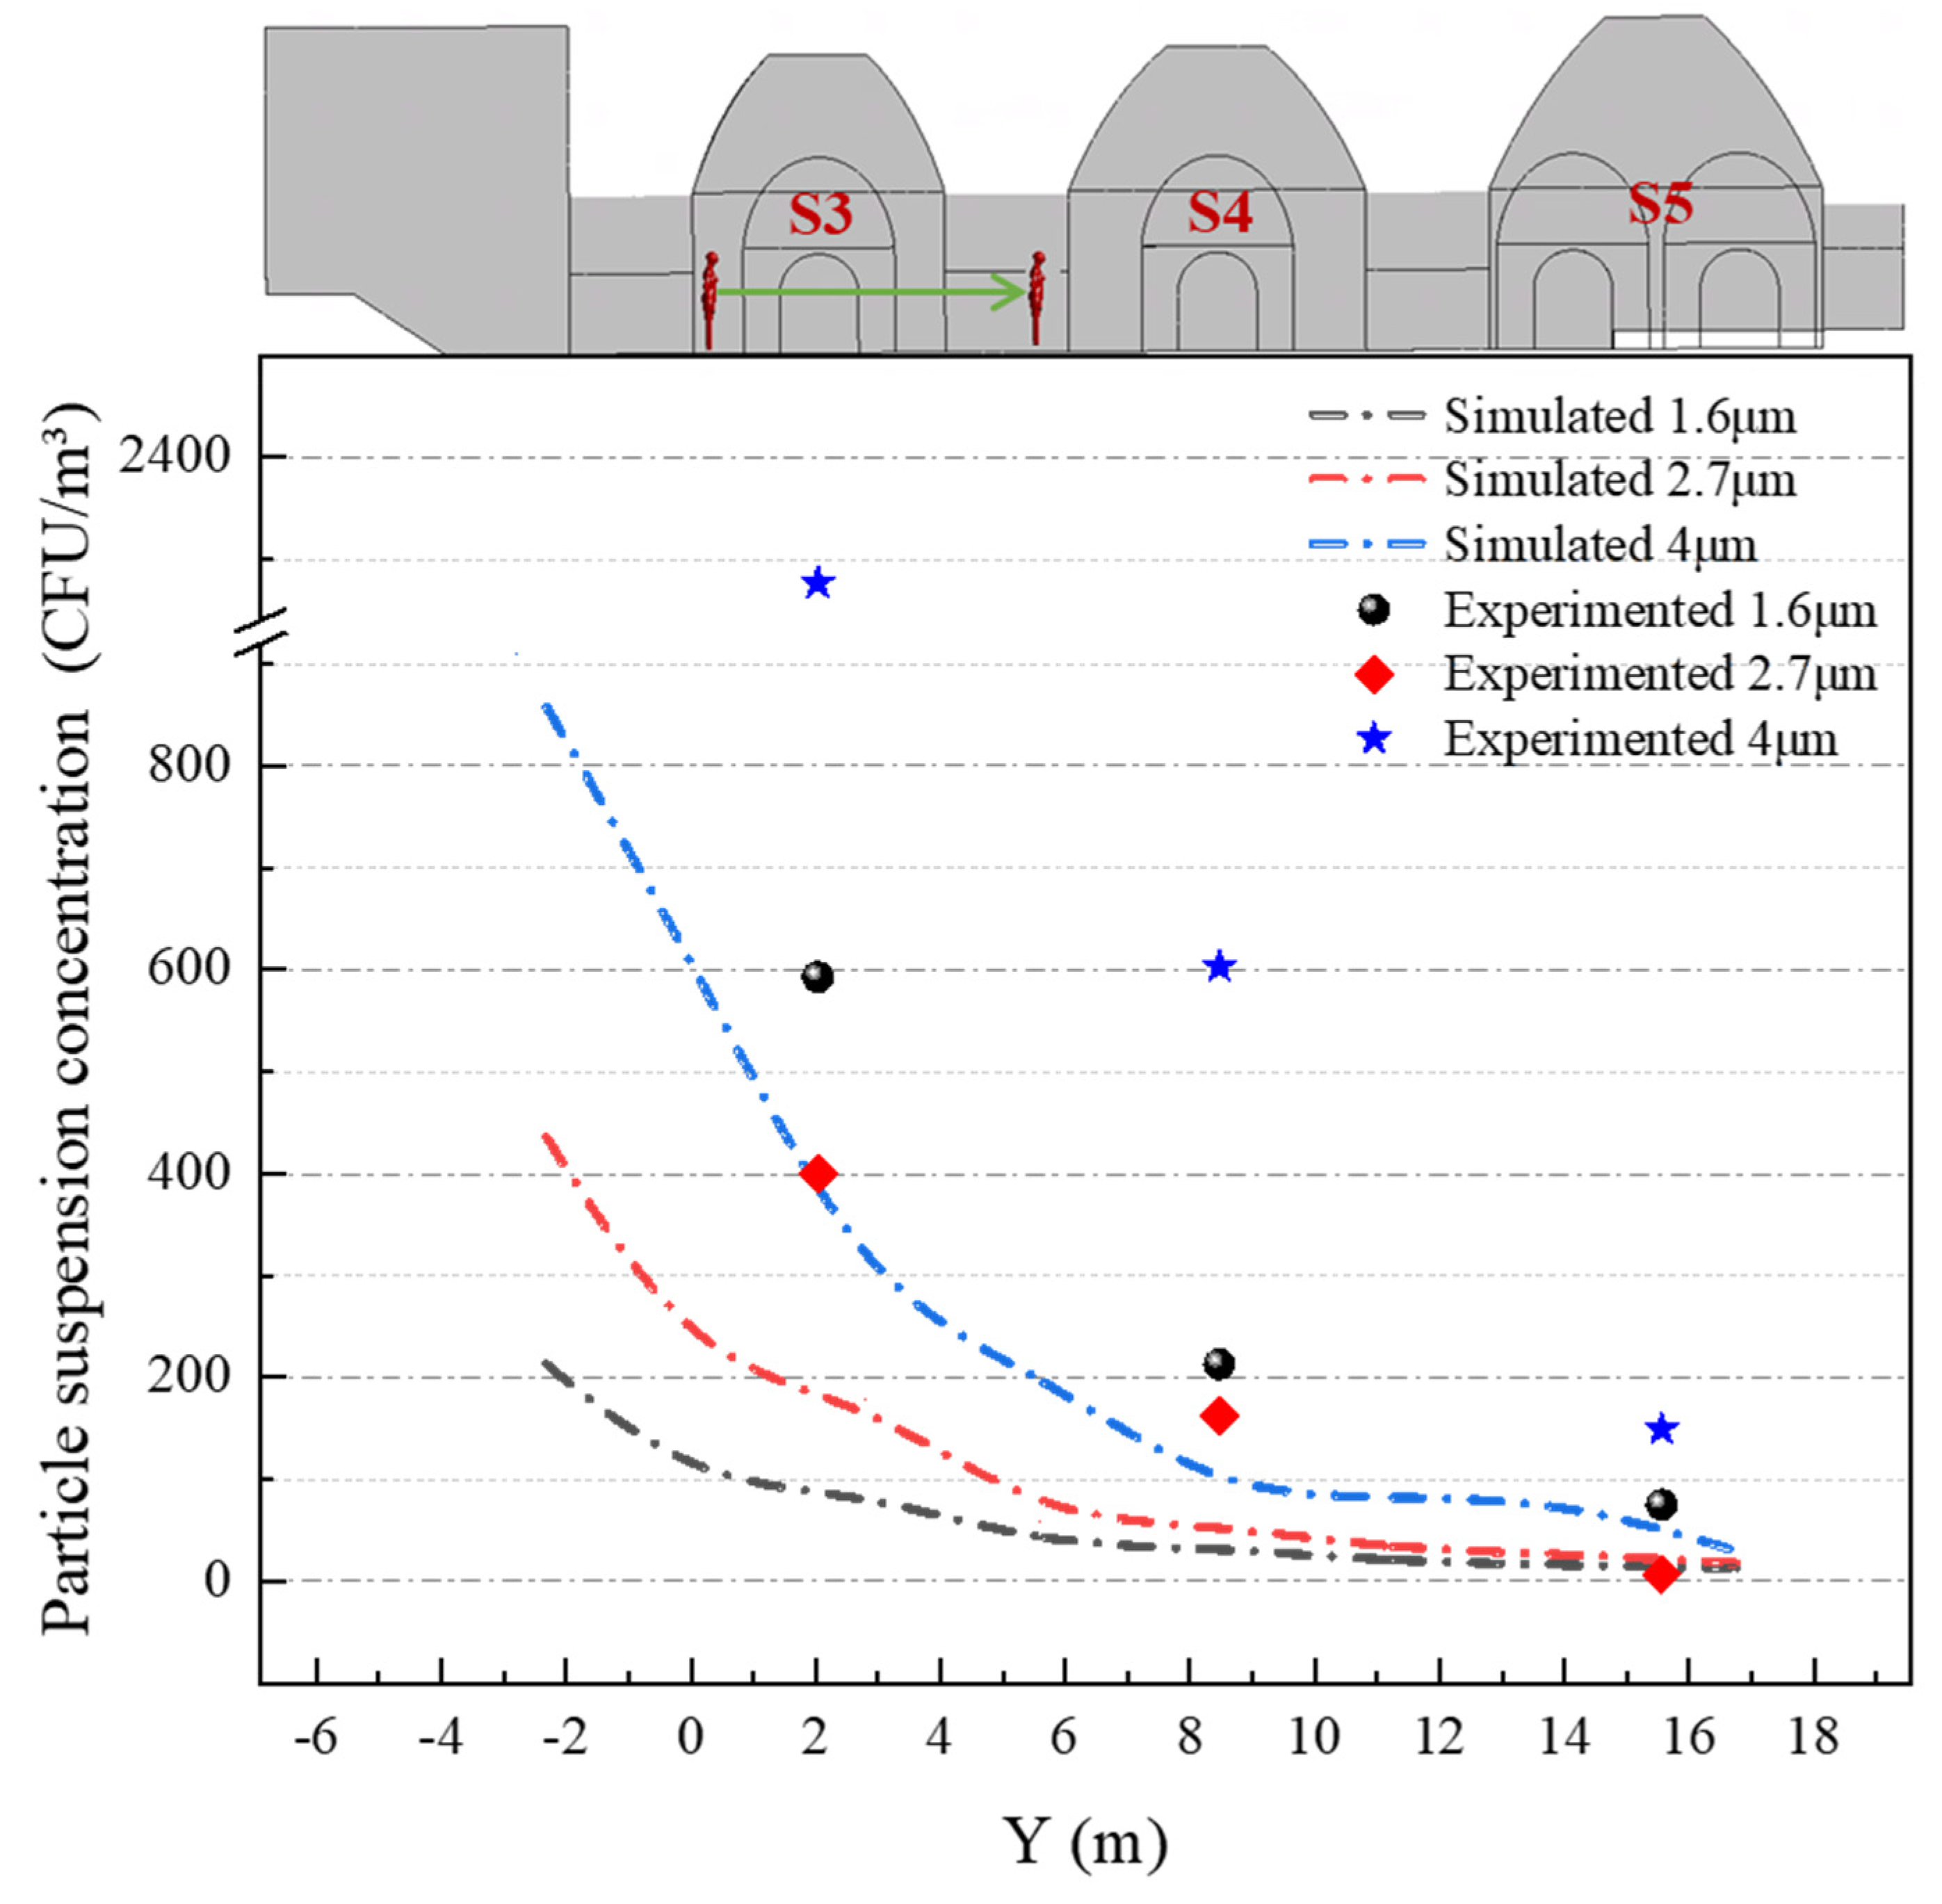
4.1. Verification of Airflow and Particle Numerical Simulation
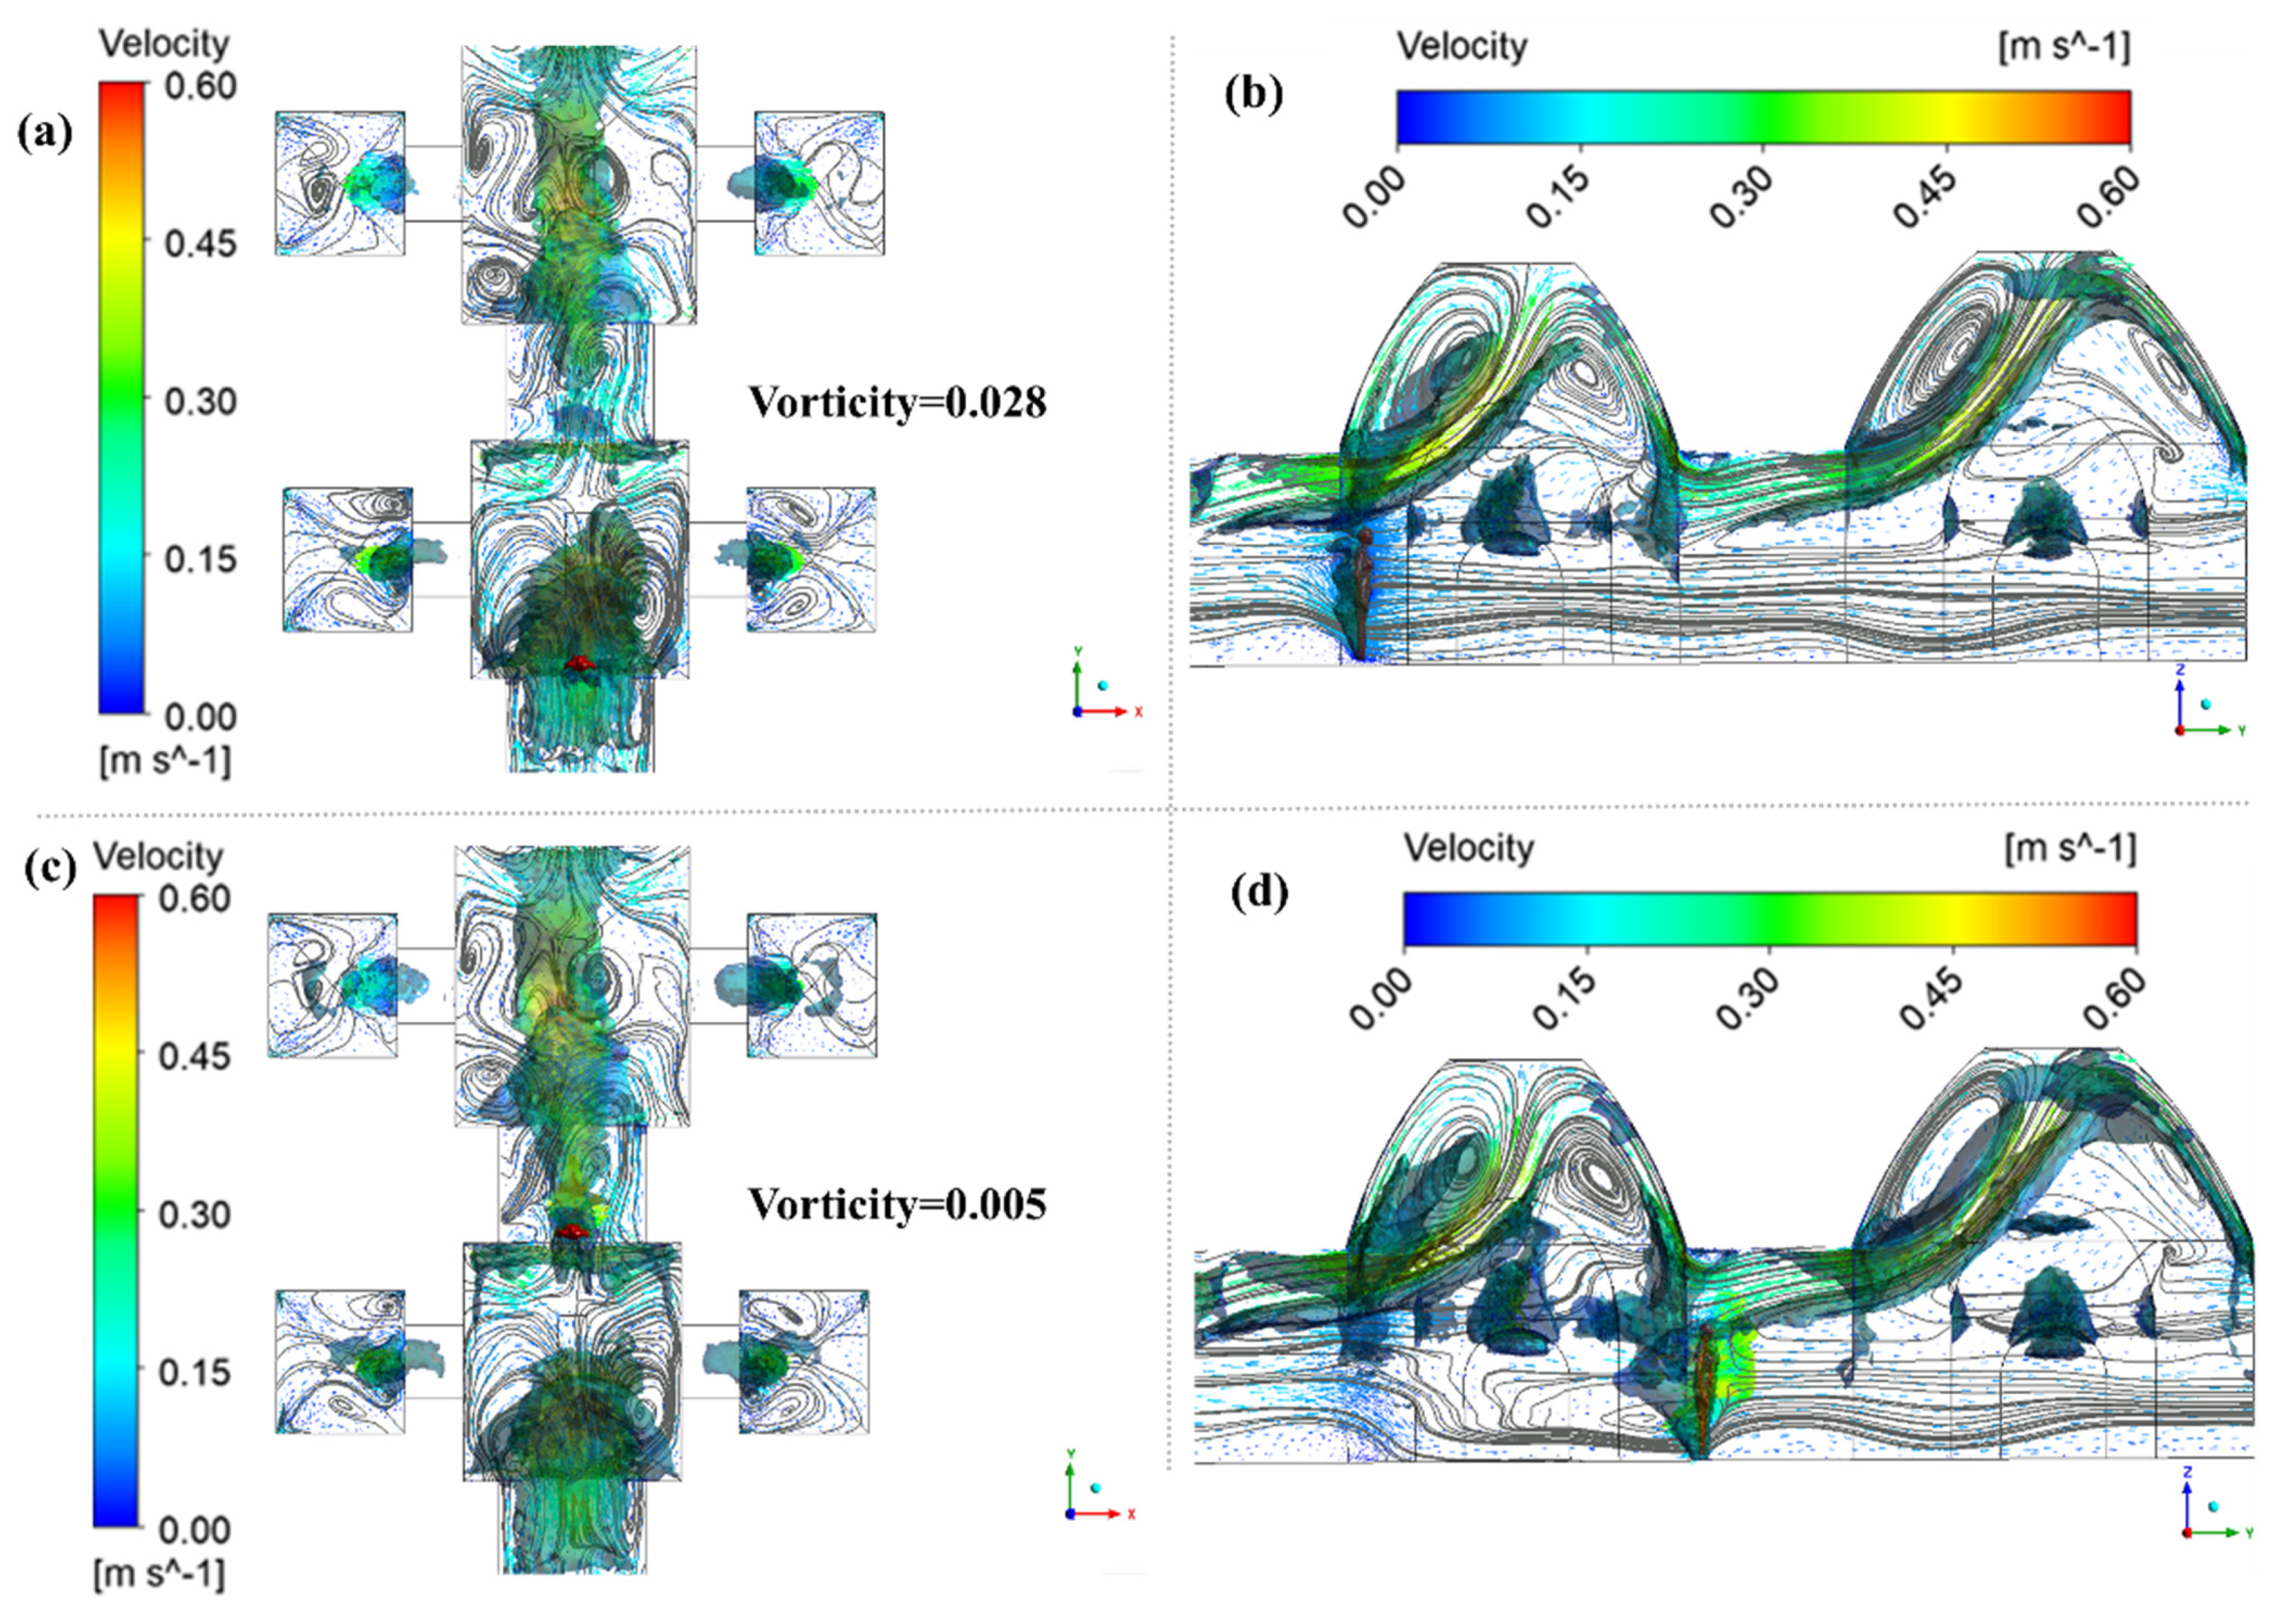
4.2. The Influence of Visitor Walking on the Air Distribution
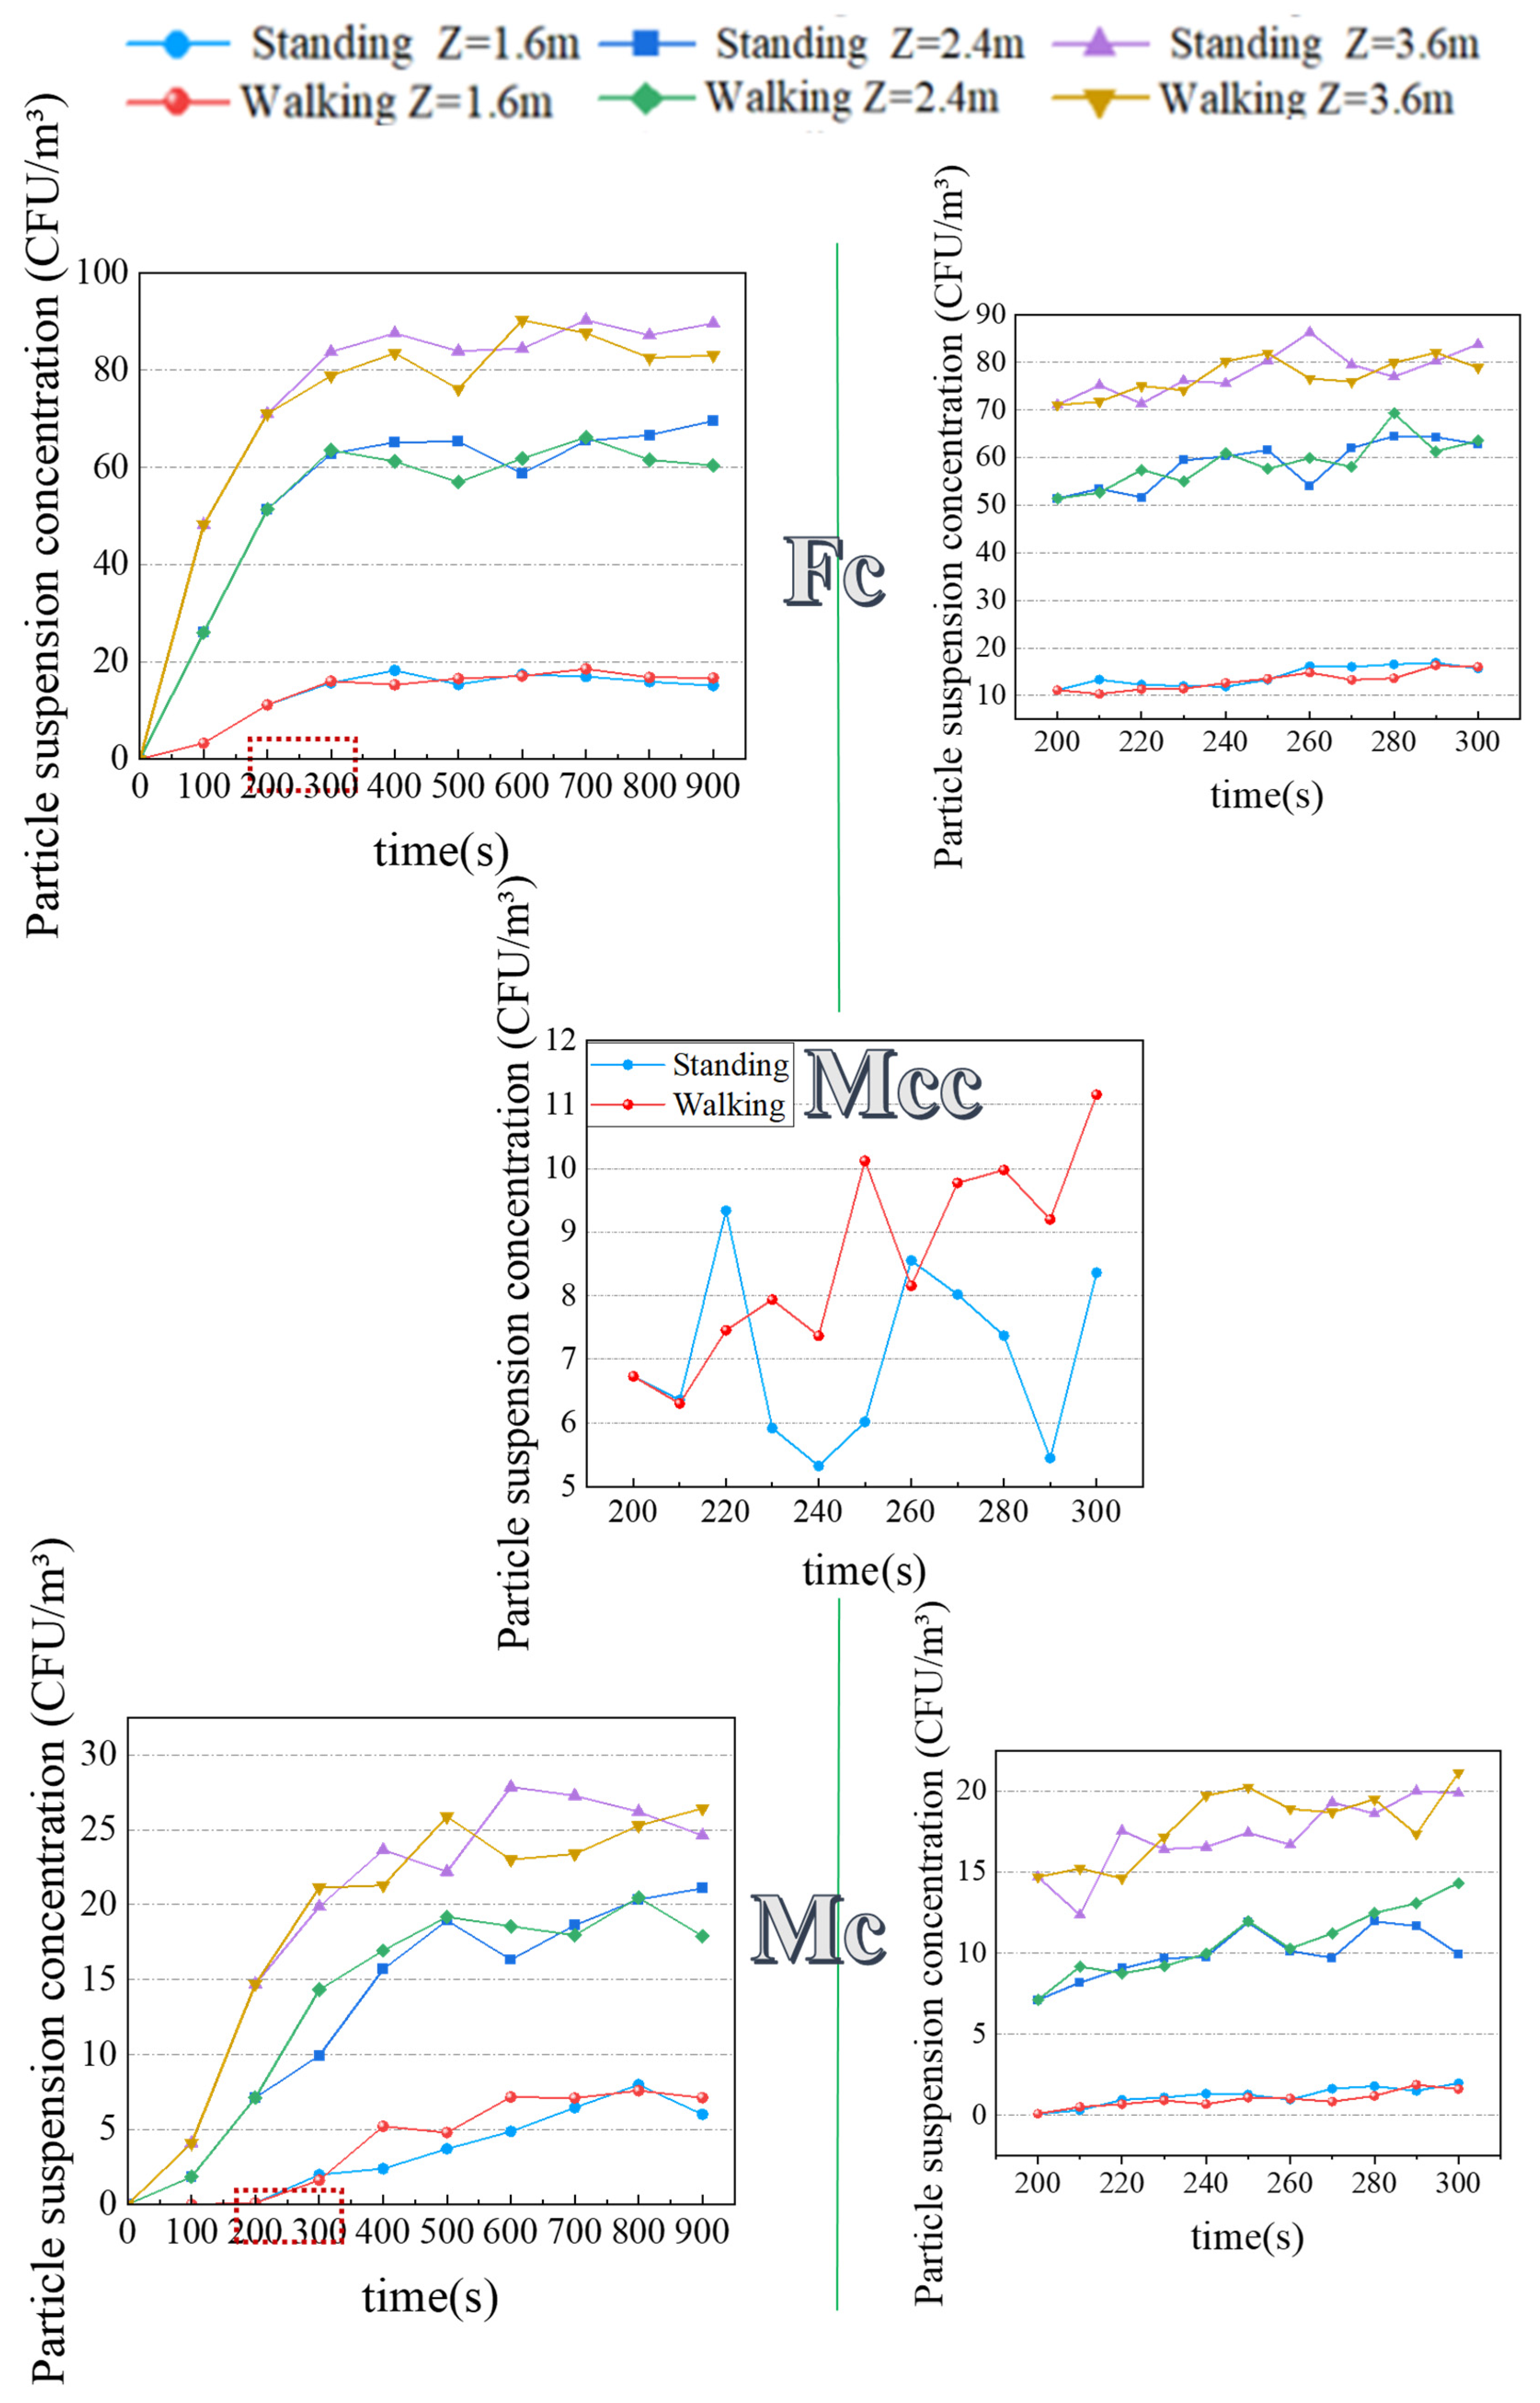
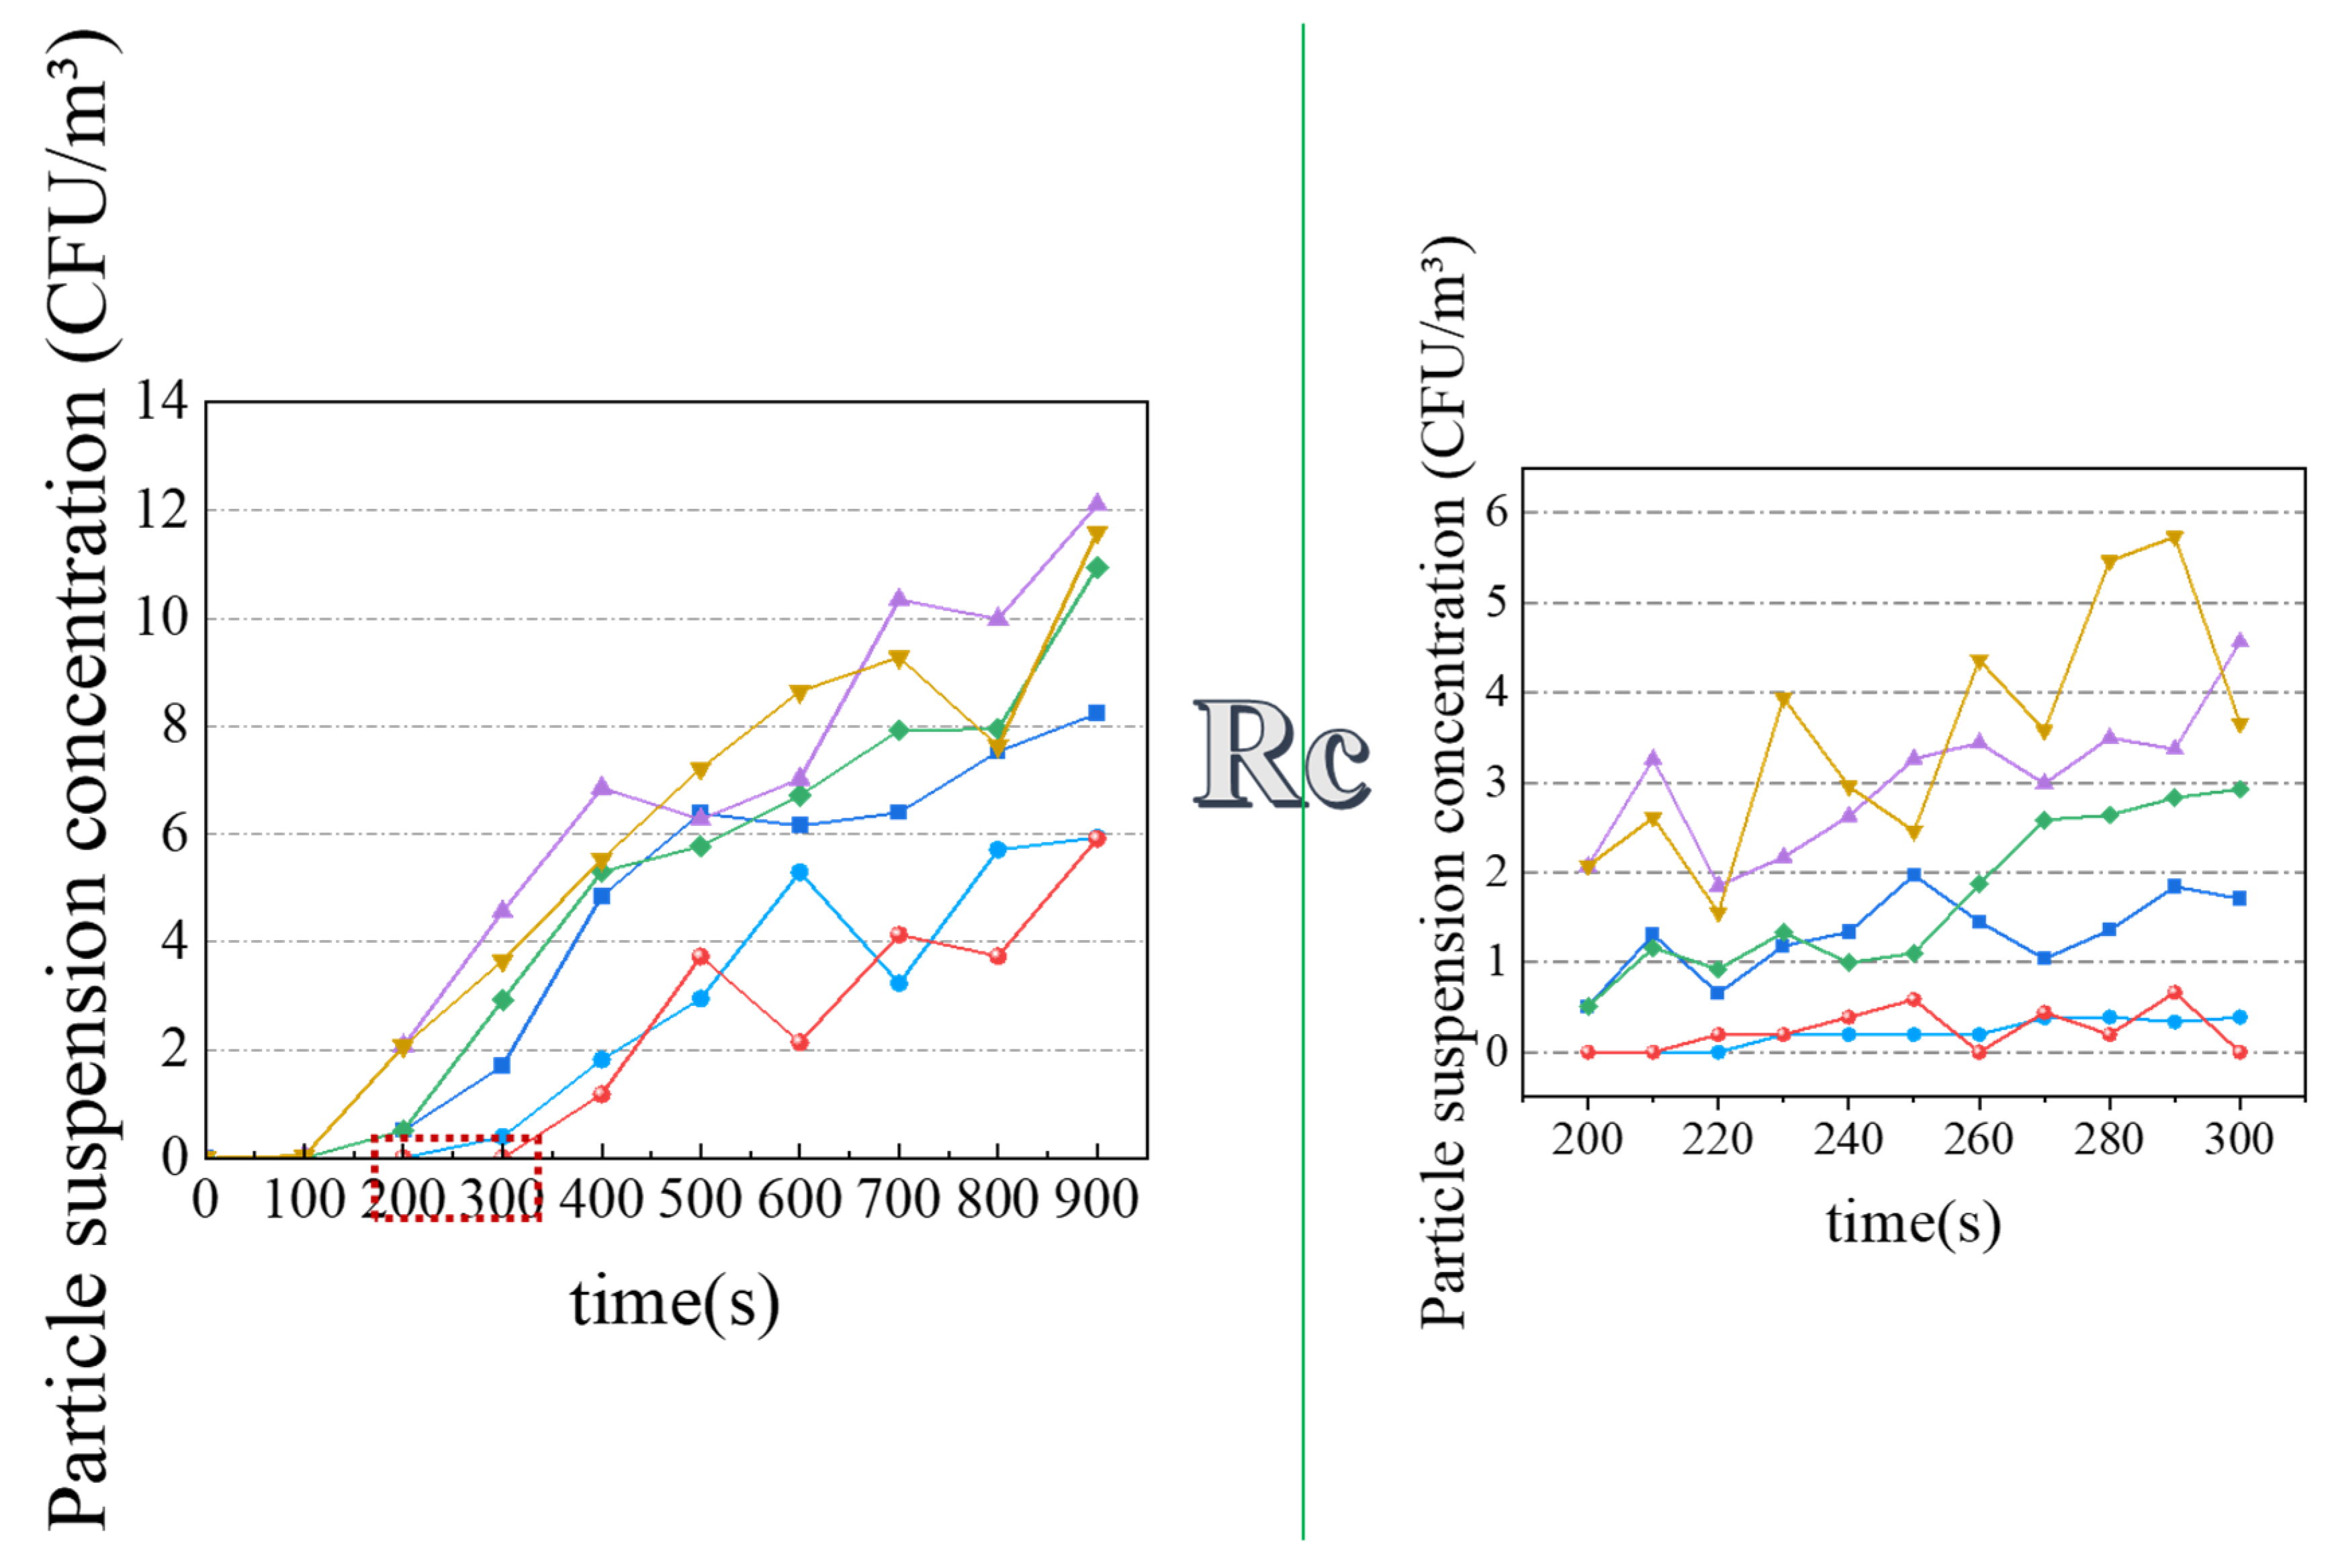
4.3. The Influence of Visitor Walking on the BPs Concentration in the Main Chambers
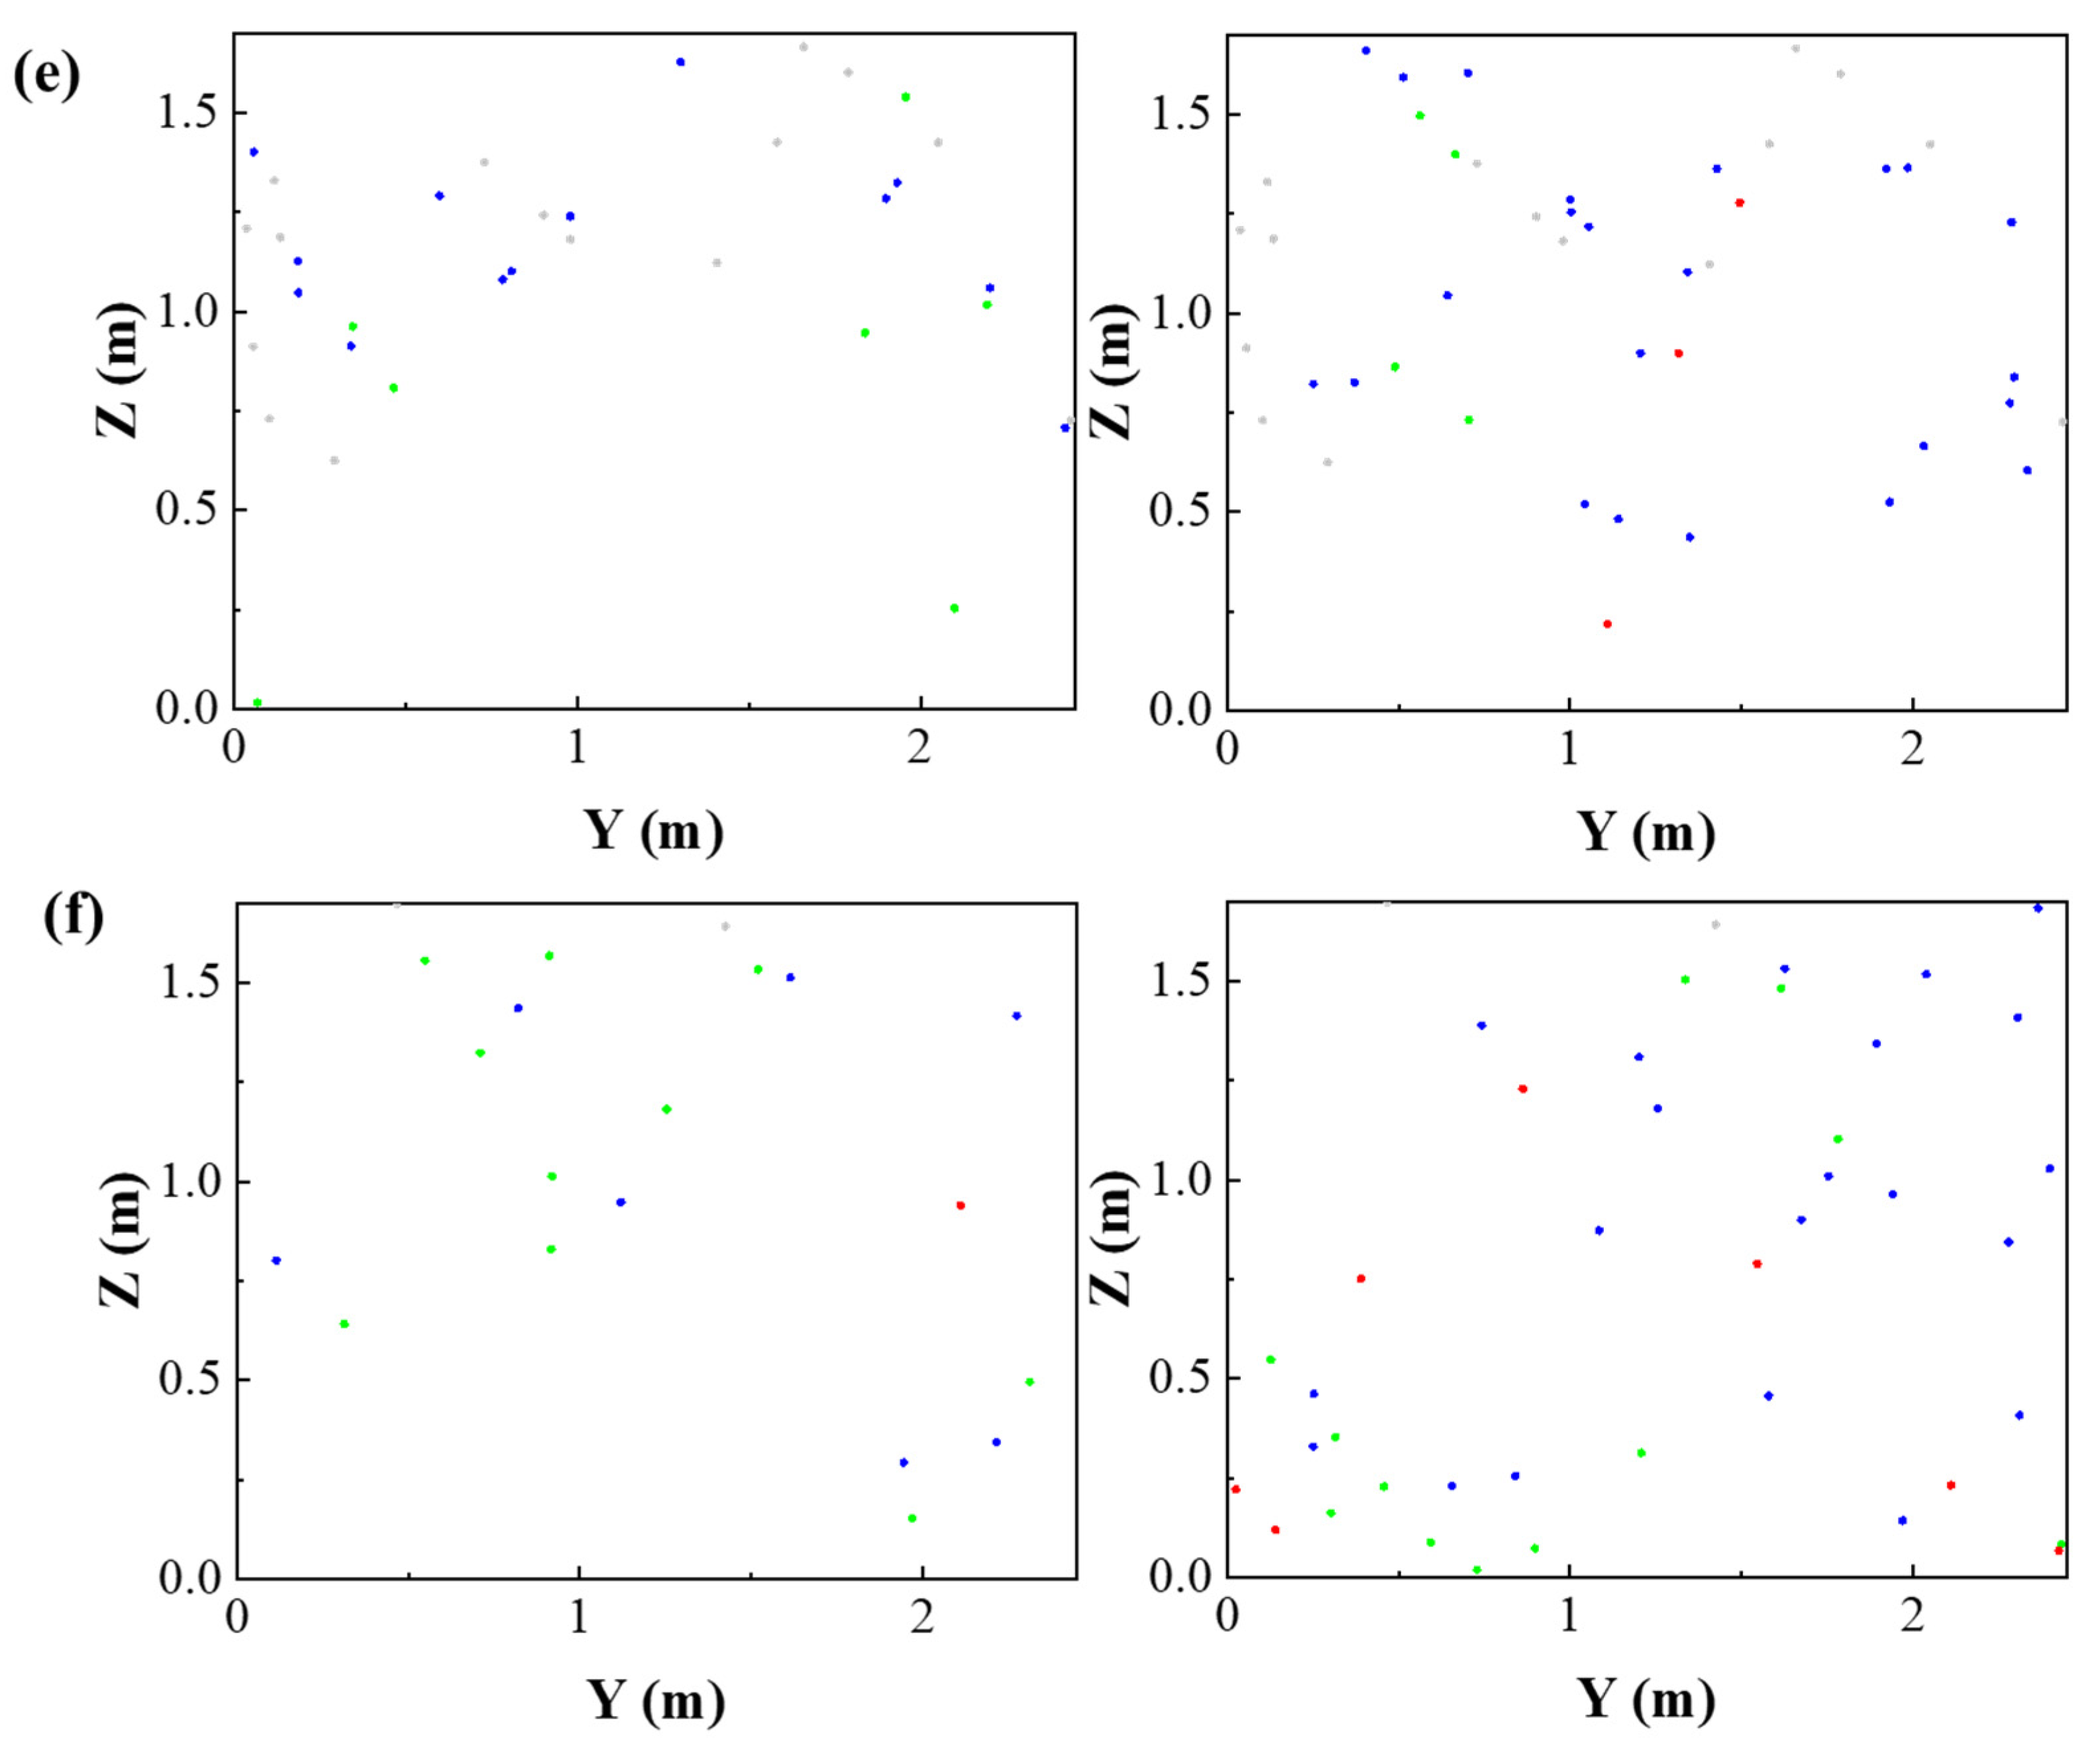
4.4. The Influence of Visitor Walking on the Distribution Characteristics of the BPs on the Murals
5. Conclusions
- The visitor walking will disturb the original interior of the chamber and the airflow distribution characteristics. The process of walking produces denser eddy currents, combined with the comprehensive effect of the thermal plume. In addition, the eddy currents mainly move to the above of the visitor’ head and the small chambers on both sides, which affect the movement and migration of the BPs.
- Visitor walking causes the concentration of BPs to change greatly within 250 s after visitor stopped. The vortex generated by the disturbance of the visitor walking causes the BPs to enter the corridor of the middle chamber from the front chamber earlier, and gather at the roof of the corridor for a long time. Moreover, due to the generation of eddy currents on both sides of the visitor, more BPs move into the small chamber, which greatly increases the possibility of the contamination of the murals.
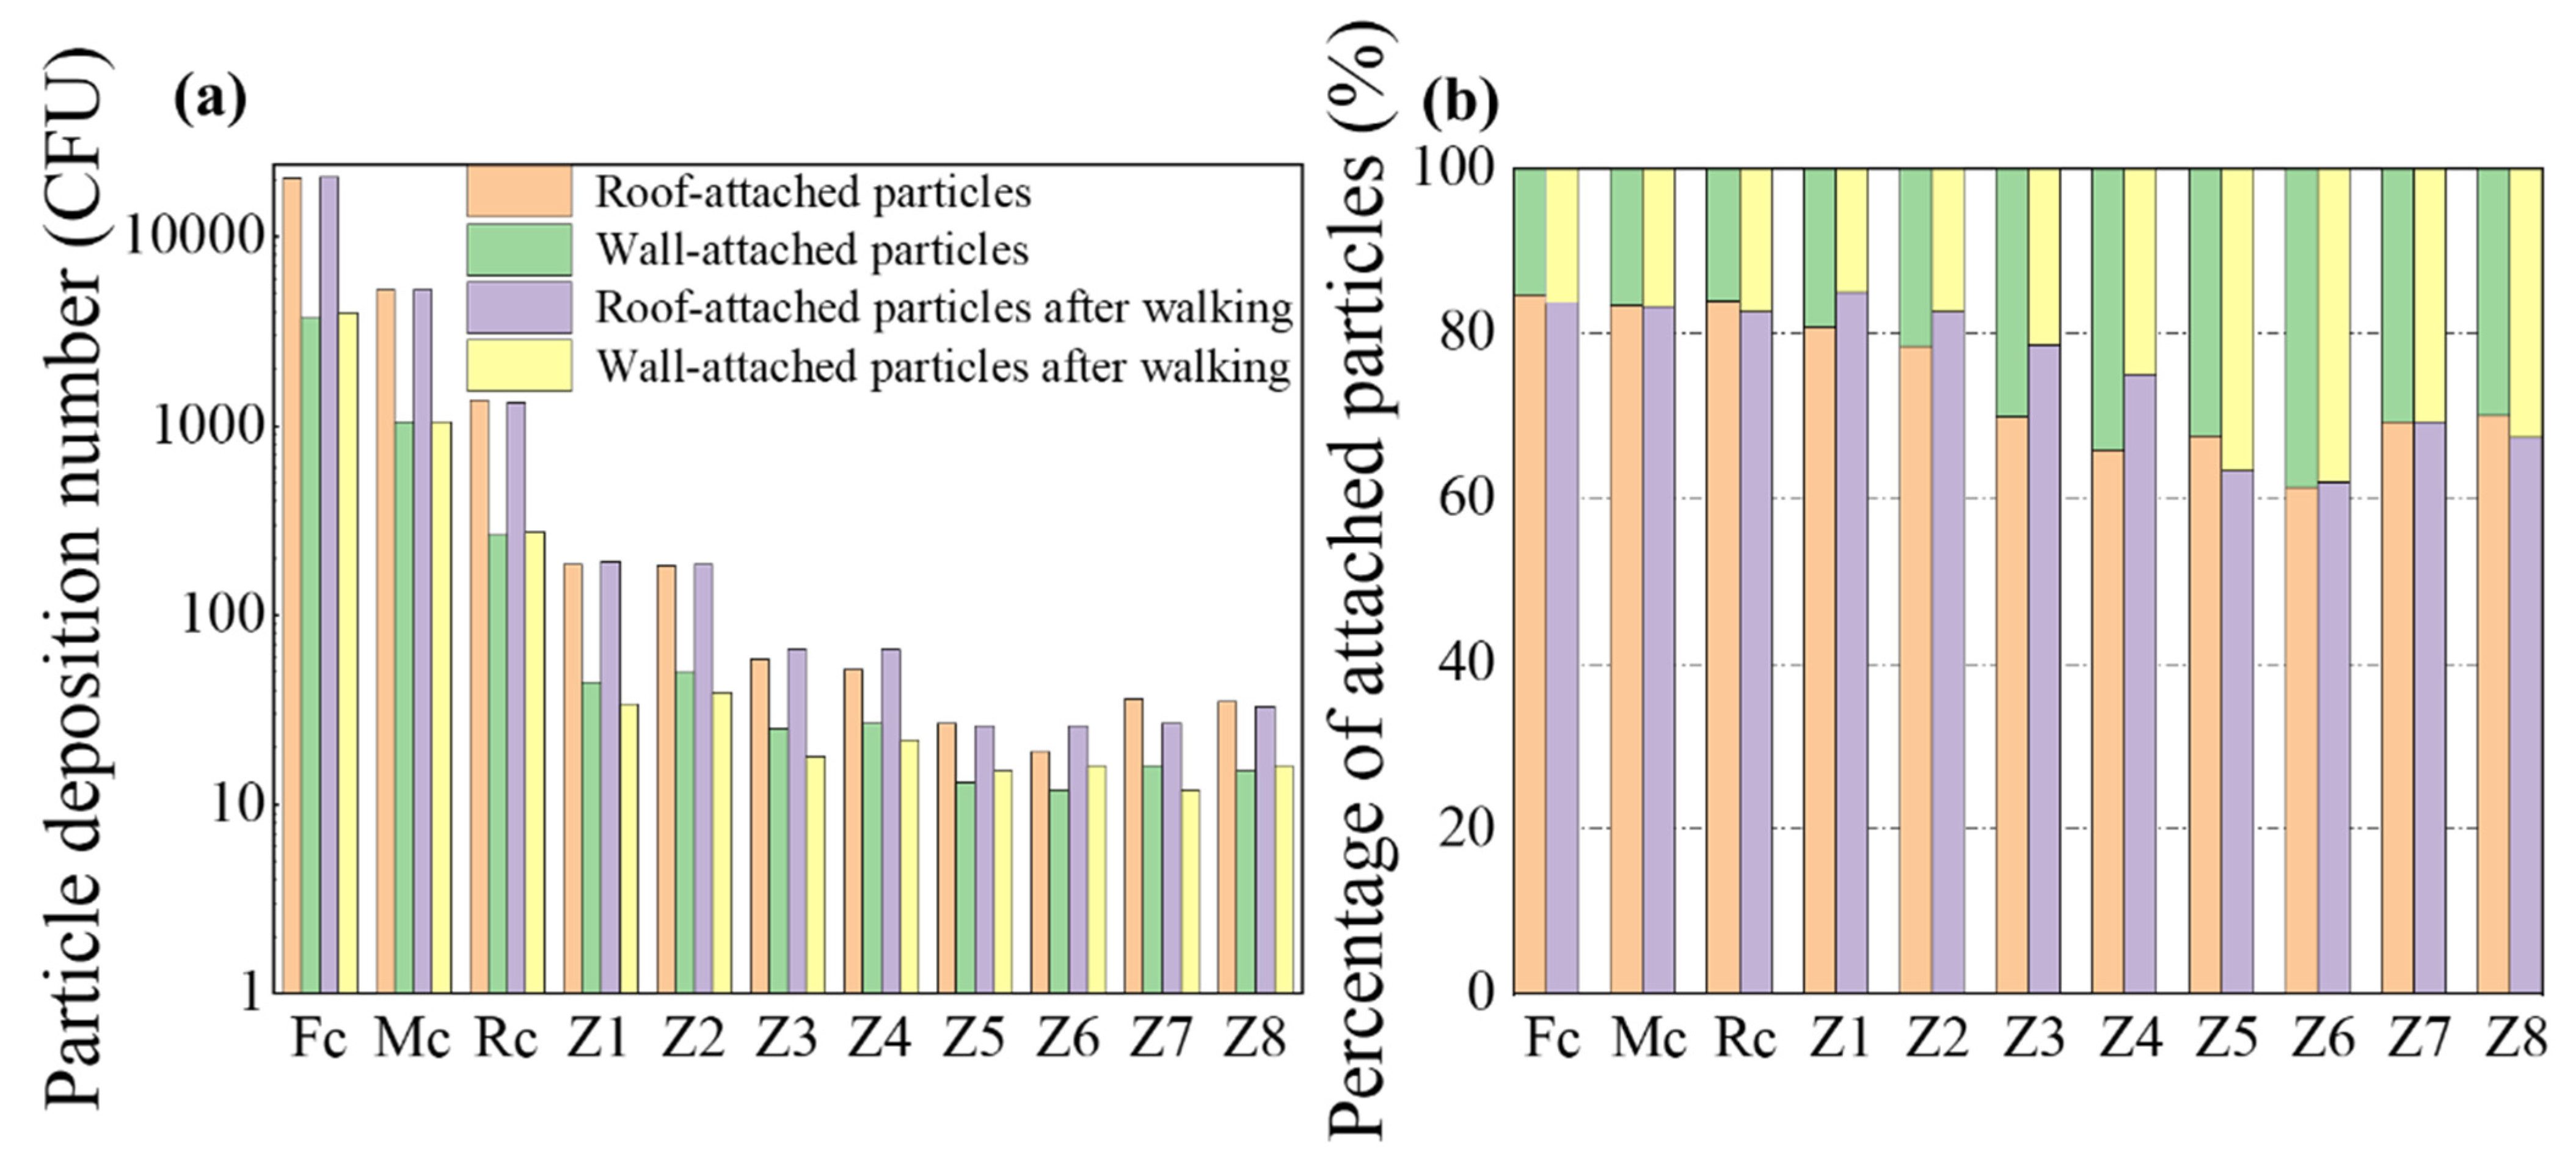
- The deposition of BPs in the chamber is in line with the characteristics of airflow diffusion in the space. The rooves’ BPs deposition number is significantly higher than the bottom wall deposition in the same area. After the visitor walking, the deposition number and ratio of the bottom wall were both increased, and the time required for deposition of BPs was prolonged.
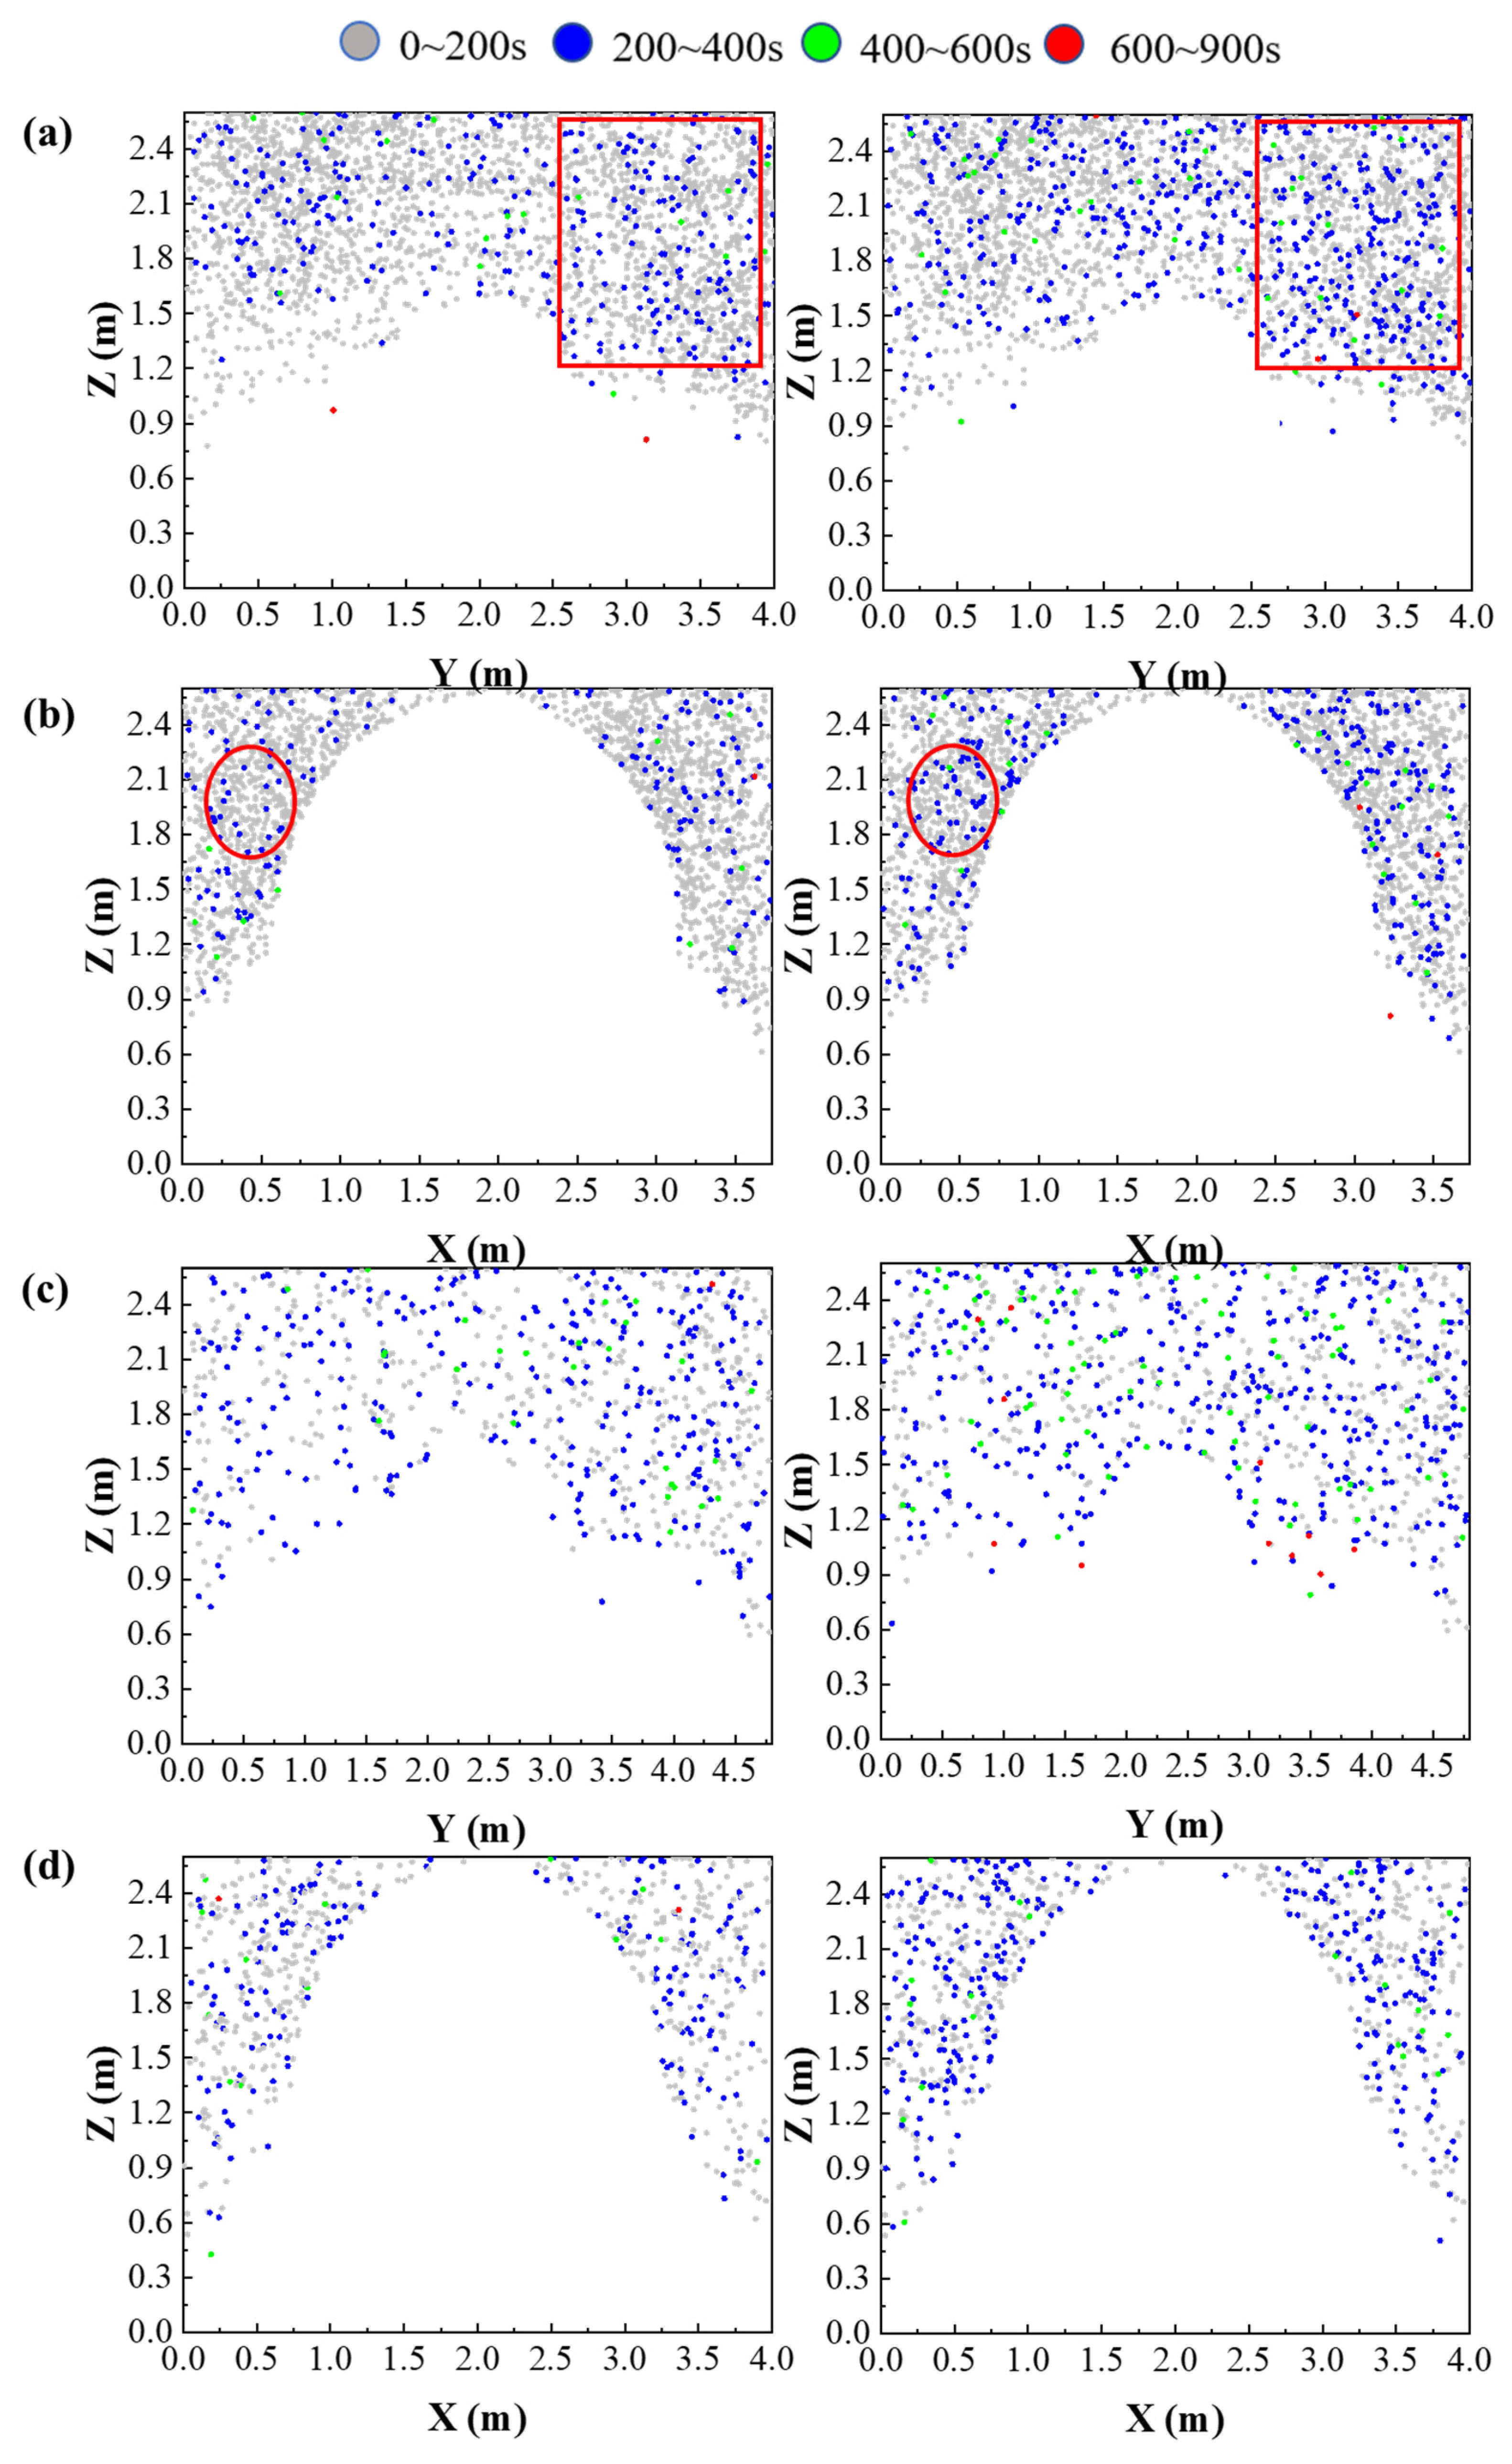
- During time = 200–400 s, the deposition position on the murals of the main chamber parallel to the direction of human movement shifted to the walking direction. The deposition quantity could increase by 50%. While the deposition position on the wall perpendicular to the direction of human movement shifted downward, and the deposition growth rate could exceed 100%. The deposition quantity on the wall of small chamber increased by multiples. After the shifting, the contamination of degree at the corresponding position increased, but the original position decreased.
Author Contributions
Funding
Institutional Review Board Statement
Informed Consent Statement
Data Availability Statement
Conflicts of Interest
References
- Ma, Y.; Zhang, H.; Du, Y.; Tian, T.; Xiang, T.; Liu, X.; Wu, F.; An, L.; Wang, W.; Gu, J.-D.; et al. The community distribution of bacteria and fungi on ancient wall paintings of the Mogao Grottoes. Sci. Rep. 2015, 5, 7752. [Google Scholar] [CrossRef] [PubMed]
- Li, Y.; Li, X.; Jiang, Q.; Zhou, Q. Historical Study and Conservation Strategies of “Tianzihao” Colony (Nanjing, China)—Architectural Heritage of the French Catholic Missions in the Late 19th Century. Buildings 2021, 11, 176. [Google Scholar] [CrossRef]
- Du, C.; Li, B.; Yu, W. Indoor mould exposure: Characteristics, influences and corresponding associations with built environment—A review. J. Build. Eng. 2021, 35, 101983. [Google Scholar] [CrossRef]
- Sterflinger, K.; Pinar, G. Microbial deterioration of cultural heritage and works of art—Tilting at windmills? Appl. Microbiol. Biotechnol. 2013, 97, 9637–9646. [Google Scholar] [CrossRef] [Green Version]
- Zorpas, A.A.; Skouroupatis, A. Indoor air quality evaluation of two museums in a subtropical climate conditions. Sustain. Cities Soc. 2016, 20, 52–60. [Google Scholar] [CrossRef]
- Pangallo, D.; Kraková, L.; Chovanová, K.; Šimonovičová, A.; De Leo, F.; Urzì, C. Analysis and comparison of the microflora isolated from fresco surface and from surrounding air environment through molecular and biodegradative assays. World J. Microbiol. Biotechnol. 2012, 28, 2015–2027. [Google Scholar] [CrossRef]
- Imperi, F.; Caneva, G.; Cancellieri, L.; Ricci, M.A.; Sodo, A.; Visca, P. The bacterial aetiology of rosy discoloration of ancient wall paintings. Environ. Microbiol. 2007, 9, 2894–2902. [Google Scholar] [CrossRef] [PubMed]
- Warscheid, T.; Braams, J. Biodeterioration of stone: A review. Int. Biodeterior. Biodegrad. 2000, 46, 343–368. [Google Scholar] [CrossRef]
- Liu, Z.; Yin, H.; Ma, S.; Wei, B.; Jensen, B.; Cao, G. Effect of environmental parameters on culturability and viability of dust accumulated fungi in different HVAC segments. Sustain. Cities Soc. 2019, 48, 101538. [Google Scholar] [CrossRef]
- Abbasi, F.; Samaei, M.R.; Manoochehri, Z.; Jalili, M.; Yazdani, E. The effect of incubation temperature and growth media on index microbial fungi of indoor air in a hospital building in Shiraz, Iran. J. Build. Eng. 2020, 31, 101294. [Google Scholar] [CrossRef]
- Ortega-Morales, O.; Montero-Muñoz, J.L.; Neto, J.A.B.; Beech, I.B.; Sunner, J.; Gaylarde, C. Deterioration and microbial colonization of cultural heritage stone buildings in polluted and unpolluted tropical and subtropical climates: A meta-analysis. Int. Biodeterior. Biodegrad. 2019, 143, 104734. [Google Scholar] [CrossRef]
- Vasanthakumar, A.; DeAraujo, A.; Mazurek, J.; Schilling, M.; Mitchell, R. Microbiological survey for analysis of the brown spots on the walls of the tomb of King Tutankhamun. Int. Biodeterior. Biodegrad. 2013, 79, 56–63. [Google Scholar] [CrossRef]
- Kiyuna, T.; An, K.D.; Kigawa, R.; Sano, C.; Miura, S.; Sugiyama, J. Molecular assessment of fungi in “black spots” that deface murals in the Takamatsuzuka and Kitora Tumuli in Japan: Acremonium sect. Gliomastix including Acremonium tumulicola sp. nov. and Acremonium felinum comb. nov. Mycoscience 2011, 52, 1–17. [Google Scholar] [CrossRef]
- Lv, Y.; Zhou, Y.; Chen, X.; Zhao, T.; Liu, T.; He, X.; Liu, J.; Ye, X. Study on indoor and outdoor permeability coefficients and bacterial components, sources of fine particles in severe cold region of China. Sustain. Cities Soc. 2020, 55, 102020. [Google Scholar] [CrossRef]
- Wu, D.; Zhang, Y.; Li, A.; Kong, Q.; Li, Y.; Geng, S.; Dong, X.; Liu, Y.; Chen, P. Indoor airborne fungal levels in selected comprehensive compartments of the urban utility tunnel in Nanjing, Southeast China. Sustain. Cities Soc. 2019, 51, 101723. [Google Scholar] [CrossRef]
- Ma, W.; Wu, F.; Tian, T.; He, D.; Zhang, Q.; Gu, J.-D.; Duan, Y.; Ma, D.; Wang, W.; Feng, H. Fungal diversity and its contribution to the biodeterioration of mural paintings in two 1700-year-old tombs of China. Int. Biodeterior. Biodegrad. 2020, 152, 104972. [Google Scholar] [CrossRef]
- Wang, W.; Ma, X.; Ma, Y.; Mao, L.; Wu, F.; Ma, X.; An, L.; Feng, H. Seasonal dynamics of airborne fungi in different caves of the Mogao Grottoes, Dunhuang, China. Int. Biodeterior. Biodegrad. 2010, 64, 461–466. [Google Scholar] [CrossRef]
- Bastian, F.; Jurado, V.; Novakova, A.; Alabouvette, C.; Saiz-Jimenez, C. The microbiology of Lascaux Cave. Microbiology 2010, 156, 644–652. [Google Scholar] [CrossRef] [Green Version]
- Corzo, M.A.; Afshar, M. Art and Eternity: The Nefertari Wall Paintings Conservation Project, 1986–1992; Getty Conservation Institute: Santa Monica, CA, USA; Egyptian Antiquities Organization: Cairo, Egypt, 1993; pp. 3–18. [Google Scholar]
- Demas, M.; Agnew, N. Valley of the Queens Assessment Report: A Collaborative Project of the Getty Conservation Institute and the Supreme Council of Antiquities, Egypt. Vol. 1, Conservation and Management Planning; Getty Conservation Institute: Los Angeles, CA, USA, 2012; pp. 163–227. [Google Scholar]
- Chang, L.; Tu, S.; Ye, W.; Zhang, X. Dynamic simulation of contaminant inleakage produced by human walking into control room. Int. J. Heat Mass Transf. 2017, 113, 1179–1188. [Google Scholar] [CrossRef]
- Ljungqvist, B.; Flynn, M.R. A review of wake effects on worker exposure. Ann. Occup. Hyg. 1995, 39, 211–221. [Google Scholar]
- Brohus, H.; Balling, K.D.; Jeppesen, D. Influence of movements on contaminant transport in an operating room. Indoor Air 2006, 16, 356–372. [Google Scholar] [CrossRef]
- Saidi, M.; Sajadi, B.; Molaeimanesh, G. The effect of source motion on contaminant distribution in the cleanrooms. Energy Build. 2011, 43, 966–970. [Google Scholar] [CrossRef]
- Ge, Q.; Li, X.; Inthavong, K.; Tu, J. Numerical study of the effects of human body heat on particle transport and inhalation in indoor environment. Build. Environ. 2013, 59, 1–9. [Google Scholar] [CrossRef]
- Tao, Y.; Inthavong, K.; Tu, J. A numerical investigation of wind environment around a walking human body. J. Wind. Eng. Ind. Aerodyn. 2017, 168, 9–19. [Google Scholar] [CrossRef]
- Pei, G.; Taylor, M.; Rim, D. Human exposure to respiratory aerosols in a ventilated room: Effects of ventilation condition, emission mode, and social distancing. Sustain. Cities Soc. 2021, 73, 103090. [Google Scholar] [CrossRef]
- Tao, Y.; Inthavong, K.; Tu, J. Computational fluid dynamics study of human-induced wake and particle dispersion in indoor environment. Indoor Built Environ. 2016, 26, 185–198. [Google Scholar] [CrossRef]
- Wang, J.; Chow, T.-T. Numerical investigation of influence of human walking on dispersion and deposition of expiratory droplets in airborne infection isolation room. Build. Environ. 2011, 46, 1993–2002. [Google Scholar] [CrossRef]
- Wu, Y.; Gao, N. The dynamics of the body motion induced wake flow and its effects on the contaminant dispersion. Build. Environ. 2014, 82, 63–74. [Google Scholar] [CrossRef]
- Holmér, I.; Nilsson, H. Heated manikins as a tool for evaluating clothing. Ann. Occup. Hyg. 1995, 39, 809–818. [Google Scholar] [CrossRef]
- Sadrizadeh, S.; Tammelin, A.; Ekolind, P.; Holmberg, S. Influence of staff number and internal constellation on surgical site infection in an operating room. Particuology 2014, 13, 42–51. [Google Scholar] [CrossRef]
- Choi, J.-I.; Edwards, J.R.; Choi, J.-I.; Edwards, J.R. Large-eddy simulation of human-induced contaminant transport in room compartments. Indoor Air 2011, 22, 77–87. [Google Scholar] [CrossRef] [PubMed]
- Gao, F.; Wang, H.; Wang, H. Comparison of different turbulence models in simulating unsteady flow. Procedia Eng. 2017, 205, 3970–3977. [Google Scholar] [CrossRef]
- Romano, F.; Marocco, L.; Gustén, J.; Joppolo, C.M. Numerical and experimental analysis of airborne particles control in an operating theater. Build. Environ. 2015, 89, 369–379. [Google Scholar] [CrossRef]
- Zhao, B.; Zhang, Y.; Li, X.; Yang, X.; Huang, D. Comparison of indoor aerosol particle concentration and deposition in different ventilated rooms by numerical method. Build. Environ. 2004, 39, 1–8. [Google Scholar] [CrossRef]
- Liu, Z.; Liu, H.; Rong, R.; Cao, G. Effect of a circulating nurse walking on airflow and bacteria-carrying particles in the operating room: An experimental and numerical study. Build. Environ. 2020, 186, 107315. [Google Scholar] [CrossRef]
- Poussou, S.B.; Mazumdar, S.; Plesniak, M.; Sojka, P.E.; Chen, Q. Flow and contaminant transport in an airliner cabin induced by a moving body: Model experiments and CFD predictions. Atmos. Environ. 2010, 44, 2830–2839. [Google Scholar] [CrossRef]
- Liu, X.; Lv, X.; Peng, Z.; Shi, C. Experimental study of airflow and pollutant dispersion in cross-ventilated multi-room buildings: Effects of source location and ventilation path. Sustain. Cities Soc. 2020, 52, 101822. [Google Scholar] [CrossRef]
- Marco, A.; Santos, S.; Caetano, J.; Pintado, M.; Vieira, E.; Moreira, P.R. Basil essential oil as an alternative to commercial biocides against fungi associated with black stains in mural painting. Build. Environ. 2020, 167, 106459. [Google Scholar] [CrossRef]
- Cennamo, P.; Montuori, N.; Trojsi, G.; Fatigati, G.; Moretti, A. Biofilms in churches built in grottoes. Sci. Total. Environ. 2016, 543, 727–738. [Google Scholar] [CrossRef]


| Front Chamber (Fc) | Middle Chamber (Mc) | Rear Chamber (Rc) | The Corridor of Fc, Mc, Rc | Zone 1–8 (Z1–Z8) | The Corridor of Z1–Z8 | |
|---|---|---|---|---|---|---|
| Length (m) | 4.07 | 4.80 | 5.38 | 2.55 | 2.45 | 1.30 |
| Width (m) | 3.73 | 4.00 | 4.35 | 2.60 | 2.20 | 1.00 |
| Heigh (m) | 4.81 | 4.92 | 5.36 | 2.55 | 3.16 | 1.60 |
Publisher’s Note: MDPI stays neutral with regard to jurisdictional claims in published maps and institutional affiliations. |
© 2021 by the authors. Licensee MDPI, Basel, Switzerland. This article is an open access article distributed under the terms and conditions of the Creative Commons Attribution (CC BY) license (https://creativecommons.org/licenses/by/4.0/).
Share and Cite
Liu, Z.; Wu, M.; Cao, H.; Wang, Y.; Rong, R.; Zhu, H. Influence of the Visitor Walking on Airflow and the Bioaerosol Particles in Typical Open Tomb Chambers: An Experimental and Case Study. Buildings 2021, 11, 538. https://doi.org/10.3390/buildings11110538
Liu Z, Wu M, Cao H, Wang Y, Rong R, Zhu H. Influence of the Visitor Walking on Airflow and the Bioaerosol Particles in Typical Open Tomb Chambers: An Experimental and Case Study. Buildings. 2021; 11(11):538. https://doi.org/10.3390/buildings11110538
Chicago/Turabian StyleLiu, Zhijian, Minnan Wu, Hongwei Cao, Yongxin Wang, Rui Rong, and Hangyao Zhu. 2021. "Influence of the Visitor Walking on Airflow and the Bioaerosol Particles in Typical Open Tomb Chambers: An Experimental and Case Study" Buildings 11, no. 11: 538. https://doi.org/10.3390/buildings11110538